 Amelia A. Bain1*
 Jackie E. Kendrick1,2
 Anthony Lamur2
 Yan Lavallée2
 Eliza S. Calder1
 Joaquín A. Cortés3
 Gloria Patricia Cortés4
 Diego Gómez Martinez5
 Roberto A. Torres5
- 1School of Geosciences, University of Edinburgh, Grant Institute, Edinburgh, United Kingdom
- 2School of Environmental Sciences, Department of Earth, Ocean & Ecological Sciences, University of Liverpool, Liverpool, United Kingdom
- 3Department of Geography, Edge Hill University, Ormskirk, United Kingdom
- 4Observatorio Vulcanológico y Sismológico de Manizales, Servicio Geológico Colombiano, Manizales, Colombia
- 5Observatorio Vulcanológico y Sismológico de Pasto, Servicio Geológico Colombiano, Pasto, Colombia
Understanding the relationship between degassing, crystallization processes and eruption style is a central goal in volcanology, in particular how these processes modulate the magnitude and timing of cyclical Vulcanian explosions in intermediate magmas. To investigate the influence of variations in crystal micro-textures on magma rheology and eruption dynamics, we conducted high-temperature (940°C) uniaxial compression experiments at conditions simulating a shallow volcanic conduit setting on eight samples of high-crystallinity andesite with variable plagioclase microlite populations from the 2004 to 2010 Vulcanian explosions of Galeras volcano, Colombia. Experiments were conducted at different strain rates to measure the rate-dependence of apparent viscosities and assess the dominant deformation processes associated with shear. Variations in plagioclase micro-textures are associated with apparent viscosities spanning over one order of magnitude for a given strain rate. Samples with low numbers of large prismatic microlites behaved consistently with published rheological laws for crystalline dome samples, and displayed extensive micro-cracking. Samples with high numbers of small tabular microlites showed a lower apparent viscosity and were less shear-thinning. The data suggest a spectrum of rheological behavior controlled by concurrent variations in microlite number, size and shape. We use previously published micro-textural data for time-constrained samples to model the apparent viscosity of magma erupted during the 2004–2010 sequence of Vulcanian explosions and compare these results with observed SO2 fluxes. We propose that variations in magma decompression rate, which are known to produce systematic textural differences in the plagioclase microlite cargo, govern differences in magma rheology in the shallow conduit. These rheological differences are likely to affect the rate at which magma densifies as a result of outgassing, leading to magmatic plugs with a range of porosities and permeabilities. The existence of magmatic plugs with variable physical properties has important implications for the development of critical overpressure driving Vulcanian explosions, and thus for hazard assessment during volcanic crises. We suggest a new conceptual model to explain eruption style at andesitic volcanoes based on micro-textural and rheological differences between “plug-forming” and “dome-forming” magma. We advance that existing rheological laws describing the behavior of andesitic magma based on experiments on dome rocks are inappropriate for modeling large Vulcanian explosions (
Introduction
Hazardous sequences of Vulcanian explosions are a common feature during periods of activity at arc volcanoes. These explosions are commonly associated with the development of overpressure beneath or within low-permeability, high-crystallinity magmatic plugs in the upper conduit (e.g., Sparks, 1997; Stix et al., 1997; Voight, 1999; Mueller et al., 2005; Clarke et al., 2007; Wright et al., 2007; Mueller et al., 2011a; Lavallée et al., 2015). Plugs most commonly develop in intermediate magmas (andesites and dacites) and are thought to result from decompression-induced degassing and crystallization during magma ascent from a shallow crustal reservoir (e.g., Hammer et al., 1999; Cashman and Blundy, 2000; Hammer et al., 2000; Preece et al., 2016; Bain et al., 2019a), which produces a large increase in viscosity (Sparks, 1997; Lavallée et al., 2007; Clarke, 2013), inhibiting magma ascent and rendering it prone to rupture or fragment (Lavallée and Kendrick, 2020; and references therein). Concurrently, magma permeability is reduced by outgassing and densification during compactant shear (Lavallée et al., 2012; Ashwell and Kendrick et al., 2015) and fracture closure due to healing and tuffisite infills (e.g., Castro et al., 2012; Kolzenburg et al., 2012; Kendrick et al., 2016; Lamur et al., 2019), which leads to a large increase in strength (Spieler et al., 2004; Vasseur et al., 2013; Coats et al., 2018; Lamur et al., 2019). The degassing, crystallization and densification processes responsible for plug and overpressure development may be modulated by differences in magma composition, ascent rate and decompression path, petrological characteristics, rheological evolution, outgassing and shear history (e.g., Calder et al., 2015). This results in a spectrum of physico-chemical evolution pathways that promotes a variety of repose times between explosions, a range of ejected volumes and transitions from explosive activity to effusive dome-building behavior (e.g., Cassidy et al., 2018; Wallace et al., 2020).
However, the detailed mechanisms by which ascent, degassing, crystallization and densification processes may be modulated to govern this rich variety in eruptive style are complex, inter-linked, and remain incompletely understood. In intermediate magmas, crystal micro-textures of anhydrous phases such as plagioclase are known to track magma ascent processes and represent an important record of shallow sub-surface dynamics (e.g., Hammer et al., 1999; Cashman and Blundy, 2000; Hammer et al., 2000; Miwa et al., 2009; Wright et al., 2012; Preece et al., 2016; Cashman, 2020; Gaunt et al., 2020; Wallace et al., 2020). Decompression experiments have shown that the final plagioclase micro-textures are a combined result of the decompression rate, decompression path (e.g., single-step or multi-step ascent), final storage pressure, time spent at that pressure, and the composition of the exsolving volatile phase (Hammer and Rutherford, 2002; Couch et al., 2003; Brugger and Hammer, 2010a; Brugger and Hammer, 2010b; Riker et al., 2015; Cichy et al., 2017). In general, low decompression rates result in low degrees of effective undercooling (
The properties of the crystal cargo of a magmatic suspension, e.g., the crystal fraction (Caricchi et al., 2007; Ishibashi and Sato, 2007; Lavallée et al., 2007), crystal aspect ratio (Mueller et al., 2011b; Klein et al., 2017) and crystal size distribution (Klein et al., 2017; Klein et al., 2018), are also known to strongly affect its rheology, by impacting the flow field due to particle-melt and particle-particle interactions. The attributes of the crystal cargo control the maximum packing fraction of the magmatic suspension (
In this work, we investigate the effect of varying crystal micro-textures on magma rheology by conducting a series of high-temperature (940°C) deformation tests on eight bomb samples ejected during Vulcanian explosions from Galeras volcano during the 2004–2010 period of activity. Experimental conditions were chosen to replicate a shallow volcanic conduit environment where intermediate magmas commonly stall, form plugs or feed dome-building eruptions. Prior to the experiments, these samples were texturally characterized to quantitatively assess the properties of plagioclase microlites, as the dominant groundmass phase. The connected porosity and permeability of the samples were measured before and after deformation to monitor the micro-structural changes that took place during the experiments. Phenocryst proportions were estimated, groundmass glass compositions were analyzed, and the viscosity of the melt phase was calculated in order to isolate the contribution of microlites to the experimentally-determined apparent magma viscosity. The experimental results were then used to calibrate an empirical viscosity model to estimate the high-temperature, strain rate-dependent viscosity of Galeras magma over the 2004–2010 eruptive period. We then compare the rheology of the Galeras magma in different phases of the eruptive period with the observed SO2 fluxes and attempt to reconcile our multiparametric dataset into a conceptual model linking evolving eruption dynamics (i.e. changes in the volume of erupted material, the repose time prior to explosions and the presence or absence of a dome) with evolving magma rheology, modulated by changing crystal micro-textures due to magma decompression rate variations. This model sheds light on the transition from effusive dome-building behavior accompanied by occasional, small Vulcanian blasts to frequent, large Vulcanian explosions at Galeras volcano, and may have important implications for hazards and micro-textural monitoring during periods of high and low magma decompression rate at Galeras and other similar arc volcanoes.
Materials and Methods
Sample Selection
The 2004–2010 period of activity at Galeras volcano (Figure 1) comprised 17 Vulcanian explosions (VEI 2–3) and two periods of dome-building activity (in 2006 and 2008), interspersed with numerous ash and gas venting events (up to VEI 1; Vargas and Torres, 2015; Narváez Medina et al., 2017). Based on observations by the Colombian Geological Survey (Servicio Geológico Colombiano – SGC), explosions were Vulcanian in character and short-lived (typically lasting several minutes) with plume heights reaching up to 12 km following the most powerful explosions. The minimum volume of material ejected during each Vulcanian explosion, calculated from isopach maps established by the SGC, ranged from 3.5 × 10⁴ to 3.56 × 10⁶ m3 and the repose time between explosions ranged between 1 and 554 days (Vargas and Torres, 2015). The minimum total volume of material produced during this period was 21 × 106 m3, with 16 × 106 m3 ejected during Vulcanian explosions and 5 × 10⁶ m3 erupted in the form of domes. Dome growth was first observed on January 13, 2006 (Figure 1D). Subsequent explosions partially destroyed this dome and renewed dome growth was noted on September 18, 2008. No pyroclastic flows or associated deposits were observed during this period. Eruptive products were limited to fallout deposits and ballistics.
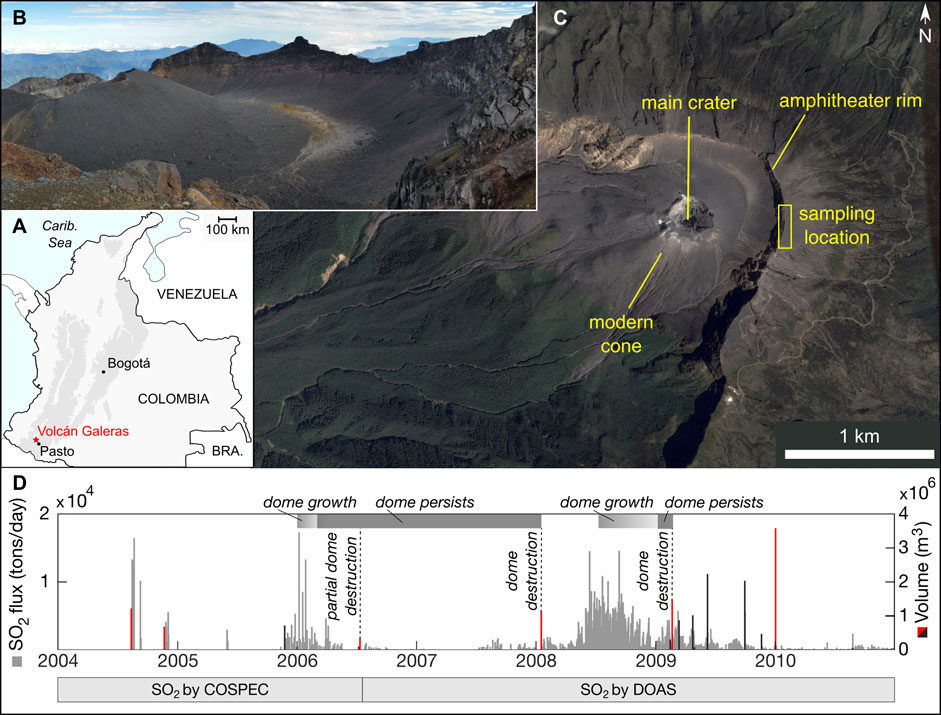
FIGURE 1. (A) Location of Galeras volcano in southern Colombia. (B) View of the modern Galeras cone (photo taken from the sampling site indicated in panel C), formed by volcanic activity over the last 4,500 years, within the horseshoe-shaped amphitheater created by older caldera- and sector-collapse events (Calvache et al., 1997). (C) Satellite view of the Galeras crater area showing the modern cone, the older amphitheater and the sampling site for this study. Image from Google Earth (Image © 2017 DigitalGlobe, CNES/Airbus, Landsat/Copernicus). (D) SO2 flux time series (gray bars), as measured by the Colombian Geological Survey (SGC), initially using a COSPEC then a DOAS instrument from July 27, 2006. Also shown are the minimum volumes of material ejected by Vulcanian explosions that occurred during the 2004–2010 activity (black and red bars) estimated by the SGC (Narváez Medina et al., 2017). Red bars correspond to explosions for which time-constrained samples were collected by the SGC. Periods of dome growth, dome presence in the crater (with no continued growth) and explosions that partially or fully destroyed the domes are also indicated, based on SGC observations.
We selected eight samples of high-crystallinity andesite bombs (Figure 2A) from the study of Bain et al. (2019b), which represent juvenile blocks produced by the 2004–2010 Vulcanian explosions, collected in July 2017 with the support of the SGC. Following the explosions in 2004–2010, SGC personnel marked juvenile pyroclasts in the field using spray paint, which allowed us to identify these samples during our 2017 fieldwork. The samples were collected from the amphitheater rim, at a distance of
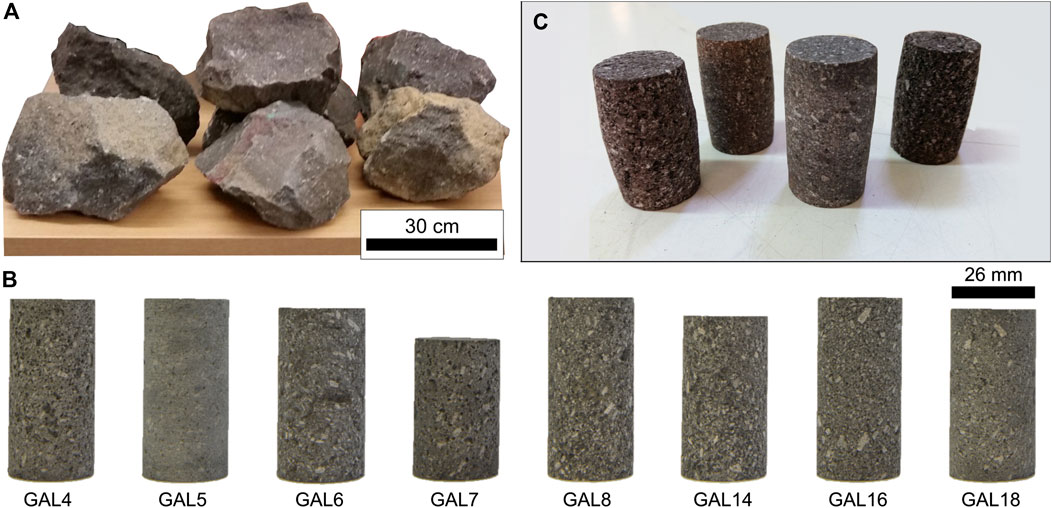
FIGURE 2. Galeras sample selection. (A) Examples of dense and scoriaceous andesitic bombs collected from Galeras volcano for this study. (B) 26 mm-diameter cores prepared from these bombs. (C) Slight barreling of core samples following high-temperature experiments.
High-Temperature Rheology Experiments
Parallel-plate rheometry was employed to measure the viscosity, and its strain rate dependence, of the selected samples. Cylinders 26 ± 0.22 mm in diameter were prepared from each sample (Figure 2B), with lengths varying between 40.66 and 53.76 mm. The ends of the cylinders were ground parallel, and cores were then cleaned in an ultrasonic bath and oven-dried. Cores were deformed at high temperature in a 100 kN Instron 8862 uniaxial press in the Volcanology and Geothermal Research Laboratory at the University of Liverpool, following the instrument protocol described in Hess et al. (2007). In each experiment, a sample was heated to
where
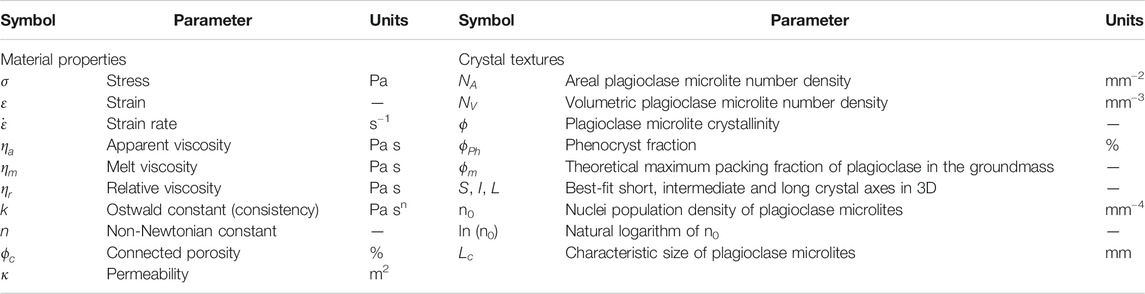
TABLE 1. Selected list of parameters referred to in the text with corresponding symbols and units.
Porosity and Permeability Measurements
The connected porosity and permeability of each core were measured before and after the high-temperature experiments. The connected porosity was measured by gas displacement pycnometry at the University of Liverpool (initial measurements were published in Bain et al., 2019b), using an AccuPyc II 1340 helium pycnometer developed by Micromeritics. In this method, a core is sealed inside a chamber of known volume (100 cm3). The instrument calculates the skeletal volume of the sample (i.e. the volume of rock plus isolated pores) by comparing the volume of gas injected to bring the chamber to a pressure of 21 psi, to the volume of the chamber calibrated at the same gas pressure. The skeletal volume returned by this method is accurate to 0.1%. The volume of pores connected to the outside of the core and allowing helium infiltration (the connected porosity,
Steady-state permeability (κ, in m2) at effective pressures ranging from 1.91 to 2.39 MPa (confining pressure ∼6 MPa; Supplementary Material A) was measured at the University of Liverpool using a steady-state hydrostatic cell developed by Sanchez Technologies. In this setup, the confining pressure is applied using silicon oil around a Vitton jacket containing the sample assembly, while water is pumped through the sample using two servo-controlled pore pressure pumps. Darcian conditions (i.e., a laminar flow through the sample) were ensured by imposing a pressure differential (
Glass Composition and Melt Viscosity Estimation
Polished thin sections of each sample were prepared and groundmass glass major element compositions were measured by Electron Probe MicroAnalysis (EPMA) at the University of Edinburgh, using a Cameca SX-100 electron microprobe. Analyses were performed using an accelerating voltage of 15 kV, a beam current of 1 nA and a defocused beam of 5 μm diameter. Alkalis were measured first to avoid their loss by migration. A natural rhyolitic glass from Lipari was used for initial calibration and was analyzed on a daily basis to monitor precision and accuracy during the analyses. Totals outside the range 99–101% were discarded from the dataset. Eight analyses fitting this criterion were collected for each sample. The viscosity of the melt phase at the experimental temperature (940°C) was estimated using the results of each chemical analysis as input parameters in the viscosity calculator of Giordano et al. (2008); here, 0.36 wt% H2O was used as the water concentration for the groundmass glass of “dense” and “scoriaceous” bombs, which corresponds to the maximum constrained for these eruptive products from the 2004 to 2010 period at Galeras volcano (as measured through secondary ion mass spectrometry by Bain et al., 2019a), and the concentration of fluorine was simplified to be zero for all samples. The obtained melt viscosity values were then averaged for each sample. Using the melt viscosity (
Textural Analysis of Plagioclase Microlites
High magnification (
Microlite areal number densities (
Phenocryst Image Analysis
The areal percentage of phenocrysts (
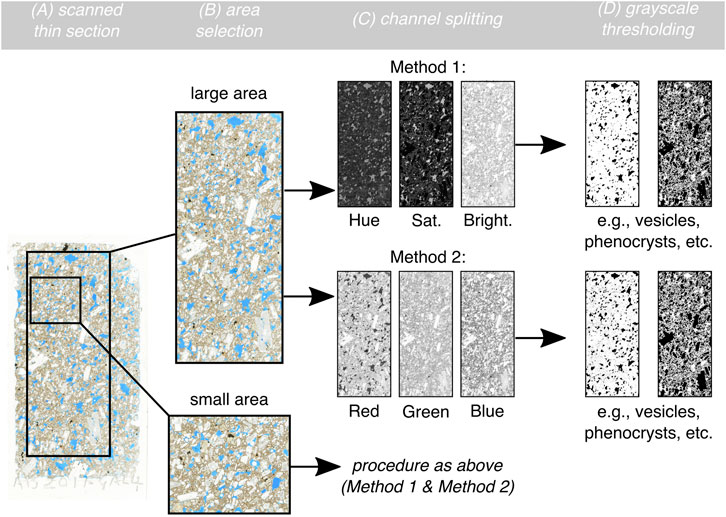
FIGURE 3. Methodology used for the quantification of the areal percentage of phenocrysts (
Methods 1 and 2 yielded differences in
SO2 Fluxes
Galeras volcano has been continuously monitored by the SGC since 1988 (Narváez Medina et al., 2017). The SGC provided SO2 flux data covering the Aug. 2004–Jan. 2010 period of activity (Figure 1D), which included 17 Vulcanian explosions and two episodes of lava dome effusion (Narváez Medina et al., 2017; Vargas and Torres, 2015). As the catalog of data is incomplete prior to the first explosion (11–12 Aug. 2004), and as a repose time (defined as the time between a Vulcanian explosion and the previous one) for this explosion is difficult to define, the time period prior to that date was discounted from this analysis. The remaining SO2 time series (Supplementary Material D) was used to obtain a first-order estimate of the magnitude of the gas flux from the shallow conduit during the repose period prior to each explosion. The SGC used a COSPEC (Correlation Spectrometer) during traverses beneath the wind-blown gas plumes to estimate SO2 fluxes until July 27, 2006. Thereafter, SO2 fluxes were measured using a DOAS (Differential Optical Absorption Spectrometry) instrument (Figure 1D), typically by scanning the plume from a single vantage point, but traverses were also occasionally undertaken. Where several flux measurements existed in the time series for a single day, the measurements for that day were averaged. The mean of the ten largest daily fluxes over the repose period prior to a Vulcanian explosion was then taken as a first-order proxy for the magnitude of the SO2 flux during that time (Supplementary Material D). It should be noted that the scanning DOAS instrument is installed to the west of the main crater and measurements are dependent on environmental conditions such as the presence of daylight, cloud cover, wind direction and wind speed, therefore some SO2 fluxes may not be recorded by the instrument as a result of these limitations. In addition, during 2004–2006, prior to the implementation of the DOAS instrument, SO2 flux measurements were not recorded every day (Figure 1D), therefore the average SO2 flux results for 2004–2006 reflect a lower temporal resolution than for 2007–2010.
Results
High-Temperature Rheometry Tests
The mechanical data from the rheometry tests show that each sample responded in a similar fashion to deformation (Figure 4A). Upon the application of the first constant strain rate (
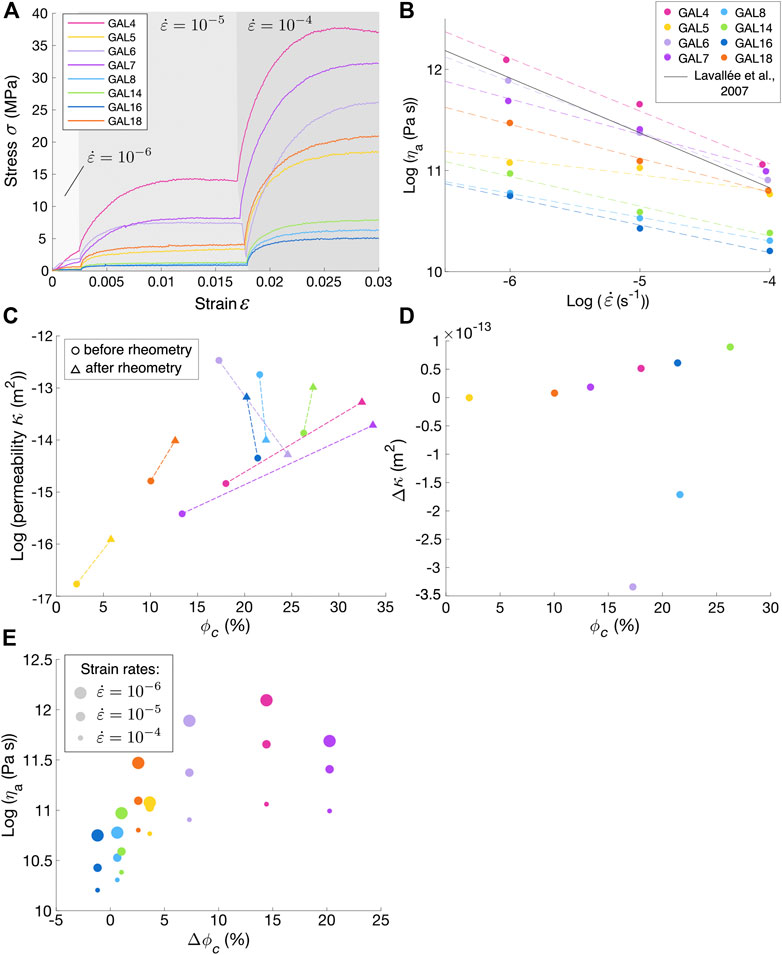
FIGURE 4. Results of the material properties tests on Galeras samples. (A) Stress-strain curves calculated from the high-temperature rheometry tests. Each sharp inflection corresponds to the application of a higher strain rate (
Porosity, Permeability and Volume Changes
Prior to deformation, the samples showed a wide range of permeabilities (
Plagioclase Micro-Textures
The samples exhibit a range of micro-textural parameters in 2D (
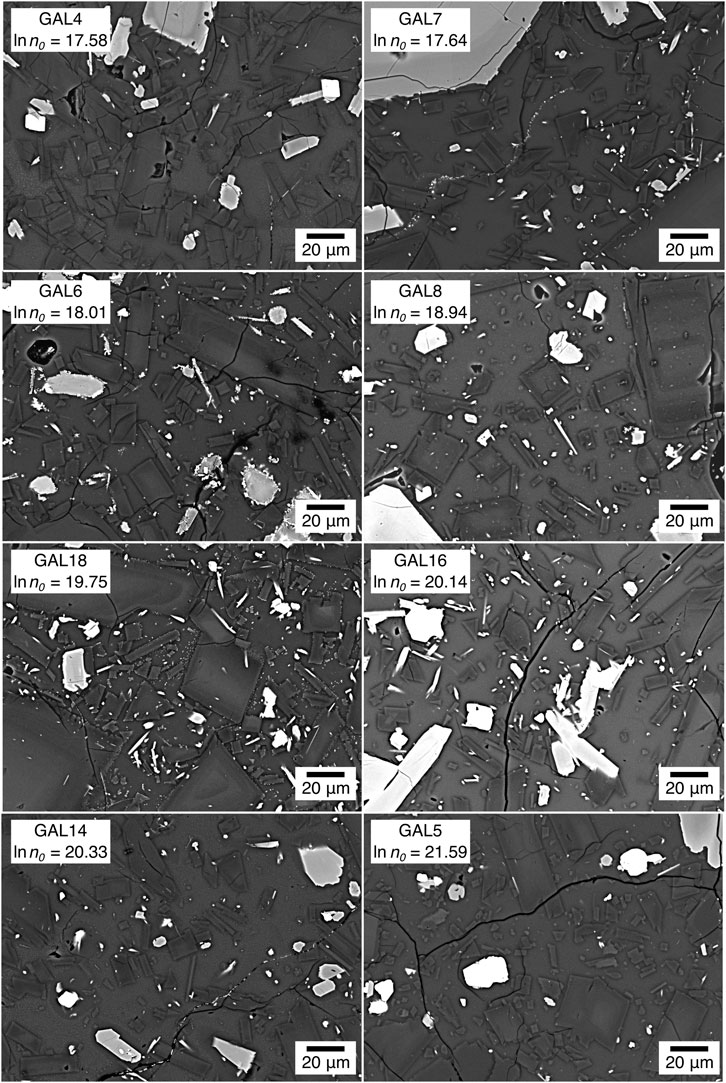
FIGURE 5. Representative high magnification (
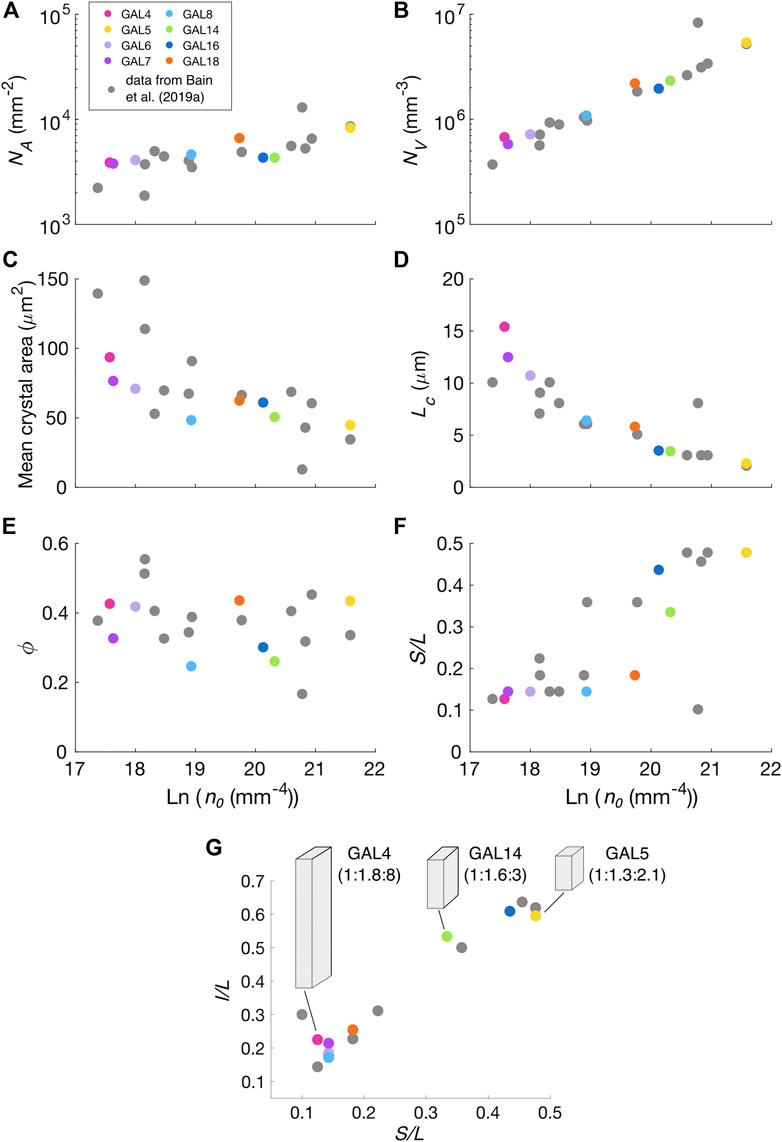
FIGURE 6. Plagioclase microlite textural results; previously published results for similar samples from the study of Bain et al. (2019a) are shown in gray. (A). Microlite areal number density (
Comparison Between Plagioclase Micro-textures and Viscosity
A comparison of the micro-textural results with the measured apparent viscosities shows that the data display some scatter (Figure 7), as expected from natural samples with complex viscosity dependencies. However, samples characterized by higher
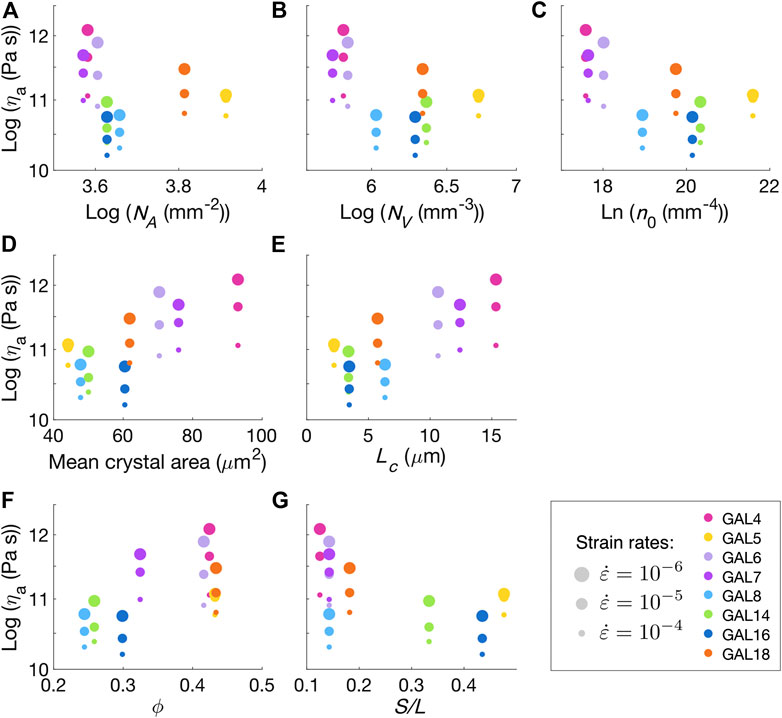
FIGURE 7. Apparent viscosity (
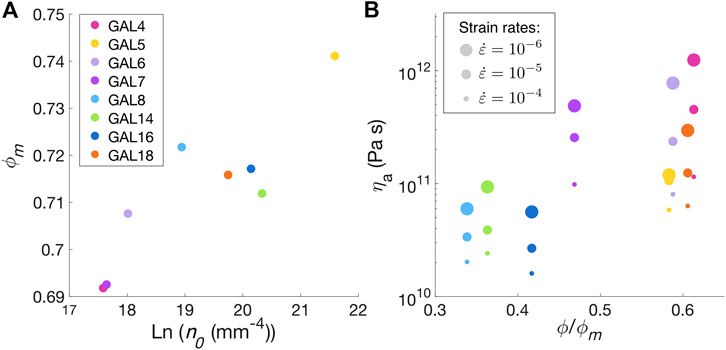
FIGURE 8. Relationship between the samples’ crystal micro-textures, their measured apparent viscosity, and the groundmass maximum packing fraction. (A) Maximum packing fraction of the groundmass (
Relationships Between Phenocrysts, Melt Viscosity, Porosity and Apparent Viscosity
The samples range in phenocryst content from 44% to 61%, and the data do not show a clear correlation between the phenocryst content and the apparent viscosity measured at a given strain rate (Figure 9A). All groundmass glasses are rhyolitic in composition, with 73.8–78.5 wt% SiO2 and NBO/T (non-bridging oxygen to tetrahedra ratio; calculated using the method described in Mysen and Richet, 2019) in the range 0.01–0.06 (analytical results and melt viscosity calculations are provided in Supplementary Material F). The apparent and relative viscosities,
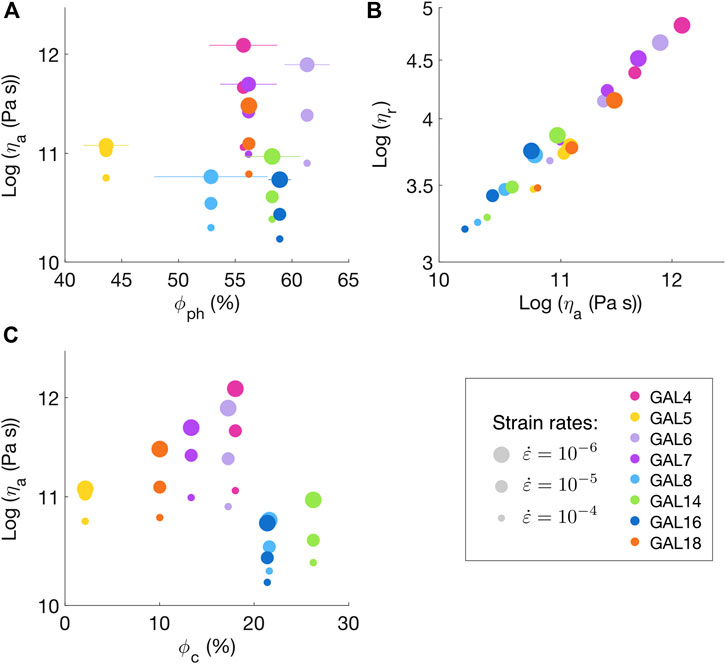
FIGURE 9. Effect of the phenocryst fraction, melt viscosity and initial porosity on the apparent viscosity. Apparent viscosity (
Comparing the initial connected porosity of the samples with the measured apparent viscosity (Figure 9C) indicates two groups of samples with similar trends. Samples with low connected porosities (
Viscosity Model Analysis
The relationship between stress (
where
and
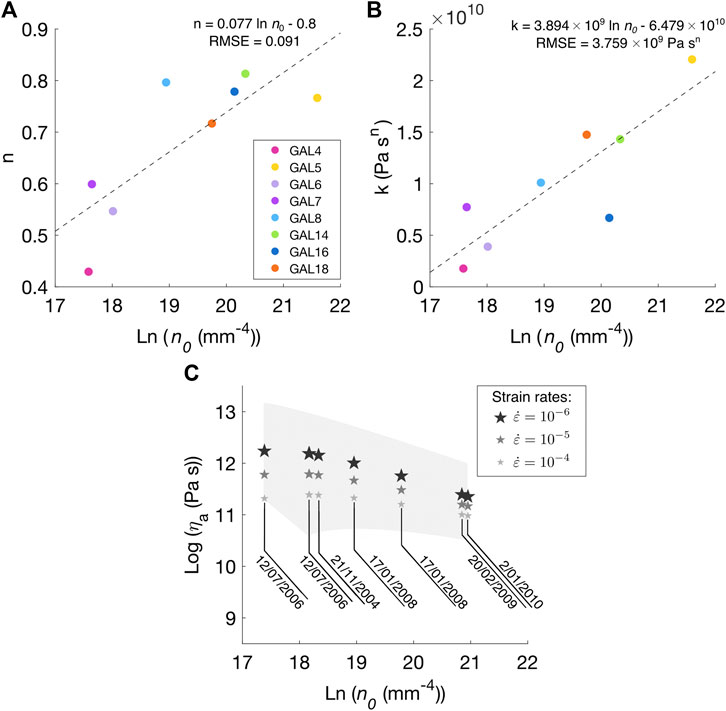
FIGURE 10. Viscosity modeling of time-constrained samples from 2004–2010 based on the micro-textural and rheological properties of the samples tested in this study. (A,B) Non-Newtonian (
The obtained relationship between
To model viscosity for samples from the 2004 to 2010 explosions with known eruption dates, we used
We also compared
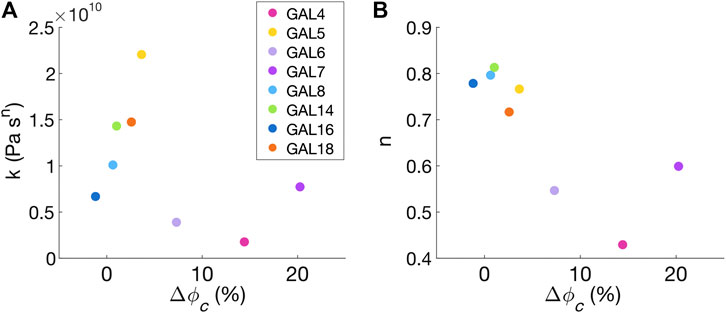
FIGURE 11. Comparison of the samples’ rheological parameters with physical changes due to deformation. (A) The Ostwald (
Comparison of Modeled Apparent Viscosities With Monitoring Data
As the rheological properties of magma control the evolution of densification and, thus, permeability in the upper conduit, we now compare the monitored changes in explosion characteristics, lava dome growth and gas emissions in 2004–2010 with the apparent viscosities modeled in the previous section. We choose to compare gas emissions rather than permeability with viscosity, as permeability is highly variable, scale dependent, and importantly, transient in nature; yet, sustained gas emissions are congruent with a magma that retains permeability and does not rapidly yield to external compressive stresses, which is dictated by viscosity (cf. Ashwell and Kendrick et al., 2015). In 2004–2006, relatively small-volume explosions (0.08–1.2
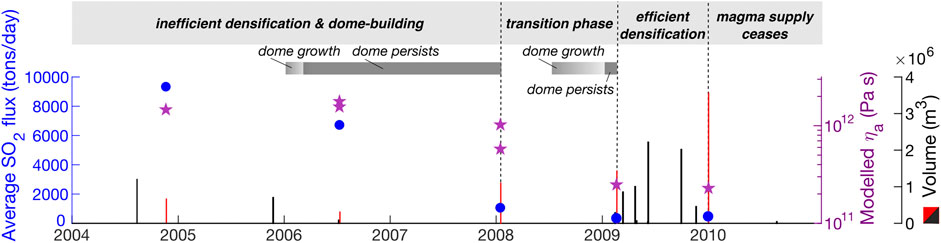
FIGURE 12. Eruption regimes based on the relationship between the modeled magma viscosity, the SO2 fluxes in the repose periods prior to Vulcanian eruptions, and the volume of erupted material during the 2004–2010 eruptive period at Galeras volcano. The timeline shows the volume of material ejected during Vulcanian explosions (bars; red corresponds to explosions with magma viscosity estimations), the average SO2 flux (blue circles) calculated over the repose period prior to each explosion with available time-constrained samples, and the modeled apparent viscosity from Figure 10C (
As mentioned in SO2Fluxes, the SO2 flux monitoring data from 2004 to 2006 reflect a lower temporal resolution than for 2007–2010. However, we judge that this difference does not impact our conclusions regarding outgassing patterns over time from the Galeras conduit for the following reasons. 1) Despite the difference in resolution, very large fluxes up to 18,622 tons/day were recorded in 2004–2006, whereas the largest flux recorded in 2009 was 9,300 tons/day, with most measurements recording much lower fluxes (Figure 1D). The conduit was therefore clearly more open for degassing in 2004–2006 compared to 2009. 2) Here we use the average of the ten largest SO2 fluxes in the repose period prior to a Vulcanian explosion as a first-order measure of the maximum extent to which the conduit was open to gas flux. In reality permeability in the conduit is transient and cycles of decreasing SO2 flux prior to an explosion, followed by high flux immediately following an explosion, are well-documented at Galeras (e.g., Fischer et al., 1994; Cortés and Raigosa, 1997). Our chosen measure therefore captures only the average maximum flux during a given repose period, to provide an estimate of the maximal magma permeability prior to densification and plug-formation. We note that taking the single largest flux, or the mean of the largest five or ten flux measurements, does not change the observed pattern of high emissions in 2004–2006 and lower emissions in 2008–2009 (Supplementary Material D).
Discussion
We now summarize our interpretations and reconcile our multi-parametric dataset to propose a unifying model for the observed eruption dynamics at Galeras in 2004–2010.
Relationship Between Plagioclase Micro-Textural Characteristics and Rheology
The range of plagioclase micro-textural parameters in our sample set suggests crystallization over a range of effective undercooling,
The samples exhibited a range of apparent viscosities at a given strain rate, which correlate with the observed variations in micro-textural characteristics. Samples with micro-textures characteristic of crystallization under high degrees of
where
Material Evolution During High-Temperature Deformation
The samples can be divided into two rheological groups that responded differently to deformation. The group of samples with the highest apparent viscosities (GAL4, GAL6, GAL7) experienced the largest increases in connected porosity, i.e., through dilation, as a result of the imparted strain (Figure 4E). The group with lower viscosities showed only modest dilation (GAL5, GAL8, GAL14, GAL18), and in one instance, a small reduction in connected porosity, i.e., compaction (GAL16). Changes in permeability as a result of deformation appear to be related to the initial porosity, with more porous samples experiencing larger increases in permeability (Figure 4D). Samples GAL6 and GAL8 are outliers that displayed a significant permeability decrease despite recording a slight (GAL8) to moderate (GAL6) porosity increase following high-temperature deformation. As a through-going micro-fracture was identified in the high-resolution scan of the GAL8 thin section, we interpret these observations as the result of pre-existing micro-fractures that enhanced the original permeability of these samples by up to two orders of magnitude compared to samples with a similar connected porosity (Bain et al., 2019b). Such pre-existing micro-fractures are likely to have healed during the high-temperature deformation (e.g., Lamur et al., 2019), which could cause the observed decrease in permeability with little impact on porosity.
Our viscosity modeling also revealed that the samples that showed the greatest dilation (increases in
Rheology of the Magmatic Plugs at Galeras Volcano
The rheological constraints on plug- and dome-forming Galeras magma obtained in this study reveal viscosity variations over more than one order of magnitude at a given strain rate. However, there is no systematic control of the phenocryst fraction on the apparent viscosity in our dataset (Figure 9A). Viscosity differences imposed by compositional variations of the rhyolitic interstitial melt phase in these samples also cannot explain the observed viscosity span (Figure 9B). There is a possible weak relationship between the sample porosity and apparent viscosity (Figure 9C), suggesting that a higher initial porosity may slightly increase viscosity, possibly as a result of the creation of isolated porosity during porous network compaction. However, monitoring the changes in the connected porosity of the samples as a result of deformation reveals two rheological groups with the following characteristics: 1) GAL4, GAL6, GAL7 – high viscosity, highly shear-thinning, high dilation; 2) GAL5, GAL8, GAL14, GAL16, GAL18 – lower viscosity, less shear-thinning, lower dilation. These groups are also related to variations in the plagioclase micro-textures: 1) GAL4, GAL6, GAL7 – low
Our observations therefore allow the macroscopic rheological behavior of plug- and dome-forming magma to be linked with the micro-textural characteristics of the dominant groundmass phase produced by decompression-driven degassing. Bain et al. (2019a) found that dense and scoriaceous Galeras samples that crystallized under high
Influence of Magma Rheology on Eruption Dynamics in 2004–2010
Acquiring a number of large time-constrained samples for analyses and material properties testing is an enduring challenge in volcanology, which motivates studies cross-correlating relationships across broader suites of samples (cf. Harnett et al., 2019; Wallace et al., 2020), such as in the present study. In the case of Galeras volcano, a limited, highly valuable suite of time-constrained samples from the SGC collection was analyzed in previous studies (Bain et al., 2019a; Bain et al., 2019b), and here we used additional samples from the same period for this rheological investigation. By estimating the apparent viscosity of time-constrained samples (Figure 10C) based on existing micro-textural data (Bain et al., 2019a), variations in magma rheology in 2004–2010 can be linked with observations made by the SGC during the volcanic crisis.
The andesitic magma erupted at Galeras in 2004–2010 was degassed and highly crystalline (Bain et al., 2019a), consistent with extensive decompression-driven crystallization. When such magma stalls in a shallow volcanic conduit, gas bubbles are essentially immobilized in the crystal-rich slurry due to its high viscosity (Stix et al., 1997) and outgassing occurs through the creation of permeable pathways formed by connected bubbles and cracks (e.g., Westrich and Eichelberger, 1994; Edmonds et al., 2003). However, despite the overall very high viscosity of the magma erupted at Galeras in 2004–2010, our results indicate important second-order viscosity variations related to a spectrum of “low”- (
A Unifying Conceptual Model for Vulcanian Explosion Dynamics at Galeras
The multi-parametric findings presented in this study advocate for explicit relationships between magma decompression rate, its physical and thus rheological evolution, outgassing, eruption style and explosion recurrence rate. Based on a comparison of Galeras crystal micro-textures (
Magma plugs emplaced in the shallow conduit (<0.5 km) of Galeras following high average rates of decompression (
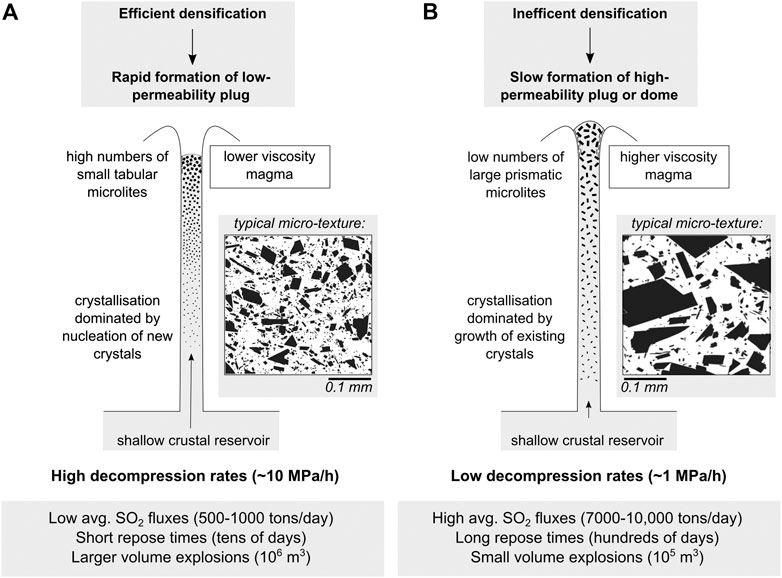
FIGURE 13. Summary diagrams showing the relationships between average magma decompression rate, petrological and rheological evolution, eruptive behavior and timescales. The sketch demonstrates how (A) “efficient densification” and (B) “inefficient densification” end-member rheological regimes are dictated by magma decompression rate and nucleation/crystallization kinetics (illustrated by the insets of plagioclase texture (in black)). This petrological evolution impacts magma rheology as (A) high crystal number densities (and other accompanying micro-textural attributes) favor comparatively lower viscosities, promoting densification and a low permeability that inhibits outgassing, causing explosions at an increasing recurrence rate. In contrast (B), slow decompression and ascent favor the crystallization of fewer larger crystals that promote magmas with high permeability and viscosity, conducive to protracted dome emplacement and extensive outgassing, which alleviate the periodicity of explosive events.
In contrast, magma plugs emplaced following low average rates of decompression (
Furthermore, the low strain rates associated with the inferred low ascent rates should promote a high apparent viscosity response in the magma characteristic of slowly-emplaced plugs (Figure 4B). As the rate-dependence of viscosity of these magmas is stronger (i.e., a lower n than for plugs formed by rapid decompression, indicating highly shear-thinning behavior), strain localization near conduit margins should be enhanced, increasing the likelihood of plug flow and a switch to effusive behavior promoting exogenous dome growth (e.g., Hale and Wadge, 2008). This may explain why rheological laws developed for high-crystallinity dome lavas (Lavallée et al., 2007) also appear well-suited to describing the behavior of magma plugs emplaced following low magma decompression rates. Magma deformation in these high strain zones is also more likely to undergo crystal interactions and brittle fracturing (Lavallée et al., 2007; Lavallée et al., 2008; Kendrick et al., 2017; Wallace et al., 2019), further enhancing outgassing and delaying the development of critical overpressure (e.g., Kendrick et al., 2013; Lavallée et al., 2013). The observed changes in connected porosity (Figures 11A,B) suggest that the most efficient outgassing conditions that might favor dome extrusion due to extensive micro-cracking occur when magma with a low nuclei population density (i.e.,
Periods of low average magma decompression rate are therefore likely to be associated with lava dome extrusion and small-volume Vulcanian explosions, if the permeability of the dome and magma in the shallow conduit is insufficient to regulate pore pressures developing in deeper magma. In this “dome-forming” regime, Vulcanian blasts are likely to affect a comparatively restricted area around the vent due to their small magnitude, however hazards associated with dome collapse should be anticipated, namely block-and-ash flows and explosions driven by sudden decompression of the conduit. We note that dome collapse has not historically occurred at Galeras due to the growth occurring within the restricted crater of the summit cone.
In nature, we expect a spectrum of behavior ranging between the defined end-member regimes to occur, such as in 2008 at Galeras, as a result of variations in magma decompression rates and styles. Our study does not address the causes of the variations in magma ascent rates, however these could result from buoyancy differences, perhaps as a result of tapping a magma reservoir that was stratified in terms of temperature or volatile content, or from variations in magma chamber overpressure over time (e.g., Melnik and Sparks, 1999). Such differences in temperature and volatile content would undoubtedly influence the magma rheology, (e.g., Giordano et al., 2008), especially as magma evolves physically (via crystallization, vesiculation and vesicle compaction) and chemically (via degassing, and crystallization) upon ascent under evolving P-T-strain conditions (impacted by ascent, shear heating, latent heat of crystallization and outgassing, etc.). Here, we do not attempt to resolve all of these processes but assess the rheological properties of magma emplaced in the shallow conduit. As we experimentally demonstrate, petrological variations drive differences in apparent viscosity of Galeras magmas of over an order of magnitude for a given strain rate. However, other processes could also impact this rheological behavior. Magma ascending at a slower rate would in principle undergo less viscous heating and have more time to lose heat to wall rocks, whereas magma ascending more rapidly may be expected to retain more heat when it reaches the shallow conduit. Slight temperature differences associated with these different ascent pathways may be expected to act as a positive feedback effect, with higher temperatures contributing to lower the viscosity of the “low”-viscosity, rapidly decompressed andesitic magma and lower temperatures contributing to increasing the viscosity of slowly decompressed magma. Furthermore, in terms of the dense magma plugs considered here, the groundmass glass of all samples from 2004 to 2010 is highly degassed (<0.36 wt% H2O; Sample Selection). However, Bain et al. (2019b) found evidence of a slightly greater extent of degassing (i.e., a lower H2O concentration of ∼0.1 wt%) in porous samples that were interpreted to have undergone more sluggish densification, as a result of pathways for degassing remaining open for longer. Conversely, dense samples having undergone extensive densification displayed a slightly higher H2O concentration in the groundmass glass (∼0.3 wt%) due to the rapid disruption of degassing pathways during efficient densification. This slight difference in melt volatile content should act to increase the magma viscosity in high-viscosity (slowly decompressed) plugs and decrease the magma viscosity in low-viscosity (rapidly decompressed) plugs. The positive feedbacks related to temperature and volatiles are therefore likely to compound the differences in eruptive style described above.
This conceptual model ties together observations from monitoring data and the physical, textural and rheological characteristics of erupted products at Galeras volcano, revealing a link between magma decompression rate, degassing and crystallization processes, magma rheology, plug densification, outgassing, overpressure development, explosion recurrence rate and eruption style. As such, the monitoring of crystal micro-textures in ash during and between explosions in volcanic systems where these relationships have been constrained could provide an additional line of evidence for interpreting volcanic behavior (e.g., Wright et al., 2012; Wallace et al., 2020), for eruption forecasting and for hazard mitigation during prolonged volcanic crises, when combined with geophysical (e.g., seismic and ground deformation data) and geochemical (e.g., SO2 flux data) monitoring. If crystal micro-textures in ash produced in gas-and-ash venting events at persistently active arc volcanoes (e.g., Wright et al., 2012; Hornby et al., 2018; Murch and Cole, 2019) could be monitored in near-real time (e.g., Gaunt et al., 2016), this could provide valuable information concerning magma ascent rates, rheology, permeability, fragmentation mechanisms and the range of hazards to be anticipated during eruptions.
Conclusion
Micro-textural, physical and rheological investigations of ballistic bomb samples from the 2004–2010 Vulcanian explosions of Galeras volcano suggest that high magma decompression rates promote efficient densification due to a comparatively low apparent viscosity arising from the micro-textural results of crystallization under high degrees of undercooling. In turn, efficient densification fosters the development of a dense, low-permeability magma plug impeding outgassing. This “plug-forming” regime promotes frequent, large explosions preceded by relatively low average SO2 fluxes. Conversely, low decompression rates lead to inefficient densification due to a higher apparent viscosity and stronger non-Newtonian behavior arising from crystallization under low degrees of undercooling. This “dome-forming” regime is characterized by high average SO2 fluxes and dome extrusion accompanied by small-volume explosions with long repose times. We suggest that this integrated textural-physical-rheological conceptual model should be rigorously tested against other datasets and time-constrained eruptive products at well-monitored volcanoes, as it may improve near real-time assessment of hazards during volcanic unrest, which commonly feature variable discharge, decompression and ascent rates. We advance that existing monitoring techniques ought to be routinely supplemented by systematic sample collection and detailed micro-textural analyses of juvenile ash particles to aid in the interpretation of volcanic behavior during protracted periods of unrest at andesitic arc volcanoes.
Data Availability Statement
The original contributions presented in the study are included in the article/Supplementary Material, further inquiries can be directed to the corresponding author.
Author Contributions
AB, EC, JC, and GC conceptualised the research project. EC, JC, and GC supervised the research. AB, JK, AL, and YL performed the physical and material properties tests. DM and RT provided monitoring data from Galeras volcano. AB performed the micro-textural analysis and wrote the article. All authors provided comments on the article.
Funding
This work was funded by a Natural Environment Research Council Doctoral Training Partnership grant (NE/L002558/1) to AB. YL and the Volcanology and Geothermal Research Laboratory at the University of Liverpool were supported by a starting grant of the European Research Council (ERC) on Strain Localization in Magma (SLiM; no. 306488). JK and YL have been further supported by an Early Career Fellowship and a Research Fellowship of the Leverhulme Trust, respectively (ECF-2016-325; RF-2019-526\4).
Conflict of Interest
The authors declare that the research was conducted in the absence of any commercial or financial relationships that could be construed as a potential conflict of interest.
Acknowledgments
AB thanks Viviana Burbano, Joao Lages, Bertilda Botina and Carlos Estrada for fieldwork assistance at Galeras. The authors thank Mike Hall, John Craven and Chris Hayward for technical assistance at the University of Edinburgh. We also thank the reviewers for their thoughtful comments that helped to improve this manuscript, as well as Fabio Arzilli and Valerio Acocella for editorial assistance. This paper is dedicated to Viviana Burbano, who is sadly missed.
Supplementary Material
The Supplementary Material for this article can be found online at: https://www.frontiersin.org/articles/10.3389/feart.2020.611320/full#supplementary-material.
References
Ashwell, P. A., Kendrick, J. E., Lavallée, Y., Kennedy, B. M., Hess, K. U., Von Aulock, F. W., et al. (2015). Permeability of compacting porous lavas. J. Geophys. Res. B Solid Earth. 120, 1605–1622. doi:10.1002/2014JB011519
Bain, A. A., Calder, E. S., Cortés, J. A., Cortés, G. P., and Loughlin, S. C. (2019a). Textural and geochemical constraints on andesitic plug emplacement prior to the 2004-2010 vulcanian explosions at Galeras volcano, Colombia. Bull. Volcanol. 81, 1. doi:10.1007/s00445-018-1260-y
Bain, A. A., Lamur, A., Kendrick, J. E., Lavallée, Y., Calder, E. S., Cortés, J. A., et al. (2019b). Constraints on the porosity, permeability and porous micro-structure of highly-crystalline andesitic magma during plug formation. J. Volcanol. Geoth. Res. 379, 72–89. doi:10.1016/j.jvolgeores.2019.05.001
Banks, N. G., Calvache, M. L, V., and Williams, S. N. (1997). 14C ages and activity for the past 50 ka at Volcán Galeras, Colombia. J. Volcanol. Geoth. Res. 77, 39–55. doi:10.1016/S0377-0273(96)00085-6
Blundy, J., and Cashman, K. (2008). Petrologic reconstruction of magmatic system variables and processes. Rev. Mineral. Geochem. 69, 179–239. doi:10.2138/rmg.2008.69.6
Brugger, C. R., and Hammer, J. E. (2010a). Crystal size distribution analysis of plagioclase in experimentally decompressed hydrous rhyodacite magma. Earth Planet Sci. Lett. 300, 246–254. doi:10.1016/j.epsl.2010.09.046
Brugger, C. R., and Hammer, J. E. (2010b). Crystallization kinetics in continuous decompression experiments: implications for interpreting natural magma ascent processes. J. Petrol. 51, 1941–1965. doi:10.1093/petrology/egq044
Calder, E. S., Lavallée, Y., Kendrick, J. E., and Bernstein, M. (2015). Lava dome eruptions. Encycl. Volcanoes. 343–362. doi:10.1016/B978-0-12-385938-9.00018-3
Calvache, M. L., Cortés, G. P., and Williams, S. N. (1997). Stratigraphy and chronology of the Galeras volcanic complex, Colombia. J. Volcanol. Geoth. Res. 77, 5–19. doi:10.1016/S0377-0273(96)00083-2
Caricchi, L., Burlini, L., Ulmer, P., Gerya, T., Vassalli, M., and Papale, P. (2007). Non-Newtonian rheology of crystal-bearing magmas and implications for magma ascent dynamics. Earth Planet Sci. Lett. 264, 402–419. doi:10.1016/j.epsl.2007.09.032
Cashman, K., and Blundy, J. (2000). Degassing and crystallization of ascending andesite and dacite. Philos. Trans. R. Soc. London A Math. Phys. Eng. Sci. 358, 1487–1513. doi:10.1098/rsta.2000.0600
Cashman, K. V. (2020). Crystal size distribution (CSD) analysis of volcanic samples: advances and challenges. Front. Earth Sci. 8, 1–17. doi:10.3389/feart.2020.00291
Cashman, K. V. (1988). Crystallization of Mount St. Helens 1980-1986 dacite: a quantitative textural approach. Bull. Volcanol. 50, 194–209. doi:10.1007/BF01079682
Cashman, K. V. (1992). Groundmass crystallization of Mount St. Helens dacite, 1980-1986: a tool for interpreting shallow magmatic processes. Contrib. Mineral. Petrol. 109, 431–449. doi:10.1007/BF00306547
Cassidy, M., Manga, M., Cashman, K., and Bachmann, O. (2018). Controls on explosive-effusive volcanic eruption styles. Nat. Commun. 9, 2839. doi:10.1038/s41467-018-05293-3
Castro, J. M., Cordonnier, B., Tuffen, H., Tobin, M. J., Puskar, L., Martin, M. C., et al. (2012). The role of melt-fracture degassing in defusing explosive rhyolite eruptions at volcan Chaitén. Earth Planet Sci. Lett. 333–334, 63–69. doi:10.1016/j.epsl.2012.04.024
Cichy, S. B., Botcharnikov, R. E., Fran, C., Holtz, O. I. S., and Behrens, H. (2017). Vesiculation and microlite crystallization induced by decompression : a case study of the 1991–1995 Mt unzen eruption (Japan). J. Petrol. 52, 1469–1492. doi:10.1093/petrology/egq072
Clarke, A. B., Stephens, S., Teasdale, R., Sparks, R. S. J., and Diller, K. (2007). Petrologic constraints on the decompression history of magma prior to Vulcanian explosions at the Soufrière Hills volcano, Montserrat. J. Volcanol. Geoth. Res. 161, 261–274. doi:10.1016/j.jvolgeores.2006.11.007
Clarke, A. B. (2013). “Unsteady explosive activity: vulcanian eruptions,” in Modeling volcanic processes: the physics and mathematics of volcanism. Editors S. A. Fagents, T. K. P. Gregg, and R. M. C. Lopes, (Cambridge, UK: Cambridge University Press).
Coats, R., Kendrick, J. E., Wallace, P. A., Miwa, T., Hornby, A. J., Ashworth, J. D., et al. (2018). Failure criteria for porous dome rocks and lavas: a study of Mt. Unzen, Japan. Solid Earth. 9, 1299–1328. doi:10.5194/se-9-1299-2018
Cortés, J. G. P., and Raigosa, A. J. (1997). A synthesis of the recent activity of Galeras volcano, Colombia: seven years of continuous surveillance, 1989–1995. J. Volcanol. Geoth. Res. 77, 101–114. doi:10.1016/S0377-0273(96)00089-3
Couch, S., Sparks, R. S. J., and Carroll, M. (2003). The kinetics of degassing-induced crystallization at Soufriere Hills Volcano, Montserrat. J. Petrol. 44 (8), 1477–1502. doi:10.1093/petrology/44.8.1477
Devine, J. D., Rutherford, M. J., and Gardner, J. E. (1998). Petrologic determination of ascent rates for the Soufriere Hills Volcano andesitic magma. 25, 3673–3676. doi:10.1029/98GL01330
Dingwell, D. B., and Webb, S. L. (1989). Structural relaxation in silicate melts and non-Newtonian melt rheology in geologic processes. Phys. Chem. Miner. 16, 508–516. doi:10.1007/BF00197020
Druitt, T. H., Young, S. R., Baptie, B., Bonadonna, C., Calder, E. S., Clarke, A. B., et al. (2002). Episodes of cyclic Vulcanian explosive activity with fountain collapse at Soufriere Hills Volcano, Montserrat. Geol. Soc. London, Mem. 21, 281–306. doi:10.1144/GSL.MEM.2002.021.01.13
Edmonds, M., Oppenheimer, C., Pyle, D. M., Herd, R. A., and Thompson, G. (2003). SO2 emissions from Soufrière Hills Volcano and their relationship to conduit permeability, hydrothermal interaction and degassing regime. J. Volcanol. Geoth. Res. 124, 23–43. doi:10.1016/S0377-0273(03)00041-6
Einstein, A. (1911). Berichtigung zu meiner Arbeit:„Eine neue Bestimmung der Moleküldimensionen”. Ann. Phys. 339, 591–592.
Fischer, T., Morrissey, M., and Calvache, V. (1994). Correlations between SO2 flux and long-period seismicity at Galeras volcano. Nature. 368. doi:10.1038/368135a0
Gaunt, H. E., Bernard, B., Hidalgo, S., Proaño, A., Wright, H., Mothes, P., et al. (2016). Juvenile magma recognition and eruptive dynamics inferred from the analysis of ash time series: the 2015 reawakening of Cotopaxi volcano. J. Volcanol. Geoth. Res. 328, 134–146. doi:10.1016/j.jvolgeores.2016.10.013
Gaunt, H. E., Burgisser, A., Mothes, P. A., Browning, J., Meredith, P. G., Criollo, E., et al. (2020). Triggering of the powerful 14 july 2013 vulcanian explosion at tungurahua volcano, Ecuador. J. Volcanol. Geoth. Res. 392, 106762. doi:10.1016/j.jvolgeores.2019.106762
Gent, A. N. (1960). Theory of the parallel plate viscometer. Br. J. Appl. Phys. 11, 85–87. doi:10.1088/0508-3443/11/2/310
Giordano, D., Russell, J. K., and Dingwell, D. B. (2008). Viscosity of magmatic liquids: a model. Earth Planet Sci. Lett. 271, 123–134. doi:10.1016/j.epsl.2008.03.038
Gruber, J. A. (2018). Accurate data reduction for the uniaxial compression test. Exp. Tech. 42, 209–221. doi:10.1007/s40799-017-0215-0
Hale, A. J., and Wadge, G. (2008). The transition from endogenous to exogenous growth of lava domes with the development of shear bands. J. Volcanol. Geoth. Res. 171, 237–257. doi:10.1016/j.jvolgeores.2007.12.016
Hammer, J. E., Cashman, K. V., Hoblitt, R. P., and Newman, S. (1999). Degassing and microlite crystallization during pre-climactic events of the 1991 eruption of Mt. Pinatubo, Philippines. Bull. Volcanol. 60, 355–380. doi:10.1007/s004450050238
Hammer, J. E., Cashman, K. V., and Voight, B. (2000). Magmatic processes revealed by textural and compositional trends in Merapi dome lavas. J. Volcanol. Geoth. Res. 100, 165–192. doi:10.1016/S0377-0273(00)00136-0
Hammer, J. E., and Rutherford, M. J. (2002). An experimental study of the kinetics of decompression-induced crystallization in silicic melt. J. Geophys. Res. 107, ECV 8-1–ECV 8-24. doi:10.1029/2001JB000281
Harnett, C. E., Kendrick, J. E., Lamur, A., Thomas, M. E., Stinton, A., Wallace, P. A., et al. (2019). Evolution of mechanical properties of lava dome rocks across the 1995–2010 eruption of soufrière hills volcano, Montserrat. Front. Earth Sci. 7, 1–18. doi:10.3389/feart.2019.00007
Heap, M. J., Troll, V. R., Kushnir, A. R. L., Gilg, H. A., Collinson, A. S. D., Deegan, F. M., et al. (2019). Hydrothermal alteration of andesitic lava domes can lead to explosive volcanic behaviour. Nat. Commun. 10, 5063–5110. doi:10.1038/s41467-019-13102-8
Hess, K. U., Cordonnier, B., Lavallée, Y., and Dingwell, D. B. (2007). High-load, high-temperature deformation apparatus for synthetic and natural silicate melts. Rev. Sci. Instrum. 78, 075102. doi:10.1063/1.2751398
Higgins, M. D. (2000). Measurement of crystal size distributions. Am. Mineral. 85, 1105–1116. doi:10.2138/am-2000-8-901
Holness, M. B. (2014). The effect of crystallization time on plagioclase grain shape in dolerites. Contrib. Mineral. Petrol. 168, 1–19. doi:10.1007/s00410-014-1076-5
Hornby, A. J., Lavallée, Y., Kendrick, J. E., De Angelis, S., Lamur, A., Lamb, O. D., et al. (2019). Brittle-Ductile deformation and tensile rupture of dome lava during inflation at santiaguito, Guatemala. J. Geophys. Res. Solid Earth. 124, 10107–10131. doi:10.1029/2018JB017253
Hornby, A. J., Lavallée, Y., Kendrick, J. E., Rollinson, G., Butcher, A., and Clesham, S. (2018). Volcanic ash generation mechanisms : fingerprints in phase distribution highlighted by QEMSCAN particle mineralogical analysis. Earth Arxiv. 1–22. doi:10.17605/OSF.IO/XMV9B
Horwell, C. J., Williamson, B. J., Llewellin, E. W., Damby, D. E., and Le Blond, J. S. (2013). The nature and formation of cristobalite at the Soufriere Hills volcano, Montserrat: implications for the petrology and stability of silicic lava domes. Bull. Volcanol. 75, 1–19. doi:10.1007/s00445-013-0696-3
Inkscape Project (2020). Inkscape. Available from: https://inkscape.org.
Ishibashi, H., and Sato, H. (2007). Viscosity measurements of subliquidus magmas: alkali olivine basalt from the Higashi-Matsuura district, Southwest Japan. J. Volcanol. Geoth. Res. 160, 223–238. doi:10.1016/j.jvolgeores.2006.10.001
Kendrick, J. E., Lavallée, Y., Mariani, E., Dingwell, D. B., Wheeler, J., and Varley, N. R. (2017). Crystal plasticity as an indicator of the viscous-brittle transition in magmas. Nat. Commun. 8, 1926–2012. doi:10.1038/s41467-017-01931-4
Kendrick, J. E., Lavallée, Y., Hess, K. U., Heap, M. J., Gaunt, H. E., Meredith, P. G., et al. (2013). Tracking the permeable porous network during strain-dependent magmatic flow. J. Volcanol. Geoth. Res. 260, 117–126. doi:10.1016/j.jvolgeores.2013.05.012
Kendrick, J. E., Lavallée, Y., Varley, N. R., Wadsworth, F. B., Lamb, O. D., and Vasseur, J. (2016). Blowing off steam: tuffisite formation as a regulator for lava dome eruptions. Front. Earth Sci. 4, 1–15. doi:10.3389/feart.2016.00041
Kirkpatrick, R. J. (1981). Kinetics of crystallization of igneous rocks. Rev. Mineral. Geochem. 8, 321–398.
Klein, J., Mueller, S. P., and Castro, J. M. (2017). The influence of crystal size distributions on the rheology of magmas: new insights from analog experiments. G-cubed. 18, 4055–4073. doi:10.1002/2017GC007114
Klein, J., Mueller, S. P., Helo, C., Gurioli, L., and Castro, J. M. (2018). An expanded model and application of the combined effect of crystal-size distribution and crystal shape on the relative viscosity of magmas. J. Volcanol. Geoth. Res. 357, 128–133. doi:10.1016/j.jvolgeores.2018.04.018
Klinkenberg, L. (1941). “The permeability of porous media to liquids and gases,” in Drilling and production practice. American Petroleum Institute. Mat. Sci. 200–213. doi:10.5510/OGP20120200114
Kolzenburg, S., Heap, M. J., Lavallée, Y., Russell, J. K., Meredith, P. G., and Dingwell, D. B. (2012). Strength and permeability recovery of tuffisite-bearing andesite. Solid Earth. 3, 191–198. doi:10.5194/se-3-191-2012
Lamur, A., Kendrick, J. E., Wadsworth, F. B., and Lavallée, Y. (2019). Fracture healing and strength recovery in magmatic liquids. Geology. 47, 1–4. doi:10.1130/G45512.1
Lavallée, Y., Dingwell, D. B., Johnson, J. B., Cimarelli, C., Hornby, A. J., Kendrick, J. E., et al. (2015). Thermal vesiculation during volcanic eruptions. Nature. 528, 544–547. doi:10.1038/nature16153
Lavallée, Y., Meredith, P. G., Dingwell, D. B., Hess, K. U., Wassermann, J., Cordonnier, B., et al. (2008). Seismogenic lavas and explosive eruption forecasting. Nature. 453, 507–510. doi:10.1038/nature06980
Lavallée, Y., Benson, P. M., Heap, M. J., Hess, K. U., Flaws, A., Schillinger, B., et al. (2013). Reconstructing magma failure and the degassing network of domebuilding eruptions. Geology. 41, 515–518. doi:10.1130/G33948.1
Lavallée, Y., Hess, K. U., Cordonnier, B., and Dingwell, D. B. (2007). Non-Newtonian rheological law for highly crystalline dome lavas. Geology. 35, 843–846. doi:10.1130/G23594A.1
Lavallée, Y., and Kendrick, J. E. (2020). “A review of the physical and mechanical properties of volcanic rocks and magmas in the brittle and ductile field,” in Forecasting and planning for volcanic hazards, risks, and disasters. Editor P. Papale, (Amsterdam, Netherlands: Elsevier).
Lavallée, Y., Varley, N. R., Alatorre-Ibargüengoitia, M. A., Hess, K. U., Kueppers, U., Mueller, S., et al. (2012). Magmatic architecture of dome-building eruptions at Volcán de Colima, Mexico. Bull. Volcanol. 74, 249–260. doi:10.1007/s00445-011-0518-4
Llewellin, E. W., and Manga, M. (2005). Bubble suspension rheology and implications for conduit flow. J. Volcanol. Geoth. Res. 143, 205–217. doi:10.1016/j.jvolgeores.2004.09.018
Lofgren, G. (1974). An experimental study of plagioclase crystal morphology: isothermal crystallization. Am. J. Sci. 274, 243–273. doi:10.2475/ajs.274.3.243
Melnik, O., and Sparks, R. S. J. (1999). Nonlinear dynamics of lava dome extrusion. Nature. 402, 37–41. doi:10.1038/46950
Miwa, T., Toramaru, A., and Iguchi, M. (2009). Correlations of volcanic ash texture with explosion earthquakes from vulcanian eruptions at Sakurajima volcano, Japan. J. Volcanol. Geoth. Res. 184, 473–486. doi:10.1016/j.jvolgeores.2009.05.012
Morgan, D. J., and Jerram, D. A. (2006). On estimating crystal shape for crystal size distribution analysis. J. Volcanol. Geoth. Res. 154, 1–7. doi:10.1016/j.jvolgeores.2005.09.016
Mueller, S., Llewellin, E. W., and Mader, H. M. (2011a). The effect of particle shape on suspension viscosity and implications for magmatic flows. Geophys. Res. Lett. 38 , L13316. doi:10.1029/2011GL047167
Mueller, S., Melnik, O., Spieler, O., Scheu, B., and Dingwell, D. B. (2005). Permeability and degassing of dome lavas undergoing rapid decompression: an experimental determination. Bull. Volcanol. 67, 526–538. doi:10.1007/s00445-004-0392-4
Mueller, S., Scheu, B., Kueppers, U., Spieler, O., Richard, D., and Dingwell, D. B. (2011b). The porosity of pyroclasts as an indicator of volcanic explosivity. J. Volcanol. Geoth. Res. 203, 168–174. doi:10.1016/j.jvolgeores.2011.04.006
Mueller, S., Scheu, B., Spieler, O., and Dingwell, D. B. (2008). Permeability control on magma fragmentation. Geology. 36, 399. doi:10.1130/G24605A.1
Murch, A. P., and Cole, P. D. (2019). Using microlites to gain insights into ascent conditions of differing styles of volcanism at Soufrière Hills Volcano. J. Volcanol. Geoth. Res. 384, 221–231. doi:10.1016/j.jvolgeores.2019.07.022
Mysen, B., and Richet, P. (2019). Silicate glasses and melts. Second Edition. Amsterdam, Netherlands: Elsevier.
Narváez Medina, L., Arcos, D. F., and Battaglia, M. (2017). Twenty years (1990–2010) of geodetic monitoring of Galeras volcano (Colombia) from continuous tilt measurements. J. Volcanol. Geoth. Res. 344, 232–245. doi:10.1016/j.jvolgeores.2017.03.026
Ostwald, W. (1925). Concerning the function rate of the viscosity of dispersion systems: IV. Kolloid Z. 36, 248–250.
Preece, K., Gertisser, R., Barclay, J., Charbonnier, S. J., Komorowski, J. C., and Herd, R. A. (2016). Transitions between explosive and effusive phases during the cataclysmic 2010 eruption of Merapi volcano, Java, Indonesia. Bull. Volcanol. 78, 54. doi:10.1007/s00445-016-1046-z
Preece, K., Barclay, J., Gertisser, R., and Herd, R. A. (2013). Textural and micro-petrological variations in the eruptive products of the 2006 dome-forming eruption of Merapi volcano, Indonesia: implications for sub-surface processes. J. Volcanol. Geoth. Res. 261, 98–120. doi:10.1016/j.jvolgeores.2013.02.006
Riker, J. M., Cashman, K. V., Rust, A. C., and Blundy, J. D. (2015). Experimental constraints on plagioclase crystallization during H2O- and H2O-CO2-saturated magma decompression. J. Petrol. 56, 1967–1998. doi:10.1093/petrology/egv059
Schneider, C. A., Rasband, W. S., and Eliceiri, K. W. (2012). NIH Image to ImageJ: 25 years of image analysis. Nat. Methods. 9, 671–675. doi:10.1038/nmeth.2089
Sparks, R. S. J. (1997). Causes and consequences of pressurisation in lava dome eruptions. Earth Planet Sci. Lett. 150, 177–189. doi:10.1016/S0012-821X(97)00109-X
Spieler, O., Kennedy, B., Kueppers, U., Dingwell, D. B., Scheu, B., and Taddeucci, J. (2004). The fragmentation threshold of pyroclastic rocks. Earth Planet Sci. Lett. 226, 139–148. doi:10.1016/j.epsl.2004.07.016
Stix, J., Torres, R. C., Medina, L. N., Cortés, G. P., Raigosa, J. A., Gómez, D., et al. (1997). A model of vulcanian eruptions at Galeras volcano, Colombia. J. Volcanol. Geoth. Res. 77, 285–303. doi:10.1016/S0377-0273(96)00100-X
Vargas, C. A., and Torres, R. (2015). Three-dimensional velocity structure of the Galeras volcano (Colombia) from passive local earthquake tomography. J. Volcanol. Geoth. Res. 301, 148–158. doi:10.1016/j.jvolgeores.2015.05.007
Vasseur, J., Wadsworth, F. B., Lavallée, Y., Hess, K. U., and Dingwell, D. B. (2013). Volcanic sintering: timescales of viscous densification and strength recovery. Geophys. Res. Lett. 40, 5658–5664. doi:10.1002/2013GL058105
Voight, B., Sparks, R. S., Miller, A. D., Stewart, R. C., Hoblitt, R. P., Clarke, A., et al. (1999). Magma flow instability and cyclic activity at soufriere Hills Volcano, Montserrat, British west indies. Science. 283, 1138–1142. doi:10.1126/science.283.5405.1138
Voight, B., and Elsworth, D. (2000). Instability and collapse of hazardous gas-pressurized lava domes. Geophys. Res. Lett. 27, 1–4. doi:10.1029/1999GL008389
Wadsworth, F. B., Witcher, T., Vossen, C. E. J., Hess, K. U., Unwin, H. E., Scheu, B., et al. (2018). Combined effusive-explosive silicic volcanism straddles the multiphase viscous-to-brittle transition. Nat. Commun. 9, 4696–4698. doi:10.1038/s41467-018-07187-w
Wallace, P. A., Kendrick, J. E., Miwa, T., Ashworth, J. D., Coats, R., Utley, J. E. P., et al. (2019). Petrological architecture of a magmatic shear zone: a multidisciplinary investigation of strain localisation during magma ascent at Unzen volcano, Japan. J. Petrol. 60, 791–826. doi:10.1093/petrology/egz016
Wallace, P. A., Lamb, O. D., De Angelis, S., Kendrick, J. E., Hornby, A. J., Díaz-Moreno, A., et al. (2020). Integrated constraints on explosive eruption intensification at Santiaguito dome complex, Guatemala. Earth Planet Sci. Lett. 536, 116139. doi:10.1016/j.epsl.2020.116139
Westrich, H., and Eichelberger, J. C. (1994). Gas transport and bubble collapse in rhyolitic magma : an experimental approach. Bull. Volcanol. 56, 447–458. doi:10.1007/BF00302826
Whitaker, S. (1996). The Forchheimer equation: a theoretical development. Transport Porous Media. 25, 27–61. doi:10.1007/BF00141261
Wright, H. M. N., Cashman, K. V., Mothes, P. A., Hall, M. L., Ruiz, A. G., and Le Pennec, J. L. (2012). Estimating rates of decompression from textures of erupted ash particles produced by 1999-2006 eruptions of Tungurahua volcano, Ecuador. Geology. 40, 619–622. doi:10.1130/G32948.1
Wright, H. M. N., Cashman, K. V., Rosi, M., and Cioni, R. (2007). Breadcrust bombs as indicators of Vulcanian eruption dynamics at Guagua Pichincha volcano, Ecuador. Bull. Volcanol. 69, 281–300. doi:10.1007/s00445-006-0073-6
Keywords: andesitic magma, viscosity, plagioclase, permeability, Vulcanian explosions, Galeras volcano, decompression rate, lava dome growth
Citation: Bain AA, Kendrick JE, Lamur A, Lavallée Y, Calder ES, Cortés JA, Cortés GP, Gómez Martinez D and Torres RA (2021) Micro-Textural Controls on Magma Rheology and Vulcanian Explosion Cyclicity. Front. Earth Sci. 8:611320. doi: 10.3389/feart.2020.611320
Received: 28 September 2020; Accepted: 16 December 2020;
Published: 25 January 2021.
Edited by:
Fabio Arzilli, The University of Manchester, United KingdomReviewed by:
Mike Cassidy, University of Oxford, United KingdomSimon Thivet, UMR6524 Laboratoire Magmas et Volcans (LMV), France
Copyright © 2021 Bain, Kendrick, Lamur, Lavallée, Calder, Cortés, Cortés, Gómez Martinez and Torres. This is an open-access article distributed under the terms of the Creative Commons Attribution License (CC BY). The use, distribution or reproduction in other forums is permitted, provided the original author(s) and the copyright owner(s) are credited and that the original publication in this journal is cited, in accordance with accepted academic practice. No use, distribution or reproduction is permitted which does not comply with these terms.
*Correspondence: Amelia A. Bain, YW1lbGlhLmJhaW5AZWQuYWMudWs=