 J. Stine
 J.W. Geissman
 D.E. Sweet3
- 1Department of Geosciences, University of Texas, Richardson, TX, United States
- 2Department of Earth and Planetary Sciences, University of New Mexico, Albuquerque, NM, United States
- 3Department of Geosciences, Texas Tech University, Lubbock, TX, United States
The type-section of the Blackwater Draw Formation (BDF) consists of a series of five paleosol horizons developed on eolian deposits and an overlying surficial soil. Previous work has shown that magnetic properties (e.g., χ, ARM, and IRM) as a function of depth in this type-section, display both magnetically enhanced and magnetically depleted signals for different paleosols. To better understand the magnetic mineralogy responsible for these varying responses, various rock-magnetic experiments, scanning electron microscopy, and Mössbauer spectroscopy were conducted on representative samples from the six soil units which constitute the BDF type-section. Our results show that sub-micron hematite [with a minor contribution from single-domain sized hematite (Hc = ∼500 mT) dominates all the soils in terms of weight percent concentration. Whereas, low coercivity (Hc = ∼35 mT or less) magnetite/maghemitized-magnetite grains, largely in the PSD state (Mr/Ms=∼0.14 +/– 0.03588, Hcr/Hc=∼2.68 +/– 0.298789), dominate the magnetic signal. Magnetically depleted soils show a relatively higher proportion of goethite, while magnetically enhanced soils show an increased contribution from SP/SSD magnetite/maghemite phases.By combining our data-set with geochemically-derived climofunctions, we have correlated the magnetically preserved, depleted, and enhanced sections of the type-section to three distinct environmental phases (I-III). The basal sediments of Phase I displays relatively homogenous (neither enhanced nor depleted) magnetic properties due to relatively arid conditions and minimal alteration of southerly derive eolian sands. Conversely, Phase II-III represents a change in weathering intensities and provenance, resulting in a mix of southerly derived sands and northerly derived silts. Phase II, experienced greater precipitation levels, resulting in the dissolution of Fe-oxide phases and thus magnetic depletion. The uppermost Phase III experienced intermediate precipitation intensities resulting in magnetic enhancement.Using previously published age models we tentatively interpret these changing environmental conditions to be influenced by the Middle-Pleistocene Transition (1.2-0.7 Ma), where the Earth’s climatic cycles shifted from a ∼41 kyr to ∼100 kyr cycles. However, ambiguities persist due to uncertainties in the currently published age model. Due to the complexity of the magnetic signal, we recommend future studies utilize a holistic approach, incorporating rock-magnetic, geochemical, and microscopy observations for more accurate reconstruction of regional paleoenvironments.
Introduction
Iron is the fourth most common element forming the planet (Lepp, 1975; Thompson and Oldfield, 1986; Frey and Reed, 2012) therefore iron bearing minerals, including magnetic iron oxides (i.e. magnetite, maghemite, hematite, and others), are a common constituent in most rocks in the Earth’s crust. Thompson and Oldfield (1986) recognized that environmentally influenced changes in iron oxide-bearing sediments correspond to changes in the magnetic properties of the bulk sediment material. Since then, numerous studies have shown that the magnetic properties of sediments, as well as sedimentary rocks, may serve as a valuable paleoclimate proxy (e.g., Evans and Heller (2003), and references therein), although ambiguities still exist concerning interpretations of the magnetic characteristics.
During pedogenesis, it is often the case that fine-grained magnetite/maghemite particles form from the alteration of parent material (Thompson and Oldfield, 1986; Maher et al., 2003a, 2003b; Jordanova, 2016). These pedogenic magnetite/maghemite particles include superparamagnetic (SP; grain size typically <30 nm) in addition to geologically stable, single domain (SSD; grain size 30–75 nm) grain populations (Zhou et al., 1990; Liu et al., 2003, 2004b; Liu, 2004; Nie et al., 2016). This is in contrast to detrital magnetic minerals which are often coarser multidomain (MD; grain size 100-300 nm and larger) or pseudo-single domain (PSD; grain size in between SSD and MD) grain sizes (Levi and Merrill, 1978; Newell and Merrill, 2000; Maxbauer et al., 2016a; Roberts et al., 2017).
Nevertheless the formation of new magnetic material during pedogenesis can result in a net increase in commonly measured rock magnetic parameters, such as bulk magnetic susceptibility (χ), anhysteretic remanent magnetization (ARM), and isothermal remanent magnetization (IRM) with respect to the parent material (a process often referred to as ‘magnetic enhancement’) (Maher, 1986; Thompson and Oldfield, 1986; Maher and Thompson, 1995; Evans and Heller, 2003; Torrent et al., 2006; Jordanova, 2016). A well-known example of this phenomenon, and its relation to climate cycles, is the intensely studied loess deposits on the Chinese Loess Plateau (Heller and Tungsheng, 1984; Zhou et al., 1990; Maher and Thompson, 1991; Liu et al., 1992, 2004a, 2007a; Verosub et al., 1993; Meng et al., 1997; Torrent et al., 2007; Song et al., 2010). There the variations in magnitude of χ in relation to depth corresponds not only with the alternating sequences of loess-paleosols but also with established glacial-interglacial cycles based on geochemical and geochronologic information as, first demonstrated by Heller and Tungsheng (1984) and Kukla et al. (1988).
However, pedogenesis does not always strictly result in magnetic enhancement of the parent material. Sequences that have been studied in Alaska, Siberia, and Argentina are well-cited examples where paleosols have lower magnetic values compared to underlying loess deposits (Chlachula et al., 1997, 1998; Maher, 1998; Chlachula, 2003; Chlachula and Little, 2011; Jordanova, 2016). For these sites the “Siberian/Alaskan” model was proposed, which states that glacial/interglacial time periods correlate to strong/weak winds resulting in the deposition of more/less magnetite/maghemite respectively (Chlachula et al., 1998; Matasova et al., 2001; Zhu et al., 2003; Matasova and Kazansky, 2005; Kravchinsky et al., 2008). However, high percent frequency dependence (%χFD) values for magnetically depleted palesols in Siberia suggest that pedogenesis is still a relevant factor (Matasova et al., 2001; Kravchinsky et al., 2008). Liu et al. (2008, 2013) offered an alternative model for magnetic depletion, where oversaturation of soils with water favors the conversion of detrital magnetite/maghemite into magnetically weaker mineral phases such as goethite or paramagnetic clays (Lu et al., 2012; Chen et al., 2015). Additionally, other researchers have identified that rises in temperature can also lead to magnetic depletion, through the conversion of magnetite into hematite (Schwertmann, 1958; Kämpf and Schwertmann, 1983; Scheinost and Schwertmann, 1999; Schwertmann et al., 1999; Liu et al., 2012; Wang et al., 2013; Jiang et al., 2018).
Understanding those specific circumstances where pedogenic processes may result in enhancing or depleting the magnetic signature of a soil is crucial to confidently interpreting rock magnetic data as a reliable climate proxy. In this paper, we contribute to ongoing research on the processes that might favor magnetic enhancement over depletion through studies of the magnetic mineralogy of the type section of the Blackwater Draw Formation (Reeves and Mahaney, 1976; Holliday, 1989). This formation consists of a series of Pleistocene eolian sediment-paleosol couplets preserved on the Southern High Plains (SHP) region of the United States (Figure 1), which display both magnetically depleted and magnetically enhanced eolian sediment-paleosol layers (Holliday, 1989; Gustavson and Holliday, 1999; Stine et al., 2020).
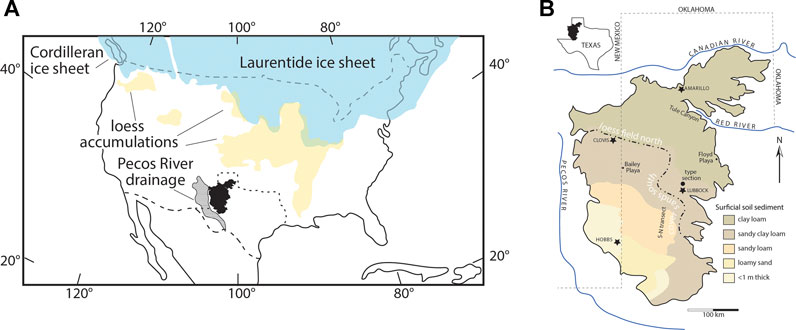
FIGURE 1. (A) The North American continent during the Last Glacial Maximum (LGM), with emphasis placed on the location of major loess accumulations, the maximum extent of Northern Hemisphere ice sheets during the LGM, and the Pecos River drainage area. Distribution of loess is adapted from (Muhs, 2018), and sources therein). Extent of ice sheets is adapted from (Dyke et al., 2002). (B) Geographic extent of the Southern High Plains showing areas discussed in the text. Dashed line in center of the Southern High Plains defines the inferred boundary between loess and cover sands (after (Reeves and Mahaney, 1976)). Figure modified from (Stine et al., 2020).
Through the use of a holistic data set which includes: rock-magnetic, geochemical, and scanning electron microscopy observations; our study reveals the complex environmental origins of the magnetic signal as a reflection of both changing provenance and weathering intensities. Moreover, through the use of geochemically-based climofunctions, three paleoenvironmental phases are identified. The earliest Phase (I) represents a period when increased aridity resulted in the relative preservation of the magnetic signal, which is carried by southerly derived eolian coarse magnetic phases. This is followed by Phase II, characterized by a mix of southern sands and northern loess, where increased humidity results in magnetic depletion, through the destruction of magnetic phases. The soils of Phase III are similar to Phase II in that both are mixtures of southern sands and northern loess. However, Phase III represents an intermediate level of precipitation, i.e. great enough to result in magnetic enhancement but not so high as to destroy any newly made magnetic phases.
Using current age constraints, these environmental phases are tentatively correlated to Middle Pleistocene Transition (MPT), when interglacial-glacial cycles shifted from ∼41-k.y. cycles to ∼100-k.y. cycles. However, ambiguities in the age model makes it difficult to associate these environmental changes with larger scale climatic shifts.
Blackwater Draw Formation
Geomorphic Evolution and Age
The Pleistocene Blackwater Draw Formation (BDF) is a series of eolian deposit-paleosol couplets that form a sheet like body across the Southern High Plains (SHP) in the south-central US. The SHP (often called the Llano Estacado) is a plateau covering ∼ 130,000 km2 across the Texas panhandle (Figure 1). The BDF varies in thickness across the SHP, commonly ranging from <1 to about 9 m thick, but locally is up to 27 m thick in the vicinity of Amarillo, Texas (Hovorka, 1995). Internally, the sediments are punctuated by distinct Bt and Bk pedogenic horizons, the number of which varies from 4 to 14 different units depending on location (Holliday, 1989; Hovorka, 1995; Stine et al., 2020). Notably, thicker intervals of the BDF tend to exhibit a greater number of paleosol profiles (Hovorka, 1995). The varying number of preserved paleosols likely reflects localized wind deflation or soil welding (Holliday, 1989). Nevertheless, each past soil-forming episode is considered a widespread phenomenon, and the (uppermost) soil , referred to as the “Surficial Soil”, represents the most recent episode. Notably, the lack of exposures and a relatively low-resolution age model for the formation have made correlation of soil stratigraphy across the SHP problematic, especially in the oldest buried horizons (Holliday, 1989, 1997; Holliday et al., 1996a, 1996b, 2008; Gustavson and Holliday, 1999).
At some localities, the presence of the Guaje ash (ca. 1.4 Ma) in the lower sections of the BDF, where it is present above stage IV calcisols of the BDF, indicates that the base of the formation is likely older than ca. 1.4 Ma and potentially as old as ∼1.9 Ma (Izett et al., 1972; Gustavson and Holliday, 1999). At the type-section, the focus of this study, the minimum age of the youngest paleosol is further constrained by an OSL date of ∼0.12 Ma (Holliday, 1989). Although the Guaje ash is missing at the type-site, the identification of a magnetozone of reverse magnetic polarity implies that, at this specific locality, the lower part of the BDF must predate the Matuyama/Brunhes boundary and thus be older than ca. 0.773 Ma (Holliday, 1989; Patterson and Larson, 1990; Coe et al., 2004; Singer, 2014; Channell et al., 2020; Ogg, 2020).
Type Section
The type locality of the BDF is ∼9 m in height and consists of five paleosols punctuated by a surficial soil horizon (Stine et al., 2020) (Figure 2). The topmost and youngest soil horizon is termed the “Surficial Soil”; the physical characteristics of which were all documented by Holliday (1989). This soil was classified as a Paleustalf that contains three distinguishable horizons: A, Bt, and Bk. The A horizon exhibits 5 YR 3/4 hues, is ∼0.3 m thick, and is noted for having a sandy clay loam texture. The Bt horizon exhibits 5 YR 3/6 hues, is ∼1 m thick, and has abundant clay films on ped facies. Similar to the A horizon, the Bt horizon of the Surficial Soil has a sandy clay loam texture (Holliday, 1989). The Bk horizon was described by Stine et al. (2020) as a Stage III calcic horizon that has 7.5 YR 5/8 hues, is ∼1 m thick, and has a loamy texture.
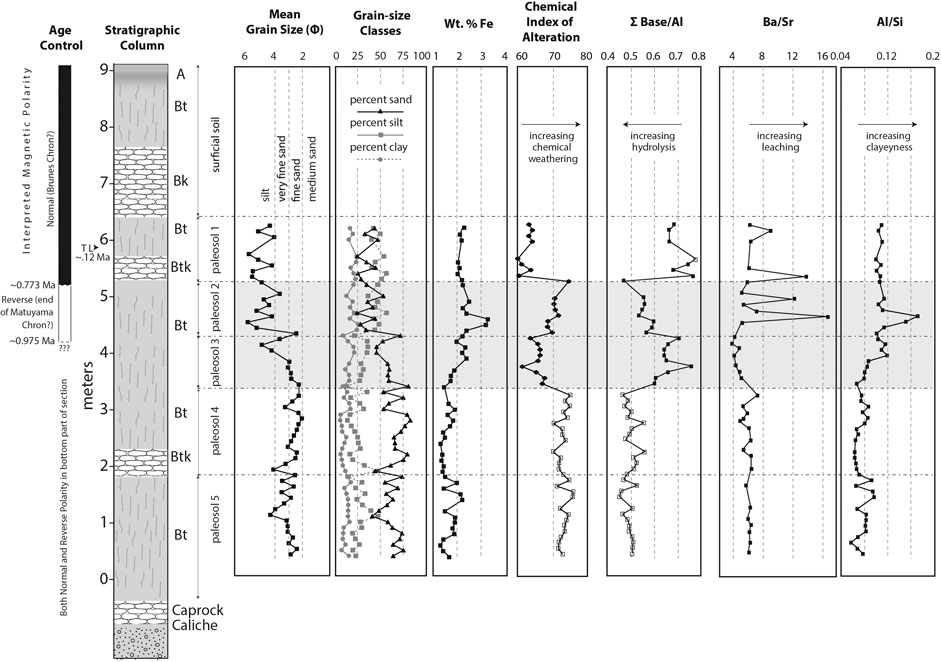
FIGURE 2. Integration of sedimentologic, geochemical, and geochronologic data from the type section of the BDF. Horizontal lines represent soil boundaries. Grain-size data are reported in relative proportions of sand, silt, and clay. Geochemical samples were acid leached to remove calcium carbonate so that silicate weathering could be accurately assessed. Chemical index of alteration (CIA) is after (Nesbitt and Young, 1982). This figure also includes Wt % Fe vs depth, which was constructed using Table 1 from (Stine et al., 2020) note how Paleosol 2 has the highest percentage of Fe. (Stine et al., 2020) noted that the anonymously high CIA and ΣBase/Al values for Paleosol 4 and 5 were due to the high quartz content rather than high weathering and hence are represented with open squares. Nevertheless, CIA and ΣBase/Al values for the other paleosols are more representative of relative weathering intensity, and are represented with closed squares. Magnetic polarity is from (Patterson and Larson, 1990), and age calibration is from (Singer, 2014). Shaded gray background is the part of the section that closely aligns with the approximate duration (1250–700 ka) of the mid-Pleistocene transition from (Clark et al., 2006). TL—thermoluminescence-obtained date, from (Holliday, 1989). The stratigraphic position of the TL -date within Paleosol 1 is uncertain, hence it is currently interpreted to represent the minimum age of Paleosol 1. Soil horizon nomenclature follows standard (Soil Survey Staff, 1990) procedures. Figure modified from (Stine et al., 2020).
Paleosol 1, classified as an argillic calcisol/calcic mollisol (Stine et al., 2020), is 1.3-meter thick and contains a Bt and Bk horizon, both of which exhibit 2.5YR 3/6 hues. The Bt horizon displays subangular blocky peds in clay-rich pockets, while the Bk horizon contains vertical columns of carbonate that grade laterally into zones of calcareous nodules that envelop quartz grains. Mean grain size (D50) of the interval is coarse silt (5ϕ; 31 µm). Additionally, the average mode is displaced from the mean towards the coarser fraction, or finely skewed frequency distribution. Vertically, the interval records a slight coarsening-upward profile.
Paleosol 2, classified as a loamy argillisol/mollisol (Stine et al., 2020), is slightly more than a meter thick. This soil is characterized by a single Bt horizon composed of angular circumgranular peds with 2.5 YR 3/6 hues. Mean grain size varies from fine sand in the basal 20-cm to medium to coarse silt (6-4ϕ; 15-63 µm) throughout the rest of the interval. Paleosol 2 is similar to paleosol 1 in that the mean is coarse skewed; however, this horizon shows a slightly coarser signature. It should be noted that this horizon was identified via unique geochemical and rock-magnetic signatures (Stine et al., 2020), visually it can be difficult to distinguish paleosol 2 from vertically adjacent horizons in outcrop.
Paleosol 3, classified as an argillic protosol/mollisol (Stine et al., 2020), is about 70-cm thick. This paleosol is characterized by a single Bt horizon composed of prismatic peds exhibiting 2.5 YR 3/6 hues. Mean grain-size increases upward from fine sand (2.29ϕ; 31 µm) in the basal 30 cm to coarse silt (5ϕ; 31 µm) at the top of the interval. Pedogenic carbonate is observed only locally as matrix.
Paleosol 4 represents a marked contrast from overlying horizons. This interval, classified as an argillic calcisol/aridisol (Stine et al., 2020), is about 1.5-m thick and contains a Bt and Bk horizons. The Bt horizon is characterized by a massive ped structure with 5 YR 9/1 hues, while the underlying Bk horizon is composed of columnar and nodular carbonate with 5 YR 9/1 hues. Mean grain size is demonstrably coarser than overlying layers and is predominantly fine sand (2.21ϕ; 216 µm).
Paleosol 5, classified as an argillic calcisol/aridisol (Stine et al., 2020), is about 2.2 m thick and rests directly above the Caprock Caliche. This interval is characterized by a single Btk horizon with 5 YR 4/8 hues, consisting of abundant pedogenic carbonate as isolated nodules or matrix. However, vertical columns of pedogenic carbonate are absent. This soil shows a relatively constant grain size that averages around fine sand (3.18ϕ; 110 µm).
Based on detailed geochemical (Figure 2), rock-magnetic parameter, and environmental magnetic ratio data sets (Figure 3), Stine et al. (2020) concluded that the lowermost paleosols (Paleosols 5 and 4) experienced relatively minor degrees of weathering, and therefore that the relatively high magnetic signal in them was in part due to the relative preservation of magnetic parent material. Anonymously high chemical index of alteration (CIA) values for Paleosols 5 and 4 were attributed to the high quartz content and thus were disregarded for those two layers (Figure 2). Moreover, given the existing age constraints, Paleosols 5 and 4 record conditions prior to the Matuyama/Brunhes boundary (Patterson and Larson, 1990), either prior to or during the onset of the Middle Pleistocene transition (Imbrie et al., 1993). In contrast, Paleosols 3 and 2, which directly overlie Paleosols 5 and 4, experienced a relatively high degree of weathering and hence the low magnetic values from these soils are characterized by as a magnetically depleted signal (Stine et al., 2020). Finally, the uppermost horizons, Paleosol 1 and the Surficial Soil, which displayed the highest magnetic values, experienced a moderate degree of weathering and are defined as having a magnetically enhanced signal (Stine et al., 2020).
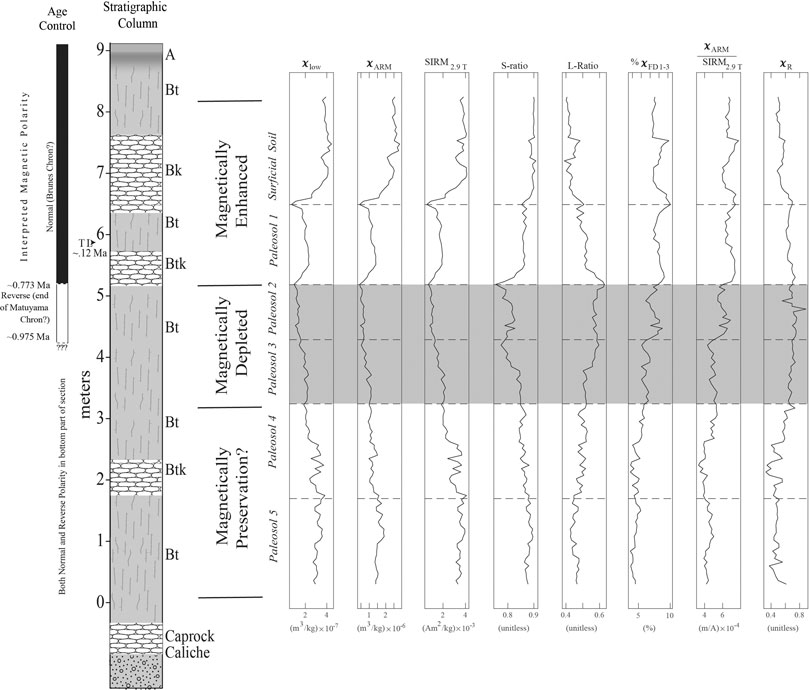
FIGURE 3. Principal rock-magnetic parameters (χlow, χARM, and SIRM2.9T) in addition to Environmental-magnetic ratios (S-ratio, L-ratio, %χFD1-3, χARM/SIRM2.9T, and χR) all plotted as a function of depth in the type section. Note the similarity in behavior among all of the principal rock-magnetic parameters. The various rock-magnetic experiments in this paper show that the principal rock-magnetic parameters are primarily a reflection of the concentration of low-coercivity ferrimagnetic phases (magnetite and maghemite) (Thompson and Oldfield, 1986; Evans and Heller, 2003; Jordanova, 2016). This is supported by the high and low values of the S-ratio(Stine et al., 2020) and L-ratio (this study), respectively (Liu et al., 2007b). Low %χFD1-3, χARM/SIRM2.9T, and χR values for Paleosols 5 and 4 imply that the magnetic signal is controlled primarily by a wide distribution of coarse magnetic phases, which were likely detrital in origin (Thompson and Oldfield, 1986; Evans and Heller, 2003; Hrouda, 2011; Jordanova, 2016; Stine et al., 2020). By contrast the relatively high %χFD1-3, χARM/SIRM2.9T, and χR values for Paleosols 3- Surficial Soil implies that the magnetic signal is controlled by fine, potentially SP-SD magnetic phases (Hrouda, 2011; Maxbauer et al., 2016a), and thus the magnetically enhanced and depleted signals are likely a reflection of environmental processes.
The Middle Pleistocene Transition
Between about 1.2 and 0.7 Ma, the climate cycles of the planet shifted from being primarily influenced by a ∼41-ka obliquity cycle to one that was dominated by a ∼100-ka eccentricity cycle (Imbrie et al., 1993). This shift in the temporal frequency of glacial and interglacial cycles is referred to as the Middle Pleistocene transition (MPT) and one of its most noticeable effects was the global increase in ice volume (Mudelsee and Schulz, 1997; Head and Gibbard, 2005; Clark et al., 2006; Clark, 2012). However, the 100-ka frequency is the weakest orbital parameter (Imbrie et al., 1993; Nie et al., 2008; Clark, 2012), therefore determining the forcings responsible for the MPT has been the subject of a large body of research, and various explanations have been proposed. Some workers suggest that longer-lived and larger northern hemisphere ice sheets that developed after the onset of the MPT are the direct result of an internal forcing (Nie et al., 2008; Lisiecki, 2010). The causes of which potentially include: long-term global cooling and CO2 decline [e.g. (Raymo et al., 1988, 1997; Berger and Jansen, 1994b, 1994a; Raymo, 1994, 1997)], disruption or alteration of the thermo-haline, deep-water ocean current (Schmieder et al., 2000), increased volume of sea-ice (Tziperman and Gildor, 2003), or El Niño-Southern Oscillation patterns in the tropical Pacific ocean (McClymont and Rosell-Melé, 2005; Yu et al., 2018). However, in contrast to the previous hypotheses that focus on northern hemisphere ice buildup, Elderfield et al. (2012) proposed that the post-MPT 100-ka cycle was initiated by an abrupt increase in Antarctic ice volume at about 900 ka, implying that changes in northern hemisphere ice volume were the consequence of southern hemisphere ice buildup.
Nevertheless, most of these models rely heavily on sedimentologic and geochemical data from marine settings. In order to more fully understand the climatic effects of the MPT, additional data are needed from terrestrial settings. The challenge lies in the fact that many Quaternary loess deposits in North America are relatively thin (∼20 m or less) and with few exceptions are no older than the penultimate glacial period (ca. 110 ka) (Muhs, 2018). This is in contrast to the thick and continuous loess-paleosol deposits in Central Asia that continuously span from the Holocene to at least the early Miocene and potentially even to the Oligocene (Head and Gibbard, 2005; Liu et al., 2007a; X. M. ; Liu, 2007; Muhs, 2013, 2018; Nie et al., 2016; Bird et al., 2020). A notable exception is the Quaternary BDF that mantles the Southern High Plains (SHP) in North America (Holliday, 1989; Holliday et al., 1996a, 1996b). Existing age control of the BDF indicates that these sediments span at least the last 1.4 Ma and potentially up to the last 2.0 Ma, therefore it is likely that the MPT is recorded within the BDF (Holliday, 1989; Patterson and Larson, 1990; Imbrie et al., 1993; Gustavson and Holliday, 1999). Implications that the MPT had on the specific environmental conditions that favor either magnetic enhancement or depletion within the type site of the formation are contemplated more extensively within the discussion section.
Methods
The type locality of the BDF (Reeves and Mahaney, 1976) where we collected the suite of samples for this study lies 21 km north of Lubbock, Texas (33.766269°-101.874261°). Exposures of BDF deposits are rare on the SHP but here a gulley that first acted as an anthropogenic thoroughfare has incised down to the Caprock Caliche on top of the Ogallala Formation; this provides a complete section of the formation. A total of ∼7 m of the BDF was able to be sampled for rock-magnetic measurements, from ∼40 cm above the underlying Ogallala Formation to ∼1.6 m into the Surficial Soil. The base of the formation was inaccessible due to cover and the top of the formation into the uppermost Surficial Soil was not sampled due to anthropogenic disturbance.
Samples for rock-magnetic analyses were obtained at ∼5-cm intervals and were dug out of the exposure and collected into plastic bags after scraping away a few centimeters of surficial material with non-magnetic copper-beryllium tools. In the laboratory, samples were cleaned of any organic material, gently disaggregated with a mortar and pestle, and packed into standard (IODP, 7 cc internal volume) plastic boxes, while the remaining sediment were placed into marked plastic bags for future rock-magnetic tests. Once fully prepared these plastic boxes, served as the primary specimens for the rock-magnetic data vs depth measurements previously published in Stine et al. (2020), including: mass-normalized bulk magnetic susceptibility measured at 976 Hz (χlow) and 15,616 Hz (χhigh); ARM measurements at AF fields of 100 mT with a DC bias field of 0.01 mT; IRM measurements measured at field intensities of 100 mT (IRM100mT) , 300 mT (IRM300mT), a saturating field of 2.9T (SIRM), and a back-field of -300 mT (IRM–300mT). It should be noted that for this paper, the anhysteretic remanent susceptibility (χARM) will be used in liu of the ARM reported by Stine et al. (2020). χARM was calculated by normalizing the ARM data previously reported by Stine et al. (2020) to the DC bias field of 0.1 mT (79.77 A/m). Normalizing the ARM to χARM does not change the signal behavior, nevertheless calculation of χARM is recommended in order for future studies to compare the results here with data from other sites (Maher, 1998; Evans and Heller, 2003; Peters and Dekkers, 2003).
Environmental-magnetic ratios calculated from this complete set of rock-magnetic data included parameters previously reported in Stine et al. (2020): The S-ratio, HIRM300mT, %χFD1-3, χARM/χlow, and χARM/SIRM. Additionally, this paper will also compare two new environmental-magnetic ratios: χR and the L-Ratio. These environmental magnetic ratios were calculated by measuring mass-normalized bulk magnetic susceptibility measured at 3,904 Hz (χmed) and a backfield IRM of -100 mT (IRM-100mT). Bulk magnetic susceptibility was measured using a MFK 1-A Agico Kappabridge, while bulk remanence measurements were made using an Agico JR6-A spinner magnetometer. All rock-magnetic parameters and environmental magnetic ratios are displayed in Supplementary Datasheet S1.
χR is a rock-magnetic parameter first proposed by Hrouda (2011) which is theoretically independent from dia-, para-, and MD ferromagnetic contributions in sediments. χR is useful for determining the difference between wide and narrow distributions of mean grain-size volume of SP-SSD particles in a sediment (Hrouda, 2011). It is calculated by the following equation:
The L-ratio first developed by Liu et al. (2007b) is interpreted to reflect coercivity variations in magnetically harder phases (i.e. hematite and/or goethite) where low/high values represent low/high coercivities respectively. It is calculated using the following equation:
Select rock-magnetic data and environmental data from this study and from Stine et al. (2020) are plotted against depth in Figure 3. Calculations and common interpretations of all rock-magnetic parameters and environmental parameters presented in Figure 3 are summarized in Supplementary Datasheet S1, S2, respectively. Moreover, all rock-magnetic parameters and environmental magnetic ratios from this study and from Stine et al. (2020) are displayed in Supplementary Datasheet S1.
In order to determine magnetic mineralogy several rock-magnetic experiments were conducted on representative specimens from each paleosol. These specimens were collected from the remaining sediment not packed into corresponding plastic boxes. Specimens were chosen based on how closely the χ measurements of a corresponding box specimen matched the median value for the paleosol as a whole. The corresponding depths are displayed on each figure in order to allow for easier correlation between the results published here and Stine et al. (2020).
Bulk magnetic susceptibility versus continuous heating/cooling experiments (χ vs temperature [T]) were conducted using ∼0.7 g of material in an argon environment with a MFK 1-A AGICO Kappabridge interfaced with a CS4 thermal-heating attachment. First-order numerical derivatives of the bulk magnetic susceptibility with respect to temperature (dχ/dT) were calculated in order to determine the Curie temperature. However, this process of differentiation did enhance noise, therefore a loess model with a 0.25°C-window was constructed, using the smooth.m function on Matlab R2019b. and compared to the raw dχ/dT.
Step-wise acquisition of IRM, from 0 to ∼2.9 T, was imparted on representative samples using an ASC impulse magnetizer, and measured using a JR-6A dual-spinner magnetometer. Following an applied field of 2.9 T, where saturation was essentially reached, the samples were then subjected to step-wise progressive DC demagnetization of IRM until the magnetization crossed the abscissa, defining the coercivity of remanence (Hcr). Magnetic-component unmixing analysis using the MAX UnMix protocol (Maxbauer et al., 2016b) was used in order to accurately determine the contribution of magnetic phases to the IRM signal.
In order to conduct the three-component test, ∼1 g of material was taken from representative samples from all six soils. This material was then mixed with zircar cement after being placed into a 7 cc nonmagnetic ceramic box (Pluhar and Kirschvink, 1991; Prothero, 2011), these served as the primary specimens for the experiment. After drying, each specimen was imparted with a high-coercivity IRM (2.9 T), a medium-coercivity IRM (300 mT) and a low-coercivity IRM (50 mT), in that order, along three perpendicular axes. The magnetic remanence of each specimen was measured as it was progressively stepwise heated from room-temperature to ∼685°C (Lowrie, 1990). All measurement were conducted using a 2G-Enterprises cryogenic magnetometer equipped with DC squids housed in a magnetically shielded room at the University of Texas at Dallas.
For measurements requiring smaller volume specimens, pressure pellets for each paleosol were prepared. This was done by mixing 0.03 g of sample with 0.1 g of Spectroblend binding material, once mixed the sample was then placed within a pellet die assembly and flattened with a hydraulic press for approximately 3 min. This process forms solid cylindrical specimens that are compact enough to prevent movement of the grains during various room temperature and low temperature measurements.
Room-temperature measurements conducted on the pressured pellets included hysteresis and First-Order Reversal Curves (FORCS). Both of which were measured on a PMC Vibrating Sample Magnetometer (VSM) 3900 series. Analysis of the first order reversal curves was conducted using FORCinel v. 3.0 originally designed by Harrison and Feinberg (2008).
Low-temperature remanence experiments were also conducted on the pressure pellets at the Institute for Rock Magnetism at the University of Minnesota, Minneapolis. All low-temperature remanence experiments were conducted using the Magnetic Properties Measurement System (MPMS-XL). Low-temperature remanence experiments included low-temperature demagnetization of room temperature Saturated-IRM (RTSIRM-LTD), the FC-ZFC procedure, and the low temperature hematite-goethite test (Lagroix and Guyodo, 2017).
The theoretical goethite contribution was removed from the RTSIRM-LTD by constructing a model similar to the parabolic behavior seen by synthetic goethite manufactured by the Alifa Aesar Co. (Lascu and Feinberg, 2011). For each Paleosol, this parabolic model was constructed using a loess smoothing model with a 100 K-window on the warming curves of the RTSIRM-LTD data. By subtracting this model from the raw-data, phase transitions (i.e the Morin and/or Verwey transition) become more evident.
The hematite-goethite test is a slight variation from that originally proposed by Guyodo et al. (2006), Lagroix et al. (2014), and Lagroix and Guyodo (2017), in that it involves subjecting the sample to a continuous magnetic field of 2.5 T while simultaneously heating the sample from room temperature (∼300 K) to the Néel temperature of goethite (∼400 K) (Mathé et al., 1999) and back to room temperature.
Afterwards the DC field is removed and the MPMS is set to oscillation mode which generates an oscillating DC current that begins at –300 mT and then decreases in amplitude until the sample is in a near-zero field, thus subjecting the sample to a rough equivalent of being AF demagnetized at 300 mT (Lagroix et al., 2014; Lagroix and Guyodo, 2017; B. Moskowitz and Dario Bilardello, personal communication, 2020). The purpose of this AF demagnetization procedure at ∼300 mT is to eliminate any contribution from lower coercivity phases (i.e. magnetite/maghemite), although it should be noted that this AF procedure is considered to be not as effective as more traditional methods (Bruce Moskowitz and Dario Biladerllo, personal communication, 2020). After AF demagnetization, the remanence of the sample is measured while it is simultaneously cooled from 300 K to 15 K in a zero field. Then the remanence is measured while the sample is heated from 15 K to 400 K, which should thermally unblock any remanence residing in goethite. Finally, the remanence of the sample is measured while the sample is cooled from 400 K to 15 K and warmed back to room temperature. During this final step any remaining remanence can be attributed to those magnetic phases with a coercivity greater than 300 mT and a Néel temperature greater than 400 K (i.e. hematite).
In addition to low temperature remanence measurements, Mössbauer spectroscopy experiments were also conducted on representative specimens at the Institute of Rock Magnetism. Five representative specimens, as magnetic separates, were measured on a Ranger Scientific Mössbauer Spectrometer. All specimens were measured at room temperature, and three of the five specimens were also measured at 18 K in order to determine the presence of magnetic phases with low blocking temperatures. All Mössbauer spectra were fitted to known models using the mossferret software available at the Institute of Rock Magnetism.
Finally, scanning electron microscopy (SEM) inspection was carried out on six representative samples in order to determine the presence of micron scale (or larger) magnetic mineral phases. In order to maximized the likelihood of observing magnetic minerals, a neodymium magnet was used to magnetically separate magnetic phases from nonmagnetic phases of detrital or pedogenic origin (i.e., quartz, calcite, clay minerals). All SEM inspection was conducted on these magnetic separates.
Results
Scanning Electron Microscopy
SEM inspection of the six magnetic separates from representative samples shows that the samples consist largely of clay minerals and quartz, although some Fe-oxide grains, interpreted to be either magnetite (Figure 4A-C, and e-f) or hematite (Figure 4D), are present. Moreover, monazite was also observed in specimens from Paleosol 1 and the Surficial Soil (Supplementary Datasheet S5, S6). Fe-oxide grains (e.g., hematite or magnetite/maghemite) are readily identified based on their higher atomic number and resulting brightness relative to surrounding clay minerals (Ul-Hamid, 2018) and by energy dispersive X-ray analysis (EDS) spectra (Supplementary Datasheet S1-S6). If apparent, crystallographic form and habit were used to further define an Fe-oxide as either magnetite (isometric forms such as cubes or octahedrons if, possibly, authigenic in origin or sub-rounded to rounded, anhedral, somewhat equant forms if detrital) or hematite (platy, micaceous, or tabular habit if authigenic) (Schwertmann and Cornell, 1991; Cornell and Schwertmann, 2006; Klein and Dutrow, 2007) (Figure 4). Some magnetite grains, inferred to be of detrital origin on the basis of their morphology, show shrinkage cracks (Figure 4C,E,F), which is evidence of low-temperature oxidation of magnetite into maghemite (Johnson and Merrill, 1973; Petersen and Vali, 1987; Cui et al., 1994; Zhou et al., 2001; Vahle et al., 2007; Gehring et al., 2009; Nowaczyk, 2011; Haltia and Nowaczyk, 2014). Hematite particles are present (Figure 4D) yet scarce in all specimens observed (Supplementary Datasheet S1-S6). No grains unambiguously identified as goethite were identified in these specimens.
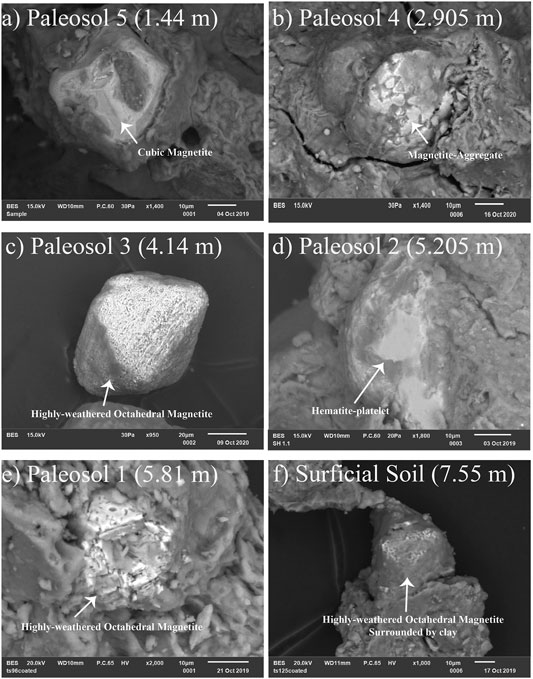
FIGURE 4. Scanning electron microscopy (SEM) images of Blackwater Draw sediment images a-f respectively represent specimens from Paleosols 5-Surficial Soil. (A) Paleosol 5: Cubic shaped magnetite grain surrounded by clay, note the general absence of shrinkage cracks. (B) Paleosol 4: Aggregation, of magnetite particles, the triangular faces are interpreted to represent octahedral faces. (C,E,F) Paleosol 3,1, and Surficial Soil respectively: Heavily weathered magnetite grains, the shattered appearance of the grain is interpreted to represent an overabundance of shrinkage cracks, which in turn suggest low-temperature oxidation (Johnson and Merrill, 1973; Petersen and Vali, 1987; Cui et al., 1994; Zhou et al., 2001; Vahle et al., 2007; Gehring et al., 2009; Nowaczyk, 2011; Haltia and Nowaczyk, 2014). (D) Paleosol 2: Hematite platelet, in general the SEM was only able to detect a few examples of hematite in the specimens (Supplementary Files C_I–C_VI); this suggests that the majority of hematite content is likely submicron in scale.
SEM observations show that the specimens from Paleosols 5-4 appear to have the highest concentration of what are inferred to be detrital Fe-oxide particles (Figure 4A,B), although some shrinkage cracks, indicative of maghemitization, were noted (Supplementary Datasheet S1, S2). Fe-oxide grains showing clear shrinkage cracks become much more prevalent, at the expense of fresher grains, in the specimen from Paleosol 3 (Figure 4C). Additionally, the intensity of grain cracking, potentially indicative of past weathering intensities, is more severe in Paleosol 3, with some magnetite grains appearing to be so damaged that they appear porous (Figure 4C). With the exception of a few tabular hematite crystals (Figure 4D) there are notably fewer observable Fe-oxides in the specimen from Paleosol 2, at least in the scale of resolution by the SEM. Nevertheless, it should be noted that some submicron Fe-oxides are evident in Paleosol 2, although their specific mineralogy is ambiguous (Supplementary Datasheet S4). Fe-oxide grains present in the specimens from Paleosol 1 and the Surficial Soil are largely characterized by shrinkage cracks (Figure 4E,F) resulting in a “shattered” appearance.
Rock-magnetic data and environmental proxies vs depth
Comparing rock-magnetic parameters from this study and Stine et al. (2020) allow for the calculation of two new environmental-magnetic ratios: χR and the L-ratio. Summaries of the calculation and common interpretation of the environmental-magnetic ratios obtained in this study and in Stine et al. (2020) are provided in Supplementary Datasheet S1, S2.
When compared to depth, the L-ratio at appears to be the inverse of the S-ratio, though subtle differences are apparent in Paleosols 2-Surficial Soil upon closer inspection (Figure 3). Paleosol 2 has a relatively narrower distribution of L-ratio compared to S-ratio values, which implies a smaller variation in the concentration of higher coercivity phases (i.e. hematite and goethite) compared to lower coercivity phases (i.e magnetite and maghemite) (Liu et al., 2007b). Moreover, the L-ratio appears to be more efficient than the S-ratio at demarcating the boundaries between the Bt and Bk horizons of Paleosol 1 and the Surficial Soil. These boundaries, correlate to subtle increases in L-ratio values, implying that each layer is separated by a slightly higher concentration of higher coercivity phases (Liu et al., 2007b).
The χR signal is distinct from the other environmental magnetic ratios, in that values begin to steadily increase in the top half of Paleosol 4, reaching peak values in Paleosol 2, and then begin to decrease in Paleosol 1. This behavior seemingly forms a concave arc which is facing lower values (Figure 3). High/low values for χR are interpreted to correlate to narrow/wide distributions of magnetic grain-sizes, respectively (Hrouda, 2011). Therefore, paleosol 2 which has the highest median χR values (0.7111) is interpreted to be characterized by a relatively more homogenous (in terms of grain-size) population of magnetic phases. By contrast, Paleosol 5, the bottom half of Paleosol 4, and the Surficial Soil are interpreted to more likely constitute a mix of varying grain sizes due to their low median χR values of 0.4729, 0.4353, and 0.5625, respectively.
Mössbauer Spectroscopy
Mössbauer spectroscopic experiments were conducted on magnetic separates from representative samples from five of the six paleosols in the type section. All Mössbauer spectra display a sextet with a doublet (Figure 5). Modelling of the sextet form suggests that all samples are dominated by hematite (de Grave and Vandenberghe, 1990; Vandenberghe et al., 2000; Zhi et al., 2000; de Grave et al., 2002). This implies that any magnetite identified in other rock magnetic experiments is extremely minor in terms of weight/modal percent, despite dominating the overall magnetic signal. The persistence of the doublet at low temperatures indicates that it is caused by Fe-bearing paramagnetic clay minerals, such as illite or Fe-bearing kaolinite (Jeleńska et al., 2010; Necula et al., 2015).
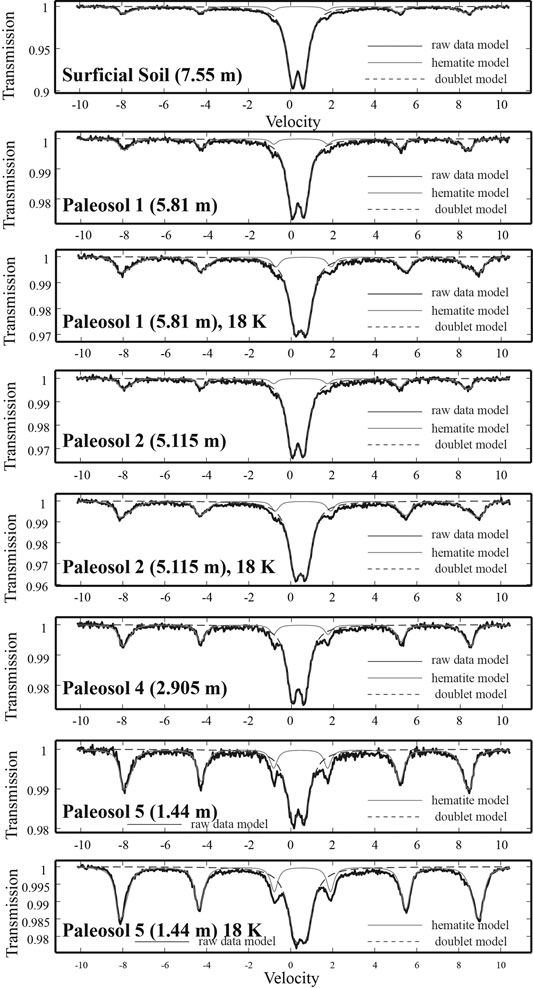
FIGURE 5. Room temperature Mössbauer spectra of samples from the Surficial Soil, Paleosol 1, Paleosol 2, Paleosol 4, and Paleosol 5; in addition to low temperature spectra of Paleosols 1,2, and 5. Regardless of temperature of the experiments, all spectra can be fit to a hematite model and a doublet model, the latter indicating paramagnetic material (de Grave and Vandenberghe, 1990; Vandenberghe et al., 2000; Zhi et al., 2000; de Grave et al., 2002; Jeleńska et al., 2010; Necula et al., 2015).
Temperature Dependent Behavior of Susceptibility and Remanence
Bulk Susceptibility vs Temperature experiments
Most magnetic susceptibility vs. heating/cooling experiments yield a relatively low ( ∼8 to 6 percent) reduction in susceptibility upon cooling, implying that during the heating process the original magnetic mineralogy is partially thermally altered to new phases with reduced magnetic susceptibility (Figure 6). This behavior suggests the transformation of either maghemite (which is thermally unstable) and/or magnetite into hematite, which results in a loss of magnetization (Tarling, 1983; Maher and Thompson, 1999; Hanesch et al., 2006; Zan et al., 2017). Further evidence of experimentally induced thermal alteration is supported by the observation that the heating curves of Paleosols 5, 4, 3, and the Surficial Soil (Figure 6A,B,C) demonstrate a noticeable increase in magnetic susceptibility between ∼200°C and ∼ 400°C. This behavior is potentially caused by maghemite becoming superparamagnetic before reaching its Curie temperature (Gehring et al., 2009). However, considering that the specimens lose most magnetization between ∼580 and 600°C and also the fact that most samples only display a slight decrease in magnetic susceptibility once cooled to room temperature, the likely magnetic mineral assemblage is dominated by magnetite with a relatively minor contribution from maghemite. Smoothing the derivatives of the heating curves shows that most samples have Curie temperatures ranging from ∼540°C ∼550°C, implying a titanomagnetite with low Ti concentration (Figure 6) (O’Reilly, 1976, 1984; Dunlop and Özdemir, 1997; Fabian et al., 2013). Above ∼620°C all samples still display a weak magnetic signal, which is consistent with the presence of hematite, which becomes paramagnetic above ∼675°C (Néel temperature) (Dunlop and Özdemir, 1997).
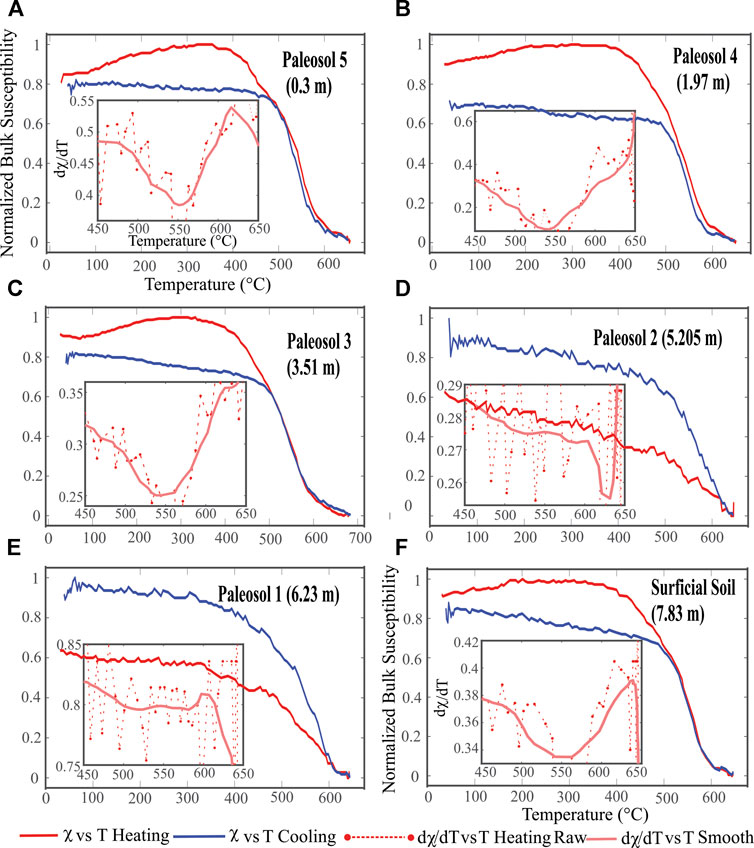
FIGURE 6. Results of bulk magnetic susceptibility vs heating/cooling (red, blue respectively) experiments for representative samples from all soil horizons identified in the BDF for Paleosol 5 (6a), Paleosol 4 (6b), Paleosol 3 (6c), Paleosol 2 (6d), Paleosol 1 (6e), and the Surficial Soil (6f). The derivative of bulk magnetic susceptibility with respect to temperature (dχ/dT) is inset in the bottom left of each graph. The red-dashed lines represents the raw dχ/dT, while the light reddish-pink line represents the smoothed model, which was created in order to highlight the general trends. In general, the smoothed dχ/dT shows Curie temperatures of ∼540°-560°C indicates the presence of low-Ti magnetite and or partially maghemitized magnetite (Tarling, 1983; Maher and Thompson, 1999; Hanesch et al., 2006). Loss of susceptibility after heating is interpreted to represent the inversion of maghemite into hematite (Dunlop and Özdemir, 1997).
Paleosol 1 (Figure 6E) shows a substantial (up to ∼60%) increase in susceptibility with cooling and this behavior suggests that the magnetic signal is due to magnetite alone with small contributions from hematite. The increase in magnetic susceptibility is likely due to some of the hematite fraction being converted to magnetite during heating (Tarling, 1983; Zan et al., 2017).
Low Temperature Behavior: RTSIRM LTD & ZFC-FC Curves
Low temperature behavior of remanence permits the identification of certain magnetic minerals without risking any form of chemical alteration commonly associated with experiments at elevated temperatures. Moreover, certain magnetic minerals display diagnostic behavior at depressed temperatures, including the “Verwey transition” (∼120 K) and the “Morin transition” (∼250-260 K), exhibited by magnetite and hematite, respectively (Verwey, 1939; Morin, 1950). When either of these minerals are cooled to and below those temperatures, a marked change in magnetization is identified, which is correlated to first order phase transitions of the minerals (Verwey, 1939; Morin, 1950; Stacey and Banerjee, 1974)
A slight change in slope, potentially caused by the Verwey transition, is shown by both the RTSIRM-LTD and ZFC-FC curves for all samples (Figures 7,8). The reason why the transition is so subtle could be potentially due to partial maghemitization of the magnetite grain surfaces, which has been shown to shift, subdue, or even mute the Verwey transition (Özdemir and Dunlop, 2010). Further evidence for maghemitization is revealed by the wide humps observed within all the RTSIRM-LTD data, which form wide arcs that begin at ∼300 K and terminate at ∼120 K that later of which corresponds to the Verwey transition (Figure 7). The specimen from Paleosol 3 serves as the exception, with a narrow hump around 100 K – 40 K, potentially representing the low-temperature shifting of the Verwey transition due to maghemitization, fine-grained hematite, or domain-wall pinning of magnetite (Strangway et al., 1967b; Özdemir et al., 2008; Özdemir and Dunlop, 2010; Jiang et al., 2014; Dunlop and Özdemir, 2018). Furthermore, the RTSIRM results for all samples display an increase in magnetization values with decreasing temperatures, a behavior that is attributed to the presence of goethite (Dekkers, 1989b). Subtracting a model of goethite from the RTSIRM-LTD curves results in a much more noticeable Morin transition and Verwey transition in the heating curves, though the Verwey transition is still muted or absent in specimens from Paleosols 3, 2, and the Surficial Soil (Figure 7C). It should also be noted that the detrended RTSIRM-LTD curves all display hump like features from ∼90 K to ∼40 K , which is first evident in the raw-data from Paleosol 3. This feature is tentatively interpreted to be caused by ilmenite, which can be magnetized by the surrounding magnetic phases after the former is cooled towards its ordering temperature of ∼57 K (Fabian et al., 2008). Nevertheless, other possible causes such as finer-grained hematite or highly oxidized magnetite cannot be completely ruled out (Özdemir and Dunlop, 2010; Jiang et al., 2014; Dunlop and Özdemir, 2018).
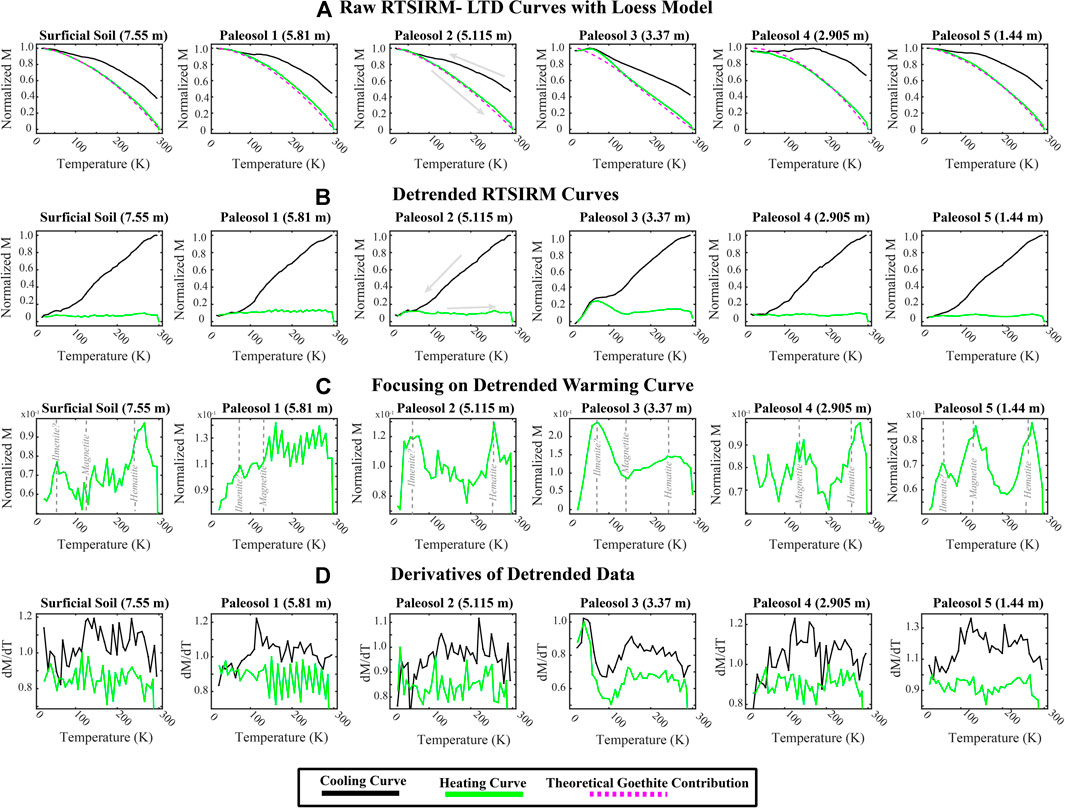
FIGURE 7. RTSIRM-LTD data. 7a: Cooling (black) and warming (green) RTSIRM curves for all five paleosols and the Surficial Soil. Note the humps present on the cooling curve, this is indicative of maghemitization (Özdemir and Dunlop, 2010). The dashed purple line is a loess smooth of the warming curve, representing the potential contribution of goethite which often has a similar parabolic shape in RT-SIRM curves of synthetic samples (Lascu and Feinberg, 2011). 7b: Subtracting the loess-model from the raw RT-SIRM data, this theoretically removes the goethite contribution. 7c: Focusing on the detrended warming curve, note how the Morin (TM) and Verwey (TV) transitions are now visible (Verwey, 1939; Morin, 1950). 7d: Derivatives of the Smoothed RTSIRM curves with respect to temperature. Note the change in slope of the dM/dT cooling curves at ∼120 K evident in all the soils, this is interpreted to be the Verwey transition that the detrending procedure enhances.
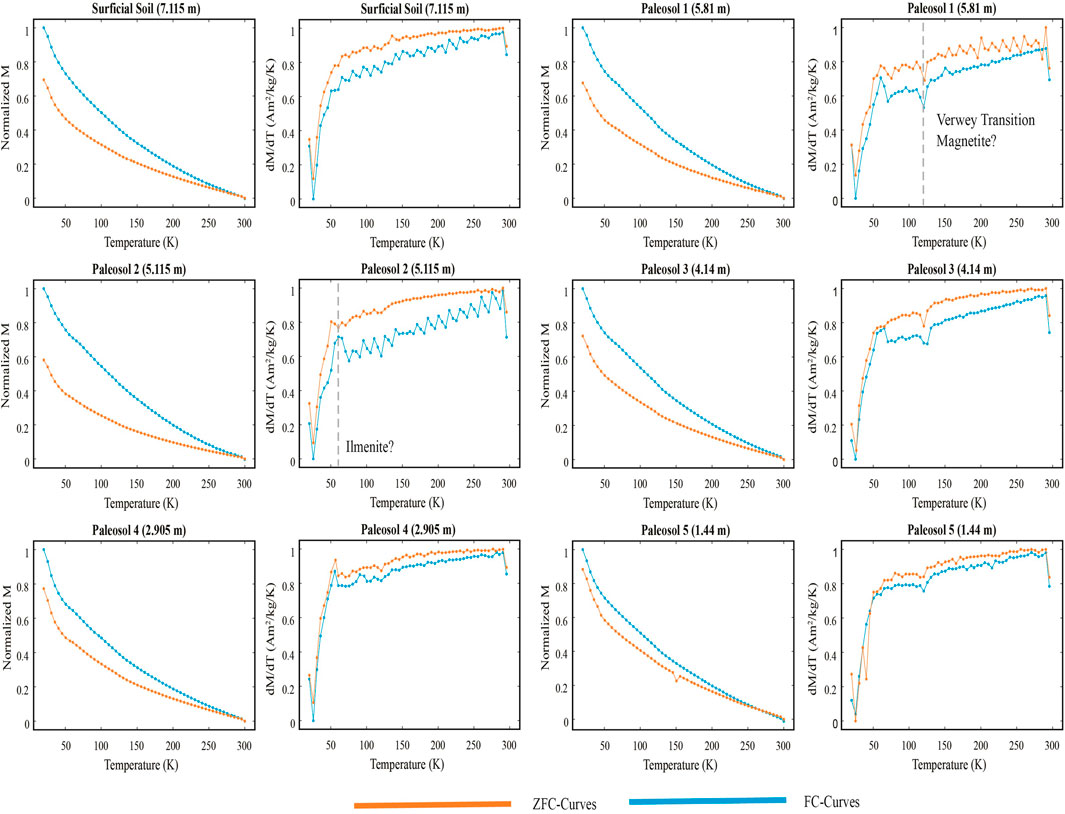
FIGURE 8. ZFC (orange) and FC (blue) curves for all five paleosols and the Surficial Soil. Derivatives of the FC/ZFC curves with respect to temperature are displayed to the left of each paleosol. Note the subtle change in slope at ∼120 K, most evident in Paleosols 1,3, and 5. This change (represented as a sharp drop in the derivatives) is interpreted to represent the Verwey transition of magnetite (Verwey, 1939).
For all paleosol samples, both the FC and ZFC curves display a monotonous increase in magnetization values, resulting in two similarly shaped curves that become closer in magnitude with increasing temperature (Figure 8). At lower temperatures, the FC curve always shows greater values than the ZFC curve, although the magnitude of the observed difference varies depending on the paleosol. This behavior is interpreted to reflect the presence of a combination of maghemite and goethite, as both minerals display a monotonous increase in LTSIRM values with decreasing temperature (Dekkers, 1989b; Rochette and Fillion, 1989; Özdemir and Dunlop, 2010). However, although pure maghemite has a completely reversible ZFC-FC curve (Özdemir and Dunlop, 2010), goethite is characterized by an FC curve that is double in value to the ZFC curve (Rochette and Fillion, 1989; Guyodo et al., 2003; Liu et al., 2006). Therefore, the greater the difference between the FC and ZFC curves, the greater the implied goethite contribution. On the basis of the data obtained, Paleosol 2 is interpreted to have the highest concentration of goethite.
Finally, at ∼50 K all specimens show a noticeable change in slope, which is especially evident as a sharp peak in the derivatives (Figure 8). This is tentatively interpreted to indicate the presence of ilmenite which has a Néel temperature of ∼ 57 K (Ishikawa and Akimoto, 1957).
The Low Temperature Behavior: Hematite-Goethite test
All representative samples lose about 80% of their remanence after the AF-demagnetization procedure (Supplementary Datasheet S3), implying a substantial contribution from low-coercivity phases (Tarling, 1983; Thompson and Oldfield, 1986; Evans and Heller, 2003; Tauxe, 2010; Lagroix and Guyodo, 2017). After AF- demagnetization all samples display a further loss in remanence when heated to 400 K, indicating the presence of goethite in all samples (Figure.9A-C; Figure 9G-I) (Strangway et al., 1967a, 1968). Nevertheless, all samples retain a remanence even after magnetite and goethite are both demagnetized, this surviving magnetization is attributed to the presence of hematite due to the identification of clear Morin transitions evident in the final cooling and warming curves for all the samples (Figure 9D-F; Figure 9J-L) (Morin, 1950; Lagroix and Guyodo, 2017). The presence of finer-grained (potentially nanometer-sized) hematite is attributed as the cause of samples that display Morin transitions shifted towards lower temperatures (∼200 K) (Strangway et al., 1967b; Özdemir et al., 2008; Jiang et al., 2014). The general trend of increasing magnetization with decreasing temperature, as observed in Paleosols 5,2, 1, and the Surficial Soil, are attributed to goethite and or maghemite that survived the thermal and AF demagnetization procedures respectively (Lagroix and Guyodo, 2017).
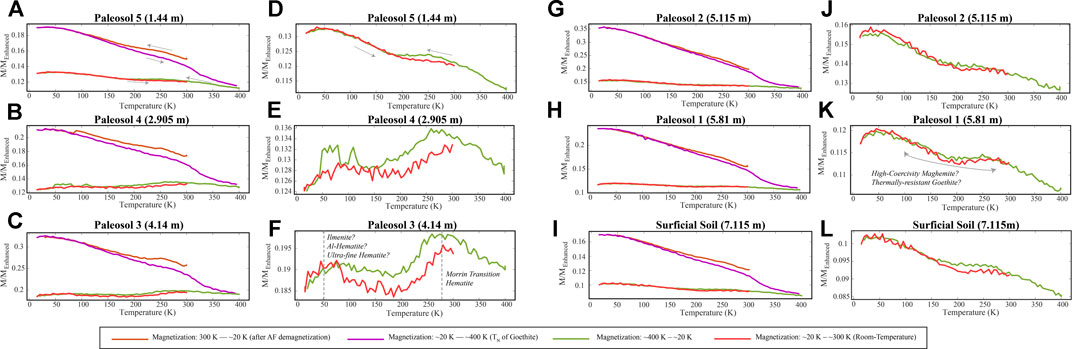
FIGURE 9. Low-temperature hematite-goethite test for all six soils in the Blackwater draw type-site after AF demagnetizing the TRM acquired by field cooling each sample from 400 K to 300 K in a 2.5 T field. Brown curve represents cooling from 300 K to ∼20 K after AF demagnetization at 300 mT. Magenta curve represents warming from ∼20 K to 400 K in order to thermally demagnetize goethite. Green curve represents cooling from 400 K to ∼20 K. Red curve represents final warming curve from ∼20 K to 300 K. Figure 8A-C and Figure 8G-I includes all four curves for Paleosols 5-3 and Paleosols 2- Surficial Soil respectively. Note the difference in magnetization values between the first two curves (brown and magenta curves) and the final two curves in the sequence (green and red curves); the loss in magnetization in the final two curves is attributed to the thermal demagnetization of the goethite contribution at 400 K. Figure 9D-E and Figure 9J-L merely focus on the final two curves (green and red curves) of Figure 9A-C and Figure 9G-I, respectively so that they can be observed in more detail. Theoretically these curves should only represent the isolated hematite contribution for each soil specimen although the increase in magnetization with decreasing temperature (evident in Paleosols 5,2,1 and Surficial Soil) indicates that either high-coercivity maghemite was not completely AF-demagnetized or that a goethite contribution was not adequately thermally demagnetized. Nevertheless, all specimens display a Morin transition at ∼220 K — ∼200 K indicating the presence of hematite. Morin transitions shifted towards lower temperatures, in addition to the “humps” around ∼100 K — ∼25 K are interpreted to represent a distribution of very fine (potentially nano-sized) hematite grains (Özdemir et al., 2008; Jiang et al., 2014).
Similar to the detrended RT-SIRM LTD curves, each specimen displays ∼150 K – ∼40 K humps which are likewise interpreted to represent ilmenite (Fabian et al., 2008). Nevertheless, it should be noted that these features may also be reflective of high-oxidation or domain-wall of a higher‐coercivity magnetite that was insufficiently demagnetized by the AF-procedure (Özdemir and Dunlop, 2010; Dunlop and Özdemir, 2018).
Three-Component Thermal Demagnetization of IRM
The response of the three IRMs acquired in different fields in relation to progressive thermal demagnetization for all five Paleosols in addition to the Surficial Soil (Figure 10) shows that the low-coercivity component in samples of Paleosols 1—5 was thermally unblocked by ∼580° to 600°C indicating the presence of a low-Ti magnetite/maghemite (Dunlop and Özdemir, 1997; Lattard et al., 2006; Karumuri et al., 2009). Minor maghemitization of magnetite is interpreted to be responsible for laboratory unblocking temperatures slightly above the traditionally accepted maximum unblocking temperature for magnetite (580°C) (Gehring et al., 2009). In contrast, the low-coercivity component of the Surficial Soil is not thermally unblocked until about 640°C indicating the presence of fine-grained, thermally-stable maghemite (Özdemir and Banerjee, 1984; Liu et al., 2010).
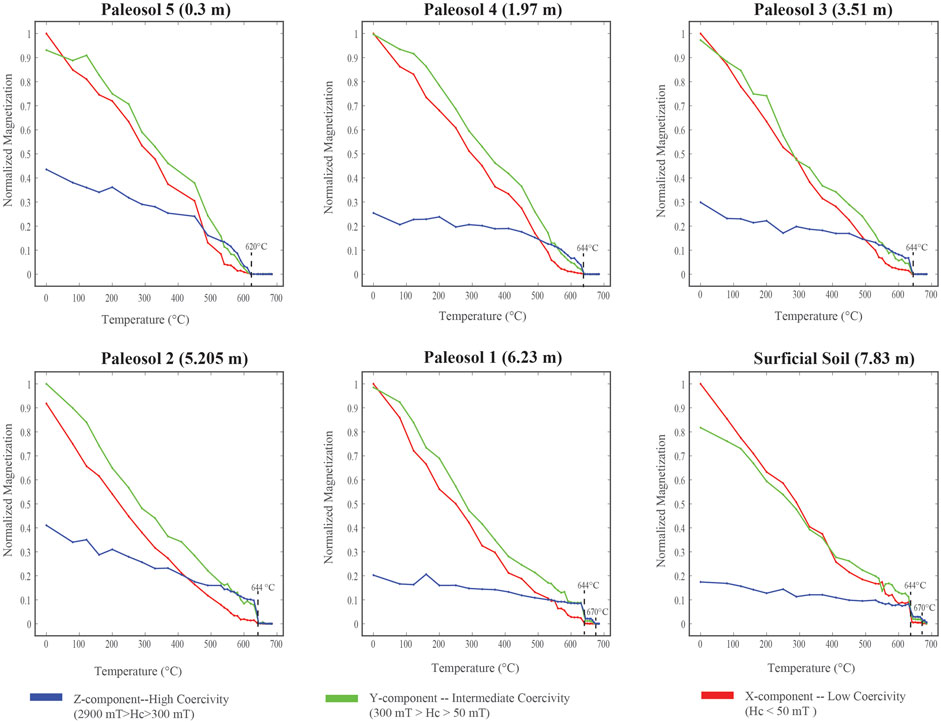
FIGURE 10. Three component IRM progressive thermal demagnetization (Lowrie, 1990) of six representative specimens from each of the five palesols in addition to the Surficial Soil of the BDF. The z-direction (blue line) represent the hard-coercivity (IRM2.9T) component, the y-direction (green line) represent the intermediate-coercivity component (IRM300mT), and the x-direction (red line) represent the low-coercivity component (IRM50mT).
Both the intermediate− and high−coercivity IRM components of Paleosols 4, 3 and 2, in addition to the intermediate−coercivity component of Paleosol 1, are thermally unblocked at ∼640°C, indicating that these components are also dominated by fine-grained maghemite (Özdemir and Banerjee, 1984; Dunlop and Özdemir, 1997; Liu et al., 2010). The intermediate− and high−coercivity component of Paleosol 5 were both thermally unblocked at ∼620°C indicating a thermally stable maghemitized-magnetite (Gehring et al., 2009). Finally, the intermediate− and high−coercivity IRM components of the Surficial Soil, in addition to the high−coercivity IRM component of Paleosol 1, lose a large percentage of remanence at ∼640°C, but are not completely unblocked until ∼675°C. This indicates the presence of both fine-grained thermally-stable maghemite and a sufficient concentration of hematite, the latter of which either originally existed within the sediment or potentially was formed by thermal inversion of maghemite (Özdemir and Banerjee, 1984; Dunlop and Özdemir, 1997; Liu et al., 2010). Nevertheless, the plethora of other positive hematite tests indicate that the hematite identified in Paleosol 1 and the Surficial Soil is natural, rather than laboratory induced.
Isothermal Room-Temperature Behavior
Hysteresis Data, and First-Order-Reversal-Curves
Hysteresis experiments (Figure 11A) conducted on six representative samples were carried out using a peak field of 500 mT. The paramagnetic contribution to the hysteresis curves varies throughout the section, with the maximum contribution associated with samples from Paleosol 2. After correcting for the paramagnetic contribution, all hysteresis loops are relatively narrow, with coercivity (Hc) values ranging from 5 to 10 mT. Moreover, all samples reach saturation between 300 and 400 mT. This behavior is consistent with other rock magnetic measurements, indicating that low to moderate coercivity ferrimagnetic minerals dominate the magnetic signal (Tarling, 1983; Thompson and Oldfield, 1986; Tauxe et al., 2002; Tauxe, 2010). Overall, the values of Hc, as determined by hysteresis measurements, appear to correlate with χ values in that samples with low χ values (e.g., Paleosol 2) typically have lower Hc values than those with higher susceptibility (e.g., Paleosols 4 and 5). This feature could potentially reflect differences in grain sizes and/or the increase in concentration of higher coercivity phases such as hematite (Tarling, 1983; Thompson and Oldfield, 1986; Evans and Heller, 2003; Tauxe, 2010; Özdemir and Dunlop, 2014).
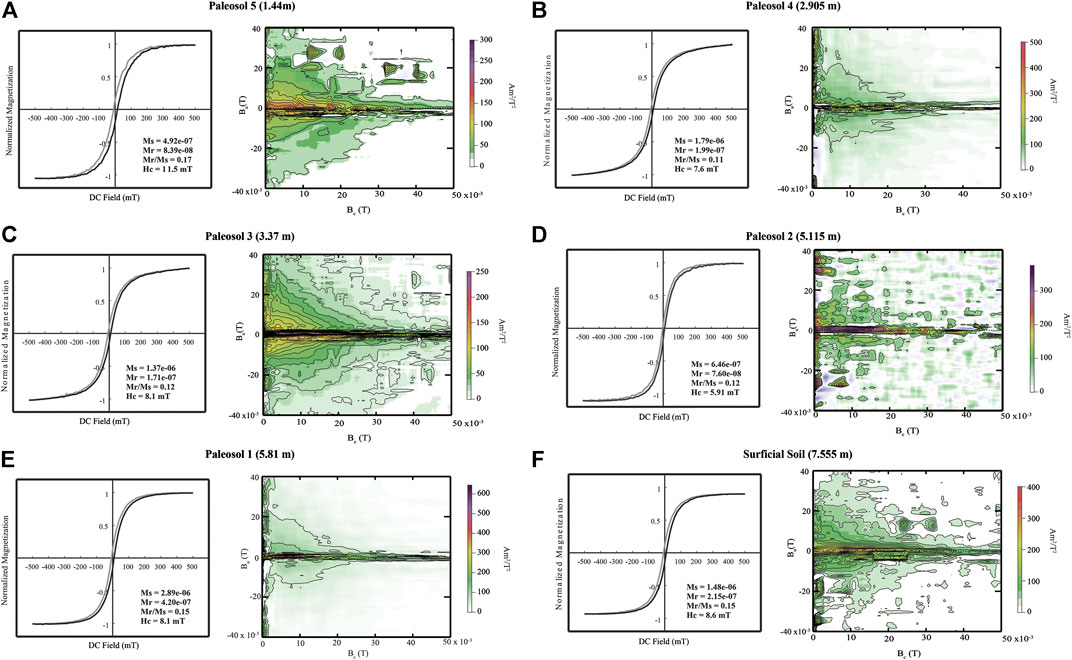
FIGURE 11. Normalized hysteresis curves, after correction for any paramagnetic contribution, and First-Order-Reversal-Curves (FORC(s)) of representative samples from all five paleosols and the Surficial Soil. Figure 10A-F correlates respectively to Paleosols 5- Surficial Soil. For the hysteresis curves note the narrow loops and low coercivity values (5-10 mT), which indicate the dominance of low to moderate coercivity ferrimagnetic phases (Tarling, 1983; Thompson and Oldfield, 1986; Tauxe et al., 2002; Tauxe, 2010). For the FORCs, the weak magnetization of all 6 specimens resulted in (i.e., the vortex structures present over the central ridge in Paleosol 5 and the Surficial Soil). Nevertheless, all FORCs show a central ridge which indicates the presence of SD magnetic phases, while the spread of contours from the central ridge indicates the presence of PSD phases (Roberts et al., 2000, 2014; Muxworthy and Dunlop, 2002; Egli et al., 2010; Egli, 2013; Egli and Winklhofer, 2014; Ao et al., 2017).
In order to construct Day plots, the squareness ratio (Mrs/Ms) and the coercivity ratio (Hcr/Hc) were calculated using the parameters obtained from the hysteresis experiments for all the paleosols (Supplementary Datasheet S2 ) (Day et al., 1977; Dunlop, 2002a, 2002b). Overall, the ratios vary little regardless of paleosol with a squareness ratio average of 0.143208 ± 0.03588 (n=6 samples) and a coercivity ratio average of 2.68144 ± 0.298789 (n=6 samples), which correlate to a domination by PSD magnetite particles (Dunlop, 2002a, 2002b; Tauxe et al., 2002).
First-Order-Reversal-Curves (FORC(s)) were measured and analyzed for representative samples from all the soil units within the type section. All data display a central ridge that extends from the origin and descends past ∼30-40 mT (Figure 11B). Generally, closed contour density focuses at ∼10 mT, indicating the presence of low-coercivity-SD magnetite, although the slight spread along the Bu axis does indicate some grain-interaction (Roberts et al., 2000, 2014; Egli et al., 2010; Egli, 2013; Ao et al., 2017). The presence of PSD magnetite (or maghemite) grains is indicated by the divergence of the outer contours along the Bu axis (Muxworthy and Dunlop, 2002; Egli and Winklhofer, 2014), however this behavior may also be reflective of a magnetic vortex state as demonstrated by Roberts et al. (2017).
Stepwise IRM Acquisition, Backfield Curves, and Component Unmixing Analysis:
Representative whole-rock samples were selected from the BDF for step-wise IRM acquisition curves (to a maximum field of 2.9 T) and step-wise backfield analysis (to a maximum required opposite field of 45 mT) (Figure 12). Most specimens attained a near-saturation IRM value within 90% and 95% of that acquired at IRM2.9T between DC field values of 30 mT and 180 mT, respectively. This behavior further implies that relatively low coercivity magnetic minerals are the primary magnetic phases in the BDF (Dunlop, 1986). The only exception to this is Paleosol 2 which attained an IRM within 90 percent and 95 percent of the SIRM2.9T between DC field values of 220 mT and 500 mT respectively. This indicates the presence of some higher coercivity material such as SSD magnetite and hematite (Merrill, 1968; Robertson and France, 1994; Dunlop and Özdemir, 1997; Özdemir and Dunlop, 2014). Moreover, the fact that all samples show a further steady increase in IRM to 2.9 T (and likely beyond) indicates a relatively minor amount of high coercivity material (e.g., hematite and/or goethite) (Strangway et al., 1968; Dekkers, 1989a; Dunlop and Özdemir, 1997; Tauxe, 2010; Özdemir and Dunlop, 2014).
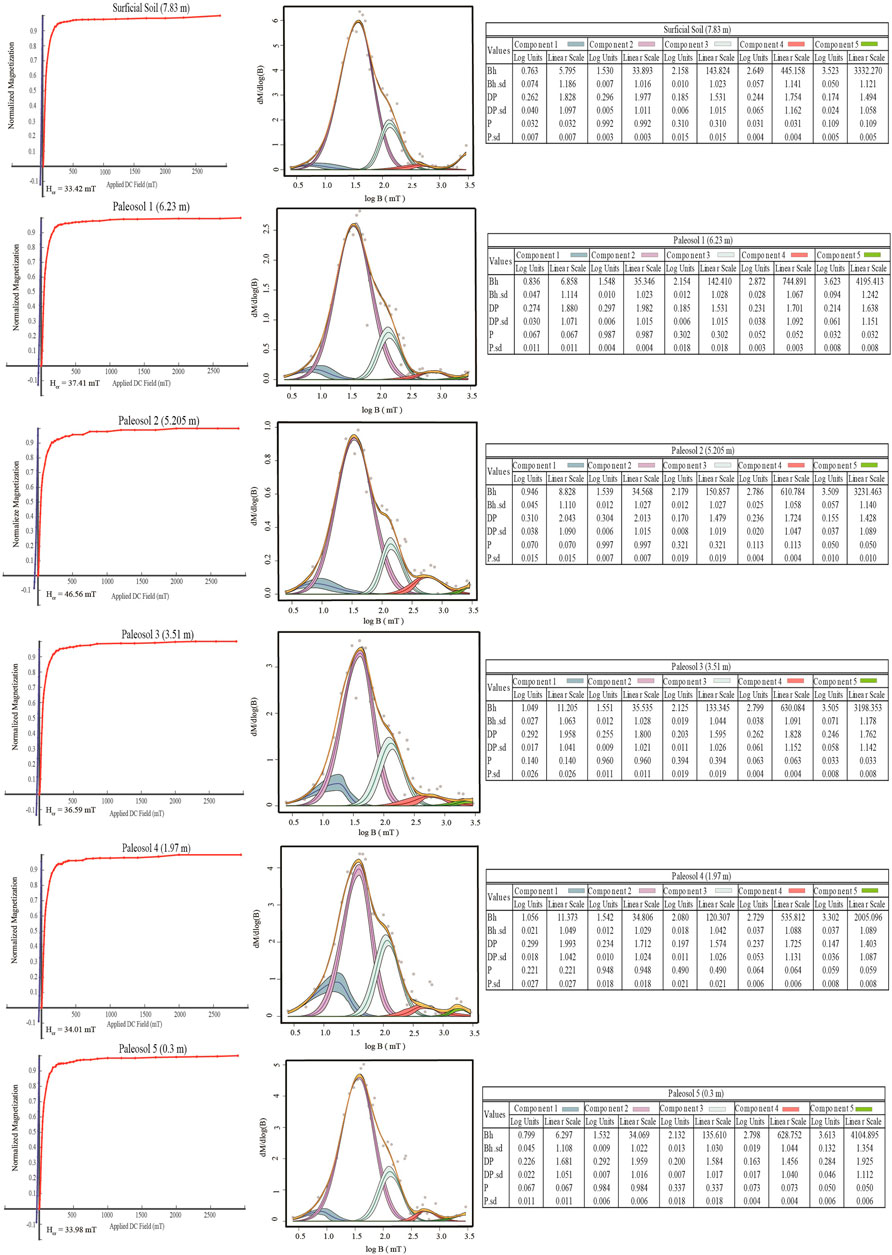
FIGURE 12. Coercivity analysis for specimens from representative samples of all five paleosols and the Surficial Soil in the BDF. Left side for each sample: Curves showing the acquisition of an isothermal remanent magnetization (IRM) and backfield direct field demagnetization of specimens. Right side for each sample: Corresponding magnetic component unmixing analysis results using the MAX UnMix protocol of (Maxbauer et al., 2016b) for IRM acquisition data. In terms of results of the unmixing analysis, Bh is the mean activating field (coercivity) of each component grain population and Bh.sd the standard deviation. Dp is the dispersion parameter, defined as one standard deviation in log space and Dp.sd the standard deviation. P is the optimum model parameter and P.sd the standard deviation. The IRM acquisition and backfield demagnetization data indicate the dominance of relatively low coercivity ferromagnetic phases in these intervals of the BDF and is supported by the results of the unmixing analysis that reveals two primary component: one dominant component with Bh values of about 35 mT (purple area –component 2) and a secondary component with Bh values ∼130-150 mT (light blue area –component 3). The unmixing analysis also indicates very minor contribution of a low coercivity phase with Bh values of ∼5−∼10 mT (darker blue area –component 1) and two much higher coercivity phases with Bh values of about 600-700 mT (red area –component 4) and ∼3000−∼6000 mT (green area –component 5)
After saturation or near-saturation at a DC field of 2.9 T, backfield demagnetization yields a steady decrease in intensity and Hcr values typically between about 35 and 45 mT. The Hcr values also indicate that relatively low coercivity magnetic minerals (magnetite or maghemite) are primarily responsible for the magnetic signal within the BDF, but that they are also influenced by the presence of higher coercivity phases (Dunlop, 1986; Dunlop and Özdemir, 1997; Tauxe, 2010).
In order to further utilize the IRM acquisition data as a means to understand the magnetic mineralogy of representative parts of the BDF, magnetic component unmixing analysis was utilized based on the MAX UnMix protocol (Maxbauer et al., 2016b) for the IRM acquisition data (Figure 12). Although possibly unrealistic, we assume that the data for all specimens are best represented by a set of five magnetic components. Unmixing analysis reveals a dominant component with Bh values of ∼35 mT (magnetite/maghemite), and a secondary component with Bh values ∼130-150 mT (high-coercivity maghemite/magnetite). Although these two components contribute the most to the remanence, three very minor components could also be identified, which included: a very low coercivity component (Bh values between ∼5−∼10 mT) (low-coercivity maghemite/magnetite), a high coercivity component (Bh values between ∼600−∼700 mT) (hematite), and a very high coercivity component (Bh values between ∼3000−∼6000 mT) (goethite). The dominant and secondary coercivity components, Bh = ∼35 mT and Bh = ∼130-150 mT respectively, are well-defined in that the range of coercivities is quite narrow (standard deviation of Bh (Bh.sd) is less than 0.145 log units). The two higher coercivity components are associated with a range of typically higher standard deviation values than the primary and secondary components, nevertheless standard deviation values are typically lower than 0.145 log units (Figure 12).
Discussion
Effects of Provenance and Varying Weathering Intensity on Magnetic Enhancement vs Magnetic Depletion in the Blackwater Draw Formation
Overall, each of the paleosols in the Blackwater Draw Formation (BDF) contains roughly the same magnetic mineralogy, consisting of fine (potentially SP/SD-sized) hematite, goethite, and partially maghemitized magnetite in a range of domain states (SP, PSD, and SD) (Figures 6-12). Furthermore, Mössbauer analysis indicates that regardless of the varying weathering intensities reported by (Stine et al., 2020), each paleosol is dominated, in terms of volume percent, by hematite. This observation alone is not completely unexpected, for many researchers have noted that hematite and/or goethite are often the dominant Fe-oxides in terms of weight/volume percent within paleosols (e.g., Maher, 2011). However, this implies that the geochemically determined Fe concentrations of the BDF (Stine et al., 2020), is primarily a reflection of the hematite concentration rather than maghemite or magnetite.
Furthermore, the relative scarcity of hematite identified via SEM inspection indicates that the typical grain size of the hematite population is at the submicron (potential nanometer) scale. Nanoscale hematite, potentially pedogenic in origin, could possess domain states that range from SD to SP, which would affect the frequency dependence of this material as well as shifting or muting morin transitions (Strangway et al., 1967b; Cornell and Schwertmann, 2006; Özdemir et al., 2008; Özdemir and Dunlop, 2014; Jiang et al., 2018). However, we note that this suggestion is purely speculative, and thus future studies of the Blackwater Draw paleosols should utilize techniques capable of imaging at the nanometer scale (e.g., transmission electron microscopy or scanning TEM).
Despite the dominance of hematite throughout the profile, the rock magnetic experiments utilized in this study are interpreted to indicate that the magnetic signal, as typically evaluated using parameters such as bulk χ, χARM, and IRM intensity as a function of depth, primarily reflects the variations in concentration of magnetite/maghemite throughout the BDF. This is of course a reflection of the high saturation magnetization of magnetite/maghemite. These phases have been noted to dominate the magnetic signal of other paleosols in eolian sequences, even if present as a very small volume/weight percent (Geiss and Zanner, 2006; Jordanova, 2016).
In spite of the general uniformity of the magnetic mineralogy, geochemical evidence, and granulometric evidence presented in Stine et al. (2020) indicates that the coarser-grained Paleosols 5 and 4, predominantly sand (Figure 2), are primarily sourced from the geographically closer Pecos River Valley area in the south. Moreover, the presence of titanomagnetite and ilmenite (Figures 6–9) indicates a potential influx of igneous material into the Pecos River Valley sediments. Likely sources for igneous material, include the volcanic areas in New Mexico (such as the Latir and Ocate volcanic fields) which are known to have provided sediment for the underlying Ogallala formation in the SHP (Eichler, 2020). Conversely, the finer-grained Paleosols 3, 2, and 1 constitute a mix of Pecos River sediments and wind-blown silt that may have had a northern derivation (Figure 2). When creating cross-plots of the various data sets, both Stine et al. (2020) and this study (Figure 13 a, b, and d) show that two distinct populations can be identified which correlate to the single-sourced Pecos sands (i.e., Paleosols 5-4) and the mixed sediments (i.e. Paleosols 3-1). The geochemical classification diagram by (Herron, 1988) (Figure 12A,B), shows that the mixed-source cluster possesses less quartz, implying a granulometric control. However, spider-plots of select elements normalized to the North American Shale Composite (NASC) from (Condie, 1993), reveal that Paleosols 3-1 are also substantially enriched in Zr, Nb, Hf, and Ta (Figure 13C). This suggests that Paleosols 3-1 contain more heavy minerals such as zircon or columbite, implying that the silt comes from a more felsic source compared to the Pecos sands (Parker and Fleischer, 1968; Armstrong-Altrin et al., 2013; Nagarajan et al., 2016). Indeed, SEM inspection noted that, compared to other soils, the most Zircon grains were present in the specimens from Paleosols 2-1, and the Surficial Soil (Supplementary Datasheet S5, S6).
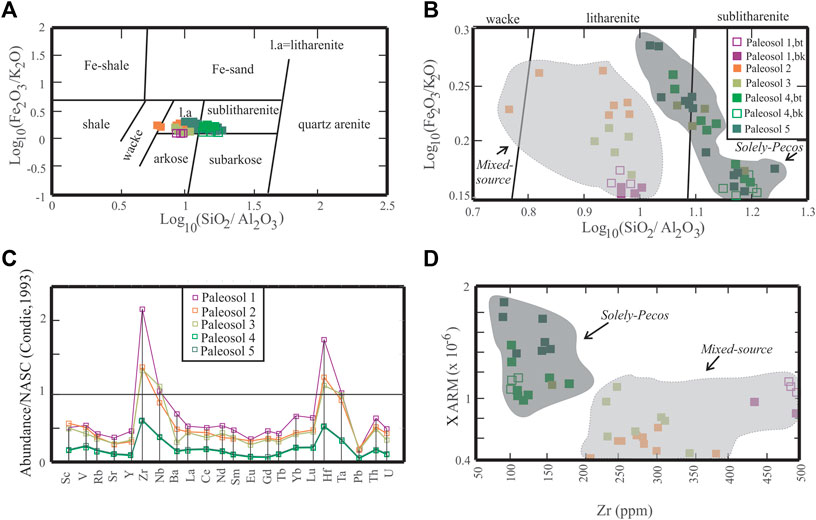
FIGURE 13. Comparing the geochemical and rock-magnetic data set from (Stine et al., 2020) in order to determine change in provenance. Figure 13A,B are log10(Fe2O3/K2O) vs log10(SiO2/Al2O3) geochemical classifications based off of (Herron, 1988), with Figure 13B merely focusing in on the data-points. Note the clustering of the solely-pecos sediments (dark-grey circle: Paleosols 5-4) and the mixed-source sediments (light-grey circle: Paleosols 3-1), defined by (Stine et al., 2020). The few Paleosol 3 data-points that plot in the solely-Pecos region are from the basal-most section of the unit, and potentially represent a transitional zone from Paleosol 4 to 3. Figure 13C shows a spider-diagram of select trace element concentrations normalized to the North American Shale Composite (NASC) (Condie, 1993). Note how Paleosols 3-1 have substantially higher concentrations of Zr, Nb, Hf, and Ta, implying different provenance (Parker and Fleischer, 1968; Armstrong-Altrin et al., 2013; Nagarajan et al., 2016; Stine et al., 2020). Figure 12D is a cross-plot of χARM vs the Zr concentration, note how the clustering of solely-Pecos and mixed-source sediments, similar to Figure 13B. This implies that the change in provenance is partly responsible for the change in magnetic properties.
Ambiguity exists concerning the provenance of the Surficial Soil due to the lack of trace element data. However, SEM inspection of specimens from both Paleosol 1 and the Surficial Soil reveals the presence of monazite, a phase enriched in La and Ce, as well as zircon in both soils. This implies that the Surficial Soil has similarly high concentrations of rare earth elements and Zr as Paleosol 1, suggesting similar sources (Figure 13C) (McLennan, 1989; Stine et al., 2020). Therefore, the Surficial Soil is tentatively interpreted to consist of a mix of Pecos River sediments and wind-blown silt, similar to Paleosols 3-1.
Sand sourced from the southern Pecos river valley to the south of the study area likely contained coarser ferrimagnetic phases than the potentially northern derived silt. Indeed, relatively wider FORC distributions, low Hcr, and low χR values from this study (Figures 3, 11-12) coupled with the lower magnetic granulometry ratio (χARM/χlow, χARM /SIRM, and %χFD) values from Stine et al. (2020) (Figure 3) indicate that the sandier single-source Paleosols 5 and 4 are composed of a wider distribution of coarser magnetic phases than the finer mixed-source Paleosols 3, 2, and 1 (Figures 2,3,11) (Maher, 1988; Dunlop, 1995; Heider et al., 1996; Roberts, et al., 2000; Evans and Heller, 2003; Hrouda, 2011; Jordanova, 2016). The effects of changing provenance on the magnetic properties are also evident in cross-plots of rock-magnetic values vs immobile elements (e.g.: χARM to Zr, (Figure 13D). Thus, the higher and relatively consistent χ, χARM, and IRM intensity values for Paleosols 5 and 4 are tentatively interpreted to be due to a higher concentration of coarser ferrimagnetic phases singularly sourced from southern Pecos river valley sands as compared to the mixed-source Paleosols 3, 2, and 1.
Although shrinkage cracks are present in many detrital magnetite grains, the relatively low degree of alteration of magnetite grains in Paleosols 5-4 compared to other soils, as observed in the SEM (Figure 4), implies that weathering, and thus magnetic depletion, was minimal. Moreover, although the presence of maghemite, goethite and hematite (Figures 5, 7-10) implies some degree of alteration, in general the minimal presence of SP-SSD phases, inferred from the lower magnetic granulometry ratio (χARM/χlow, χARM /SIRM, and %χFD) (Figure. 3) (Supplementary Datasheet S1) (Stine et al., 2020), suggests little pedogenic neoformation of magnetite commonly attributed with increasing the magnetic signal of soils (Maher, 1988; Zhou et al., 1990; Dunlop, 1995; Heider et al., 1996; Soreghan et al., 1997; Liu et al., 1999, 2007b; Evans and Heller, 2003; Jordanova, 2016). Therefore, we interpret Paleosols 5-4 as being relatively magnetically preserved, i.e. experiencing minimal magnetic depletion and/or enhancement.
In contrast to Paleosols 5-4, pedogenic modification is interpreted to be far more consequential for the magnetically depleted Paleosols 3-2 and the magnetically enhanced Paleosol 1-Surficial Soil, all of which are inferred as mixed southern and northern sources (Stine et al., 2020). Indeed, Figure 14, shows that Paleosols 3-1, have a moderate negative correlation with CIA values, suggesting that the magnetically depleted soils are a result of weathering intensities higher than what the magnetically enhanced soils experienced. Paleosols 3 and 2 also contain a relatively higher percentage of goethite as indicated by the ZFC/FC experiment (Figure 8), the low-temperature hematite-goethite experiment (Figure.10) (Supplementary Datasheet S3), relatively high Hcr (Figure 12) and L-ratio values (reported here; Figure 3), as well as low S-ratio values (from Stine et al., 2020; Figure 3) (Stober and Thompson, 1977, 1979; Bloemendal et al., 1992; Maxbauer et al., 2016a).
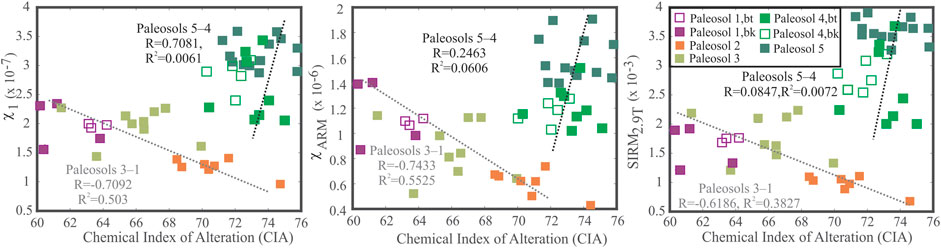
FIGURE 14. Scatter-plots comparing χ1, χARM, and SIRM2.9T to the Chemical Index of Alteration (CIA) calculated by (Stine et al., 2020). Note how each scatterplot results in two clusters. The cluster associated with the mixed sediments (Paleosols 3-1), shows a moderate negative correlation between rock-magnetic values and weathering intensities. This implies that the magnetically depleted values are related to the degree of weathering. The cluster associated with the Pecos-derived sediments (Paleosols 5-4), shows a low correlation between the high-magnetic values of those paleosols and the calculated weathering intensities. Nevertheless, it should be noted that the CIA values for Paleosols 5-4 are suspect due to high quartz content (Stine et al., 2020).
Goethite is thermodynamically stable at surface conditions, therefore its presence is expected, even in minute quantities, for most soils on the planet (Schwertmann, 1971; Schwertmann and Taylor, 1972, 1989; Scheinost, 2004). Soils characterized by greater abundances of goethite are typically associated either with more humid climates (Thompson and Oldfield, 1986; Schwertmann, 1988) or those surface environments that experience less variation in precipitation seasonality (Balsam et al., 2004; Zhang and Nie, 2017). A truly humid climate is unlikely for the BDF due to the pervasive occurrence of pedogenic carbonate (Machette, 1985), and thus variation in precipitation seasonality is likely a factor.
Regardless, the relatively higher chemical index of alteration values (CIA) for Paleosols 3 and 2 coupled with increased presence of goethite indicates that these soils were subjected to more intense weathering conditions than the older paleosols, likely due to the increased presence of water (Chebykin et al., 2002; Sheldon et al., 2002; Wang et al., 2020). Magnetic depletion would have followed as both northern and southern-sourced aeolian magnetite/maghemite grains were converted into magnetically-weaker and/or non-magnetic phases (Santana et al., 2001; Jiang et al., 2018).
It should be noted that Paleosol 2 also displays higher %χFD and χARM/SIRM2.9T values (Figure 3), and a relatively narrower FORC distribution (Figure 11D), suggesting the presence of finer magnetic SP and SD phases within this soil (Maher, 1988; Dunlop, 1995, Heider et al., 1996; Roberts, et al., 2000; Evans and Heller, 2003; Hrouda, 2011; Jordanova, 2016). However, the low χ, χARM , and IRM values suggest that these finer magnetic phases likely take the form of the magnetically weaker hematite or goethite rather than magnetite, as suggested by the high Fe-content, high L-ratio, and low S-Ratio values (Liu et al., 2007b; Chaparro et al., 2020; Stine et al., 2020) (Figures 2,3). The presence of SP phases within a magnetically depleted soil can be explained as an initial process of pedogenic formation of SP-magnetite grains, most of which are sequentially converted (oxidized) into a magnetically weaker phase with increasing weathering intensity, potentially due to relatively high soil temperature (Schwertmann, 1958; Liu et al., 2012; Wang et al., 2013; Jiang et al., 2018). Indeed, the detrended RTSIRM-LTD warming curves for these specimens show a notably muted Verwey transition indicating a high degree of oxidation (Paleosol 2 in Figure 7C) (Özdemir and Dunlop, 2010).
The magnetically enhanced Paleosol 1 is similar to the magnetically depleted Paleosols 3 and 2 in that all three are characterized by high environmental magnetic granulometry ratio values, indicating the presence of finer ferrimagnetic (sensu lato) phases (Evans and Heller, 2003; Jordanova, 2016). Furthermore, high χR values for Paleosols 3, 2, and 1 indicate that all three paleosols have similar distributions of fine ferrimagnetic phases (Hrouda, 2011), implying that Paleosol 1’s higher χ, χARM, and IRM intensity values are likely not the result of a higher proportion of southern- vs northern-sourced sediment. Instead, weathered magnetite grains, high frequency dependence, low Hcr, narrow FORC distributions, low L-ratio, and high S-ratio values (Figures 3,4,11,12) all imply that the magnetically enhanced values of Paleosol 1 are the result of the neoformation and preservation of SP/SD pedogenic maghemite/magnetite grains (Zhou et al., 1990; Soreghan et al., 1997; Liu et al., 1999, 2007b; Evans and Heller, 2003; Jordanova, 2016) (Figures 3,12). Lower CIA values for Paleosol 1 (Stine et al., 2020) (Figure 2) imply an intermediate degree of weathering intensity is the cause of magnetic enhancement. In other words, a moderate degree of weathering is required for pedogenesis to begin and ultrafine maghemite/magnetite grains to form, but weathering would not be so intense as to result in the complete conversion of this new material into hematite or goethite (such as what occurred in Paleosols 3 and 2).
The neoformation and preservation of SP/SD pedogenic maghemite/magnetite grains are also interpreted to be responsible for the high χ, χARM, and IRM intensity values of the Surficial Soil (Eyre and Shaw, 1994; Evans and Heller, 2003; Liu et al., 2004a; Orgeira et al., 2011; Jordanova, 2016). Nevertheless, the lower χR values imply some contribution from coarser phases (Hrouda, 2011). This, in conjunction with the lack of geochemical data for this paleosol, means that an increased contribution from southern sources cannot be completely ruled out as a partial cause of the high magnetic values for the Surficial Soil.
Finally, it should be noted that both the magnetically depleted and enhanced soils seem to possess a slightly higher and narrower FORC distribution along the Hc axis than the magnetically preserved section (Figure 11). Coupling this observation, which implies the presence of pedogenic SD magnetites (Egli, 2004), with the dominance of hematite (Figure 5), suggests that magnetic enhancement and depletion are competing processes during soil development. However, as above, which process ultimately dominates appears to correlate to weathering intensity (Figure 14). The paleoenvironmental implications of this observation are discussed in more detail in the following section.
Combining Geochemically-based Climofunctions with Rock-Magnetic Data to Identify Changing Paleoenvironmental and Paleoclimatic Conditions
Through the use of geochemical data from modern soils under varying climate conditions, regression equations have been derived that estimate mean annual temperature (MAT) and mean annual precipitation (MAP) conditions that can be applied to paleosols (Sheldon et al., 2002). The calculations for determining these climofunctions are summarized in Supplementary Datasheet S4. The high SiO2 (typically 88-90%) content of Paleosols 5 and 4 provide misleading calculations of MAT and MAP because there is not enough weathered product in the profile, and these paleosols were inferred to be predominantly quartz sand deposited as eolian sand sheets (Stine et al., 2020). Moreover, the Surficial Soil does not have any geochemical data. Thus, calculations of MAT are not possible for the Surficial Soil and Paleosols 5 and 4, whereas, MAP calculations are reserved only for the Surficial Soil and Paleosol 4, which contain a Bk horizon and through use to the depth to that horizon (Retallack, 2005) it is possible to provide rough estimates of MAP. This allows for the determination of relative MAT and MAP values for Paleosols 4-Surficial Soil (Figure 15). As above, Paleosol 5 consists solely of a well-developed Btk horizon, therefore no MAT or MAP values could be calculated.
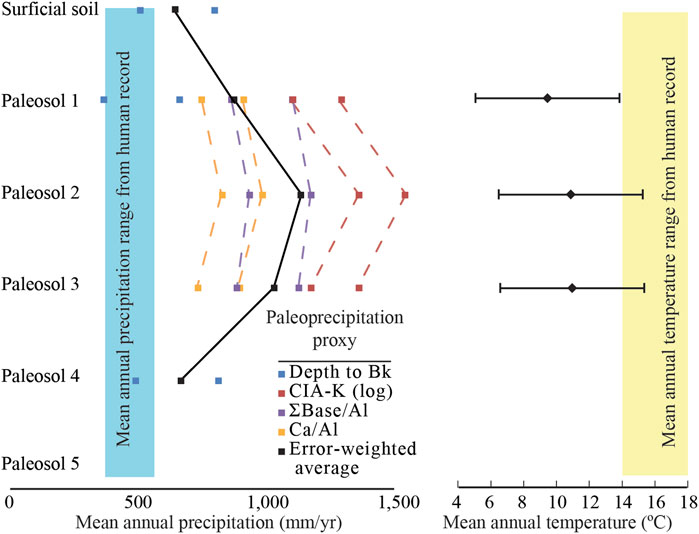
FIGURE 15. Summarizing MAP (right) and MAT (left) for Paleosols 4-1 and the Surficial Soil. No MAT or MAP were determined for Paleosol 5 due to inadequate data, discussed in text. The modern record of MAP for the SHP, represented by the blue bar, ranges from 310-560 mm/yr (Bomar, 1983). In general, the paleosols appear to record an increasing in precipitation from Paleosols 4-2 and a decreasing trend in precipitation from Paleosols 2-1. The implications of these MAP calculations for paleoenvironmental reconstruction are discussed in the text. The modern record of MAT for the SHP, represented by the yellow bar, is 14°C and 18°C (Bomar, 1983), however the error bars are high, and thus more studies are recommended in order to confirm our initial findings.
Through the combined use of these proxies with the remainder of the data set, we tentatively model three paleoenvironmental phases which correspond to the magnetically preserved, depleted, and enhanced sections of the type-section respectively.
Phase I: Arid Environment leads to Magnetic Preservation of Pecos River-Valley Sands [Paleosols 5-4]
The first environmental phase, recorded by the basal two Paleosols 5 and 4, is characterized by a coarser set of eolian sediments, consisting of MD and PSD magnetite phases, primarily sourced from the Pecos River valley region in the south. Relatively warmer temperatures likely resulted in the development of maghemite rims around the eolian-sourced magnetite through oxidation in addition to the development of ultrafine hematite. Using the depth to Bk method, the MAP is calculated to be about 650 mm/yr for Paleosol 4, and no MAT was calculated. It should be noted that the error range of the calculated MAP coincides with what has been recorded for the SHP in modern times, measured at 310 to 560 mm/yr (Bomar, 1983). Therefore, Paleosol 4 is tentatively interpreted to have experienced precipitation at levels more similar to contemporary times than different. Although neither MAP or MAT values were calculated for Paleosol 5, the presence of well-developed carbonate horizons in both paleosols indicates that Paleosols 5-4 formed in similarly arid conditions (Machette, 1985; Holliday, 1989; Gustavson and Holliday, 1999; Stine et al., 2020). These observations, in conjunction with the general lack of frequency dependent SP phases and minimal goethite implies that the environment characteristic of Phase I was sufficiently arid such that neither magnetic enhancement nor magnetic depletion occurred (Balsam et al., 2011). Therefore, we define Phase I as being relatively magnetically preserved (Figure 2).
In order to better understand the paleoenvironmental causes, it is useful to use the contemporary SHP as an analog. Indeed, many remote sensing studies (Lee et al., 2009, 2012; Ginoux et al., 2012; Li et al., 2018; Achakulwisut et al., 2019; Kandakji et al., 2020) have noted that the Pecos River Valley region appears to be a significant source of dust for the numerous dust-storms that afflict the SHP. These dust storms are noted to occur most frequently during the late winter/early-spring which is typically when precipitation is lowest in the region, thus providing sediment that might otherwise be stabilized by vegetation cover (Chepil, 1957; Lee et al., 1994; Stout, 2001; Crabtree, 2005; Novlan et al., 2007). The similarities particularly in provenance imply that the Phase I paleosols were likely influenced by similar environmental conditions as the contemporary SHP, therefore this setting is best described as an arid to semiarid environment.
Phase II: Subhumid to Semiarid Environment leads to Magnetic Depletion of Pecos Sands and Northern Loess Mixture [Paleosols 2 and 3]
The magnetically depleted Paleosols 2 and 3, were deposited within the second environmental phase, which is differentiated from the previous phase by a mixed provenance and higher precipitation. Error weighed average of MAP is about 910 (mm/yr) for Paleosol 3 and about 1020 (mm/yr) for Paleosol 2. These values indicate that Phase II represents a distinctly wetter period than what has been recorded for the SHP in modern times (Figure 15), the latter of which ranges from 310 to 560 mm/yr (Bomar, 1983). The presence of goethite also implies relatively less seasonality than what may have occurred in the previous phase (Balsam et al., 2004; Zhang and Nie, 2017). Increasing both the frequency and total amount of annual precipitation would have resulted in the increased chemical weathering of the parent material, including the conversion of eolian magnetite into lesser magnetic phases. This general correlation of relatively high MAP and magnetic depletion agrees with Balsam et al. (2011) observation that modern surficial soils which experience higher rainfall have a corresponding decrease in magnetic susceptibility. Due to these factors, Phase II is tentatively interpreted to represent a subhumid-semiarid environment
A MAT of 10.9°C for Paleosol 3 and 10.7°C for Paleosol 2 was also calculated using the methods outlined in Supplementary Datasheet S3. This is notably cooler than the modern SHP MAT of 14°C to 18.6°C (Bomar, 1983), nevertheless the higher error bars does cast some doubts on the accuracy of our MAT calculations. A colder SHP in conjunction with the addition of wind-blown silt to the sediment budget that was potentially northerly derived is consistent with glacial influence from the north as larger ice sheets developed during the mid-Pleistocene transition. However, this would require future studies to confirm our MAT measurements.
Phase III: Semiarid to Arid Environment leads to Magnetic Enhancement of Pecos Sands and Northern Loess Mixture [Paleosol 1 and Surficial Soil]
The third and final phase consists of the uppermost layers, Paleosol 1 and the Surficial Soil, the latter of which was paired with Paleosol 1 due to similar characteristics in the rock-magnetic data set and similarities in SEM observations. MAT and error weighted average MAP are 9.45°C and about 790 mm/yr respectively for Paleosol 1. MAP values of about 570 mm/yr are calculated for the Surficial Soil, initially implying that this soil was deposited during environmental conditions more similar to Phase I and the modern era (Bomar, 1983). However, similar rock-magnetic characteristics and SEM observations imply that Paleosol 1 and the Surficial Soil share similar provenance and weathering intensities. Therefore, we tentatively interpret Paleosol 1 and the Surficial Soil as having formed in similar environmental conditions. Moreover, the presence of SP-magnetic phases suggests a higher degree of pedogenesis, and in turn precipitation, than what occurred in Phase I (Evans and Heller, 2003; Maxbauer et al., 2016a; Jordanova, 2016). Incidentally, we interpret the soils of Phase III to represent environmental conditions which were distinct from the contemporary SHP and Phases I and II.
Overall, Phase III is interpreted to represent a semiarid to arid environment, relatively drier than Phase II, yet wetter than what was experienced in Phase I or the modern SHP. Moreover, it should be noted that Phase III is estimated to be a colder environment than Phase II and this, coupled with the continued presence of loess, indicates a possible relationship between larger northern hemisphere ice sheets and regional temperatures in the SHP. Although this later point is purely speculative until: (1) magnetic data from more sites are collected; (2) and future studies confirm our MAT results.
Phase III represents an intermediate position in terms of precipitation levels, and the correlation between intermediate MAP and magnetic enhancement implies that pedogenic ultrafine SP/SD magnetite require specific conditions in order to develop in the SHP. In short, precipitation levels need to be greater than what occurred in Phase I in order for pedogenesis to take place and nanomagnetites to form (Balsam et al., 2011), yet not so intense as to result in the dissolution of magnetic material (Balsam et al., 2011; Liu et al., 2013), as was the case for Phase II
Comparing magnetic data sets from modern surficial soils throughout the northern hemisphere and equatorial regions, Balsam et al. (2011) observed that magnetic enhancement generally only occurred in soils experiencing MAP from 200 mm/yr to 1000-1200 mm/yr. Any soil subjected to precipitation greater/less than 1200 / 200 mm/yr would experience magnetic depletion or no magnetic change, respectively (Balsam et al., 2011). Although our calculated MAP does not perfectly agree with Balsam et al. (2011) observations; the seeming correlation between low, intermediate, and high precipitation respectively with magnetic preservation, enhancement, and depletion is worth noting. This nonlinear relationship between magnetic properties and precipitation, complicates the use of magnetic parameters as a paleoprecipitation proxy, therefore it is highly recommended that future studies take a more holistic approach by incorporating both geochemical and rock-magnetic datasets to avoid ambiguity.
Correlation of Environmental Models to Previously Established Age Models: Effects of the Laurentide Ice Sheet and the Middle Pleistocene Transition?
Fundamental questions remain concerning the forcings responsible for: (1) changing provenance from southerly derived Pecos River Valley sands in Phase I to a mix of Pecos sands and wind-blown silt for Phases II and III; and (2) changing MAT and MAP values from Phase II to III. However, correlation of these results to established paleoclimatic shifts, i.e., the Middle-Pleistocene Transition (MPT), is problematic due to the lack of precise age control at the BDF type site.
Nevertheless, previous magnetic polarity stratigraphy work (Patterson and Larson, 1990), the presence of stage IV calcisols, in addition to age estimates derived at other sites, all imply that the BDF as a whole is likely no older than ca. 1.4 Ma (Izett et al., 1972; Gustavson and Holliday, 1999) and that the base of the type-section in particular is at least older than ca. 773 ka (Holliday, 1989; Patterson and Larson, 1990; Coe et al., 2004; Singer, 2014; Channell et al., 2020; Ogg, 2020). Within the context of these rough age constraints, it is highly likely that the MPT is recorded within the type-section of the BDF.
As above, the MPT is a time interval between ca. 1.2 and 0.7 Ma during which the frequency of glacial-interglacial cycles shifted from a ∼41 ky cycle to a ∼100 ky cycle (Imbrie et al., 1993). Within North America, the MPT coincided with the coalescence and expansion of the Laurentide Ice sheet as the longer ∼100 ky cycles led to enhanced ice growth (Mudelsee and Schulz, 1997; Head and Gibbard, 2005; Clark et al., 2006; Batchelor et al., 2019). Moreover, magnetic polarity data (Balco et al., 2005; Balco and Rovey, 2010; Jennings et al., 2013) and numerical models (Batchelor et al., 2019) imply that the Laurentide ice sheet first reached a geographic extent comparable to the last glacial maximum (LGM) at ∼0.9 Ma, when 100 ky cycles first become dominant in the Marine Isotope Stage (MIS) records (Hughes and Gibbard, 2018, and references therein).
MPT-influenced expansion of the Laurentide ice sheet in turn led to a change in river drainage patterns (Lemmen et al., 1994; Wickert et al., 2013; Wickert, 2016) weakening of the North American Monsoon (NAM) (Bhattacharya et al., 2017, 2018), and the deposition of vast amounts of loess on the continental interior (Muhs, 2018; Muhs et al., 2018; Li et al., 2020). Although the mechanisms are still debated, it has been hypothesized that the expansion of the Laurentide Ice sheet likely affected regional atmospheric circulation and subsequent weather of adjacent regions such as the SHP (Bromwich et al., 2004, 2005; Löfverström and Lora, 2017). If future studies confirm our MAT measurements for Phases II and III, then this could potentially be explained as the migration of the polar jet stream to much lower latitudes which in turn could have brought colder air to the SHP (Munroe and Laabs, 2013). Moreover, it also likely that the presence of the Laurentide ice-sheet substantially affected wind direction (Broccoli and Manabe, 1987; Klink, 1999; Bromwich et al., 2004, 2005; Löfverström and Lora, 2017). In modeling surface-wind directions during the LGM (∼20 ka to ∼12 ka), Löfverström and Lora (2017) determined that a more expansive Laurentide ice sheet (at ∼20 ka) and a diminished Laurentide ice sheet (at ∼12 ka) corresponded to mean surface wind directions that primarily flow from north to south and west to east, respectively, for the SHP during the winter. Using data from 1961 to 1990, Klink (1999) calculated that the SHP has a mean winter wind direction which flows from the southwest to the northeast. The combination of historical and modeled data sets suggests that the single-Pecos-sourced sediments of Phase I likely represent a time period when the Laurentide Ice sheet was substantially diminished, resulting in more winds from the southwest to carry Pecos sand. Moreover, this style of southerly derived material from the Pecos River Valley likely extended back into the late Miocene as recorded in the upper part of the underlying Ogallala Formation on the SHP (Gustavson and Holliday, 1999). A sole source is in contrast to the mixed sediments of Phases II and III, both of which likely represent periods where a larger Laurentide ice sheet resulted in a stronger north to south wind, which would have carried northerly derived silt to the SHP (Stine et al., 2020).
Gustavson and Holliday (1999) hypothesized a minimum age of at least ∼0.910 Ma for our Phase I strata based on: (1) the stratigraphic position below the consistently reverse polarity Paleosol 2, indicating a minimum age greater than ∼0.773 Ma (Patterson and Larson, 1990; Channell et al., 2020) ; and (2) the presence of well-developed Stage III-IV calcic horizons, which require a minimum of ∼50 ky to ∼100 ky to develop (Bachman and Machette, 1977; Machette, 1985). Moreover, the minimal weathering intensities indicated by our data set imply a minimal degree of soil welding, suggesting that the calcic horizons of Phase I did not develop contemporaneously. With these admittedly rough age controls, we tentatively interpret the lack of glacial loess and arid conditions of Phase I to be the result of having occurred prior to the onset of strong, well-developed 100 ka climate cycles in North America. However, until better age control is established, ambiguity exists on whether this correlates to a period prior to the MPT (at a time prior to ∼1.2 Ma) (Imbrie et al., 1993); or simply when the Laurentide ice sheet first demonstrated 100 ka cycles (at about 0.9 Ma) Balco and Rovey, 2010.
Using similar criteria as above, Phase II is interpreted to have occurred at about the time of the MPT (1.2 Ma–0.7 Ma). Marine isotope records from this period indicate the inception of 100 ka climate cycles as well as a general decreasing trend in stable isotope values, likely corresponding to a decreasing trend in global temperatures during this time period (Lisiecki and Raymo, 2005; Lowe and Walker, 2015). This implies that the onset of the MPT (1.2 Ma – 0.7 Ma) was a warmer time period than Post-MPT times (0.7 Ma – Modern) (Imbrie et al., 1993). On a regional scale, slightly warmer 100 k.y. glacial cycles may have resulted in different environments than colder counterparts in more recent times. If our initial MAT measurements prove to be correct than this could potentially provide an explanation for the change in precipitation in the SHP during the MPT. Rainfall can often result during weather fronts, which is when large hot and cold air masses interact (Barry and Chorley, 2010). Therefore, it is possible that the interaction between the colder air of the Laurentide ice sheet and the relatively warmer air of the SHP region could have resulted in an initial increase in precipitation during the MPT, although more sites and numerical models are needed in order to confirm this hypothesis. Alternatively, the increase in precipitation in the SHP during the MPT, could have been the result of either “squeezing” (Oster et al., 2015; Putnam, 2015) or “splitting” (COHMAP Members, 1988) of the westerlies jet stream, both of which have been cited as explanations for why other North American regions (i.e. Great Basin) were similarly more humid during glaciations (Putnam, 2015; Wang et al., 2021).
Finally, Phase III is interpreted to have occurred after the cessation of the MPT, and younger than ca. 0.773 Ma, when climate change was dominated by 100-ka cycles. Moreover, the lowering of MAT and MAP in this phase also agrees with post-MPT global climatic trends of lower global temperatures and more arid climates (Rea, 1994; Werner, 2002; Winkler et al., 2002; Martin, 2006; Sun et al., 2012; Yann et al., 2013; Lang et al., 2014). Assuming that future studies confirm our initial MAT results, then a regional decrease in annual temperature could provide a potential explanation for the increase in aridity. Colder air masses contain less moisture than their warmer counterparts, which results in less precipitation (Barry and Chorley, 2010). Therefore, it is possible that any weather front due to the interaction of Laurentide- and SHP- sourced air masses, could have resulted in less precipitation during Phase III than in Phase II, though once again confirmation of this hypothesis would require more sites and numerical models.
Despite the increase in aridity, climate models for the time of the LGM (Bromwich et al., 2004, 2005) have suggested that large post-MPT ice sheets would have resulted in relatively enhanced levels of precipitation for the SHP during the summer. Throughout the SHP and adjacent regions, increased seasonality is also evident in the proliferation of C4 plants, which preferentially develop in arid and semi-arid regions with wetter summers (Ehleringer et al., 1997; Huang et al., 2001; Edwards et al., 2010; Strömberg, 2011; Cotton et al., 2016; Green et al., 2017). Correlation of this numerical model and regional distribution of C4 plants with our observation of ultrafine SP/SSD magnetite in Phase III soils, could explain how precipitation became great enough in an otherwise arid environment to result in magnetic enhancement. Moreover, if Bromwich et al. (2004, 2005) ideas are indeed correct this would also support the hypothesis that the formation of magnetically enhancing, pedogenic magnetite is the result of increased seasonality as suggested by Balsam et al. (2004) and Zhang and Nie (2017).
Conclusions
Representative samples from all paleosols and the overlying Surficial Soil from the type-site of the BDF subjected to a range of both non-magnetic and magnetic experiments provide an improved understanding of the magnetic mineralogic cause of magnetic enhancement and magnetic depletion within the formation profile, observations which might be applied to similar sites. Results show a relatively uniform mineralogy, where the magnetic signal is dominated by partially maghemitized magnetite grains, despite the fact that the magnetic mineralogy is dominated by hematite, potentially sub-micron in size, in terms of weight/volume percent. Moreover, the presence of fine-grained hematite within all the samples, regardless of weathering intensity, as reported by (Stine et al., 2020), implies that the intensity of the magnetic signal (χ, ARM, IRM) with that magnetic enhancement and magnetic depletion are competing processes during soil development of the BDF. The dominating process is related to weathering intensity, which in turn is tentatively interpreted to be caused by MAP.
For the BDF at its type section, we have identified three environmental phases (I-III) which we tentatively correlate to the Middle-Pleistocene transition (MPT), a time period when the frequency of glacial-interglacial cycles shifted from a ∼41 k.y. cycle to a ∼100 k.y. cycle, between about 1.2 and 0.7 Ma (Imbrie et al., 1993). Phase I represents a relatively arid environment which occurred prior to the onset of the MPT. During this phase the dominance of ∼41-k.y cycles limited the growth of the Laurentide ice sheet, which allowed southwest to northeast winds to carry Pecos river sands to the SHP. Coarse magnetite grains were carried with the Pecos sands and preserved by the arid environment, resulting in a relative preservation of the magnetic signal.
Phase II represents a relatively subhumid to semiarid environment, which occurred during the onset of the MPT. During this phase the onset of ∼100-k.y. cycles allowed for the expansion of the Laurentide ice sheet. The presence of the ice sheet so far south resulted in stronger to south winds which deposited newly created loess onto the SHP, where it mixed with Pecos sands. An increase in precipitation levels resulted in the dissolution of eolian magnetic material and thus magnetic depletion. Though the source of this precipitation increase is difficult to explain, we tentatively propose that it is higher regional mean annual temperatures (MAT) and the larger Laurentide ice sheet. Nevertheless, the high error bars of our MAT calculations implies that future research should attempt different methods in order to determine MAT and confirm or deny our results.
Finally, Phase III represents a semiarid to arid environment, which occurred after the MPT was completed and ∼100-k.y. glacial-interglacial cycles dominated. Phase III is similar to Phase II, in that it is a mix of Pecos river sands and northern loess, likely due to the enhanced Laurentide ice sheet. Phase III represents a relatively intermediate level of precipitation; in that it is less than Phase II but greater than Phase I. This moderate level of precipitation resulted in the pedogenic neoformation of ultrafine SP and SSD magnetite which enhanced the magnetic signal.
The results of this research show that the magnetic signal of the SHP is the result of a complicated interaction between changing provenance and precipitation levels. Therefore, we recommend that, at least for the SHP, a holistic approach be taken in reconstructing paleoenvironment which incorporates rock-magnetic, geochemical, and microscopy observations.
Data Availability Statement
The raw data supporting the conclusions of this article will be made available by the authors, without undue reservation.
Author Contributions
All rock-magnetic data, including the SEM observations were collected by JS, all geochemical (oxide and trace element) and textural data was collected by HB. All geochemically based climofunctions were calculated by HB. JS and JG wrote and edited the manuscript with regards to the rock-magnetic data and interpretation JS and DS wrote and edited the manuscript with regards to the Geologic, sedimentologic, and paleoenvironmental background information. JS, JG, and DS wrote and edited the final to the final discussion sections. Figures 1–4, and Figures 15 were created and edited by JS, HB, and DS. Figures 4–14 were created and edited by JS and JG.
Funding
Research funding for JS includes: the Geological Society of America for Graduate Research Awards No. 11267-16 and No.12277-18, the Dr. Oscar Wilhelm Memorial Student Research Fund at the University of Texas at Dallas, and the Visiting Fellowship Awarded by the Institute for Rock Magnetism (IRM) at the University of Minnesota in October, 2018. The visiting fellowship awarded by IRM allowed for Travel and use of their rock-magnetic instrumentation. HB student research grant from the Southwest Section of the American Association of Petroleum Geology. Dr. JG Faculty Start-up support provided by the University of Texas at Dallas Dr. DS Faculty Start-up support provided by Texas Tech University.
Conflict of Interest
The authors declare that the research was conducted in the absence of any commercial or financial relationships that could be construed as a potential conflict of interest.
Acknowledgments
JS thanks the Geological Society of America for Graduate Research Awards no.11267-16 and no.12277-18. JS also acknowledges support awarded through the Dr. Oscar Wilhelm Memorial Student Research Fund at The University of Texas at Dallas (UTD). JS also would like to thank, Leah Thompson and Dr. Ignacio Pujano at UTD for all their help in preparing specimens and interpreting data from the Scanning Electron Microscope. JS would also like to thank the Institute for Rock Magnetism (IRM) at the University of Minnesota for awarding him a visiting fellowship in October, 2018. The visiting fellowship allowed JS to utilize their rock-magnetic instrumentation. The authors would also like to thank Joshua Feinberg (IRM), Dario Bilardello (IRM), and Bruce Moskowitz (IRM) for providing valuable insight on the interpretation of the low-temperature data gathered at the IRM. The IRM is a US National Multi-user Facility supported through the Instrumentation and Facilities Program of the National Science Foundation, Earth Sciences Division, and by funding from the University of Minnesota. HB appreciates the student research grant provided by the Southwest Section of the American Association of Petroleum Geology. JG and DS acknowledge faculty start-up support from UTD and Texas Tech University, respectively. We would also like to thank our three reviewers for their many helpful suggestions.
Supplementary Material
The Supplementary Material for this article can be found online at: https://www.frontiersin.org/articles/10.3389/feart.2021.601401/full#supplementary-material
References
Achakulwisut, P., Anenberg, S. C., Neumann, J. E., Penn, S. L., Weiss, N., Crimmins, A., et al. (2019). Effects of Increasing Aridity on Ambient Dust and Public Health in the U.S. Southwest under Climate Change. GeoHealth 3, 127–144. doi:10.1029/2019gh000187
Ao, H., Dekkers, M. J., Roberts, A. P., Rohling, E. J., An, Z., Liu, X., et al. (2017). Mineral Magnetic Record of the Miocene-Pliocene Climate Transition on the Chinese Loess Plateau, North China. Quat. Res. 89, 619–628. doi:10.1017/qua.2017.77
Armstrong-Altrin, J. S., Nagarajan, R., Madhavaraju, J., Rosalez-Hoz, L., Lee, Y. I., Balaram, V., et al. (2013). Geochemistry of the Jurassic and Upper Cretaceous Shales from the Molango Region, Hidalgo, Eastern Mexico: Implications for Source-Area Weathering, Provenance, and Tectonic Setting. Comptes Rendus Geosci. 345, 185–202. doi:10.1016/j.crte.2013.03.004
Bachman, G. 0, and Machette, M. N. (1977). Calcic Soils and Calcretes in the Southwestern United States. Available at: https://pubs.usgs.gov/of/1977/0794/report.pdf (Accessed April 2, 2021). doi:10.3133/ofr77794
Balco, G., and Rovey, C. W. (2010). Absolute Chronology for Major Pleistocene Advances of the Laurentide Ice Sheet. Geology 38, 795–798. doi:10.1130/G30946.1
Balco, G., Rovey, C. W., and Stone, J. O. H. (2005). The First Glacial Maximum in North America. Science 307, 222. doi:10.1126/science.1103406
Balsam, W., Ji, J., and Chen, J. (2004). Climatic Interpretation of the Luochuan and Lingtai Loess Sections, China, Based on Changing Iron Oxide Mineralogy and Magnetic Susceptibility. Earth Planet. Sci. Lett. 223, 335–348. doi:10.1016/j.epsl.2004.04.023
Balsam, W. L., Ellwood, B. B., Ji, J., Williams, E. R., Long, X., and el Hassani, A. (2011). Magnetic Susceptibility as a Proxy for Rainfall: Worldwide Data from Tropical and Temperate Climate. Quat. Sci. Rev. 30, 2732–2744. doi:10.1016/j.quascirev.2011.06.002
Barry, R. G., and Chorley, R. J. (2010). Atmosphere, Weather, and Climate. 9th ed. New York: Routledge: Taylor & Francis Group.
Batchelor, C. L., Margold, M., Krapp, M., Murton, D. K., Dalton, A. S., Gibbard, P. L., et al. (2019). The Configuration of Northern Hemisphere Ice Sheets through the Quaternary. Nat. Commun. 10, 1–10. doi:10.1038/s41467-019-11601-2
Berger, W. H., and Jansen, E. (1994b). in The Polar Oceans and Their Role in Shaping the Global Environment. Editors O. M. Johannessen, R. D. Muench, and J. E. Overland. 1st ed. (Washington D.C.: American Geophysical Union). doi:10.1029/GM085
Berger, W. H., and Jansen, E. (1994a). Fourier Stratigraphy: Spectral Gain Adjustment of Orbital Ice Mass Models as an Aid in Dating Late Neogene Deep-Sea Sediments. Paleoceanography 9, 693–703. doi:10.1029/94PA01454
Bhattacharya, T., Tierney, J. E., Addison, J. A., and Murray, J. W. (2018). Ice-sheet Modulation of Deglacial North American Monsoon Intensification. Nat. Geosci. 11, 848–852. doi:10.1038/s41561-018-0220-7
Bhattacharya, T., Tierney, J. E., and DiNezio, P. (2017). Glacial Reduction of the North American Monsoon via Surface Cooling and Atmospheric Ventilation. Geophys. Res. Lett. 44, 5113–5122. doi:10.1002/2017GL073632
Bird, A., Millar, I., Rodenburg, T., Stevens, T., Rittner, M., Vermeesch, P., et al. (2020). A Constant Chinese Loess Plateau Dust Source since the Late Miocene. Quat. Sci. Rev. 227, 106042. doi:10.1016/j.quascirev.2019.106042
Bloemendal, J., King, J. W., Hall, F. R., and Doh, S.-J. (1992). Rock Magnetism of Late Neogene and Pleistocene Deep-Sea Sediments: Relationship to Sediment Source, Diagenetic Processes, and Sediment Lithology. J. Geophys. Res. 97, 4361–4375. doi:10.1029/91JB03068
Broccoli, A. J., and Manabe, S. (1987). The Effects of the Laurentide Ice Sheet on North American Climate during the Last Glacial Maximum. Gpq 41, 291–299. doi:10.7202/032684ar
Bromwich, D. H., Toracinta, E. R., Oglesby, R. J., Fastook, J. L., and Hughes, T. J. (2005). LGM Summer Climate on the Southern Margin of the Laurentide Ice Sheet: Wet or Dry?*. J. Clim. 18, 3317–3338. doi:10.1175/JCLI3480.1
Bromwich, D. H., Toracinta, E. R., Wei, H., Oglesby, R. J., Fastook, J. L., and Hughes, T. J. (2004). Polar MM5 Simulations of the Winter Climate of the Laurentide Ice Sheet at the LGM*. J. Clim. 17, 3415–3433. doi:10.1175/1520-0442(2004)017<3415:PMSOTW>2.0.CO;210.1175/1520-0442(2004)017<3415:pmsotw>2.0.co;2
Channell, J. E. T., Singer, B. S., and Jicha, B. R. (2020). Timing of Quaternary Geomagnetic Reversals and Excursions in Volcanic and Sedimentary Archives. Quat. Sci. Rev. 228, 106114. doi:10.1016/j.quascirev.2019.106114
Chaparro, M. A. E., Moralejodel, M. d. P. P., Böhnel, H. N., and Acebal, S. G. (2020). Iron Oxide Mineralogy in Mollisols, Aridisols and Entisols from Southwestern Pampean Region (Argentina) by Environmental Magnetism Approach. Catena 190, 104534. doi:10.1016/j.catena.2020.104534
Chebykin, E. P., Edgington, D. N., Grachev, M. A., Zheleznyakova, T. O., Vorobyova, S. S., Kulikova, N. S., et al. (2002). Abrupt Increase in Precipitation and Weathering of Soils in East Siberia Coincident with the End of the Last Glaciation (15 Cal Kyr BP). Earth Planet. Sci. Lett. 200, 167–175. doi:10.1016/S0012-821X(02)00588-5
Chen, L. M., Zhang, G. L., Rossiter, D. G., and Cao, Z. H. (2015). Magnetic Depletion and Enhancement in the Evolution of Paddy and Non-paddy Soil Chronosequences. Eur. J. Soil Sci. 66, 886–897. doi:10.1111/ejss.12281
Chlachula, J., Evans, M. E., and Rutter, N. W. (1998). A Magnetic Investigation of a Late Quaternary Loess/palaeosol Record in Siberia. Geophys. J. Int. 132, 128–132. doi:10.1046/j.1365-246x.1998.00399.x
Chlachula, J., and Little, E. (2011). A High-Resolution Late Quaternary Climatostratigraphic Record from Iskitim, Priobie Loess Plateau, SW Siberia. Quat. Int. 240, 139–149. doi:10.1016/j.quaint.2011.01.045
Chlachula, J., Rutter, N. W., and Evans, M. E. (1997). A Late Quaternary Loess - Paleosol Record at Kurtak, Southern Siberia. Can. J. Earth Sci. 34, 679–686. doi:10.1139/e17-054
Chlachula, J. (2003). The Siberian Loess Record and its Significance for Reconstruction of Pleistocene Climate Change in north-central Asia. Quat. Sci. Rev. 22, 1879–1906. doi:10.1016/S0277-3791(03)00182-3
Clark, P. U., Archer, D., Pollard, D., Blum, J. D., Rial, J. A., Brovkin, V., et al. (2006). The Middle Pleistocene Transition: Characteristics, Mechanisms, and Implications for Long-Term Changes in Atmospheric pCO2. Quat. Sci. Rev. 25, 3150–3184. doi:10.1016/j.quascirev.2006.07.008
Coe, R. S., Singer, B. S., Pringle, M. S., and Zhao, X. (2004). Matuyama-Brunhes Reversal and Kamikatsura Event on Maui: Paleomagnetic Directions, 40 Ar/ 39 Ar Ages and Implications. Earth Planet. Sci. Lett. 222, 667–684. doi:10.1016/j.epsl.2004.03.003
COHMAP Members (1988). Climatic Changes of the Last 18,000 Years: Observations and Model Simulations. Science 241, 1043–1052. doi:10.1126/science.241.4869.1043
Condie, K. C. (1993). Chemical Composition and Evolution of the Upper continental Crust: Contrasting Results from Surface Samples and Shales. Chem. Geology. 104, 1–37. doi:10.1016/0009-2541(93)90140-E
Cornell, R. M., and Schwertmann, U. (2006). The Iron Oxides: Structure, Properties, Reactions, Occurrences and Uses, 2nd, Completely Revised and Extended Edition. 2nd ed. Heppenheim, Germany: Wiley.
Cotton, J. M., Cerling, T. E., Hoppe, K. A., Mosier, T. M., and Still, C. J. (2016). Climate, CO2, and the History of North American Grasses since the Last Glacial Maximum. Sci. Adv. 2, e1501346. doi:10.1126/sciadv.1501346
Crabtree, G. W. (2005). Dustfall on the Southern High Plains of Texas. Available at: https://ttu-ir.tdl.org/bitstream/handle/2346/1225/DustfallOnTheSouthernHighPlainsOfTexas.pdf?sequence=1 (Accessed April 2, 2021). doi:10.1002/0471718769
Cui, Y., Verosub, K. L., and Roberts, A. P. (1994). The Effect of Low-Temperature Oxidation on Large Multi-Domain Magnetite. Geophys. Res. Lett. 21, 757–760. doi:10.1029/94GL00639
Day, R., Fuller, M., and Schmidt, V. A. (1977). Hysteresis Properties of Titanomagnetites: Grain-Size and Compositional Dependence. Phys. Earth Planet. Interiors 13, 260–267. doi:10.1016/0031-9201(77)90108-X
de Grave, E., Barrero, C. A., da Costa, G. M., Vandenberghe, R. E., and van San, E. (2002). Mössbauer Spectra of α- and γ-polymorphs of FeOOH and Fe2O3 : Effects of Poor Crystallinity and of Al-For-Fe Substitution. Clay miner. 37, 591–606. doi:10.1180/0009855023740062
de Grave, E., and Vandenberghe, R. E. (1990). Mössbauer Effect Study of the Spin Structure in Natural Hematites. Phys. Chem. Minerals 17, 344–352. doi:10.1007/BF00200130
Dekkers, M. J. (1989a). Magnetic Properties of Natural Goethite-I. Grain-Size Dependence of Some Low- and High-Field Related Rockmagnetic Parameters Measured at Room Temperature. Geophys. J. Int. 97, 323–340. doi:10.1111/j.1365-246X.1989.tb00504.x
Dekkers, M. J. (1989b). Magnetic Properties of Natural Goethite-II. TRM Behaviour during Thermal and Alternating Field Demagnetization and Low-Temperature Treatment. Geophys. J. Int. 97, 341–355. doi:10.1111/j.1365-246X.1989.tb00505.x
Dunlop, D. J. (1986). Hysteresis Properties of Magnetite and Their Dependence on Particle Size: A Test of Pseudo-single-domain Remanence Models. J. Geophys. Res. 91, 9569. doi:10.1029/jb091ib09p09569
Dunlop, D. J., and Özdemir, Ö. (1997). Rock Magnetism: Fundamentals and Frontiers. 1st Edn. Cambridge, United Kingdom: Cambridge University Press. doi:10.1017/CBO9780511612794
Dunlop, D. J., and Özdemir, Ö. (2018). Remanence Cycling of 0.6-135 Μm Magnetites across the Verwey Transition. Earth Planets Space 70, 164. doi:10.1186/s40623-018-0928-z
Dunlop, D. J. (2002a). Theory and Application of the Day Plot (Mrs/Ms versus Hcr/Hc) 1. Theoretical Curves and Tests Using Titanomagnetite Data. J. Geophys. Res. 107, 1–22. doi:10.1029/2001jb000486
Dunlop, D. J. (2002b). Theory and Application of the Day Plot (Mrs/Ms versus Hcr/Hc) 2. Application to Data for Rocks, Sediments, and Soils. J. Geophys. Res. 107, 1–15. doi:10.1029/2001jb000487
Dyke, A. S., Andrews, J. T., Clark, P. U., England, J. H., Miller, G. H., Shaw, J., et al. (2002). The Laurentide and Innuitian Ice Sheets during the Last Glacial Maximum. Quat. Sci. Rev. 21, 9–31. doi:10.1016/S0277-3791(01)00095-6
Edwards, E. J., Osborne, C. P., Strömberg, C. A. E., Smith, S. A., Bond, W. J., Christin, P. A., et al. (2010). The Origins of C4 Grasslands: Integrating Evolutionary and Ecosystem Science. Science 328, 587–591. doi:10.1126/science.1177216
Egli, R. (2004). Characterization of Individual Rock Magnetic Components by Analysis of Remanence Curves, 1. Unmixing Natural Sediments. Studia Geophysica et Geodaetica 48, 391–446. doi:10.1023/B:SGEG.0000020839.45304.6d
Egli, R., Chen, A. P., Winklhofer, M., Kodama, K. P., and Horng, C.-S. (2010). Detection of Noninteracting Single Domain Particles Using First-Order Reversal Curve Diagrams. Geochem. Geophys. Geosyst. 11, a–n. doi:10.1029/2009gc002916
Egli, R. (2013). VARIFORC: An Optimized Protocol for Calculating Non-regular First-Order Reversal Curve (FORC) Diagrams. Glob. Planet. Change 110, 302–320. doi:10.1016/j.gloplacha.2013.08.003
Egli, R., and Winklhofer, M. (2014). “Recent Developments on Processing and Interpretation Aspects of First-Order Reversal Curves (FORC),” in Natural Science Series, Ученые записки Казанского университета (Scientific Notes of the Kazan University). Available at: http://kpfu.ru/uz-rus/ns 15614–53
Ehleringer, J. R., Cerling, T. E., and Helliker, B. R. (1997). C 4 Photosynthesis, Atmospheric CO 2, and Climate. Oecologia 112, 285–299. doi:10.1007/s004420050311
Eichler, C. (2020). Determining the Source of the Ogallala Formation: Sedimentary Petrology of the Ogallala Formation, Southern High Plains, West Texas and Eastern New Mexico. Doctoral Dissertation. Lubbock (TX): Tech University Geosciences Department.
Elderfield, H., Ferretti, P., Greaves, M., Crowhurst, S., McCave, I. N., Hodell, D., et al. (2012). Evolution of Ocean Temperature and Ice Volume through the Mid-pleistocene Climate Transition. Science 337, 704–709. doi:10.1126/science.1221294
Evans, M., and Heller, F. (2003). Environmental Magnetism: Principles and Applications of Enviromagnetics. 1st Edn. San Diego, CA: Elsevier Science.
Eyre, J. K., and Shaw, J. (1994). Magnetic Enhancement of Chinese Loess-The Role of γFe2O3? Geophys. J. Int. 117, 265–271. doi:10.1111/j.1365-246X.1994.tb03317.x
Fabian, K., McEnroe, S. A., Robinson, P., and Shcherbakov, V. P. (2008). Exchange Bias Identifies Lamellar Magnetism as the Origin of the Natural Remanent Magnetization in Titanohematite With Ilmenite Exsolution from Modum, Norway. Earth Planet. Sci. Lett. 268, 339–358. doi:10.1016/j.epsl.2008.01.034
Fabian, K., Shcherbakov, V. P., and McEnroe, S. A. (2013). Measuring the Curie Temperature. Geochem. Geophys. Geosyst. 14, 947–961. doi:10.1029/2012GC004440
Frey, P. A., and Reed, G. H. (2012). The Ubiquity of Iron. ACS Chem. Biol. 7, 1477–1481. doi:10.1021/cb300323q
Gehring, A. U., Fischer, H., Louvel, M., Kunze, K., and Weidler, P. G. (2009). High Temperature Stability of Natural Maghemite: A Magnetic and Spectroscopic Study. Geophys. J. Int. 179, 1361–1371. doi:10.1111/j.1365-246X.2009.04348.x
Geiss, C. E., and Zanner, C. W. (2006). How Abundant Is Pedogenic Magnetite? Abundance and Grain Size Estimates for Loessic Soils Based on Rock Magnetic Analyses. J. Geophys. Res. 111, a–n. doi:10.1029/2006JB004564
Ginoux, P., Prospero, J. M., Gill, T. E., Hsu, N. C., and Zhao, M. (2012). Global-scale Attribution of Anthropogenic and Natural Dust Sources and Their Emission Rates Based on MODIS Deep Blue Aerosol Products. Rev. Geophys. 50, 3005. doi:10.1029/2012RG000388
Green, J. K., Konings, A. G., Alemohammad, S. H., Berry, J., Entekhabi, D., Kolassa, J., et al. (2017). Regionally strong Feedbacks between the Atmosphere and Terrestrial Biosphere. Nat. Geosci 10, 410–414. doi:10.1038/ngeo2957
Gustavson, T. C., and Holliday, V. T. (1999). Eolian Sedimentation and Soil Development on a Semiarid to Subhumid Grassland, Tertiary ogallala and Quaternary blackwater Draw Formations, Texas and New Mexico High plains. J. Sediment. Res. 69, 622–634. doi:10.2110/jsr.69.622
Guyodo, Y., LaPara, T. M., Anschutz, A. J., Penn, R. L., Banerjee, S. K., Geiss, C. E., et al. (2006). Rock Magnetic, Chemical and Bacterial Community Analysis of a Modern Soil from Nebraska. Earth Planet. Sci. Lett. 251, 168–178. doi:10.1016/j.epsl.2006.09.005
Guyodo, Y., Mostrom, A., Lee Penn, R., and Banerjee, S. K. (2003). From Nanodots to Nanorods: Oriented Aggregation and Magnetic Evolution of Nanocrystalline Goethite. Geophys. Res. Lett. 30.Available at: http://doi.wiley.com/10.1029/2003GL017021 (Accessed February 7, 2021). doi:10.1029/2003gl017021
Haltia, E. M., and Nowaczyk, N. R. (2014). Magnetostratigraphy of Sediments from Lake El'gygytgyn ICDP Site 5011-1: Paleomagnetic Age Constraints for the Longest Paleoclimate Record from the continental Arctic. Clim. Past 10, 623–642. doi:10.5194/cp-10-623-2014
Hanesch, M., Stanjek, H., and Petersen, N. (2006). Thermomagnetic Measurements of Soil Iron Minerals: The Role of Organic Carbon. Geophys. J. Int. 165, 53–61. doi:10.1111/j.1365-246X.2006.02933.x
Harrison, R. J., and Feinberg, J. M. (2008). FORCinel: An Improved Algorithm for Calculating First-Order Reversal Curve Distributions Using Locally Weighted Regression Smoothing. Geochem. Geophys. Geosyst. 9, a–n. doi:10.1029/2008GC001987
Head, M. J., and Gibbard, P. L. (2005). Early-Middle Pleistocene Transitions: an Overview and Recommendation for the Defining Boundary. Geol. Soc. Lond. Spec. Publications 247, 1–18. doi:10.1144/GSL.SP.2005.247.01.01
Heider, F., Zitzelsberger, A., and Fabian, K. (1996). Magnetic Susceptibility and Remanent Coercive Force in Grown Magnetite Crystals from 0.1 μm to 6 Mm. Phys. Earth Planet. Interiors 93, 239–256. doi:10.1016/0031-9201(95)03071-9
Heller, F., and Tungsheng, L. (1984). Magnetism of Chinese Loess Deposits. Geophys. J. Int. 77, 125–141. doi:10.1111/j.1365-246X.1984.tb01928.x
Herron, M. M. (1988). Geochemical Classification of Terrigenous Sands and Shales from Core or Log Data. J. Sediment. Petrol. 58, 820–829. doi:10.1306/212f8e77-2b24-11d7-8648000102c1865d
Holliday, V. T., Hovorka, S. D., and Gustavson, T. C. (1996b). Lithostratigraphy and Geochronology of Fills in Small Playa Basins on the Southern High Plains, United States. Bull. Geol. Soc. America 108, 0953–0965. doi:10.1130/0016-7606(1996)108<0953:LAGOFI>2.3.CO;210.1130/0016-7606(1996)108<0953:lagofi>2.3.co;2
Holliday, V. T., Hovorka, S. D., and Gustavson, T. C. (1996a). Stratigraphy and Geochronology of Playa Fills on the Southern High Plains. Geol. Soc. America Bull. 108, 0953–0965. doi:10.1130/0016-7606(1996)108<0953:lagofi>2.3.co10.1130/0016-7606(1996)108<0953:lagofi>2.3.co;2
Holliday, V. T., Mayer, J. H., and Fredlund, G. G. (2008). Late Quaternary Sedimentology and Geochronology of Small Playas on the Southern High Plains, Texas and New Mexico, U.S.A. Quat. Res. 70, 11–25. doi:10.1016/j.yqres.2008.02.009
Holliday, V. T. (1997). Origin and Evolution of Lunettes on the High plains of Texas and New Mexico. Quat. Res. 47, 54–69. doi:10.1006/qres.1996.1872
Holliday, V. T. (1989). The Blackwater Draw Formation (Quaternary): A 1-4-plus-m.Y. Record of Eolian Sedimentation and Soil Formation on the Southern High Plains. Geol. Soc. America Bull. 101, 1598–1607. doi:10.1130/0016-7606(1989)101<1598:TBDFQA>2.3.CO;210.1130/0016-7606(1989)101<1598:tbdfqa>2.3.co;2
Hovorka, S. (1995). Quaternary Evolution of Playa Lakes on the Southern High Plains--A Case Study from the Amarillo Area, Texas. Rep. Invest. – Univ. Tex. Austin, Bur. Econ. Geology. 236, 1–52. doi:10.23867/ri0236d
Hrouda, F. (2011). Models of Frequency-dependent Susceptibility of Rocks and Soils Revisited and Broadened. Geophys. J. Int. 187, 1259–1269. doi:10.1111/j.1365-246X.2011.05227.x
Huang, Y., Street-Perrott, F. A., Metcalfe, S. E., Brenner, M., Moreland, M., and Freeman, K. H. (2001). Climate Change as the Dominant Control on Glacial-Interglacial Variations in C3 and C4 Plant Abundance. Science 293, 1647–1651. doi:10.1126/science.1060143
Hughes, P. D., and Gibbard, P. L. (2018). Global Glacier Dynamics during 100 Ka Pleistocene Glacial Cycles. Quat. Res. 90, 222–243. doi:10.1017/qua.2018.37
Imbrie, J., Berger, A., Boyle, E. A., Clemens, S. C., Duffy, A., Howard, W. R., et al. (1993). On the Structure and Origin of Major Glaciation Cycles 2. The 100,000-year Cycle. Paleoceanography 8, 699–735. doi:10.1029/93PA02751
Ishikawa, Y., and Akimoto, S. I. (1957). Magnetic Properties of the FeTi03-Fe203 Solid Solution Series. J. Phys. Soc. Jpn. 12, 1083–1098. doi:10.1143/JPSJ.12.1083
Izett, G. A., Wilcox, R. E., and Borchardt, G. A. (1972). Correlation of a Volcanic Ash Bed in Pleistocene Deposits Near Mount Blanco, Texas, with the Guaje Pumice Bed of the Jemez Mountains, New Mexico. Quat. Res. 2, 554–578. doi:10.1016/0033-5894(72)90091-9
Jeleńska, M., Hasso-Agopsowicz, A., and Kopcewicz, B. (2010). Thermally Induced Transformation of Magnetic Minerals in Soil Based on Rock Magnetic Study and Mössbauer Analysis. Phys. Earth Planet. Interiors 179, 164–177. doi:10.1016/j.pepi.2009.11.004
Jennings, C. E., Aber, J. S., Balco, G., Barendregt, R., Bierman, P. R., Rovey, C. W., et al. (2013). “Mid-quaternary in North America,” in Encyclopedia Of Quaternary Science. Editors S. J. Elias, G. J. Mock, D. M. Anderson, A. Beaudoin, H. H. Birks, E. Brooket al. (Amsterdam, Netherlands: Elsevier Inc.), 180–186. doi:10.1016/B978-0-444-53643-3.00124-2
Jiang, Z., Liu, Q., Dekkers, M. J., Colombo, C., Yu, Y., Barrón, V., et al. (2014). Ferro and Antiferromagnetism of Ultrafine-Grained Hematite. Geochem. Geophys. Geosyst. 15, 2699–2712. doi:10.1002/2014GC005377
Jiang, Z., Liu, Q., Roberts, A. P., Barrón, V., Torrent, J., and Zhang, Q. (2018). A New Model for Transformation of Ferrihydrite to Hematite in Soils and Sediments. Geology 46, 987–990. doi:10.1130/G45386.1
Johnson, H. P., and Merrill, R. T. (1973). Low-temperature Oxidation of a Titanomagnetite and the Implications for Paleomagnetism. J. Geophys. Res. 78, 4938–4949. Available at: http://doi.wiley.com/10.1029/JB078i023p04938 (Accessed February 7, 2021). doi:10.1029/jb078i023p04938
Jordanova, N. (2016). Soil Magnetism: Applications in Pedology, Environmental Science and Agriculture. 2nd ed. San Diego, USA: Elsevier Science Publishing Co Inc. Available at: https://www.sciencedirect.com/book/9780128092392/soil-magnetism (Accessed February 7, 2021).
Kämpf, N., and Schwertmann, U. (1983). Goethite and Hematite in a Climosequence in Southern Brazil and Their Application in Classification of Kaolinitic Soils. Geoderma 29, 27–39. doi:10.1016/0016-7061(83)90028-9
Kandakji, T., Gill, T. E., and Lee, J. A. (2020). Identifying and Characterizing Dust point Sources in the Southwestern United States Using Remote Sensing and GIS. Geomorphology 353, 107019. doi:10.1016/j.geomorph.2019.107019
Karumuri, S. R., Kumar, A., Varma, M., Choudary, G., and Rao, K. H. (2009). Cation Distribution of Titanium Substituted Cobalt Ferrites. J. Alloys Compd. 488. doi:10.1016/j.jallcom.2009.08.086
Klein, C., and Dutrow, B. (2007). Manual of Mineral Science. 23rd ed.. Hoboken, NJ: John Wiley & Sons. Available at: https://books.google.com/books?id=kj5NuwEACAAJ.
Klink, K. (1999). Climatological Mean and Interannual Variance of United States Surface Wind Speed, Direction and Velocity. Int. J. Climatol. 19, 471–488. doi:10.1002/(SICI)1097-0088(199904)19:5<471::AID-JOC367>3.0.CO;2-X10.1002/(sici)1097-0088(199904)19:5<471::aid-joc367>3.0.co;2-x
Kravchinsky, V. A., Zykina, V. S., and Zykin, V. S. (2008). Magnetic Indicator of Global Paleoclimate Cycles in Siberian Loess-Paleosol Sequences. Earth Planet. Sci. Lett. 265, 498–514. doi:10.1016/j.epsl.2007.10.031
Kukla, G., Heller, F., Liu Xiu Ming, Xu Tong Chun, L. X., ChunSheng, X. T. L. T., and Sheng, A. Z. (1988). Pleistocene Climates in China Dated by Magnetic Susceptibility. Geol. 16, 811–814. doi:10.1130/0091-7613(1988)016<0811:PCICDB>2.3.CO;2.10.1130/0091-7613(1988)016<0811:pcicdb>2.3.co;2
Lagroix, F., and Guyodo, Y. (2017). A New Tool for Separating the Magnetic Mineralogy of Complex Mineral Assemblages from Low Temperature Magnetic Behavior. Front. Earth Sci. 5, 61. doi:10.3389/feart.2017.00061
Lagroix, F., Guyodo, Y., Till, J. L., and Naess, N. (2014). Magnetic mineral Separation: a Timeless challenge for an Experimental Rock Magnetist. Available at: https://ui.adsabs.harvard.edu/abs/2014EGUGA..16.3819L/abstract (Accessed February 7, 2021).
Lang, D. C., Bailey, I., Wilson, P. A., Beer, C. J., Bolton, C. T., Friedrich, O., et al. (2014). The Transition on North America from the Warm Humid Pliocene to the Glaciated Quaternary Traced by Eolian Dust Deposition at a Benchmark North Atlantic Ocean Drill Site. Quat. Sci. Rev. 93, 125–141. doi:10.1016/j.quascirev.2014.04.005
Lascu, I., and Feinberg, J. M. (2011). Speleothem Magnetism. Quat. Sci. Rev. 30, 3306–3320. doi:10.1016/j.quascirev.2011.08.004
Lattard, D., Engelmann, R., Kontny, A., and Sauerzapf, U. (2006). Curie Temperatures of Synthetic Titanomagnetites in the Fe-Ti-O System: Effects of Composition, crystal Chemistry, and Thermomagnetic Methods. J. Geophys. Res. 111, a–n. doi:10.1029/2006JB004591
Lee, J. A., Baddock, M. C., Mbuh, M. J., and Gill, T. E. (2012). Geomorphic and Land Cover Characteristics of Aeolian Dust Sources in West Texas and Eastern New Mexico, USA. Aeolian Res. 3, 459–466. doi:10.1016/j.aeolia.2011.08.001
Lee, J. A., Evan Moffett, K., Allen, B. L., Peterson, R. E., and Gregory, J. M. (1994). Environmental Controls on Blowing Dust Direction at lubbock, Texas, U.S.A. Earth Surf. Process. Landforms 19, 437–449. doi:10.1002/esp.3290190505
Lee, J. A., Gill, T. E., Mulligan, K. R., Dominguez Acosta, M., and Perez, A. E. (2009). Land Use/land Cover and point Sources of the 15 December 2003 Dust Storm in Southwestern North America. Geomorphology 105, 18–27. doi:10.1016/j.geomorph.2007.12.016
Lemmen, D. S., Duk-Rodkin, A., and Bednarski, J. M. (1994). Late Glacial Drainage Systems along the Northwestern Margin of the Laurentide Ice Sheet. Quat. Sci. Rev. 13, 805–828. doi:10.1016/0277-3791(94)90003-5
Levi, S., and Merrill, R. T. (1978). Properties of Single-Domain, Pseudo-single-domain, and Multidomain Magnetite. J. Geophys. Res. 83, 309. doi:10.1029/jb083ib01p00309
Li, J., Kandakji, T., Lee, J. A., Tatarko, J., Blackwell, J., Gill, T. E., et al. (2018). Blowing Dust and Highway Safety in the Southwestern United States: Characteristics of Dust Emission “Hotspots” and Management Implications. Sci. Total Environ. 621, 1023–1032. doi:10.1016/j.scitotenv.2017.10.124
Li, Y., Shi, W., Aydin, A., Beroya-Eitner, M. A., and Gao, G. (2020). Loess Genesis and Worldwide Distribution. Earth-Science Rev. 201, 102947. doi:10.1016/j.earscirev.2019.102947
Lisiecki, L. E. (2010). Links between Eccentricity Forcing and the 100,000-year Glacial Cycle. Nat. Geosci. 3, 349–352. doi:10.1038/ngeo828
Lisiecki, L. E., and Raymo, M. E. (2005). A Pliocene-Pleistocene Stack of 57 Globally Distributed Benthic δ18O Records. Paleoceanography 20, a–n. doi:10.1029/2004PA00107110.1029/2004pa001071
Liu, C., Deng, C., and Liu, Q. (2012). Mineral Magnetic Studies of the Vermiculated Red Soils in Southeast China and Their Paleoclimatic Significance. Palaeogeogr. Palaeoclimatol. Palaeoecol. 329-330, 173–183. doi:10.1016/j.palaeo.2012.02.035
Liu, Q., Banerjee, S. K., Jackson, M. J., Chen, F., Pan, Y., and Zhu, R. (2003). An Integrated Study of the Grain-size-dependent Magnetic Mineralogy of the Chinese Loess/paleosol and its Environmental Significance. J. Geophys. Res. 108, 2437. doi:10.1029/2002jb002264
Liu, Q., Deng, C., Torrent, J., and Zhu, R. (2007a). Review of Recent Developments in mineral Magnetism of the Chinese Loess. Quat. Sci. Rev. 26, 368–385. doi:10.1016/j.quascirev.2006.08.004
Liu, Q. (2004). Grain Sizes of Susceptibility and Anhysteretic Remanent Magnetization Carriers in Chinese Loess/paleosol Sequences. J. Geophys. Res. 109, B03101. doi:10.1029/2003jb002747
Liu, Q., Jackson, M. J., Banerjee, S. K., Maher, B. A., Deng, C., Pan, Y., et al. (2004a). Mechanism of the Magnetic Susceptibility Enhancements of the Chinese Loess. J. Geophys. Res. 109, 1–16. doi:10.1029/2004JB003249
Liu, Q., Jackson, M. J., Yu, Y., Chen, F., Deng, C., and Zhu, R. (2004b). Grain Size Distribution of Pedogenic Magnetic Particles in Chinese Loess/paleosols. Geophys. Res. Lett. 31, 1–4. doi:10.1029/2004GL021090
Liu, Q., Roberts, A. P., Torrent, J., Horng, C.-S., and Larrasoaña, J. C. (2007b). What Do the HIRM andS-Ratio Really Measure in Environmental Magnetism? Geochem. Geophys. Geosyst. 8, a–n. doi:10.1029/2007GC001717
Liu, Q., Yu, Y., Torrent, J., Roberts, A. P., Pan, Y., and Zhu, R. (2006). Characteristic Low-Temperature Magnetic Properties of Aluminous Goethite [α-(Fe, Al)OOH] Explained. J. Geophys. Res. 111, a–n. doi:10.1029/2006JB004560
Liu, X., Liu, T., Paul, H., Xia, D., Jiri, C., and Wang, G. (2008). Two Pedogenic Models for Paleoclimatic Records of Magnetic Susceptibility from Chinese and Siberian Loess. Sci. China Ser. D-earth Sci. 51, 284–293. doi:10.1007/s11430-007-0145-2
Liu, X., Liu, Z., Lü, B., Marković, S. B., Chen, J., Guo, H., et al. (2013). The Magnetic Properties of Serbian Loess and its Environmental Significance. Chin. Sci. Bull. 58, 353–363. doi:10.1007/s11434-012-5383-9
Liu, X. M., Hesse, P., and Rolph, T. (1999). Origin of Maghaemite in Chinese Loess Deposits: Aeolian or Pedogenic? Phys. Earth Planet. Interiors 112, 191–201. doi:10.1016/S0031-9201(99)00002-3
Liu, X. M., Xia, D. S., and Liu, T. S. (2007). Discussion on Two Models of Paleoclimatic Records of Magnetic Susceptibility of Alaskan and Chinese Loess (In Chinese). Quaternary 27, 210–220.
Liu, X., Shaw, J., Jiang, J., Bloemendal, J., Hesse, P., Rolph, T., et al. (2010). Analysis on Variety and Characteristics of Maghemite. Sci. China Earth Sci. 53, 1153–1162. doi:10.1007/s11430-010-0030-2
Liu, X., Shaw, J., Liu, T., Heller, F., and Yuan, B. (1992). Magnetic Mineralogy of Chinese Loess and its Significance. Geophys. J. Int. 108, 301–308. doi:10.1111/j.1365-246X.1992.tb00859.x
Löfverström, M., and Lora, J. M. (2017). Abrupt Regime Shifts in the North Atlantic Atmospheric Circulation over the Last Deglaciation. Geophys. Res. Lett. 44, 8047–8055. doi:10.1002/2017GL074274
Lowe, J., and Walker, M. (2015). Reconstructing Quaternary Environments. 3rd ed. London, United Kingdom: Routledge, Taylor & Francis Group.
Lowrie, W. (1990). Identification of Ferromagnetic Minerals in a Rock by Coercivity and Unblocking Temperature Properties. Geophys. Res. Lett. 17, 159–162. doi:10.1029/GL017i002p00159
Lu, S.-G., Zhu, L., and Yu, J.-Y. (2012). Mineral Magnetic Properties of Chinese Paddy Soils and its Pedogenic Implications. Catena 93, 9–17. doi:10.1016/j.catena.2012.01.002
Machette, M. N. (1985). Calcic Soils of the Southwestern United States. Spec. Paper Geol. Soc. America 203, 1–22. doi:10.1130/SPE203-p1
Maher, B. A., Alekseev, A., and Alekseeva, T. (2003a). Magnetic Mineralogy of Soils across the Russian Steppe: Climatic Dependence of Pedogenic Magnetite Formation. Palaeogeogr. Palaeoclimatol. Palaeoecol. 201, 321–341. doi:10.1016/S0031-0182(03)00618-7
Maher, B. A. (1986). Characterisation of Soils by mineral Magnetic Measurements. Phys. Earth Planet. Interiors 42, 76–92. doi:10.1016/S0031-9201(86)80010-3
Maher, B. A. (1998). Magnetic Properties of Modern Soils and Quaternary Loessic Paleosols: Paleoclimatic Implications. Palaeogeogr. Palaeoclimatol. Palaeoecol. 137, 25–54. doi:10.1016/S0031-0182(97)00103-X
Maher, B. A. (1988). Magnetic Properties of Some Synthetic Sub-micron Magnetites. Geophys. J. Int. 94, 83–96. doi:10.1111/j.1365-246X.1988.tb03429.x
Maher, B. A., MengYu, H., Roberts, H. M., and Wintle, A. G. (2003b). Holocene Loess Accumulation and Soil Development at the Western Edge of the Chinese Loess Plateau: Implications for Magnetic Proxies of Palaeorainfall. Quat. Sci. Rev. 22, 445–451. doi:10.1016/S0277-3791(02)00188-9
Maher, B. A. (2011). The Magnetic Properties of Quaternary Aeolian Dusts and Sediments, and Their Palaeoclimatic Significance. Aeolian Res. 3, 87–144. doi:10.1016/j.aeolia.2011.01.005
Maher, B. A., and Thompson, R. (1991). Mineral Magnetic Record of the Chinese Loess and Paleosols. Geol 19, 3–6. doi:10.1130/0091-7613(1991)019<0003:MMROTC>2.3.CO;210.1130/0091-7613(1991)019<0003:mmrotc>2.3.co;2
Maher, B. A., and Thompson, R. (1995). Paleorainfall Reconstructions from Pedogenic Magnetic Susceptibility Variations in the Chinese Loess and Paleosols. Quat. Res. 44, 383–391. doi:10.1006/qres.1995.1083
Maher, B. A., and Thompson, R. (1999). Quaternary Climates, Environments and Magnetism. 1st Edn (Cambridge, United Kingdom: Cambridge University Press).
Martin, H. A. (2006). Cenozoic Climatic Change and the Development of the Arid Vegetation in Australia. J. Arid Environments 66, 533–563. doi:10.1016/j.jaridenv.2006.01.009
Matasova, G. G., and Kazansky, A. Y. (2005). Contribution of Paramagnetic Minerals to Magnetic Properties of Loess-Soil Deposits in Siberia and its Paleoclimatic Implications. Izvestiya, Phys. Solid Earth 41, 81–89. Available at: https://www.researchgate.net/publication/287414681_Contribution_of_paramagnetic_minerals_to_magnetic_properties_of_loess-soil_deposits_in_Siberia_and_its_paleoclimatic_implications (Accessed February 7, 2021).
Matasova, G., Petrovský, E., Jordanova, N., Zykina, V., and Kapička, A. (2001). Magnetic Study of Late Pleistocene Loess/palaeosol Sections from Siberia: Palaeoenvironmental Implications. Geophys. J. Int. 147, 367–380. doi:10.1046/j.0956-540x.2001.01544.x
Mathé, P.-E., Rochette, P., Vandamme, D., and Fillion, G. (1999). Néel Temperatures of Synthetic Substituted Goethites and Their Rapid Determination Using Low-Field Susceptibility Curves. Geophys. Res. Lett. 26, 2125–2128. doi:10.1029/1999GL900424
Maxbauer, D. P., Feinberg, J. M., and Fox, D. L. (2016a). Magnetic mineral Assemblages in Soils and Paleosols as the Basis for Paleoprecipitation Proxies: A Review of Magnetic Methods and Challenges. Earth-Science Rev. 155, 28–48. doi:10.1016/j.earscirev.2016.01.014
Maxbauer, D. P., Feinberg, J. M., and Fox, D. L. (2016b). MAX UnMix: A Web Application for Unmixing Magnetic Coercivity Distributions. Comput. Geosciences 95, 140–145. doi:10.1016/j.cageo.2016.07.009
McClymont, E. L., and Rosell-Melé, A. (2005). Links between the Onset of Modern Walker Circulation and the Mid-pleistocene Climate Transition. Geol. 33, 389–392. doi:10.1130/G21292.1
McLennan, S. M. (1989). “Chapter 7. Rare Earth Elements In Sedimentary Rocks: Influence of Provenance and Sedimentary Processes,” in Geochemistry and Mineralogy Of Rare Earth Elements (Washington D.C.: De Gruyter Mouton), 169–200. doi:10.1515/9781501509032-010
Meng, X., Derbyshire, E., and Kemp, R. A. (1997). Origin of the Magnetic Susceptibility Signal in Chinese Loess. Quat. Sci. Rev. 16, 833–839. doi:10.1016/S0277-3791(97)00053-X
Merrill, R. T. (1968). A Possible Source for the Coercivity of Ilmenite-Hematite Minerals. J. Geomagn. Geoelec. 20, 181–185. doi:10.5636/jgg.20.181
Morin, F. J. (1950). Magnetic Susceptibility ofαFe2O3andαFe2O3with Added Titanium. Phys. Rev. 78, 819–820. doi:10.1103/PhysRev.78.819.2
Mudelsee, M., and Schulz, M. (1997). The Mid-pleistocene Climate Transition: Onset of 100 Ka Cycle Lags Ice Volume Build-Up by 280 Ka. Earth Planet. Sci. Lett. 151, 117–123. doi:10.1016/s0012-821x(97)00114-3
Muhs, D. R., Bettis, E. A., and Skipp, G. L. (2018). Geochemistry and Mineralogy of Late Quaternary Loess in the Upper Mississippi River valley, USA: Provenance and Correlation with Laurentide Ice Sheet History. Quat. Sci. Rev. 187, 235–269. doi:10.1016/j.quascirev.2018.03.024
Muhs, D. R. (2018). The Geochemistry of Loess: Asian and North American Deposits Compared. J. Asian Earth Sci. 155, 81–115. doi:10.1016/j.jseaes.2017.10.032
Muhs, D. R. (2013). The Geologic Records of Dust in the Quaternary. Aeolian Res. 9, 3–48. doi:10.1016/j.aeolia.2012.08.001
Munroe, J. S., and Laabs, B. J. C. (2013). Temporal Correspondence between Pluvial lake Highstands in the Southwestern US and Heinrich Event 1. J. Quat. Sci. 28, 49–58. doi:10.1002/jqs.2586
Muxworthy, A. R., and Dunlop, D. J. (2002). First-order Reversal Curve (FORC) Diagrams for Pseudo-single-domain Magnetites at High Temperature. Earth Planet. Sci. Lett. 203, 369–382. doi:10.1016/S0012-821X(02)00880-4
Nagarajan, R., Armstrong-Altrin, J. S., Kessler, F. L., and Jong, J. (2017). “Petrological and Geochemical Constraints on Provenance, Paleoweathering, and Tectonic Setting of Clastic Sediments from the Neogene Lambir and Sibuti Formations, Northwest Borneo,” in Sediment Provenance: Influences On Compositional Change from Source to Sink. Editor R. Mazumder (Amsterdam, Netherlands: Elsevier), 123–153. doi:10.1016/B978-0-12-803386-9.00007-1
Necula, C., Panaiotu, C., Schinteie, G., Palade, P., and Kuncser, V. (2015). Reconstruction of Superparamagnetic Particle Grain Size Distribution from Romanian Loess Using Frequency Dependent Magnetic Susceptibility and Temperature Dependent Mössbauer Spectroscopy. Glob. Planet. Change 131, 89–103. doi:10.1016/j.gloplacha.2015.05.009
Nesbitt, H. W., and Young, G. M. (1982). Early Proterozoic Climates and Plate Motions Inferred from Major Element Chemistry of Lutites. Nature 299, 715–717. doi:10.1038/299715a0
Newell, A. J., and Merrill, R. T. (2000). Nucleation and Stability of Ferromagnetic States. J. Geophys. Res. 105, 19377–19391. doi:10.1029/2000jb900121
Nie, J., King, J., and Fang, X. (2008). Late Pliocene-Early Pleistocene 100-ka Problem. Geophys. Res. Lett. 35, 1–4. doi:10.1029/2008GL035265
Nie, J., Song, Y., and King, J. W. (2016). A Review of Recent Advances in Red-Clay Environmental Magnetism and Paleoclimate History on the Chinese Loess Plateau. Front. Earth Sci. 4, 27. doi:10.3389/feart.2016.00027
Novlan, D. J., Hardiman, M., and Gill, T. E. (2007). A Synoptic Climatology of Blowing Dust Events in El Paso, Texas from 1932-2005. Available at: https://www.weather.gov/media/epz/research/elp07-2.pdf (Accessed April 2, 2021).
Nowaczyk, N. R. (2011). Dissolution of Titanomagnetite and Sulphidization in Sediments from Lake Kinneret, Israel. Geophys. J. Int. 187, 34–44. doi:10.1111/j.1365-246X.2011.05120.x
Ogg, J. G. (2020). “Geomagnetic Polarity Time Scale,” in Geologic Time Scale 2020. Editors F. M. Gradstein, J. G. Ogg, M. D. Schmitz, and G. M. Ogg (Amsterdam, Netherlands: Elsevier), 159–192. doi:10.1016/b978-0-12-824360-2.00005-x
O’Reilly, W. (1976). Magnetic Minerals in the Crust of the Earth. Rep. Prog. Phys. 39, 857–908. doi:10.1088/0034-4885/39/9/002
O’Reilly, W. (1984). Rock and Mineral Magnetism. 1st ed. Boston, MA: Springer US. doi:10.1007/978-1-4684-8468-7
Orgeira, M. J., Egli, R., and Compagnucci, R. H. (2011). “A Quantitative Model of Magnetic Enhancement in Loessic Soils,” in The Earth’s Magnetic Interior. Editors E. Petrovský, E. Herrero-Bervera, T. Harinarayana, and D. Ivers (London, U.K.: Springer Netherlands), 361–397. doi:10.1007/978-94-007-0323-0_25
Oster, J. L., Ibarra, D. E., Winnick, M. J., and Maher, K. (2015). Steering of westerly Storms over Western North America at the Last Glacial Maximum. Nat. Geosci. 8, 201–205. doi:10.1038/ngeo2365
Özdemir, Ö., and Banerjee, S. K. (1984). High Temperature Stability of Maghemite (γ-Fe2O3). Geophys. Res. Lett. 11, 161–164. doi:10.1029/GL011i003p00161
Özdemir, Ö., Dunlop, D. J., and Berquó, T. S. (2008). Morin Transition in Hematite: Size Dependence and thermal Hysteresis. Geochem. Geophys. Geosyst. 9, a–n. doi:10.1029/2008GC002110
Özdemir, Ö., and Dunlop, D. J. (2010). Hallmarks of Maghemitization in Low-Temperature Remanence Cycling of Partially Oxidized Magnetite Nanoparticles. J. Geophys. Res. 115. doi:10.1029/2009jb006756
Özdemir, Ö., and Dunlop, D. J. (2014). Hysteresis and Coercivity of Hematite. J. Geophys. Res. Solid Earth 119, 2582–2594. doi:10.1002/2013JB010739
Parker, R. L., and Fleischer, M. (1968). Geochemistry of Niobium and Tantalum A Review of the Geochemistry of Niobium and Tantalum and a Glossary of Niobium and Tantalum Minerals. Washington, DC: U.S. Geological Survey. doi:10.3133/pp612
Patterson, P. E., and Larson, E. E., and (1990). “Paleomagnetic Study and Age Assessment of a Succession of Paleosols in the Type Section of the Blackwater Draw Formation, Northwestern Texas,,” in Geologic Framework and Regional Hydrology: Upper Cenozoic Blackwater Draw and Ogallala Formations, Great Plains. Editors T. C. Gustavson (Austin, TX: The University of Texas at Austin, Buerau of Economic Geology), 234–244.
Peters, C., and Dekkers, M. J. (2003). Selected Room Temperature Magnetic Parameters as a Function of Mineralogy, Concentration and Grain Size. Phys. Chem. Earth, Parts A/B/C 28, 659–667. doi:10.1016/S1474-7065(03)00120-7
Petersen, N., and Vali, H. (1987). Observation of Shrinkage Cracks in Ocean Floor Titanomagnetites. Phys. Earth Planet. Interiors 46, 197–205. doi:10.1016/0031-9201(87)90182-8
Pluhar, C. J., and Kirschvink, J. L. (1991). Magnetostratigraphy and Clockwise Rotation of the Plio-Pleistocene Mojave River Formation, Central Mojave Desert, California. Quarterly (San Bernardino County Museum Association) 38, 31–42.
Prothero, D. R. (2011). Paleomagnetism, Magnetostratigraphy. Encyclopedia Earth Sci. Ser. Part 5, 925–933. doi:10.1007/978-90-481-8702-7_124
Raymo, M. E., Oppo, D. W., and Curry, W. (1997). The Mid-pleistocene Climate Transition: A Deep Sea Carbon Isotopic Perspective. Paleoceanography 12, 546–559. doi:10.1029/97PA01019
Raymo, M. E., Ruddiman, W. F., and Froelich, P. N. (1988). Influence of Late Cenozoic Mountain Building on Ocean Geochemical Cycles. Geol. 16, 649–653. doi:10.1130/0091-7613(1988)016<0649:IOLCMB>2.3.CO;210.1130/0091-7613(1988)016<0649:iolcmb>2.3.co;2
Raymo, M. E. (1994). The Himalayas, Organic Carbon Burial, and Climate in the Miocene. Paleoceanography 9, 399–404. doi:10.1029/94PA00289
Raymo, M. E. (1997). The Timing of Major Climate Terminations. Paleoceanography 12, 577–585. doi:10.1029/97PA01169
Rea, D. K. (1994). The Paleoclimatic Record provided by Eolian Deposition in the Deep Sea: The Geologic History of Wind. Rev. Geophys. 32, 159. doi:10.1029/93RG03257
Reeves, C. C., and Mahaney, W. C. (1976). “Quaternary stratigraphy and geologic history of Southern High Plains, Texas and New Mexico,” in Quaternary stratigraphy of North America. Editor W. C. Mahaney (Stroudsburg, PA: Dowden, Hutchinson, & Ross), 213–234.
Retallack, G. J. (2005). Pedogenic Carbonate Proxies for Amount and Seasonality of Precipitation in Paleosols. Geol 33, 333–336. doi:10.1130/G21263.1
Roberts, A. P., Almeida, T. P., Church, N. S., Harrison, R. J., Heslop, D., Li, Y., et al. (2017). Resolving the Origin of Pseudo-single Domain Magnetic Behavior. J. Geophys. Res. Solid Earth 122, 9534–9558. doi:10.1002/2017JB014860
Roberts, A. P., Heslop, D., Zhao, X., and Pike, C. R. (2014). Understanding fine Magnetic Particle Systems through Use of First-Order Reversal Curve Diagrams. Rev. Geophys. 52, 557–602. doi:10.1002/2014RG000462
Roberts, A. P., Pike, C. R., and Verosub, K. L. (2000). First-order Reversal Curve Diagrams: A New Tool for Characterizing the Magnetic Properties of Natural Samples. J. Geophys. Res. 105, 28461–28475. doi:10.1029/2000jb900326
Robertson, D. J., and France, D. E. (1994). Discrimination of Remanence-Carrying Minerals in Mixtures, Using Isothermal Remanent Magnetisation Acquisition Curves. Phys. Earth Planet. Interiors 82, 223–234. doi:10.1016/0031-9201(94)90074-4
Rochette, P., and Fillion, G. (1989). Field and Temperature Behavior of Remanence in Synthetic Goethite: Paleomagnetic Implications. Geophys. Res. Lett. 16, 851–854. doi:10.1029/GL016i008p00851
Santana, G. P., Fabris, J. D., Goulart, A. T., and Santana, D. P. (2001). Magnetite and its Transformation to Hematite in a Soil Derived from Steatite. Available at: https://www.scielo.br/scielo.php?pid=S0100-06832001000100004&script=sci_abstract (Accessed February 7, 2021).
Scheinost, A. C., and Schwertmann, U. (1999). Color Identification of Iron Oxides and Hydroxysulfates. Soil Sci. Soc. Am. J. 63, 1463–1471. doi:10.2136/sssaj1999.6351463x
Scheinost, A. C. (2005). “Metal Oxides,” in Encyclopedia Of Soils in the Environment. Editors J. L. Hatfield, D. S. Powlson, C. Rosenzweig, K. M. Scow, M. J. Singer, and D. L. Sparks (Charlottesville, VA: Elsevier Inc.), 428–438. doi:10.1016/B0-12-348530-4/00194-6
Schmieder, F., von Dobeneck, T., and Bleil, U. (2000). The Mid-pleistocene Climate Transition as Documented in the Deep South Atlantic Ocean: Initiation, Interim State and Terminal Event. Earth Planet. Sci. Lett. 179, 539–549. doi:10.1016/S0012-821X(00)00143-6
Schwertmann, U., and Cornell, R. M. (1991). Iron Oxides in the Laboratory. 2nd Edn. New York, NY: Wiley-Vch.
Schwertmann, U., Friedl, J., and Stanjek, H. (1999). From Fe(III) Ions to Ferrihydrite and Then to Hematite. J. Colloid Interf. Sci. 209, 215–223. doi:10.1006/jcis.1998.5899
Schwertmann, U. (1988). Occurrence and Formation of Iron Oxides in Various Pedoenvironments. Iron in soils and clay minerals, 267–308. doi:10.1007/978-94-009-4007-9_11
Schwertmann, U., and Taylor, R. M. (1972). The Transformation of Lepidocrocite to Goethite. Clays and Clay Minerals 20, 151–158. doi:10.1346/CCMN.1972.0200306
Schwertmann, U., and Taylor, R. M. (1989). “Iron Oxides,” in Minerals in Soil Environments. Editors J. B. Dixon, and S. B. Weed (Weinheim: John Wiley & Sons, Ltd), 379–438. doi:10.2136/sssabookser1.2ed.c8
Schwertmann, U. (1958). “The Effect of Pedogenic Environments on Iron Oxide Minerals,” In Advances in Soil Science (Springer), 171–200.doi:10.1007/978-1-4612-5046-3_5
Schwertmann, U. (1971). Transformation of Hematite to Goethite in Soils. Nature 232, 624–625. doi:10.1038/232624a0
Sheldon, N. D., Retallack, G. J., and Tanaka, S. (2002). Geochemical Climofunctions from North American Soils and Application to Paleosols across the Eocene‐Oligocene Boundary in Oregon. J. Geology 110, 687–696. doi:10.1086/342865
Singer, B. S. (2014). A Quaternary Geomagnetic Instability Time Scale. Quat. Geochronol. 21, 29–52. doi:10.1016/j.quageo.2013.10.003
Soil Survey Staff (1990). Keys to Soil Taxonomy. Available at: https://www.nrcs.usda.gov/Internet/FSE_DOCUMENTS/nrcs142p2_051857.pdf (Accessed February 7, 2021).
Song, Y., Shi, Z., Fang, X., Nie, J., Naoto, I., Qiang, X., et al. (2010). Loess Magnetic Properties in the Ili Basin and Their Correlation with the Chinese Loess Plateau. Sci. China Earth Sci. 53, 419–431. doi:10.1007/s11430-010-0011-5
Soreghan, G. S., Elmore, R. D., Katz, B., Cogoini, M., and Banerjee, S. (1997). Pedogenically Enhanced Magnetic Susceptibility Variations Preserved in Paleozoic Loessite. Geol 25, 1003–1006. doi:10.1130/0091-7613(1997)025<1003:PEMSVP>2.3.CO;210.1130/0091-7613(1997)025<1003:pemsvp>2.3.co;2
Stacey, F., and Banerjee, S. K. (1974). The Physical Principles of Rock Magnetism. Amsterdam: Elsevier Scientific Publishing Company.
Stine, J., Sweet, D. E., Geissman, J. W., Baird, H., and Ferguson, J. F. (2020). “Climate and Provenance Variation across the Mid-pleistocene Transition Revealed through Sedimentology, Geochemistry, and Rock Magnetism of the Blackwater Draw Formation, Southern High Plains, Texas, USA,” in Untangling the Quaternary Period—A Legacy Of Stephen C. Porter. Editors R. B. Waitt, G. D. Thackray, and A. R. Gillespie (Geological Society of America). doi:10.1130/2020.2548(03)
Stober, J. C., and Thompson, R. (1979). Magnetic Remanence Acquisition in Finnish lake Sediments. Available at: https://academic.oup.com/gji/article/57/3/727/682760 (Accessed February 7, 2021).doi:10.3790/978-3-428-44398-7
Stober, J. C., and Thompson, R. (1977). Palaeomagnetic Secular Variation Studies of Finnish lake Sediment and the Carriers of Remanence. Earth Planet. Sci. Lett. 37, 139–149. doi:10.1016/0012-821X(77)90155-8
Stout, J. E. (2001). Dust and Environment in the Southern High Plains of North America. J. Arid Environments 47, 425–441. doi:10.1006/jare.2000.0732
Strangway, D. W., Honea, R. M., McMahon, B. E., and Larson, E. E. (1968). The Magnetic Properties of Naturally Occurring Goethite. Geophys. J. Int. 15, 345–359. doi:10.1111/j.1365-246X.1968.tb00191.x
Strangway, D. W., McMahon, B. E., Honea, R. M., and Larson, E. E. (1967b). Superparamagnetism in Hematite. Earth Planet. Sci. Lett. 2, 367–371. doi:10.1016/0012-821X(67)90158-6
Strangway, D. W., McMahon, B. E., and Honea, R. M. (1967a). Stable Magnetic Remanence in Antiferromagnetic Goethite. Science 158, 785–787. doi:10.1126/science.158.3802.785
Strömberg, C. A. E. (2011). Evolution of Grasses and Grassland Ecosystems. Annu. Rev. Earth Planet. Sci. 39, 517–544. doi:10.1146/annurev-earth-040809-152402
Sun, J., Lü, T., Zhang, Z., Wang, X., and Liu, W. (2012). Stepwise Expansions of C4 Biomass and Enhanced Seasonal Precipitation and Regional Aridity during the Quaternary on the Southern Chinese Loess Plateau. Quat. Sci. Rev. 34, 57–65. doi:10.1016/j.quascirev.2011.12.007
Tarling, D. H. (1983). Palaeomagnetism: Principles and Applications in Geology, Geophysics and Archaeology. 1st ed. New York: Springer Science & Business Media.
Tauxe, L., Bertram, H. N., and Seberino, C. (2002). Physical Interpretation of Hysteresis Loops: Micromagnetic Modeling of fine Particle Magnetite. Geochem.-Geophys.-Geosyst. 3, 1–22. doi:10.1029/2001GC000241
Tauxe, L. (2010). Essentials of Paleomagnetism. Berkely, CA: University of California Press. doi:10.1007/978-94-009-5955-2
Thompson, R., and Oldfield, F. (1986). Environmental Magnetism. 1st ed. London, United Kingdom: Springer Science & Business Media. doi:10.1007/978-94-011-8036-8
Torrent, J., Barrón, V., and Liu, Q. (2006). Magnetic Enhancement Is Linked to and Precedes Hematite Formation in Aerobic Soil. Geophys. Res. Lett. 33, L02401. doi:10.1029/2005GL024818
Torrent, J., Liu, Q., Bloemendal, J., and Barrón, V. (2007). Magnetic Enhancement and Iron Oxides in the Upper Luochuan Loess-Paleosol Sequence, Chinese Loess Plateau. Soil Sci. Soc. Am. J. 71, 1570–1578. doi:10.2136/sssaj2006.0328
Tziperman, E., and Gildor, H. (2003). On the Mid-pleistocene Transition to 100-kyr Glacial Cycles and the Asymmetry between Glaciation and Deglaciation Times. Paleoceanography 18, 1–8. doi:10.1029/2001pa000627
Ul-Hamid, A. (2018). A Beginners’ Guide to Scanning Electron Microscopy. Cham, Switzerland: Springer International Publishing. doi:10.1007/978-3-319-98482-7
Vahle, C., Kontny, A., Gunnlaugsson, H. P., and Kristjansson, L. (2007). The Stardalur Magnetic Anomaly Revisited-New Insights into a Complex Cooling and Alteration History. Phys. Earth Planet. Interiors 164, 119–141. doi:10.1016/j.pepi.2007.06.004
Vandenberghe, R. E., Barrero, C. A., da Costa, G. M., van San, E., and de Grave, E. (2000). Mössbauer Characterization of Iron Oxides and (Oxy)hydroxides: The Present State of the Art. Hyperfine Interactions 126, 247–259. doi:10.1023/A:1012603603203
Verosub, K. L., Fine, P., Singer, M. J., and Tenpas, J. (1993). Pedogenesis and Paleoclimate: Interpretation of the Magnetic Susceptibility Record of Chinese Loess-Paleosol Sequences. Geol. 21, 1011–1014. doi:10.1130/0091-7613(1993)021<1011:PAPIOT>2.3.CO;210.1130/0091-7613(1993)021<1011:papiot>2.3.co;2
Verwey, E. J. W. (1939). Electronic Conduction of Magnetite (Fe3O4) and its Transition Point at Low Temperatures. Nature 144, 327–328. doi:10.1038/144327b0
Wang, H., Zhou, W., Shu, P., Hong, B., and An, Z. (2021). Two-stage Evolution of Glacial-Period Asian Monsoon Circulation by Shifts of westerly Jet Streams and Changes of North American Ice Sheets. Earth-Science Rev. 215, 103558. doi:10.1016/j.earscirev.2021.103558
Wang, P., Du, Y., Yu, W., Algeo, T. J., Zhou, Q., Xu, Y., et al. (2020). The Chemical index of Alteration (CIA) as a Proxy for Climate Change during Glacial-Interglacial Transitions in Earth History. Earth-Science Rev. 201, 103032. doi:10.1016/j.earscirev.2019.103032
Wang, S., Lin, S., and Lu, S. (2013). Rock Magnetism, Iron Oxide Mineralogy and Geochemistry of Quaternary Red Earth in central China and Their Paleopedogenic Implication. Palaeogeogr. Palaeoclimatol. Palaeoecol. 379-380, 95–103. doi:10.1016/j.palaeo.2013.04.010
Werner, M. (2002). Seasonal and Interannual Variability of the mineral Dust Cycle under Present and Glacial Climate Conditions. J. Geophys. Res. 107, 4744. doi:10.1029/2002JD002365
Wickert, A. D., Mitrovica, J. X., Williams, C., and Anderson, R. S. (2013). Gradual Demise of a Thin Southern Laurentide Ice Sheet Recorded by Mississippi Drainage. Nature 502, 668–671. doi:10.1038/nature12609
Wickert, A. D. (2016). Reconstruction of North American Drainage Basins and River Discharge since the Last Glacial Maximum. Earth Surf. Dynam. 4, 831–869. doi:10.5194/esurf-4-831-2016
Winkler, A., Wolf-Welling, T., Stattegger, K., and Thiede, J. (2002). Clay mineral Sedimentation in High Northern Latitude Deep-Sea Basins since the Middle Miocene (ODP Leg 151, NAAG). Int. J. Earth Sci. 91, 133–148. doi:10.1007/s005310100199
Yann, L. T., DeSantis, L. R. G., Haupt, R. J., Romer, J. L., Corapi, S. E., and Ettenson, D. J. (2013). The Application of an Oxygen Isotope Aridity index to Terrestrial Paleoenvironmental Reconstructions in Pleistocene North America. Paleobiology 39, 576–590. doi:10.1666/12059
Yu, Z., Wan, S., Colin, C., Song, L., Zhao, D., Huang, J., et al. (2018). ENSO-like Modulated Tropical Pacific Climate Changes since 2.36 Myr and its Implication for the Middle Pleistocene Transition. Geochem. Geophys. Geosyst. 19, 415–426. doi:10.1002/2017GC007247
Zan, J., Fang, X., Yan, M., and Li, B. (2017). New Insights into the Palaeoclimatic Interpretation of the Temperature Dependence of the Magnetic Susceptibility and Magnetization of Mid-late Pleistocene Loess/palaeosols in Central Asia and the Chinese Loess Plateau. Geophys. J. Int. 208, 663–673. doi:10.1093/gji/ggw419
Zhang, R., and Nie, J. (2017). Goethite Concentration Variations in the Red Clay Sequence on the Chinese Loess Plateau. Geochem. Geophys. Geosyst. 18, 4179–4185. doi:10.1002/2017GC007148
Zhi, Y., Jun, C., and Junfeng, J. (2000). 57Fe-Mössbauer Studies on Loess-Palaeosol Samples from the Luochuan Section, Loess Plateau of Central China. Spectrosc. Lett. 33, 833–846. doi:10.1080/00387010009350160
Zhou, L. P., Oldfield, F., Wintle, A. G., Robinson, S. G., and Wang, J. T. (1990). Partly Pedogenic Origin of Magnetic Variations in Chinese Loess. Nature 346, 737–739. doi:10.1038/346737a0
Zhou, W., van der Voo, R., Peacor, D. R., Wang, D., and Zhang, Y. (2001). Low-temperature Oxidation in MORB of Titanomagnetite to Titanomaghemite: A Gradual Process with Implications for marine Magnetic Anomaly Amplitudes. J. Geophys. Res. 106, 6409–6421. doi:10.1029/2000jb900447
Keywords: blackwater draw formation, mid-pleistocene transition, rock magnetism, continental weathering, eolian strata, environmental magnetism, soil magnetism, magnetic mineralogy
Citation: Stine J, Geissman J, Sweet D and Baird H (2021) The Effect of Differential Weathering on The Magnetic Properties of Paleosols: A Case Study of Magnetic Enhancement vs. Magnetic Depletion in the Pleistocene Blackwater Draw Formation, Texas. Front. Earth Sci. 9:601401. doi: 10.3389/feart.2021.601401
Received: 31 August 2020; Accepted: 10 May 2021;
Published: 17 June 2021.
Edited by:
Sarah P Slotznick, Dartmouth College, United StatesReviewed by:
Daniel Maxbauer, Carleton College, United StatesJan Hošek, Czech Geological Survey, Czechia
Junsheng Nie, Lanzhou University, China
Copyright © 2021 Stine, Geissman, Sweet and Baird. This is an open-access article distributed under the terms of the Creative Commons Attribution License (CC BY). The use, distribution or reproduction in other forums is permitted, provided the original author(s) and the copyright owner(s) are credited and that the original publication in this journal is cited, in accordance with accepted academic practice. No use, distribution or reproduction is permitted which does not comply with these terms.
*Correspondence: J. Stine, Sm9uYXRoYW4uc3RpbmVAdXRkYWxsYXMuZWR1