 Mark T. Ireland
 Rachel Brown
 Miles P. Wilson
 Paul B. Stretesky
 Andrew Kingdon
 Richard J. Davies1
- 1School of Natural and Environmental Sciences, Newcastle University, Newcastle Upon Tyne, United Kingdom
- 2Department of Earth Sciences, Science Site, Durham University, Durham, United Kingdom
- 3British Geological Survey, Nicker Hill, Keyworth, Nottingham, United Kingdom
- 4Department of Social Sciences and Languages, Northumbria University, Newcastle Upon Tyne, United Kingdom
The decarbonization of energy systems to achieve net zero carbon emissions will likely see the rapid development of carbon capture and storage, energy storage in the subsurface and geothermal energy projects. Subsurface data, in particular seismic reflection surveys and borehole data are vital for geoscientists and engineers to carry out comprehensive assessments of both the opportunities and risks for these developments. Their cost of acquisition means that such legacy data are commonly the only mechanism for site selection so biased data distribution must be accommodated. Here, legacy subsurface data from United Kingdom onshore hydrocarbon and coal exploration in the United Kingdom are collated and reviewed for their suitability for geoenergy activities. We provide a description of the spatial coverage and a chronology of the acquisition of key seismic reflection and borehole data, as well as examine data resolution and limitations. We discuss the implications of spatial variability in subsurface datasets and the associated subsurface uncertainty as this is vitally important to understanding the suitability of data for decision making. We examine societal aspects of data uncertainty and discuss that when the same data are used to communicate subsurface uncertainty and risk, the source of the data should also be considered, especially where data are not easily publicly accessible. Understanding the provenance and quality criteria of data are vitally important for future geoenergy activities and public confidence in subsurface activities. Finally, we ask should there be minimum data collection criterion, such as resolution requirements, ahead of subsurface activities with potentially significant impacts to the environment, economy, and society?
Introduction
Achieving a transition to net zero carbon emissions from energy systems is one of the most pressing challenges globally (Rogelj et al., 2015). The United Kingdom government has set a legally binding target to reduce greenhouse gas emissions to net zero by 2050 (see The UK government, 2008), which, will require decarbonizing both industrial and residential energy systems, (e.g. Cooper and Hammond, 2018; Broad et al., 2020). The geology, specifically onshore subsurface, of the United Kingdom has a role to play in this transition (Stephenson et al., 2019), in particular, through decentralized energy systems and the use of geothermal energy (Lloyd, 2018), as part of the hydrogen economy as storage at grid scale, and emission abatement through carbon capture and storage, (e.g. Alcalde et al., 2019). The exploration and production of shale gas has highlighted the importance of the ability to predict the behavior of the subsurface for hazards such as induced seismicity and the need for informed decision-making regarding the conduct of anthropogenic activities (Bommer et al., 2015). A fundamental question regarding the use of the subsurface for future decarbonization pathways is whether existing data are both extensive enough and of sufficient quality to adequately assess the potential contribution and impact of subsurface activities and their role in a net zero future.
Data are fundamental for geoscientists, environmental scientists and engineers to carry out comprehensive assessments of the resource or storage potential and to understanding the risks and uncertainties associated with subsurface activities, (e.g. Baker et al., 1999; Ross, 2004; Bles et al., 2019). Informed decisions, for example, regulation and policy change, come from the analysis, interpretations, and modeling of such data, and ultimately the scientific communication of the results. Society is increasingly concerned with the environmental risks and impacts of subsurface activities (van Os et al., 2016), which can have a direct impact on communities, for example, as the result of induced seismicity (van der Voort and Vanclay, 2015), subsidence (Franks et al., 2010), environmental pollution (O’Rourke and Connolly, 2003), health (Holdren et al., 2000) and rapid changes to community life (Schafft et al., 2013). These impacts also have broader consequences for both the public and the industries involved, for example, protests or project delays (Bradshaw and Waite, 2017; Short and Szolucha, 2019) leading to issues with gaining social license. As a result of the increased scrutiny with which subsurface activities have come under, the need for effective communication is becoming increasingly vital to ensuring that geoscientific know-how reaches all those involved and impacted (Stewart and Gill, 2017; van der Bles et al., 2019). This comes at a time when the United Kingdom’s (and the World’s) ambition to decarbonize energy systems could, despite the predicted shift from fossil fuels to new, lower carbon energy sources, require subsurface activities at significant industrial scale, (e.g. Stephenson et al., 2019). This study synthesizes the legacy subsurface data, primarily collected for oil and gas exploration and production, from the United Kingdom landmass, with the purpose of providing an unbiased view of the implications for future geoenergy activities using examples for geothermal and unconventional hydrocarbons.
Geological data derived from sparse borehole coverage measuring geological attributes indirectly are always innately uncertain. In communicating subsurface risks, experts often discuss the degrees of uncertainty inherent in subsurface characterization, however, this is often without consideration of the target audience. Importantly, it has been shown that when experts avoid (or deny) discussing the uncertainties as part of public communication that it can drive distrust in science and organisations, (e.g. Sjöberg, 1998; Frewer et al., 2003). One suggested mechanism to improve risk communication is to focus on “what is being done to reduce the uncertainty” (Frewer et al., 2002). The introduction of new subsurface activities, such as hydraulic fracturing or the development of CCS, may, due to their immature development be initially associated with greater uncertainty, particularly regarding how far their potentially negative effects extend within the subsurface (Krause et al., 2014). What may have been an acceptable level of uncertainty and risk in the past, or in other jurisdictions, is no longer socially perceived as acceptable and, as argued by Beck et al. (1992), disasters, or the highest impact events, shape perceptions of risk.
To describe uncertainty requires a recognition that the knowledge is limited, that “known unknowns” are identified, and acknowledging that there may also be “unknown unknowns” (Pérez-Díaz et al., 2020). Quantifying uncertainty makes it possible to analyze how interpretations might differ from reality (Pérez-Díaz et al., 2020). Ackoff (1989) defines data as symbols that represent properties of objects, events, and their environment, and are the products of observation. The Data, Information, Knowledge, Wisdom (DIKW) model which Ackoff. (1989) described can be applied to subsurface data and information (Table 1); this differentiation between data and information is somewhat subjective in many areas of geosciences, specifically with respect to geophysical or remote sensing data, where processing of the data are required to enable a geological interpretation or analysis. Table 1 provides a summary of typical subsurface data, information, and knowledge sources. The accuracy of any subsurface interpretation or analysis is dependent on the quantity, spatial distribution, and quality of data available. Data requirements for both business and regulators need ensure that effective decisions can be made regarding resources and safety. These data also need to reassure the public and assess the likelihood of an activity impacting local communities and society.
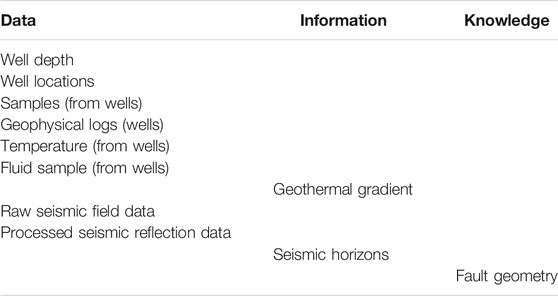
TABLE 1. Typical data types and their classification based on the Ackoff. (1989) hierarchical model.
This study outlines the characteristics of existing subsurface datasets and focuses on the deep subsurface of the United Kingdom landmass, which in United Kingdom legislation is defined as any land at a depth of at least 300 m below surface level (The UK government, 2015). Comprehension of subsurface data uncertainty is vital for geoenergy systems and this work provides the first analysis of the distribution and suitability of subsurface data, (i.e. borehole data and seismic reflection data) onshore the United Kingdom. These data are discussed within the context of two specific energy resources: geothermal, and unconventional hydrocarbons, exploring the implications of the data extent and quality on possible decision making processes. Uncertainty in such decision-making processes is at the intersection of earth sciences and social sciences, and we examine the societal aspects of data uncertainty. We note the importance of characterizing uncertainty for the communication of subsurface uncertainty and risk. We also discuss the importance of understanding the provenance and quality of data for public confidence in subsurface activities. This study synthesizes these datasets and includes examples of why data resolution and quality are an important consideration for future geoenergy activities and public confidence in subsurface activities.
Subsurface United Kingdom Data
The geology of the United Kingdom landmass contains a geological back to the Archean, and includes a history of subduction zones, volcanic arcs, continental rifts and mountain belts (Woodcock and Strachan, 2012). While extensive geological mapping of the United Kingdom dates from the early 19th century and is summarized in the now famous map by William Smith (Smith, 1815), it was not until 1918 that the first deliberate deep oil and gas borehole was drilled, Hardstoft-1 in Derbyshire, to a depth of ∼950 m (Morton, 2014). In the period preceding the Second World War (1939), there were several early seismic reflection experiments by the Anglo-Iranian Oil Company (Jones, 1937). From the 1950s, systematic geophysical data acquisition began for oil, gas, and coal exploration. Seismic reflection surveys have subsequently become the primary subsurface geophysical method employed for oil and gas exploration. Acquisition of seismic reflection data, and the drilling of deep boreholes continued onshore in the United Kingdom, with onshore seismic data acquisition peaking in the late 1980s (see section Seismic Reflection Data for details). Much of the current understanding of the deep subsurface onshore the United Kingdom results from data acquired for the exploration and production of hydrocarbons and coal. However, whilst these data have advanced our understanding of the geology in the United Kingdom, the implications of using these data on public trust and perceptions of risk has been little considered in the literature. Demonstrably independent, impartial research based on data is essential for ensuring social license.
This study focuses on the coverage of both seismic reflection data and borehole data, and the spatial distribution and acquisition history of these data. Data included in this study are derived from United Kingdom Onshore Geophysics Library (UKOGL), the British Geological Survey (BGS), and the Oil and Gas Authority (OGA); sources are listed in Table 2. Detailed description of these data can be found in subsequent sections, but as an overview, there are ∼76 136 km of 2D seismic reflection data, ∼2400 km2 of 3D seismic reflection data and 2,242 released oil and gas exploration boreholes (excluding those completed after 2017 which are not yet released). The BGS Single Onshore Borehole Index database provides the most complete consolidated record of all other boreholes in the United Kingdom, therefore, this analysis has combined records derived from the BGS, OGA and UKOGL to provide a comprehensive view. Throughout this study the term “borehole” is used regardless of depth of penetration or verticality. The now outdated BGS Geothermal Catalog (Rollin, 1995), included temperature data which had to be digitized into a tabulated format from analogue records (now available in scanned PDF file format available from the National Geoscience Data Center). Precision of location data was then only specified either to 10 m or 100 m. Comparisons made to data from the United Kingdom Continental Shelf relate to data included as “Surveys as Consented 2D”, available from the OGA National Data Repository. Comparisons made with data from the Netherlands, where alongside onshore oil and gas exploration and production, there is significant exploitation of geothermal energy, uses data managed by the Geological Survey of the Netherlands (TNO) on behalf of the Ministry of Economic Affairs and Climate.
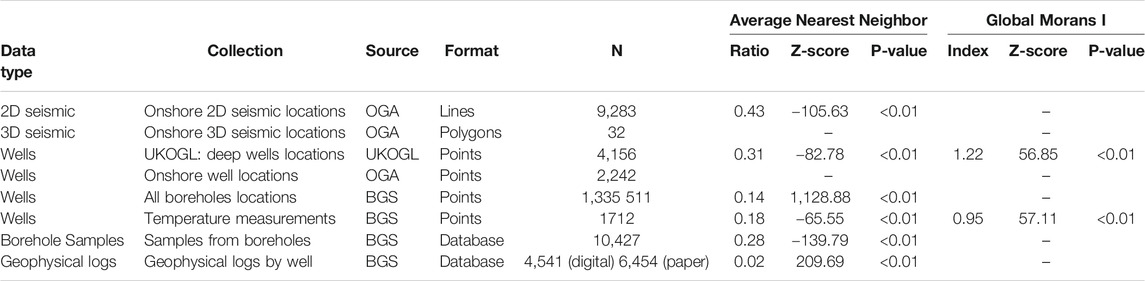
TABLE 2. Data sources used in the quantitative analysis of available data onshore the United Kingdom and associated spatial statistics.
Methodology
This study describes the spatial distribution and characteristics of data available from the BGS, OGA and UKOGL (Table 2), comprising geological and geophysical data primarily collected for oil and gas exploration and production. Geological parameters and concepts are often not directly observed or measured but interpreted from these geological and geophysical data (Pérez-Díaz et al., 2020) and this study specifically considered measurements in boreholes, and post-stack seismic reflection data (see Table 1).
Spatial Statistics
Using geostatistical techniques, the extent and distribution of subsurface data have been quantified to identify whether the collection of geoscience data is subject to a clustering effects.
Using geostatistical techniques have been used previously in a variety of geoscience studies to investigate the clustering of features, (e.g. Tepanosyan et al., 2019). In this study Global Moran’s I was used to assess the distribution of borehole locations characterizing if the spatial pattern and the depth to which boreholes were drilled exhibited clustering. Global Moran’s I scores greater than “0” suggest positive spatial clustering (boreholes are next to other boreholes) while values less than “0” suggest negative spatial clustering (boreholes are not next to other boreholes). Index scores that equal “0” suggest a random distribution of boreholes. The results of spatial clustering assessed using the Z distribution, its associated test statistic, and corresponding p-values, where the p-value indicates the probability of the observed spatial pattern being random. A large negative Z-score can be interpreted as providing evidence of negative spatial clustering while large positive Z-score can be interpreted as providing evidence of positive clustering. Point density was used to highlight where boreholes are concentrated geographically. Average nearest neighbor, which considers the distance between each point and its nearest neighbor’s location to assess if the average distance is greater or less than a hypothetical random distribution, was used to assess if data were clustered. Where individual boreholes had more than one measurement, and for the 2D seismic data, statistics were calculated using quadrats within a sampling grid, where each quadrat had an area of 10 km by 10 km. All spatial statistics were computed in ArcMap 10.6.1. The study differentiated between shallow and deep boreholes based on true vertical depth (TVD); a deep borehole being defined as one completed to a depth greater than 300 m. The proximity and intersection of boreholes and seismic reflection data with known oil and gas fields and aquifers were used to describe the likely geological objectives for seismic data acquisition and borehole drilling. In the absence of there being a single and comprehensive archive that documents the original objectives of data acquisition and drilling, this method provided a consistent approach to evaluate the possible objectives.
These statistics were used to assess the distribution of the legacy data and discuss their suitability for assessing the risks and opportunities of the future use of the subsurface. To assess the quantity of available subsurface data for future technologies, we used geothermal heat extraction as a case study. The coverage of both borehole and seismic reflection data have been analyzed with respect to the domestic and non-domestic heat demand to assess the data available for geothermal resource characterization in demand hot spots. The study has used heat demand data for the year 2009 from Taylor et al. (2014), the most up to date data of this kind. The original data are annual heat demand provided at a 1 km by 1 km resolution and in units of kWh/km2. In this study, the data were reduced, using an aggregated mean, to a 5 km by 5 km resolution to simplify the boundaries of heat demand, and then converted to MWh/km2. Areas of high heat demand in this study are defined as those with greater than 10,000 MWh/km2.
Quantitative Analysis of Seismic Reflection Data
To assess the quality of the available subsurface data, we analyzed recent 3D seismic reflection data acquired for the purposes of shale gas exploration. Given the recent controversy surrounding the extraction of unconventional hydrocarbon resources (Williams et al., 2017), and the differing interpretations reported in both peer-reviewed literature (Anderson and Underhill, 2020) and other reports published (Cuadrilla, 2019), this study has carried out an analysis of the post-stack characteristics of 3D seismic reflection data from across the Craven Basin in Lancashire (Figure 1), an area where shale gas hydraulic fracturing activities were carried out between 2011 and 2019. The study describes the characteristics of the seismic data, (e.g. geological features that allow interpretation of faults) and analyzed the frequency content and how this relates to the vertical and horizontal resolution of data. This comprised analysis of the bandwidth and acquisition parameters, which have been evaluated and described for the first time. A trapezoidal Ormsby filter, which specifies the frequency filters using four frequencies was used to filter the frequency content of the data to give an indication of how reflector continuity is related to the dominant frequency of the data. The frequency content of both the original and filtered datasets was analyzed using SeisLab 3.0 (Rietsch, 2020).
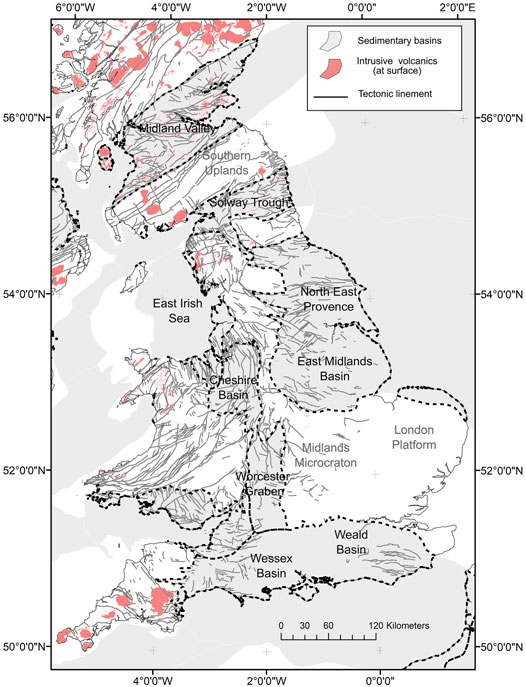
FIGURE 1. Simplified geological map of the United Kingdom, showing the outlines of sedimentary basins, position of volcanics at surface, and major tectonic liniments. Incorporates elements of the BGS simplified geological map downloaded from https://www.bgs.ac.uk/datasets/bgs-geology/British Geological Survey materials Copyright NERC 2021.
Data Analysis
Borehole Data
There are 1,335 511 boreholes in the United Kingdom landmass recorded in the BGS Single Onshore Borehole Index (SOBI), with the depth of investigation varying from just a few meters to greater than 3,000 m (Figure 2B). SOBI includes 334,757 boreholes with no details on depth; most boreholes included in SOBI (851,963) are to a depth less than 30 m. A further 136,650 boreholes investigate a depth range between 30 and 500 m. A histogram of the oil and gas exploration boreholes by depth from the UKOGL database shows that greater than 70% penetrate less than 1000 m TVD (Figure 2B). From all records there are only 2,885 boreholes deeper than 500 m, comprising oil and gas exploration and production boreholes and other deep boreholes. The OGA dataset includes only the 2,242 released oil and gas boreholes; the UKOGL database also includes an additional 643 coal boreholes. Oil and gas exploration and production boreholes account for less than 1% of all the boreholes drilled in the United Kingdom. The spatial density of the shallow boreholes between 30 and 500 m onshore the United Kingdom can be seen in Figure 3. While there are more than 1 million of these shallow boreholes, many which are related to site investigations in populated areas, there are areas of the United Kingdom with relatively few, notably west Wales and Scotland. Figure 4 shows a series of spatial point density maps for deep boreholes using data provided by UKOGL. The deepest onshore borehole penetration in the United Kingdom is the Seal Sands No. 1 borehole, drilled to a total depth of 4,169 m TVD (see Johnson et al., 2011 for details). The mean depth of a drilled oil and gas borehole is 1152 m. Of these boreholes only ∼151 boreholes, extend deeper than 2000 m TVD, and just 13 are deeper than 3000 m. Spatially, these are not distributed equally across the onshore of the United Kingdom. Nearly all the deep boreholes, because of being drilled for coal or hydrocarbon exploration and production are in either the Carboniferous Basins of northern England and the Midlands, or the Mesozoic Basins of southern England. For the boreholes in the UKOGL database, nearest neighbor analysis estimated a Z-score of −82.78, indicating that the data are clustered and P-value of less than 0.01 indicating there is a less than 1% likelihood that this clustered pattern is random. Global Moran’s I analysis, indicates that boreholes are clustered with respect to depth, with a Z-score of 53.57, and P-value of less than 0.01 indicating there is a less than 1% likelihood that the clustering is random. A histogram of boreholes drilled onshore the United Kingdom by year shows that over ∼70% of the onshore boreholes in the United Kingdom were drilled prior to 1990. Since 3D seismic reflection data acquisition onshore United Kingdom did not start until the 1990s, that means that all these boreholes were drilled based on interpreted 2D seismic reflection data. As would be expected there is a spatial coincidence of both boreholes and seismic reflection data. A total of 644 boreholes are co-located with 3D seismic reflection data, and 1,578 boreholes located within 100 m of a 2D seismic reflection line.
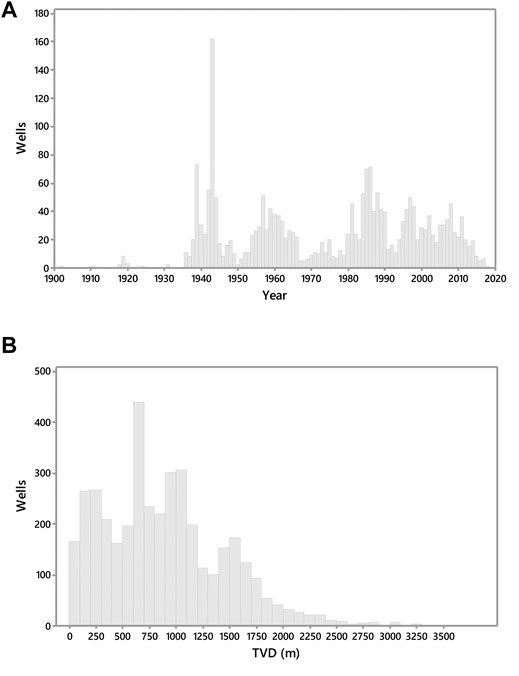
FIGURE 2. Histograms of boreholes drilled onshore the United Kingdom from the UKOGL database a) by year and b) TD TVD.
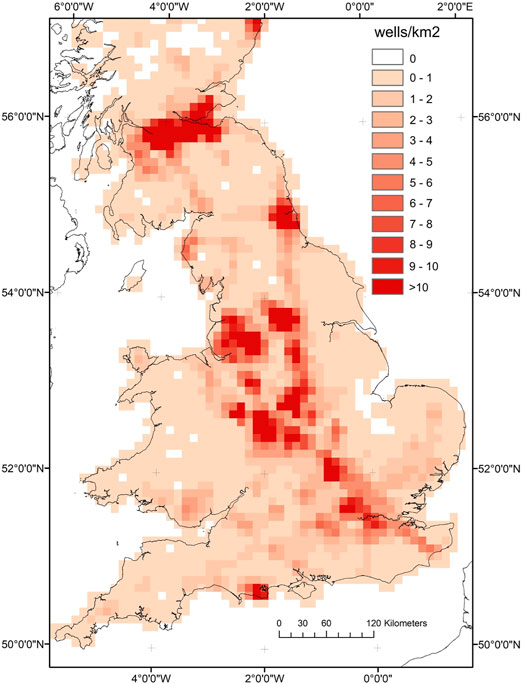
FIGURE 3. Borehole density of all boreholes held by the BGS with a TD between 30 and 300 m.
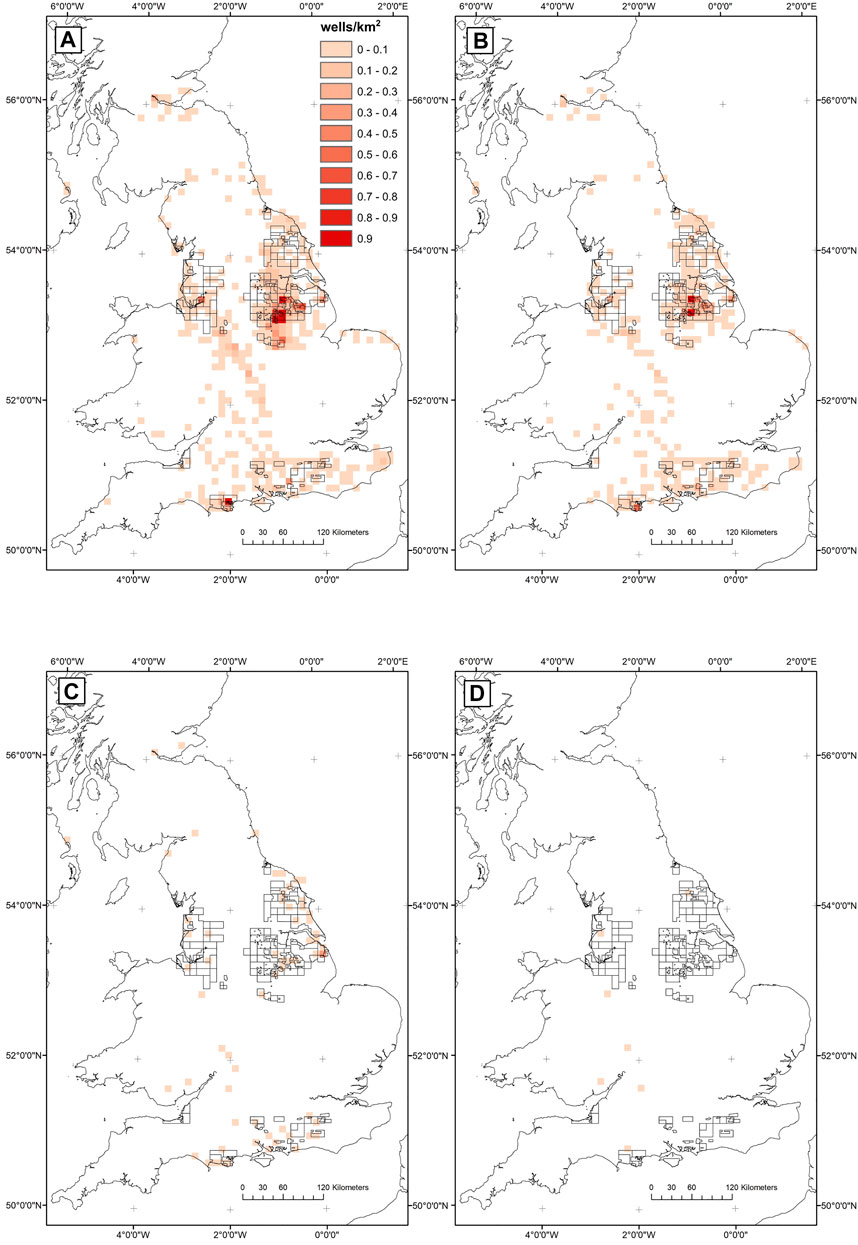
FIGURE 4. Map showing the density of boreholes from UKOGL database with total depths (TVD) of: (A) greater than 500 m; (B) greater than 1 km; (C) greater than 2 km; (D) greater than 3 km. Includes location of current PEDL.
Core and Downhole Log Data
The BGS maintain a database of over 10,000 onshore borehole samples, comprising a range of materials including core, core samples, individual hand specimens, bulk samples, unwashed cuttings, washed and dried cuttings, plugs, powders and bulk samples, including those collected as part of onshore oil and gas exploration and production borehole drilling. The relative spatial density of these data can be seen in Figure 5A (database can be searched online). The BGS hold an archive of digital geophysical downhole log data from boreholes across the United Kingdom which is not openly available due some of the data being confidential. There is no single publicly available record of all downhole logs onshore United Kingdom. The BGS hold a record of ∼4,541 boreholes with digital geophysical logs, which includes both oil and gas exploration boreholes and other boreholes including mine gas and coal bed methane boreholes. The spatial density of these data is shown in Figure 5B. Basic borehole metadata, such as location spud and completion date, is held by UKOGL, but digital log data are only available through formal release agents. In addition to this, borehole data are available through the OGA’s appointed data release agents, who hold an inventory of digital log data for onshore boreholes. There is both no mandated standard log dataset, and companies make choices based on specific requirements, so the data set is not consistent.
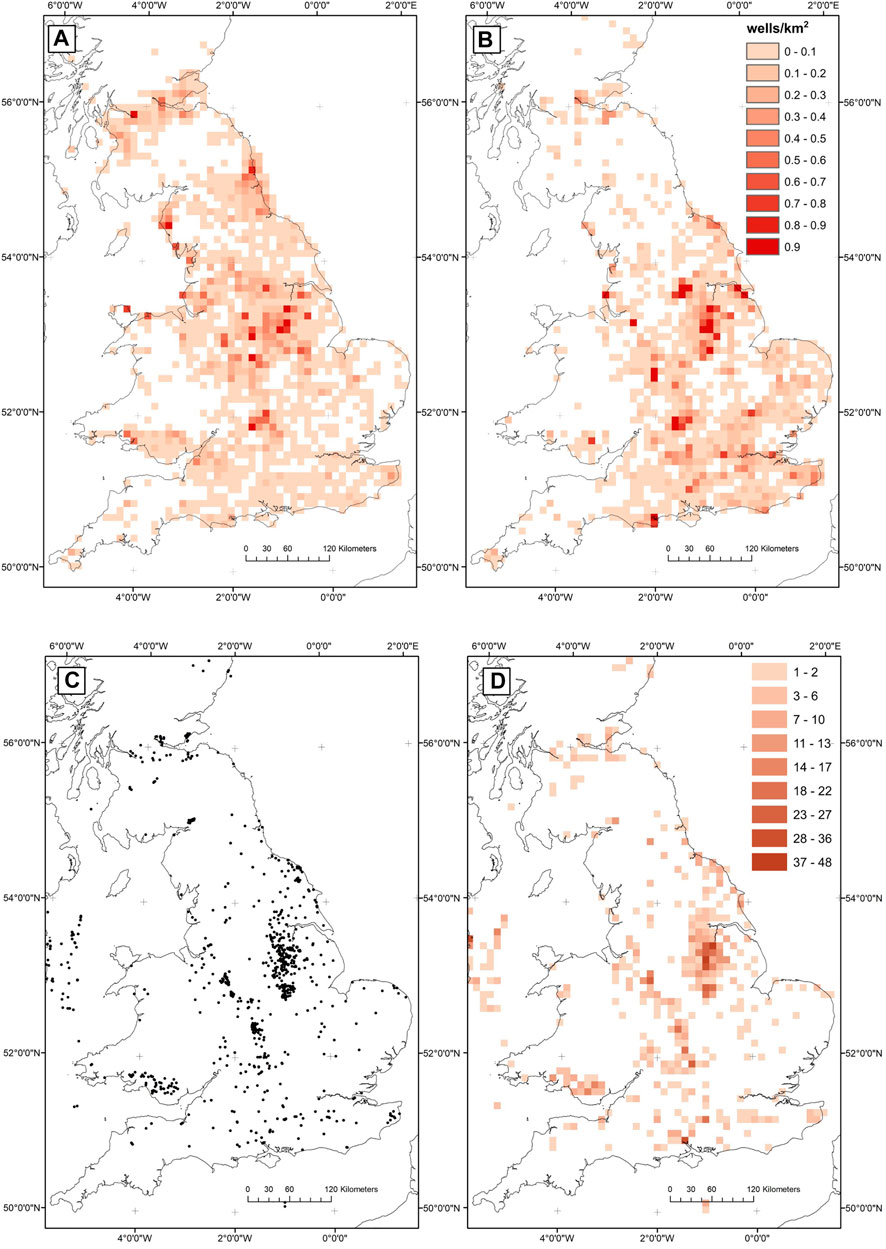
FIGURE 5. Spatial density of boreholes with (A) geophysical logs and (B) rock samples and maps showing (C) the location of boreholes with temperature measurements and (D) the number of temperature measurements per 10 km2.
Temperature Data
The BGS Geothermal Catalog is a published compilation of temperature and heat flow measurements from across the onshore United Kingdom. Figure 5C shows the location of individual boreholes with temperature measurements and Figure 5D shows the number of temperature measurements in a 10 km by 10 km quadrant. Average nearest neighbor analysis returns an observed mean distance of 1668 m compared with an expected mean distance of 9538 m. This returns a nearest neighbor ratio of 0.188, with Z-score of −60.31 and P-value of less than 0.01 meaning there is a less than 1% likelihood that this is random and indicating the data are strongly clustered. Global Moran’s I analysis, indicates that location of temperature measurements is clustered with respect to depth, with a Z-score of 35.303, and P-value of less than 0.01 meaning there is a less than 1% likelihood that the clustering is random. As well as spatial clustering, the measurements of temperature in the boreholes are also over a limited depth range. As documented by Rollin. (1995), there are ∼2,600 temperatures at over 1,150 sites. Of these, geothermal gradients are estimated in the dataset for ∼1700 measurements. Over 90% of the temperature data are from depths less than 2000m and ∼27% are from a depth shallower than 500 m (Figure 6A). While the dominant trend is one of increasing temperature with depth, there is no simple relationship. The downhole temperatures in the catalog are used to estimate geothermal gradients using a modified air surface temperature, however, estimates of geothermal gradient were not used in this study, as the method of determining land surface temperature is an oversimplification and not accurate without correction. There are only 116 temperature measurements from depths greater than 2000 m, and as Figure 6A shows there is a very significant vertical sampling bias.
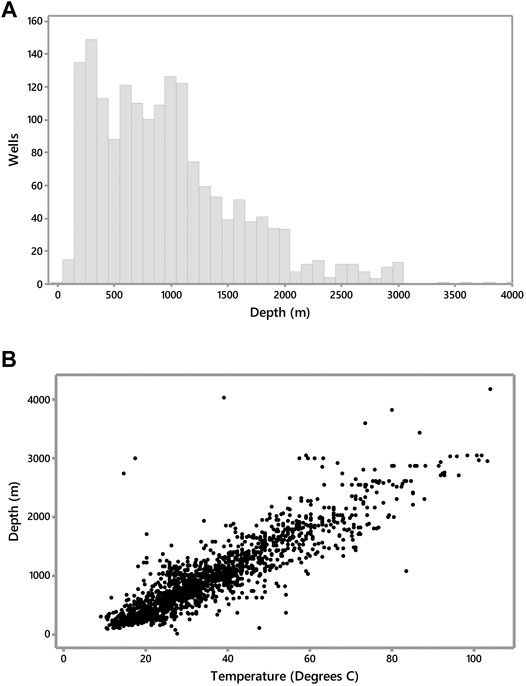
FIGURE 6. Histogram of (A) temperature measurements by depth and (B) temperature vs depth plot.
An analysis of the distribution of the temperature data with respect to the domestic and non-domestic heat demand in the United Kingdom (Taylor et al., 2014) finds 141 of the measurements (∼8%) are within high heat demand areas. Table 3 lists the four largest areas with a heat demand greater than10 000 MWh/km2 and the associated deep data associated with each area. Figures 7A–D are maps of London, Birmingham, Manchester and Glasgow with the location of temperature measurements plotted, as well as the location of deep borehole and 2D and 3D seismic reflection surveys over the same geographical areas. In some heat demand hotspots there are multiple temperature measurements, and in some cases, these are across multiple boreholes. However, there are areas of high heat demand with no temperature measurements in the database, for example, Leeds and Glasgow. Although temperatures from boreholes drilled since the 1990 are not currently captured in the BGS Geothermal Catalog, across the areas of highest heat demand, i.e., Manchester to Liverpool area (Table 3) there are 79 deep boreholes.
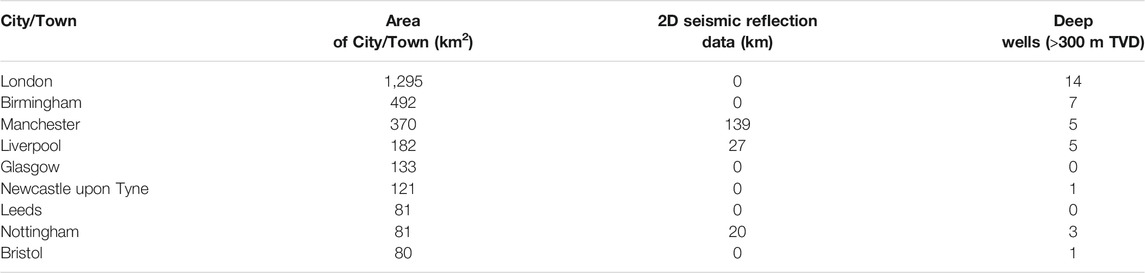
TABLE 3. Data coverage for 10 largest areas of annual domestic heat demand above 10,000 MWh/km2. Both extent of 2D seismic reflection data and number of deep wells are quantified within these areas. See Figure 7 for map view of London, Birmingham, Manchester and Liverpool.
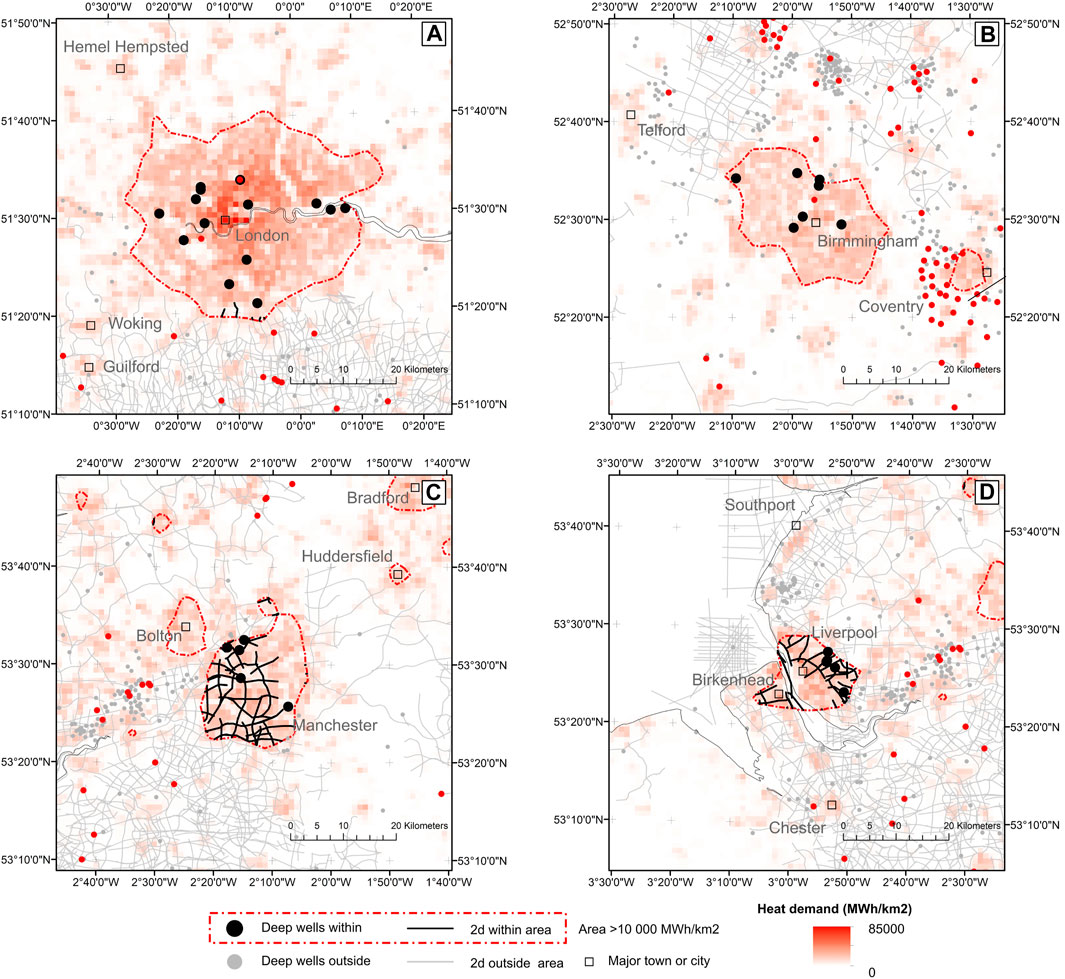
FIGURE 7. Subsurface data coverage, showing the location of both 2D seismic data and the deep boreholes from UKOGL in relation to heat demand across (A) London, (B) Birmingham, (C) Manchester and (D) Liverpool.
Seismic Reflection Data
Seismic Reflection Data Coverage
The location, line length (in the case of 2D) and area (in the case of 3D) of seismic reflection data onshore United Kingdom have been analyzed to determine the spatial distribution of the data. Figure 8A shows the location of all 2D seismic reflection lines. Onshore United Kingdom there are ∼75 871 km of 2D seismic reflection data which cover an area of ∼100 000 km2. As with the deep boreholes, it is almost exclusively in either the Carboniferous Basins of Northern England and the Midlands, or the Mesozoic Basins of Southern England. The density of data varies dramatically, with the maximum coverage being 700 km in a single 10 km2 quadrant and the minimum being 7 km. Across the onshore sedimentary basins the greatest coverage of 2D data are located across the Wessex and East Midlands Basins (Figure 8B). As shown in Figure 8A, over 90% of the 2D seismic reflection data onshore United Kingdom was acquired prior to 1990. The mean length of a 2D seismic line is 8.2 km and the longest individual 2D seismic line is 67.4 km. As a comparison, in the 10 000 km2 offshore area of the United Kingdom East Irish Sea Basin there are 72,454 km of 2D seismic reflection lines; approximately 10 times the data density in one offshore basin compared with the whole of the United Kingdom onshore.
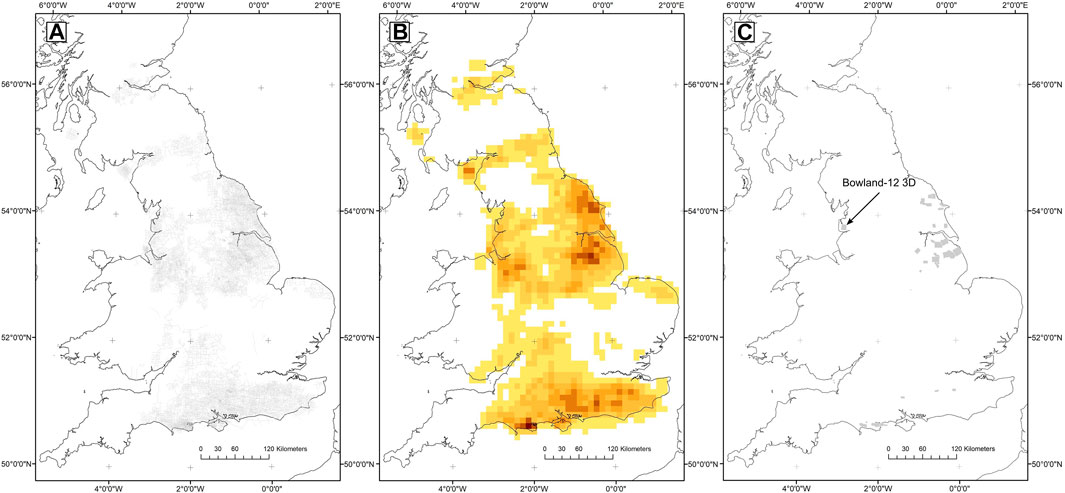
FIGURE 8. A) 2D seismic data across the United Kingdom and (B) the number of line km of 2D seismic per 10 km2 and (C) location of all 3D seismic reflection surveys onshore the United Kingdom (gray polygons) with the location of Bowland-12 3D survey highlighted.
Three-dimensional seismic reflection data onshore United Kingdom is limited to just 32 surveys (Figure 8C) covering an area of ∼2400 km2 (covering ∼1% of the United Kingdom). As a comparison, the Netherlands has a land area of ∼41 543 km2 across which there is ∼14 000 km2 of onshore 3D seismic reflection data (equivalent to ∼34% of the Netherlands). Onshore the United Kingdom the largest onshore 3D survey is 363 km2, which is the Lincswold02 3D survey. Using the current (as of April 2020) Petroleum and Exploration Development Licences (PEDL) outlines from the OGA, there are 12 PEDL which have complete 3D seismic coverage. Presently, 114 out of 181 of the current PEDL have no 3D seismic coverage and 19 have less than 10% coverage. Figure 9B is a histogram of 3D seismic reflection area acquired by year onshore United Kingdom, and with only 638 km2 acquired since 2010. Of these surveys five are within the prospective shale gas exploration areas identified by the BGS (Andrews, 2013). These prospective areas total ∼20 000 km, however, there has only been 452 km2 of new 3D seismic acquisition in these areas, which amounts to ∼2% of the total prospective areas.
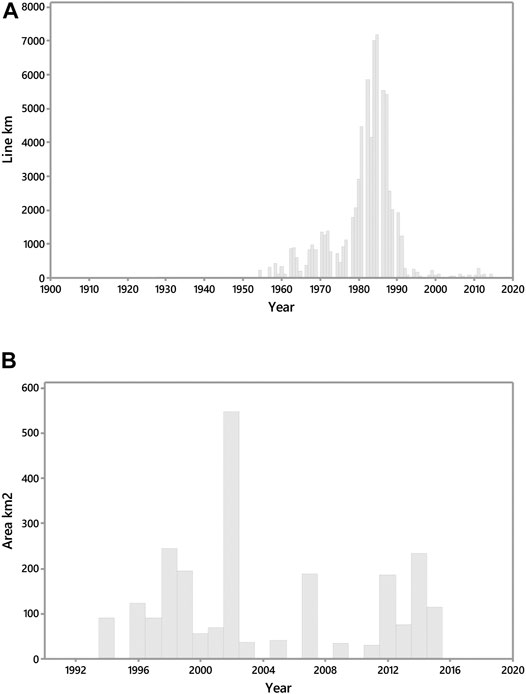
FIGURE 9. Histograms of (A) length of 2D seismic lines acquired onshore the United Kingdom by year, and (B) area of 3D seismic surveys acquired onshore the United Kingdom by year.
When the coverage of 2D and 3D seismic reflection data are compared with the domestic and non-domestic heat demand across the United Kingdom, only ∼500 km of the existing 2D seismic reflection data intersect areas of domestic heat demand above 10,000 MWh/km2 annually. This is less than1% of the 2D seismic reflection data. There are no 3D seismic reflection data in these areas. Table 3 summarizes the coverage of data and the total length of 2D seismic data and the number of boreholes within the ten largest areas where heat demand is greater than10 000 MWh/km2. Whilst some PEDL licences include urban areas (of high heat demand), active exploration and acquisition of seismic data in such built up condition is practically impossible due to the level of disruption and is therefore, considered uneconomic and societally unacceptable.
Seismic Reflection Data Quality
The study has looked at the quality of 3D seismic reflection data specifically within a Petroleum Exploration Development Licence (PEDL) where hydraulic fracturing took place at two boreholes between 2018 and 2019. There are 43 km of 2D lines across this PEDL and a single 3D seismic reflection survey. Interpretations of this 3D seismic survey have been described previously with implications for both exploitation of resources (Clarke et al., 2018) and for the evaluation of induced seismicity (Anderson and Underhill, 2020). Anderson and Underhill. (2020) recently described the structural setting of the area and the implications for induced seismicity, for example, geological faults below seismic resolution. Here the geophysical characteristics of the 3D survey are described, focusing on the frequency content and the implications for the resolution and quality of the data. Figure 10 shows how the frequency spectrum for the 3D data varies by depth (in two-way-time [TWT]) of investigation. To examine the impact of frequency content on the quality of the seismic reflection data, Figure 11 shows example seismic sections of the original post-stack seismic volume (Figure 11A) with high frequency cut offs applied at 90 Hz (Figure 11B), 60 Hz (Figure 11C) and 40 Hz (Figure 11D). The difference between the original and filtered seismic reflection data are shown in Figure 12. Filtering out the high frequency component (greater than 90 Hz) of the 3D survey (Figure 11B) makes almost no difference to the seismic image (Figure 12A), aside from some high frequency noise in the near surface section (upper most 500 ms TWT) section. Filtering out the component greater than 60 Hz removes some coherent energy above 1500 ms, but below this there is very little difference (Figure 12B). Filtering out greater than 40 Hz component results in removing coherent energy in the interval shallower than 1500 ms as well as some deeper coherent energy (Figure 12C). In this area, the exploration targets were at ∼1000 ms. While there is overall a higher frequency content at shallower depths, this does not contribute to improving the overall interpretability of the data and suggests that much of the higher frequency content could be noise rather than coherent energy. Frequency is a key parameter controlling the resolution of faults in seismic images. The maximum vertical resolution is directly related to the ability to distinguish individual reflecting surfaces (see Yilmaz, 2001) and in the case of the Bowland-12 survey is approximately 60 m at the target intervals. For the horizontal resolution, assuming that the Fresnel zone is reduced to a small circle by 3D migration (see Brown, 2011), then in the case of the Bowland-12 survey the horizontal resolution can be estimated to be ∼40 m. The frequency content of the data and resulting estimated resolution means it is difficult to distinguish layers and features below these limits. The implications of the vertical and horizontal resolution of both 2D and 3D seismic data for shale gas exploration and other geoenergy activities is explored in the discussion.
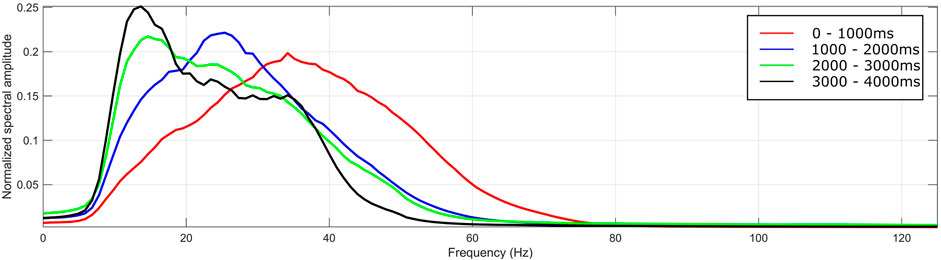
FIGURE 10. A) A simple comparison of the frequency content of the Bowland-12 3D seismic reflection survey for different time intervals. The frequency content decreases with depth.
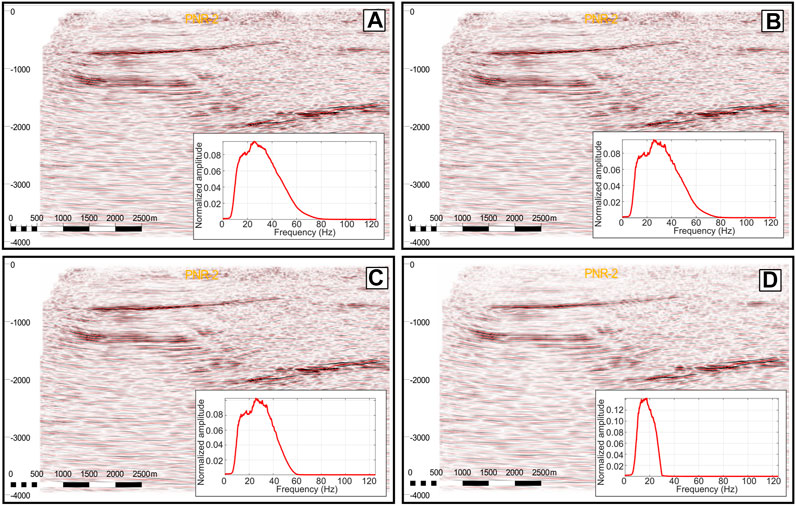
FIGURE 11. Comparison of seismic sections adjacent to the Preston New Road 2 borehole. (A) unfiltered; (B) low pass filter cut at 90 Hz; (C) low pass filter cut at 60 Hz and d) a low pass filter cut at 40 Hz. The section is orientated E-W (XL 1234).
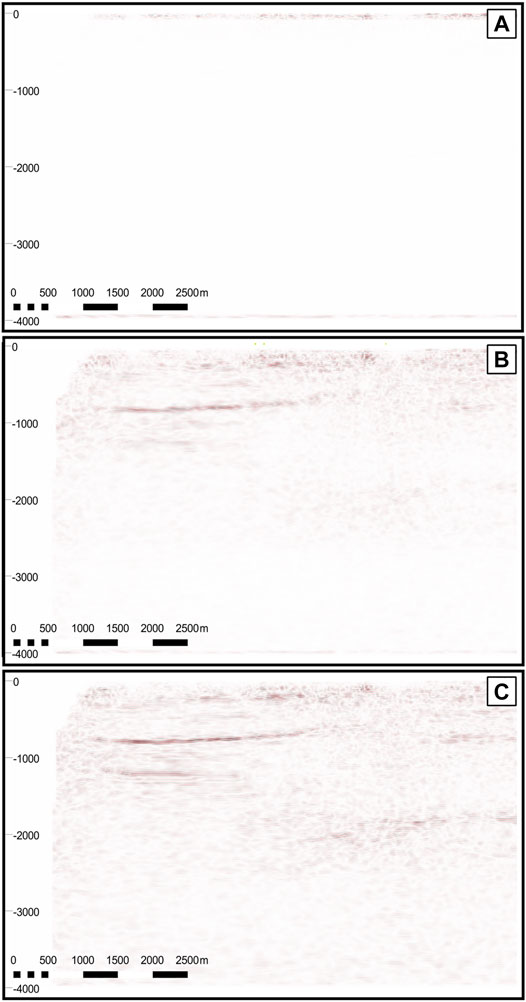
FIGURE 12. Difference between the original seismic data and a) low pass filter cut at 90 Hz; b) low pass filter cut at 60 Hz and c) low pass filter cut at 40 Hz. The section is orientated E-W (XL 1234).
Distribution of Data in Relation to Geological Resources
The acquisition of seismic reflection surveys and the drilling of boreholes would have been planned geological objectives. It is found that ∼71% of boreholes greater than 1 km deep, 74% of the 3D seismic surveys, and 37% of 2D seismic reflection lines either directly overlie or are within 10 km of oil and gas fields within identified in the OGA Onshore Fields database. This non-uniform distribution of data is a direct consequence of the nearly all seismic reflection data and deep boreholes being specifically to delineate and produce hydrocarbons resources. The clustering of data is reflected in that 50% of the onshore oil and gas boreholes in the OGA database being identified as for production. These boreholes were drilled with the specific objective of producing hydrocarbons from a delineated area. The depth range of each these boreholes reflects the target reservoir depth for the given field, therefore the non-uniform sampling by depth is also a function of resource distribution. The temperature data within the BGS Geothermal Catalog does not have a close spatial association with historic or current productive fields. Just ∼7% of temperature measurements are from boreholes located within the oil and gas fields in the OGA Onshore Fields database, with ∼28% within 10 km. The clustering of existing subsurface data identified reflects both the areas of historic and current oil and gas exploration and production onshore the United Kingdom. These productive or historically productive areas of the onshore sedimentary basins have been repeatedly the target of geophysical data acquisition and drilling. A summary of the data acquired by sedimentary basin areas onshore the United Kingdom can be found in Supplementary Table S1. This deliberate focus of data acquisition is demonstrated by the fact that ∼58% of boreholes greater than 300m depth in UKOGL records are located within the East Midlands and North East Basin area, which is also the location for ∼61% of the onshore fields within the OGA records. Global Morans I analysis of the UKOGL borehole records indicate that boreholes cluster with respect to depth (Z-score 56.85, P-value less than 0.01), which indicate clusters of boreholes likely sample to the similar depths, and as such similar geological successions.
For the boreholes, 30 – 300 m in the BGS borehole records indicate that in total 49,066 boreholes intersect the eleven key aquifers in the United Kingdom. This is ∼10% of the boreholes between 30 and 300 m. The distribution of these boreholes reflect the geological trends of the aquifers, and where boreholes are grouped by the aquifer they intersect, nearest neighbor analysis indicate that all boreholes are clustered and all with less than 1% likelihood that this clustered pattern is random (see Supplementary Table S2 for expanded statistics). Global Moran’s I analysis, indicates that, for all aquifers apart from the Spilsby Sandstone, that boreholes are clustered with respect to depth, all with a less than 1% likelihood that the clustering is random.
Discussion
Like in many countries, the acquisition of subsurface data onshore United Kingdom has been driven by the exploration and exploitation of natural resources. This means that the data that exist to investigate the subsurface are biased and often display clustering, as is evidenced by this study. Pérez-Díaz et al. (2020) break down the process of transforming geoscientific data to geological knowledge into acquisition, processing, analysis, interpretation, and modeling. The findings presented here show that quantification of sampling bias, data clustering and underlying limitations are vital to understand prior to analysis, interpretation, and modeling of the data.
Subsurface Mapping and Geoenergy
The ability to create accurate models of the subsurface relies on data being representative of the area of interest. Data acquisition in oil and gas exploration is location biased, and often clustered, because it is acquired to test a geological scenario that may have multiple objectives. This clustering has been demonstrated using spatial statistics. Onshore oil and gas exploration boreholes exhibit significant clustering, as do the temperature data that are frequently acquired in these boreholes. Of the total onshore area of the United Kingdom, i.e., ∼243 000 km2, the 76 136 km of 2D seismic data covers an area of ∼109 900 km2. This means that less than half of the total onshore area of the United Kingdom is covered by any subsurface image. As noted previously, when compared with the offshore of the United Kingdom, where seismic acquisition is easier, the onshore United Kingdom has a relative paucity of both 2D and 3D seismic reflection data and a significant deficit in the relative quality of the information that can be derived from these data.
3D seismic reflection data cover a total of just 2400 km2 of the onshore United Kingdom. The limited extent of any single 3D seismic survey onshore the United Kingdom limits the ability to map or extend our geological knowledge and understanding. The largest onshore survey is 363 km2 (Lincswold-02) and is approximately 30 km by 12 km. Similarly, the limited extent to which surveys are adjacent to one another and form a patchwork from which larger areas can be mapped is in the same location where the Lincwold-02 is adjacent to and overlaps with the Saltfleetby-99 survey and together cover ∼380 km2. Despite the United Kingdom Government encouraging and overseeing shale gas exploration and a number of companies having embarked on shale gas exploration programmes (see Selley, 2012) only 638 km2 of 3D seismic reflection data have actually been acquired across ∼20 000 km the prospective areas since 2010 (i.e. ∼3% of the prospective area). Overall, the paucity of 3D seismic data onshore the United Kingdom limits the ability to interpret geological structure and trends beyond a handful of areas. Despite the critical role that 3D seismic reflection data have in exploration and exploitation, and their importance in future geoenergy activities such as CCS, there is a limit to their resolution and, therefore, the features that can be resolved to characterize the full complexity and heterogeneity of the subsurface. For future geoenergy projects, operators should report the parameters and resolution of their seismic reflection surveys ahead of consents being given, for example, to hydraulically fracture.
As is now well documented, induced seismicity felt by the local population has been associated with hydraulic fracturing at two prospective shale gas sites in the United Kingdom (Clarke et al., 2014; Clarke et al., 2019). At both Preese Hall (Clarke et al., 2014) and Preston New Road (Clarke et al., 2019), the focus of studies has largely been the monitoring and prediction of seismicity using passive seismic techniques, (e.g. Clarke et al., 2019). However, the observations and interpretations of the geology prior to the hydraulic fracturing and the suitability of 2D and 3D seismic reflection data to make confident interpretations has received limited consideration. The analysis presented on frequency content and resolution of the Bowland-12 3D survey indicate that the ability to interpret structural discontinuities, such as faults, which could be reactivated during hydraulic fracturing, is fundamentally limited by the extent and quality of the data. In the case of the Preese Hall-1 borehole, the geological and geophysical interpretations for the hydraulic fracture plan were based on 2D seismic data (Green et al., 2012). If there is even moderate structural complexity then the migration process in a vertical plane may be inadequate to capture this (Brown, 2011). The limitations for geological interpretation are compounded by the sparsity and spacing of the 2D seismic reflection data. The use of 3D seismic reflection data reduces the uncertainty in pre-drill characterisations and predictions (Brown, 2011), including the presence and geometry of faults. By acquiring 3D seismic reflection data it may have been possible to improve the structural interpretation of faulting within the basin, as also suggested by Green et al. (2012). At both Preston New Road boreholes (PNR-1 and PNR-2) the hydraulic fracture planning did utilize 3D seismic reflection data. It has been described previously (Clarke et al., 2019) that the reactivated fault which resulted in the induced seismicity was not imaged using the Bowland-12 3D seismic reflection survey. The analysis of the post-stack seismic data here suggests that ahead of any planned drilling or hydraulic fracturing it would have been possible to report that the data would not be suitable for interpreting faults with either vertical (throw) or horizontal (heave) displacements below the 40 and 60 m estimated resolutions respectively. In addition, it is possible that the resolution of the data are lower than estimated from the seismic frequency because the higher frequencies in the Bowland-12 3D data do not contribute to the overall interpretability of the data (Figures 12A–C). Given these constraints, the interpretation of a fault with a vertical offset of less than 50 m would be highly uncertain. The overall accuracy and precision of the 3D seismic reflection data for structural interpretations is limited by the vertical and horizontal resolution of the data. It should also be noted that the in-situ stress data for west England (Kingdon et al., 2016; Fellgett et al., 2018) highlights that most faults are likely to be optimized for strike-slip failure. Faults which are dominantly dip slip displacement are frequently simpler to identify in seismic reflection data as they juxtapose intervals with different seismic properties against each other. However, dominantly strike-slip faults do no juxtapose differing intervals against one another, and therefore are frequently more difficult to interpret in seismic reflection data. In strike slip stress regimes, there may be an increased risk of induced seismicity, where faults are more difficult to identify with equivalent data in dominantly dip slip settings.
Both borehole and seismic reflection data show significant clustering, with the borehole data also exhibiting a clustering and sampling bias with respect to depth. Non-representative sampling is an unavoidable consequence of collecting data to delineate resources for the exploration and production of geological resources (see Pyrcz and Deutsch, 2003). In the case of restricted depth of investigations during drilling this can also result in the underlying geological intervals not being sufficiently sampled to have a representative dataset, (e.g. Pyrcz and Deutsch, 2003). The ability to predict subsurface properties, such as temperature, relies on calibrating models against existing data. If the existing data are clustered, and there is a significant sampling bias then making predictions, based on models, away from data rich areas inevitably comes with an increased uncertainty. Representative datasets and associated statistics are vital for uncertainty modeling as sampling bias will bias any analysis of the uncertainties (Pyrcz and White., 2015). As discussed by Bond. (2015), the way in which these uncertainties are communicated in geosciences is important from a social and economic perspective because the public are increasingly concerned with the decision-making processes and the associated risks and uncertainties.
The subsurface will likely be required to deliver a low carbon energy transition in the United Kingdom, for example the deployment of CCS, energy storage (methane and hydrogen), for the continued, but sustainable extraction of natural resources (Stephenson et al., 2019) and likely vital for long term disposal of radioactive waste. However, our ability to sustainably exploit the subsurface relies on our ability to predict and model it accurately. Given the vintage of much of the existing seismic reflection data, a consideration of future geoenergy projects should be whether existing data are suitable or whether a step change in onshore seismic data quality (and coverage) will be required to both fully understand the opportunity and to demonstrate that activities will have a low impact on communities and the environment. The variability in the extent and quality of existing data across the United Kingdom means that decision makers should include an assessment on the suitability of data from the project inception phase.
This analysis here indicates that for the exploration and production of geothermal energy for direct use heating, that the existing subsurface data are likely insufficient to provide enough confidence for widespread adoption. It highlights, that there likely needs to be renewed data collection within urban areas with high heat demand and also in regions of high industrial heat use. This should include acquisition of geophysical data to aid predrill predictions, and temperature data collected in deep boreholes to improve calibration of thermal models. It is also evident that the resolution and extent of existing geophysical datasets has been insufficient to describe the distribution of faults and discontinuities with the granularity required to make accurate predictions of the likelihood of induced seismicity. Given the sparsity of 3D seismic data onshore the United Kingdom, future geoenergy projects which would inject fluid into the deep subsurface could benefit from the acquisition of 3D seismic data of the high resolution achievable.
Governance and Regulatory Challenges
In the United Kingdom, the governance and regulation of deep subsurface activities involves different decision makers and regulatory bodies, including the Oil and Gas Authority, the Environment Agency and The Health and Safety Executive. Hawkins. (2015) highlighted that in the case of hydraulic fracturing the existing conventional oil and gas regulation failed to translate into adequate controls for the shale gas industry. The transition from the dominant use of the deep subsurface in the United Kingdom being for fossil fuel production in the offshore areas, to a more complex and multi-faceted system onshore, potentially raises questions on the suitability of existing governance and regulation structures in managing activities. An example could be the move to localized energy systems for the use of geothermal energy (Lloyd, 2018). As highlighted by this study, both the coverage and quality of existing subsurface data vary considerably across United Kingdom regions and communities. Consideration to governance, regulation and guidelines should be addressed ahead of expansion of these nascent subsurface activities and should consider best practice guidance on the minimum data requirements ahead of activities which perturb the subsurface to design and implement more effective mitigation measures for the potential impacts on communities and the environment. Given that subsurface data have inherent resolution limitations, and that hydraulic fracturing by its very nature perturbs the subsurface, it could be argued that there should be a minimum requirement for data resolution ahead of such activities. At present data requirements for onshore oil and gas operations are outlined in PONS 9b (The Oil and Gas Authority, 2021), which sets out the specific requirements for reporting obligations with regard onshore well and seismic data, including information which must be reported to OGA. Despite the reporting requirements being set out, there are no data acquisition requirements, rather a requirement that “…if acquired [data] should be supplied … “. The current requirements focus on if something exist not whether the data collected was fit for purpose.
The exploration and production of unconventional hydrocarbons which use hydraulic fracturing methods have brought into sharp focus the challenges in confidently predicting the subsurface. There is typically a larger uncertainty in subsurface interpretations using 2D seismic reflection data compared with 3D seismic reflection data, with reduced uncertainty a function of both improved areal coverage and the benefits of 3D migration (Bacon et al., 2007). The Consolidated Onshore Guidance (The Oil and Gas Authority, 2018) specifies that “a map and seismic lines showing faults near the well and along the well path” should be included but makes no specific reference to demonstrating the suitability of the underlying data on which those interpretations are made. There is no requirement for the operators to demonstrate that the seismic refection data are specifically suitable for the activity that is being planned. The required information relates to primarily to interpretations (or knowledge), which therefore suggests that a transparent review of these data and interpretations prior to consent could be considered an appropriate measure.
How industry and society utilize the deep subsurface is likely to change as a result of the need to decarbonize energy systems. This change undoubtedly will bring about new regulations and guidance. The status quo of adopting previous practice from either onshore or offshore oil and gas exploration and production, for nascent geoenergy activities is unlikely to be a justifiable position and new frameworks should consider the inherent uncertainty and possible impacts of deep subsurface activities.
Communities and Science Communication
Risks associated with subsurface development are a major public issue for United Kingdom citizens, especially since 2011 when hydraulic fracturing led to seismic activity at Preese Hall (Clarke et al., 2014). Moreover, strong public opposition to hydraulic fracturing and subsurface development appear to be linked to the uncertainty associated with seismic activity, even though few United Kingdom residents have actual first-hand experiences with high hazard seismic events (Cotton, 2015; Szolucha, 2018). Nevertheless, not all United Kingdom regions and communities are equally exposed to subsurface development. That is, there are significant regional and community variations in the subsurface resources, and as shown here the quantity and quality of this data relates directly to the uncertainty in characterizing these resources, and the assessment of the risks. This unequal distribution of subsurface risk is also compounded by various interpretations of risk. Social science research suggests that variations in perceptions of risk are explained by geography, culture, socioeconomic status, ethnicity, race, and gender (Flynn et al., 1994). As just one example of the importance of context, consider the case of hydraulic fracturing in Oklahoma (United States), a state highly dependent on oil and gas development. The perceived risks associated human induced seismicity among Oklahoma residents are less of a concern than perceived risks associated with pollution, especially to water and poisoning of livestock (Campbell et al., 2020). Thus, when subsurface data are mapped out across the United Kingdom it demonstrates the potential for enormous variation in interpretation of risk according to the spatial location of boreholes as well as the constellation of community and demographic combinations that may together shape risk perceptions, (e.g. Kropp, 2018). This distribution of perception of risk in conjunction with an assessment of subsurface uncertainty related to geoenergy projects has yet to explored in the United Kingdom, however recent studies into risk perception as a function of ecosystem services relating to renewable energy, (e.g. Cordoves-Sánchez and Vallejos-Romero, 2019) suggests there are good reasons to undertake such an analysis in the future.
There is an increasing public demand for high quality information that is accurate, consistent, complete, timely and representative, (e.g. Wang and Strong, 1996). This analysis suggests that seismic reflection and borehole data represent an information source that can be used to contribute to information quality and aid in the communication of subsurface risk. However, simply reporting information, even high-quality information, is probably not enough. Social science research suggests that credible information sources are highly important in conveying actual risk (Renn and Levine, 1991). Thus, where data are uncertain or complex the public is likely to rely on experts to help them make sense of subsurface risks that may be reflected in those data. As a result, trust in the experts and institutions is likely to have an important impact on general perceptions about risks associated with subsurface development.
The extent and distribution of these subsurface data open up an important opportunity for geoscientists to help engage United Kingdom citizens about the levels of uncertainty and subsurface risks associated with energy development, (e.g. Buchanan et al., 2014). However, with opportunities also come challenges. That is, while this study is one of the first to assess the extent and resolution of subsurface data across the onshore United Kingdom, much of the underlying data are produced by industry. Thus, information presented by geoscientists will be constantly evaluated within the context of industry trust (Wray et al., 2008; Wachinger et al., 2013; Seeger et al., 2018). The challenge, then, is to convey meaningful information about uncertainty and risk when data generated may be viewed as suspicious, especially when it is not publicly accessible. Therefore, one of the biggest obstacles in conveying accurate perceptions of risk to United Kingdom residents may rest in the fact that frequently subsurface data are generated by industry (Wachinger et al., 2013), although in geosciences, these data may subsequently be avalible for regional synthesis. Such challenges, however, are not usual in risk analysis as researchers find that stakeholders are often perceived to communicate risk through the selective use of data that advances their own interests (Leiss, 1995). Future social science research might test public perceptions about trust in different types of subsurface data. That is, are some types of subsurface data likely to be trusted more by the public? If so, why? Which types of data could be best used to communicate the nature of subsurface risks? What organisations are best placed to communicate data about subsurface risks? Why? These are just a few of the issues that geoscientists may confront when attempting to map the landscape of subsurface risk.
Conclusion
After over a century of subsurface data collection onshore United Kingdom, there remains significant subsurface uncertainties, which in part are due to the quality and accessibility of existing key subsurface datasets. This study highlights a paucity of both borehole and seismic data across the onshore United Kingdom. All subsurface interpretations, be it for well-established activities such as conventional oil and gas exploration and production, or new activities as part of the energy transition, rely on these geophysical or geological data. These interpretations and models are fundamentally limited by the inhomogeneous datasets and the resolution of them. Onshore oil and gas production in the United Kingdom currently accounts for less than 1% of the total production from the United Kingdom (OGA, 2020) and the limited scale of resources, when compared to the offshore, that has restricted further data collection, with companies prioritizing the offshore areas of the United Kingdom Continental Shelf. The lack of extensive and high-quality data could be a fundamental limitation on the expansion of nascent low carbon subsurface activities and technologies. The attention with which the public are now putting on all new energy activities will require geoscientists to clearly articulate the limitations of currently available datasets, and these limitations should highlight areas where new data collection is needed, both to improve coverage, and to improve resolution. The ability to understand and quantify uncertainties in a subsurface description is key to effectively reducing safety, environmental, health and economic risks. Gaining new knowledge through data acquisition cannot be guaranteed to de-risk a subsurface outcome, however, the new knowledge can be vital in the decision-making processes.
The analysis and statistical measures shown here for the onshore United Kingdom subsurface datasets can be used to determine priority areas for future data collection. But the analysis does not address what is enough data for a given activity. There needs to be a concerted effort across geosciences and social sciences to understand what defines an acceptable level of uncertainty, financial risk, and environmental risk. This study raises the question is there a need for regulators to demand minimum data standards as part of the planning process prior to subsurface activities taking place? There is more than ever a social dimension to subsurface uncertainty. Explaining the information contained within the data are as important as the data itself. Never has the spotlight been so focused on the ability of geoscientists to predict the subsurface.
Data Availability Statement
3D Seismic Data. The 3D seismic reflection presented in this study are available from the UKOGL but restrictions apply to the availability of these data. UKOGL data shown here were provided under academic license agreement for use of the data for research purposes. Data are available from the authors upon reasonable request and with permission of the UKOGL. See www.ukogl.com.
OGA Onshore 2D and 3D Seismic Data. The location of 2D and 3D seismic data onshore the United Kingdom analyzed during this study is available from the Oil and Gas Authority (OGA) at https://maps.ukogl.org.uk/arcgis/rest/services/public/public_seismic_BritNatGrid/Mapserver.
BGS Borehole Locations. The BGS borehole location dataset analyzed during this study is available from the www.bgs.ac.uk.
UKOGL Borehole Locations. The location of the UKOGL borehole locations used in this study are available from UKOGL but restrictions apply to the availability of these data, which were used under license for the current study, and so are not publicly available. Data are however available from the authors upon reasonable request and with permission of UKOGL. See www.ukogl.com.
BGS Aquifers. The aquifer maps used to analyze the distribution of boreholes with respect to aquifers was used under Open Government Licence and is available from https://www2.bgs.ac.uk/groundwater/shaleGas/aquifersAndShales/data.html.
BGS Geothermal Catalog. The BGS Geothermal Catalog data analyzed during this study is available from http://nora.nerc.ac.uk/id/eprint/512272/
BGS Geophysical Logs and Borehole Samples. The location of geophysical logs and borehole samples used in this study are available from the BGS but restrictions apply to the availability of these data, which were used under license for the current study, and so are not publicly available. Data are however available from the authors upon reasonable request and with permission of BGS. See www.bgs.ac.uk.
UKERC Heat Demand. The domestic and industrial heat demand data from Taylor et al. (2014) is available from https://data.ukedc.rl.ac.uk/browse/edc/efficiency/residential/Buildings/DS4DS.
OGA Offshore 2D Seismic Data. The data used to compare the offshore coverage to the onshore areas is based on the Surveys as Consented 2D shape which is available from https://ndr.ogauthority.co.uk/.
NLOG Seismic. For the comparisons of 3D seismic coverage with the Netherlands, the data are from NLOG, which is manged by the Geological Survey of the Netherlands on behalf of the Ministry of Economic Affairs and Climate https://nlog.nl/en.
Coastline. The coastline shown in Figure 1 is from GSHHG, sourced from NOAA, produced by http://www.soest.hawaii.edu/pwessel/gshhg/. Licenced under GNU Lesser General Public License.
Author Contributions
MI: conceptualization (lead), data curation (lead), formal analysis (lead), investigation (lead), methodology (lead), writing–original draft (lead), writing–review and editing (lead); RB: writing–original draft (supporting), writing–review and editing (supporting); MW: formal analysis (supporting), writing–review and editing (supporting). PS: validation (supporting), writing–review and editing (supporting); RD: conceptualization (supporting), writing–original draft (supporting), writing–review and editing (supporting); AK: data curation and evaluation (supporting), writing–review and editing (supporting).
Funding
This work has in part been funded by the Natural and Environment Research Council (NERC) and the Economic and Social Research Council (ESRC) project: Assessing and monitoring the United Kingdom Shale Gas Landscape (UKSGL) (Grant ref NE/R017492/1); Impact of hydraulic fracturing in the overburden of shale resource plays: Process-based evaluation (SHAPE-UK) (Grant Ref: NE/R01745X/1); and The Social Construction of Unconventional Gas Extraction: Toward a greater understanding of socio-economic impact of unconventional gas development (NE/R018146/1).
Conflict of Interest
The authors declare that the research was conducted in the absence of any commercial or financial relationships that could be construed as a potential conflict of interest.
Acknowledgments
The authors are grateful to the United Kingdom Onshore Geophysics Library for access to information relating onshore oil and gas exploration wells, and to access to the 3D seismic reflection data analyzed as part of this study. The research contains data derived from BGS Solid Geology map. Maps throughout this study were created using ArcGIS software by Esri. MI and RJD are grateful to Schlumberger for academic license for Petrel. For AK this manuscript was published with the permission of the Executive Director of the British Geological Survey (UKRI).
Supplementary Material
The Supplementary Material for this article can be found online at: https://www.frontiersin.org/articles/10.3389/feart.2021.629960/full#supplementary-material
References
Alcalde, J., Heinemann, N., Mabon, L., Worden, R. H., De Coninck, H., Robertson, H., et al. (2019). Acorn: Developing Full-Chain Industrial Carbon Capture and Storage in a Resource- and Infrastructure-Rich Hydrocarbon Province. J. Clean. Prod. 233, 963–971. doi:10.1016/j.jclepro.2019.06.087
Anderson, I., and Underhill, J. R. (2020). Structural Constraints on Lower Carboniferous Shale Gas Exploration in the Craven Basin. NW England, Pet. Geosci. petgeo2019–2125. doi:10.1144/petgeo2019-125
Andrews, I. J. (2013). The Carboniferous Bowland Shale Gas Study: Geology and Resource Estimation. London: British Geological Survey for Department of Energy and Climate Change.
Bacon, M., Simm, R., and Redshaw, T. (2007). 3-D Seismic Interpretation. Cambridge University Press.
Baker, S., Ponniah, D., and Smith, S. (1999). Risk Response Techniques Employed Currently for Major Projects. Construction Management Econ. 17, 205–213. doi:10.1080/014461999371709
Bles, A. M. V. D., Linden, S. V. D., Freeman, A. L. J., Mitchell, J., Galvao, A. B., Zaval, L., et al. (2019). Communicating Uncertainty about Facts, Numbers and Science. Roy. Soc. Open Sci. 6, 181870. doi:10.1098/rsos.181870
Bommer, J. J., Crowley, H., and Pinho, R. (2015). A Risk-Mitigation Approach to the Management of Induced Seismicity. J. Seismol 19, 623–646. doi:10.1007/s10950-015-9478-z
Bond, C. E. (2015). Uncertainty in Structural Interpretation: Lessons to Be Learnt. J. Struct. Geology 74, 185–200. doi:10.1016/j.jsg.2015.03.003
Bradshaw, M., and Waite, C. (2017). Learning from Lancashire: Exploring the Contours of the Shale Gas Conflict in England. Glob. Environ. Change 47, 28–36. doi:10.1016/j.gloenvcha.2017.08.005
Broad, O., Hawker, G., and Dodds, P. E. (2020). Decarbonising the UK Residential Sector: The Dependence of National Abatement on Flexible and Local Views of the Future. Energy Policy 140, 111321. doi:10.1016/j.enpol.2020.111321
Brown, A. R. (2011). Interpretation of Three-Dimensional Seismic Data. Society of Exploration Geophysicists and American Association of Petroleum. doi:10.1190/1.9781560802884
Buchanan, K., Russo, R., and Anderson, B. (2014). Feeding Back about Eco-Feedback: How Do Consumers Use and Respond to Energy Monitors? Energy Policy 73, 138–146. doi:10.1016/j.enpol.2014.05.008
Campbell, N. M., Leon-Corwin, M., Ritchie, L. A., and Vickery, J. (2020). Human-Induced Seismicity: Risk Perceptions in the State of Oklahoma. The Extractive Industries and Society.
Clarke, H., Eisner, L., Styles, P., and Turner, P. (2014). Felt Seismicity Associated with Shale Gas Hydraulic Fracturing: The First Documented Example in Europe. Geophys. Res. Lett. 41, 8308–8314. doi:10.1002/2014gl062047
Clarke, H., Turner, P., Bustin, R. M., Riley, N., and Besly, B. (2018). Shale Gas Resources of the Bowland Basin, NW England: a Holistic Study. Pet. Geosci. 24, 287–322. doi:10.1144/petgeo2017-066
Clarke, H., Verdon, J. P., Kettlety, T., Baird, A. F., and Kendall, J. M. (2019). Real‐Time Imaging, Forecasting, and Management of Human‐Induced Seismicity at Preston New Road, Lancashire, England. Seismological Res. Lett. 90, 1902–1915.
Cooper, S. J. G., and Hammond, G. P. (2018). 'Decarbonising' UK Industry: towards a Cleaner Economy. Proc. Inst. Civil Eng. - Energ. 171, 147–157. doi:10.1680/jener.18.00007
Cotton, M. (2015). Stakeholder Perspectives on Shale Gas Fracking: a Q-Method Study of Environmental Discourses. Environ. Plan. A. 47, 1944–1962. doi:10.1177/0308518x15597134
Fellgett, M. W., Kingdon, A., Williams, J. D. O., and Gent, C. M. A. (2018). Stress Magnitudes across UK Regions: New Analysis and Legacy Data across Potentially Prospective Unconventional Resource Areas. Mar. Pet. Geology 97, 24–31. doi:10.1016/j.marpetgeo.2018.06.016
Flynn, J., Slovic, P., and Mertz, C. K. (1994). Gender, Race, and Perception of Environmental Health Risks. Risk Anal. 14, 1101–1108. doi:10.1111/j.1539-6924.1994.tb00082.x
Franks, D. M., Brereton, D., and Moran, C. J. (2010). Managing the Cumulative Impacts of Coal Mining on Regional Communities and Environments in Australia. Impact Assess. Project Appraisal 28, 299–312. doi:10.3152/146155110x12838715793129
Frewer, L., Hunt, S., Brennan, M., Kuznesof, S., Ness, M., and Ritson, C. (2003). The Views of Scientific Experts on How the Public Conceptualize Uncertainty. J. Risk Res. 6, 75–85. doi:10.1080/1366987032000047815
Frewer, L. J., Miles, S., Brennan, M., Kuznesof, S., Ness, M., and Ritson, C. (2002). Public Preferences for Informed Choice under Conditions of Risk Uncertainty. Public Underst Sci. 11, 363–372. doi:10.1088/0963-6625/11/4/304
Green, C., Styles, P., and Baptie, B. J. (2012). Preese Hall Shale Gas Fracturing Review and Recommendations for Induced Seismicity Mitigation. Available at: https://www.gov.uk/government/publications/preese-hall-shale-gas-fracturing-review-and-recommendations-for-induced-seismic-mitigation.
Holdren, J. P., Smith, K. R., Kjellstrom, T., Streets, D., Wang, X., and Fischer, S. (2000). Energy, the Environment and Health. New York: United Nations Development Programme.
Johnson, G. A. L., Somerville, I. D., Tucker, M. E., and Cózar, P. (2011). Carboniferous Stratigraphy and Context of the Seal Sands No. 1 Borehole, Teesmouth, NE England: the Deepest Onshore Borehole in Great Britain. Proc. Yorkshire Geol. Soc. 58, 173–196. doi:10.1144/pygs.58.3.231
Jones, J. (1937). A Seismic Reflection Survey in Eastern England 2nd World Petroleum Congress: World Petroleum Congress.
Kingdon, A., Fellgett, M. W., and Williams, J. D. O. (2016). Use of Borehole Imaging to Improve Understanding of the In-Situ Stress Orientation of Central and Northern England and its Implications for Unconventional Hydrocarbon Resources. Mar. Pet. Geology 73, 1–20. doi:10.1016/j.marpetgeo.2016.02.012
Krause, R. M., Carley, S. R., Warren, D. C., Rupp, J. A., and Graham, J. D. (2014). “Not in (Or under) My Backyard”: Geographic Proximity and Public Acceptance of Carbon Capture and Storage Facilities. Risk Anal. 34, 529–540. doi:10.1111/risa.12119
Kropp, C. (2018). Controversies Around Energy Landscapes in Third Modernity. Landscape Res. 43, 562–573. doi:10.1080/01426397.2017.1287890
Leiss, W. (1995). "Down and Dirty:" the Use and Abuse of Public Trust in Risk Communication. Risk Anal. 15, 685–692. doi:10.1111/j.1539-6924.1995.tb01340.x
Lloyd, H. (2018). A Distributed Energy Future for the UK. London: Buckingham Street Institute for Public Policy Research.
Morton, M. Q. (2014). ‘What Oilfields?’: Onshore Oil in the UK. GEOEXPRO 11. doi:10.4135/9781526405111
O'rourke, D., and Connolly, S. (2003). Just Oil? the Distribution of Environmental and Social Impacts of Oil Production and Consumption. Annu. Rev. Environ. Resour. 28, 587–617. doi:10.1146/annurev.energy.28.050302.105617
Pérez-Díaz, L., Alcalde, J., and Bond, C. E. (2020). Introduction: Handling Uncertainty in the Geosciences: Identification, Mitigation and Communication. Solid Earth 11, 889–897. doi:10.5194/se-11-889-2020
Pyrcz, M. J., and Deutsch, C. V. (2003). The Whole Story on the Hole Effect, 18. Newsletter: Geostatistical Association of Australasia, 3–5.
Pyrcz, M. J., and White, C. D. (2015). Uncertainty in Reservoir Modeling. Interpretation 3 (2), SQ7–SQ19. doi:10.1190/int-2014-0126.1
Renn, O., and Levine, D. (1991). “Credibility and Trust in Risk Communication,” in Communicating Risks to the Public (Springer), 175–217. doi:10.1007/978-94-009-1952-5_10
Rogelj, J., Luderer, G., Pietzcker, R. C., Kriegler, E., Schaeffer, M., Krey, V., et al. (2015). Energy System Transformations for Limiting End-Of-Century Warming to below 1.5 °C. Nat. Clim Change 5, 519–527. doi:10.1038/nclimate2572
Rollin, K. E. (1995). A Simple Heat-Flow Quality Function and Appraisal of Heat-Flow Measurements and Heat-Flow Estimates from the UK Geothermal Catalogue. Tectonophysics 244, 185–196. doi:10.1016/0040-1951(94)00227-z
Ross, J. G. (2004). Risk and Uncertainty in Portfolio Characterisation. J. Pet. Sci. Eng. 44, 41–53. doi:10.1016/j.petrol.2004.02.004
Schafft, K. A., Borlu, Y., and Glenna, L. (2013). The Relationship between Marcellus Shale Gas Development in Pennsylvania and Local Perceptions of Risk and Opportunity. Rural Sociol. 78, 143–166. doi:10.1111/ruso.12004
Seeger, M. W., Pechta, L. E., Price, S. M., Lubell, K. M., Rose, D. A., Sapru, S., et al. (2018). A Conceptual Model for Evaluating Emergency Risk Communication in Public Health. Health security 16, 193–203. doi:10.1089/hs.2018.0020
Selley, R. C. (2012). UK Shale Gas: The Story So Far. Mar. Pet. Geology 31, 100–109. doi:10.1016/j.marpetgeo.2011.08.017
Short, D., and Szolucha, A. (2019). Fracking Lancashire: the Planning Process, Social Harm and Collective Trauma. Geoforum 98, 264–276. doi:10.1016/j.geoforum.2017.03.001
Sjöberg, L. (1998). Risk Perception: Experts and the Public. Eur. Psychol. 3, 1–12. doi:10.1027/1016-9040.3.1.1
Smith, W. (1815). A Memoir to the Map and Delineation of the Strata of England and Wales with Part of Scotland. Cary: John.
Stephenson, M. H., Ringrose, P., Geiger, S., Bridden, M., and Schofield, D. (2019). Geoscience and Decarbonization: Current Status and Future Directions. Pet. Geosci. 25, 501–508. doi:10.1144/petgeo2019-084
Stewart, I. S., and Gill, J. C. (2017). Social Geology - Integrating Sustainability Concepts into Earth Sciences. Proc. Geologists' Assoc. 128, 165–172. doi:10.1016/j.pgeola.2017.01.002
Szolucha, A. (2018). 16 Community Understanding of Risk from Fracking in the UK and Poland. Governing Shale Gas: Development, Citizen Participation And Decision Making In the US, Canada, Australia and Europe. Routledge.
Taylor, S. C., Firth, S. K., Wang, C., Allinson, D., Quddus, M., and Smith, P. (2014). Spatial Mapping of Building Energy Demand in Great Britain. GCB Bioenergy 6, 123–135. doi:10.1111/gcbb.12165
Tepanosyan, G., Sahakyan, L., Zhang, C., and Saghatelyan, A. (2019). The Application of Local Moran's I to Identify Spatial Clusters and Hot Spots of Pb, Mo and Ti in Urban Soils of Yerevan. Appl. Geochem. 104, 116–123. doi:10.1016/j.apgeochem.2019.03.022
The Oil and Gas Authority (2018). Consolidated Onshore Guidance. Avaliable at: https://www.ogauthority.co.uk/onshore/overview/ (Accessed October 30, 2020).
The Oil and Gas Authority (2021). PONS 9b. Available at: https://www.ogauthority.co.uk/exploration-production/petroleum-operations-notices/pon-9b/ (Accessed April 14, 2021).
The UK government, (2008). Climate Change Act. Available at: https://www.legislation.gov.uk/ukpga/2008/27/contents (Accessed: January 30, 2018).
The UK government, (2015). The Infrastrucutre Act. Available at: https://www.legislation.gov.uk/ukpga/2015/7/contents (Accessed October 30, 2020).
Van Der Bles, A. M., Van Der Linden, S., Freeman, A. L. J., Mitchell, J., Galvao, A. B., Zaval, L., et al. (2019). Communicating Uncertainty about Facts, Numbers and Science. R. Soc. Open Sci. 6, 181870. doi:10.1098/rsos.181870
Van Der Voort, N., and Vanclay, F. (2015). Social Impacts of Earthquakes Caused by Gas Extraction in the Province of Groningen, The Netherlands. Environ. Impact Assess. Rev. 50, 1–15. doi:10.1016/j.eiar.2014.08.008
Van Os, H. W. A., Herber, R., and Scholtens, B. (2016). Subsurface Activities and Decision Support Systems. Environ. Impact Assess. Rev. 60, 176–185. doi:10.1016/j.eiar.2016.06.002
Wachinger, G., Renn, O., Begg, C., and Kuhlicke, C. (2013). The Risk Perception Paradox-Implications for Governance and Communication of Natural Hazards. Risk Anal. 33, 1049–1065. doi:10.1111/j.1539-6924.2012.01942.x
Wang, R. Y., and Strong, D. M. (1996). Beyond Accuracy: What Data Quality Means to Data Consumers. J. Manag. Inf. Syst. 12, 5–33. doi:10.1080/07421222.1996.11518099
Williams, L., Macnaghten, P., Davies, R., and Curtis, S. (2017). Framing 'fracking': Exploring Public Perceptions of Hydraulic Fracturing in the United Kingdom. Public Underst Sci. 26, 89–104. doi:10.1177/0963662515595159
Woodcock, N. H., and Strachan, R. A. (2012). Geological History of Britain and Ireland. Oxford: Oxford: Wiley-Blackwell.
Keywords: data, geoenergy, public perception, geothermal, unceratinty, energy policy
Citation: Ireland MT, Brown R, Wilson MP, Stretesky PB, Kingdon A and Davies RJ (2021) Suitability of Legacy Subsurface Data for Nascent Geoenergy Activities Onshore United Kingdom. Front. Earth Sci. 9:629960. doi: 10.3389/feart.2021.629960
Received: 16 November 2020; Accepted: 29 April 2021;
Published: 15 June 2021.
Edited by:
Ryan Mathur, Juniata College, United StatesReviewed by:
Alok Porwal, Indian Institute of Technology Bombay, IndiaJeffrey M Bielicki, The Ohio State University, United States
Martina Leveni, The Ohio State University, United States
Copyright © 2021 Ireland, Brown, Wilson, Stretesky, Kingdon and Davies. This is an open-access article distributed under the terms of the Creative Commons Attribution License (CC BY). The use, distribution or reproduction in other forums is permitted, provided the original author(s) and the copyright owner(s) are credited and that the original publication in this journal is cited, in accordance with accepted academic practice. No use, distribution or reproduction is permitted which does not comply with these terms.
*Correspondence: Mark T. Ireland, bWFyay5pcmVsYW5kQG5ld2Nhc3RsZS5hYy51aw==