 Wei Wang1
 Jing Ba
 José M. Carcione
 Xu Liu
- 1School of Earth Sciences and Engineering, Hohai University, Nanjing, China
- 2Istituto Nazionale di Oceanografa e di Geofsica Sperimentale, Sgonico, Italy
- 3College of Petroleum Engineering & Geosciences, King Fahd University of Petroleum and Minerals, Dhahran, Saudi Arabia
Natural gas hydrates have the properties of ice with a microporous structure and its concentration in sediments highly affects the wave velocity and attenuation. Previous studies have performed investigations based on the measurements of laboratory data, sonic-log data, and field data, whereas the variation trend of wave dissipation with increasing hydrate concentration at different frequencies is still unclear. We consider two different models to study this problem, both based on the Biot-Rayleigh double-porosity theory. In the first model, hydrate is part of the pore infill, unbonded from the grains, and brine saturates the remaining pore space. In the second model, hydrate forms a second skeleton and cements the grains. We obtain the P-wave velocity dispersion and attenuation as a function of the inclusion radius, porosity, and hydrate content. The analysis shows that the predictions of both models agree with the experimental data. At sonic log frequencies, the second model predicts much more attenuation, due to wave-induced local fluid flow (mesoscopic loss), and the behavior is such that below a given hydrate concentration the dissipation increases and then decreases beyond that concentration.
Introduction
The concentration of natural gas hydrate in sediments affects their acoustic properties (Guerin and Goldberg, 2002). In particular, the wave velocity highly increases, even with small concentrations (Chand and Minshull, 2003; Dvorkin et al., 2003; Chand et al., 2004; Guerin and Goldberg, 2005; Lee and Waite, 2008). This property is used to determine the distribution of hydrate in sediments (Tinivella and Carcione, 2001). Moreover, the P-wave quality factor obtained, by attenuation tomography, for instance, can also be used to monitor the presence of gas hydrate (Carcione et al., 2012). Samples from marine sediments or from permafrost regions show that hydrates are microporous (Kuhs et al., 2004). It has been observed that seismic attenuation decreases due to a stiffening effect when the hydrate concentration increases (Dvorkin et al., 2003; Rossi et al., 2007; Gei and Carcione, 2003). Vertical-seismic-profile data in Nankai areas showed no significant attenuation (Matsushima, 2006). However, the sonic log data in the Mallik area show that attenuation increases linearly with hydrate saturation (Guerin and Goldberg, 2002; Chand and Minshull, 2004).
Actually, attenuation depends not only on hydrate concentration, but also on other reservoir properties, such as microstructure (Ecker et al., 2000; Priest et al., 2009). Figure 1 shows different cases (Ecker et al., 1998, 2000; Waite et al., 2009; Zhan and Matsushima, 2018): (1) hydrate grows freely in the pores away from the grains (pore-filling hydrate); (2) hydrate forms a second skeleton (load-bearing hydrate); (3) hydrate cements the grains (contact-cementing hydrate); (4) hydrate evenly deposited on the grain surface (envelope-cementing hydrate). Gas hydrate can be part of the pore infill or rock skeleton (Liu et al., 2018; Lin et al., 2019). Dvorkin and Nur (1993) proposed the BISQ model to effectively combine the global Biot-flow mechanism with the local squirt-flow mechanism. This model can be used to describe seismic attenuation in combination with frozen porous-media theories (Leclaire et al., 1994; Guerin and Goldberg, 2005). The effective-medium theory has been implemented by Helgerud et al. (1999) and Dvorkin et al. (1999). Carcione and Tinivella (2000) presented a Biot-type theory with two solids and one fluid, where hydrate forms an additional skeleton and water is the pore fluid. The concentration of gas hydrate and saturation of free gas has been estimated from seismic velocity and attenuation based on this theory (Carcione and Gei, 2004; Carcione et al., 2005). Lee (2002a, b) extended the classical Biot–Gassmann theory to predict the S-wave velocity. Chand et al. (2006) use the self-consistent approximation, differential effective medium theory and consider the Biot and squirt-flow attenuation mechanisms to estimate the hydrate concentration in the Mallik area. An effective-medium model, considering different microstructures, has been considered in Liu et al. (2017) and Qu et al. (2016) use a model based on penny-shaped and infinite cracks. Sell et al. (2016) combine tomography and 3D modeling to simulate the acoustic properties with digital rock physics, whereas Sell et al. (2018) show that there is an interfacial water film between hydrate and grains through 3D micro-tomography, and a new conceptual squirt-flow model is proposed. Tuan et al. (2019) uses a homogenization theory for multiphase composites to predict wave velocities that agree with laboratory and sonic-log data.
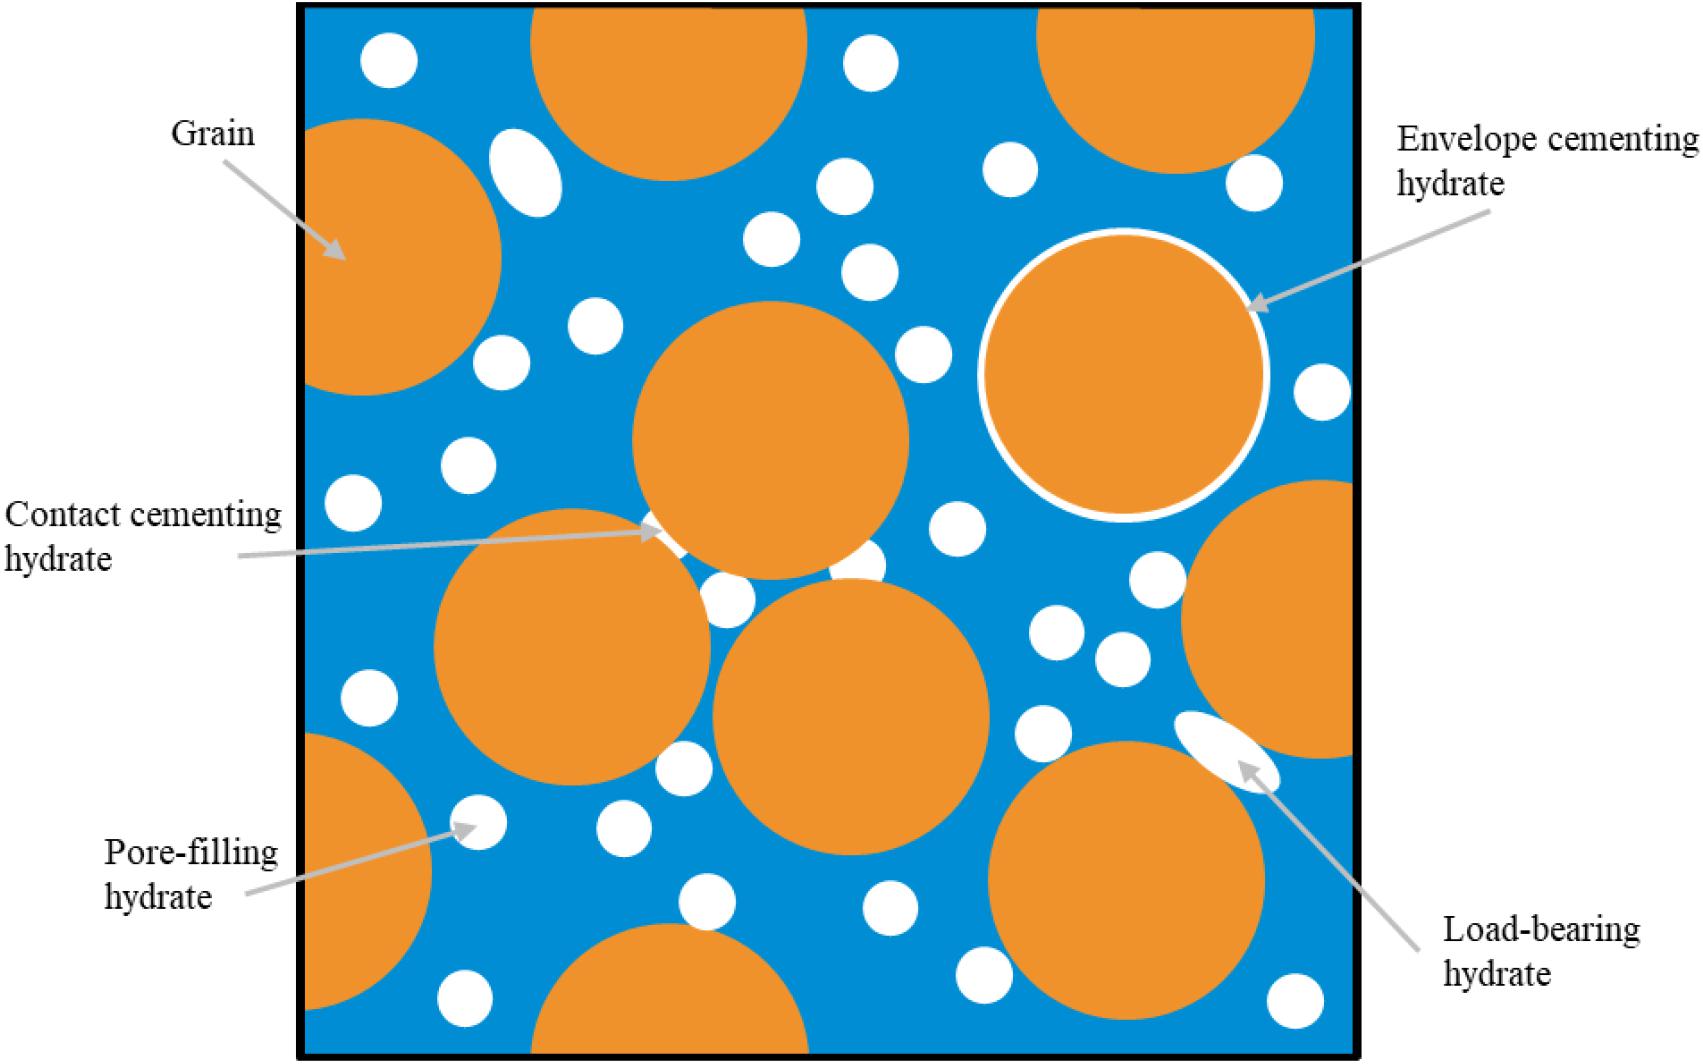
Figure 1. Microstructure in gas hydrate-bearing sediments. The white, orange, and blue colors indicate the hydrate, grain, and pore fluid.
Based on the effective-grain model (Leurer, 1997), Best et al. (2013) apply the squirt-flow mechanism to explain the observed attenuation, and Marín-Moreno et al. (2017) consider squirt-flow mechanisms and gas-bubble damping factors, showing that there are different behaviors of the attenuation as a function of frequency above and below a given hydrate saturation (6%) (Sahoo et al., 2019).
In this work, the Biot-Rayleigh theory of wave propagation in double-porosity media is used here to describe the gas-hydrate distribution in the sediment and study wave dispersion and attenuation (Ba et al., 2011). The model predictions are then compared with laboratory data (Priest et al., 2005, 2009) and sonic-logging data (Zhan and Matsushima, 2018).
Rock-Physics Models
As shown in Figure 2, solid hydrate can be part of the pore infill (Model 1, Figure 2A) or constitute a skeleton and cement the grains (Model 2, Figures 2B,C). The skeleton or frame properties are obtained with the effective-medium theory according to Ecker et al. (2000), and the wet-rock P-wave properties with the Biot-Rayleigh theory. Figures 3, 4 show the modeling workflow and the description of the two models, respectively. Hydrate is abundant in the seafloor and permafrost (e.g., Marín-Moreno et al., 2017), for instance, in Qilian region (China) (Qu et al., 2016), the Mount Elbert in Alaska (Pan et al., 2019), and in the Eastern Nankai Trough offshore Japan (Konno et al., 2015). These cases showed the characteristics of Model 1. Lei et al. (2018) and Chen et al. (2020) observed the distribution characteristics of Model 2 by CT imaging.
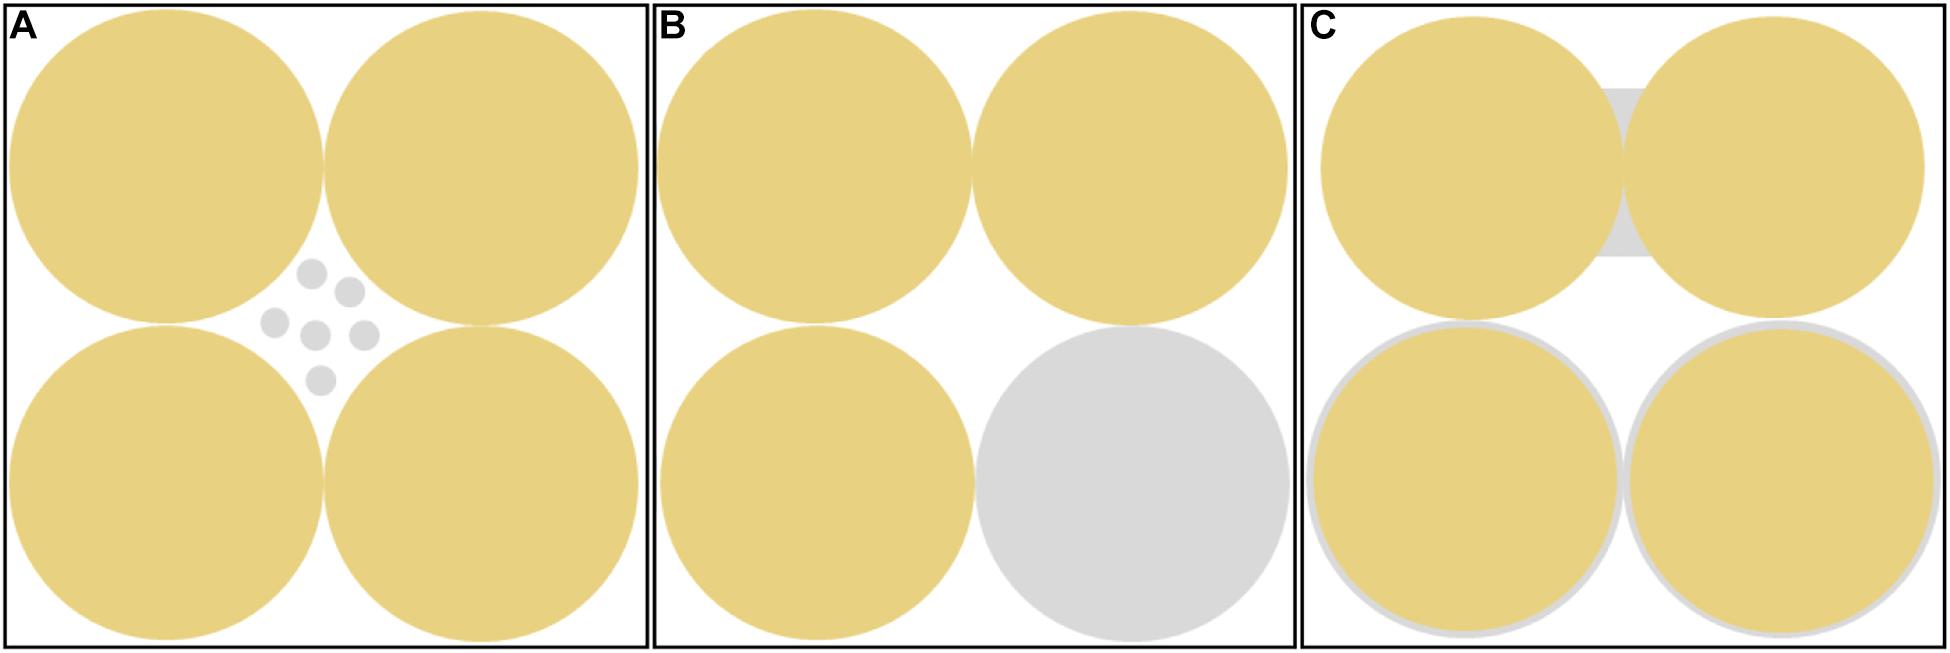
Figure 2. Different distributions of hydrate in the sediment. (A) Pore-filling hydrate; (B) load-bearing hydrate; (C) contact-cementing and envelope-cementing hydrate.
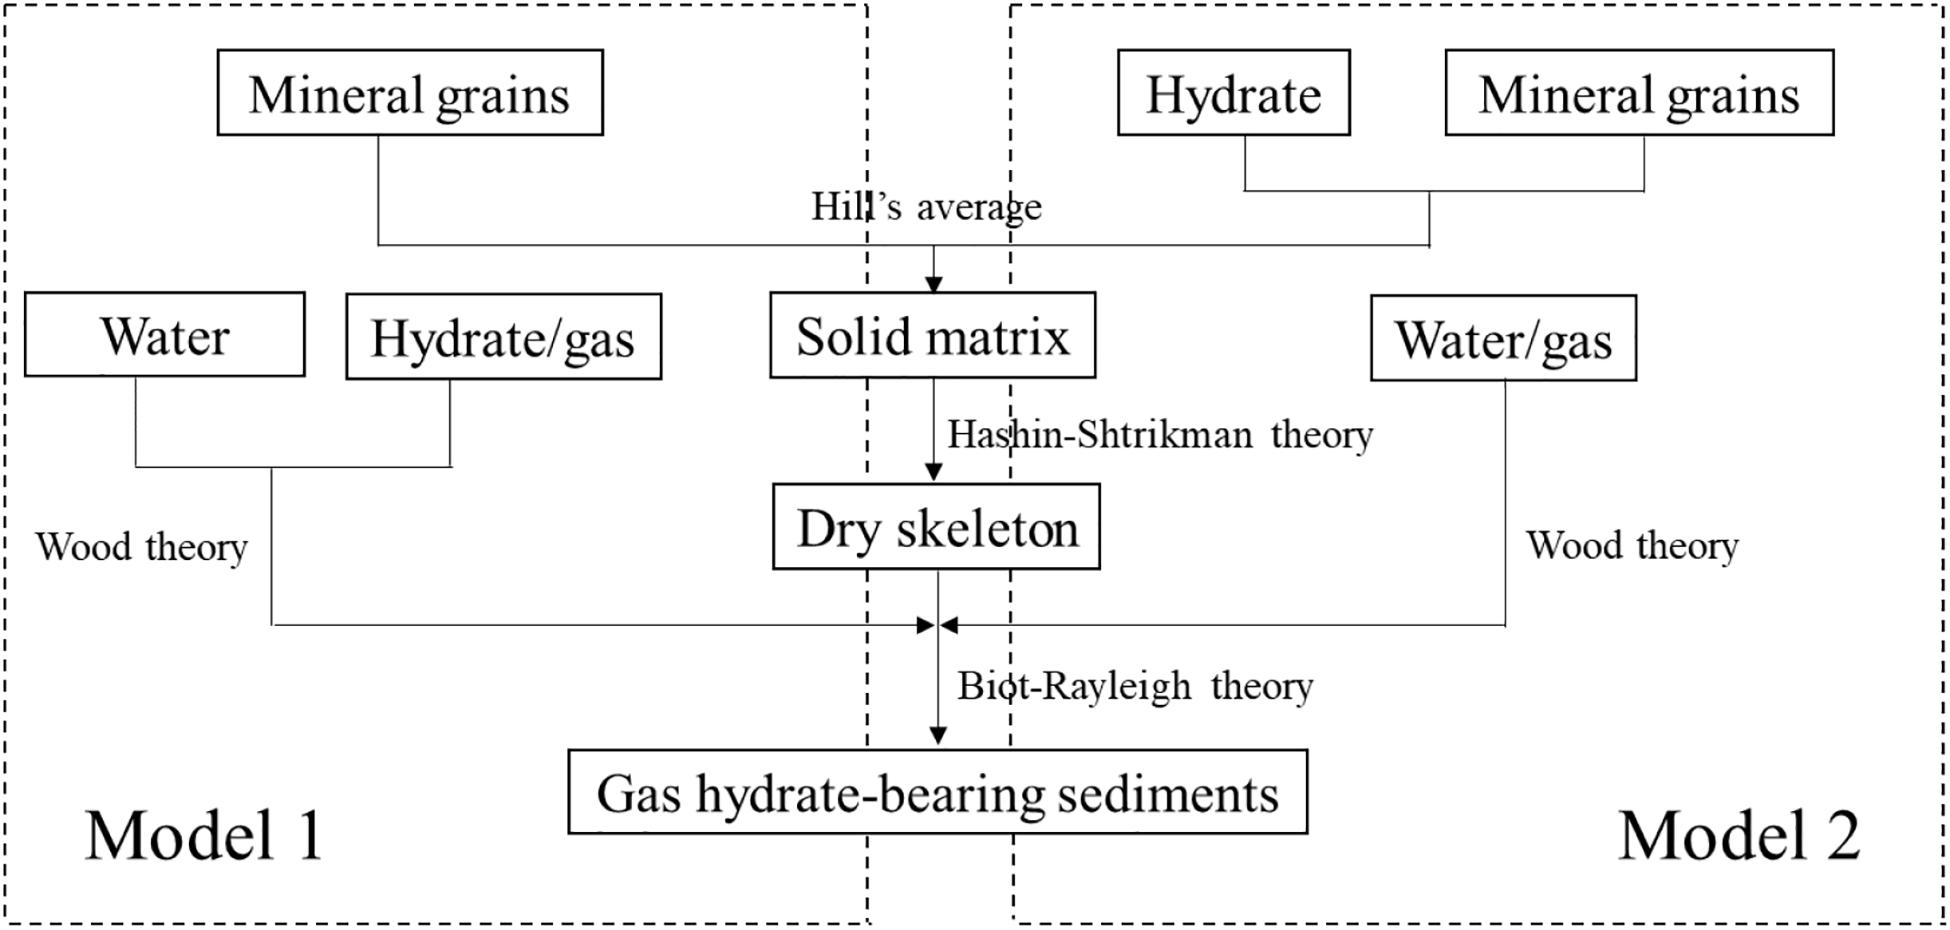
Figure 3. Modeling workflow methods for the two models.
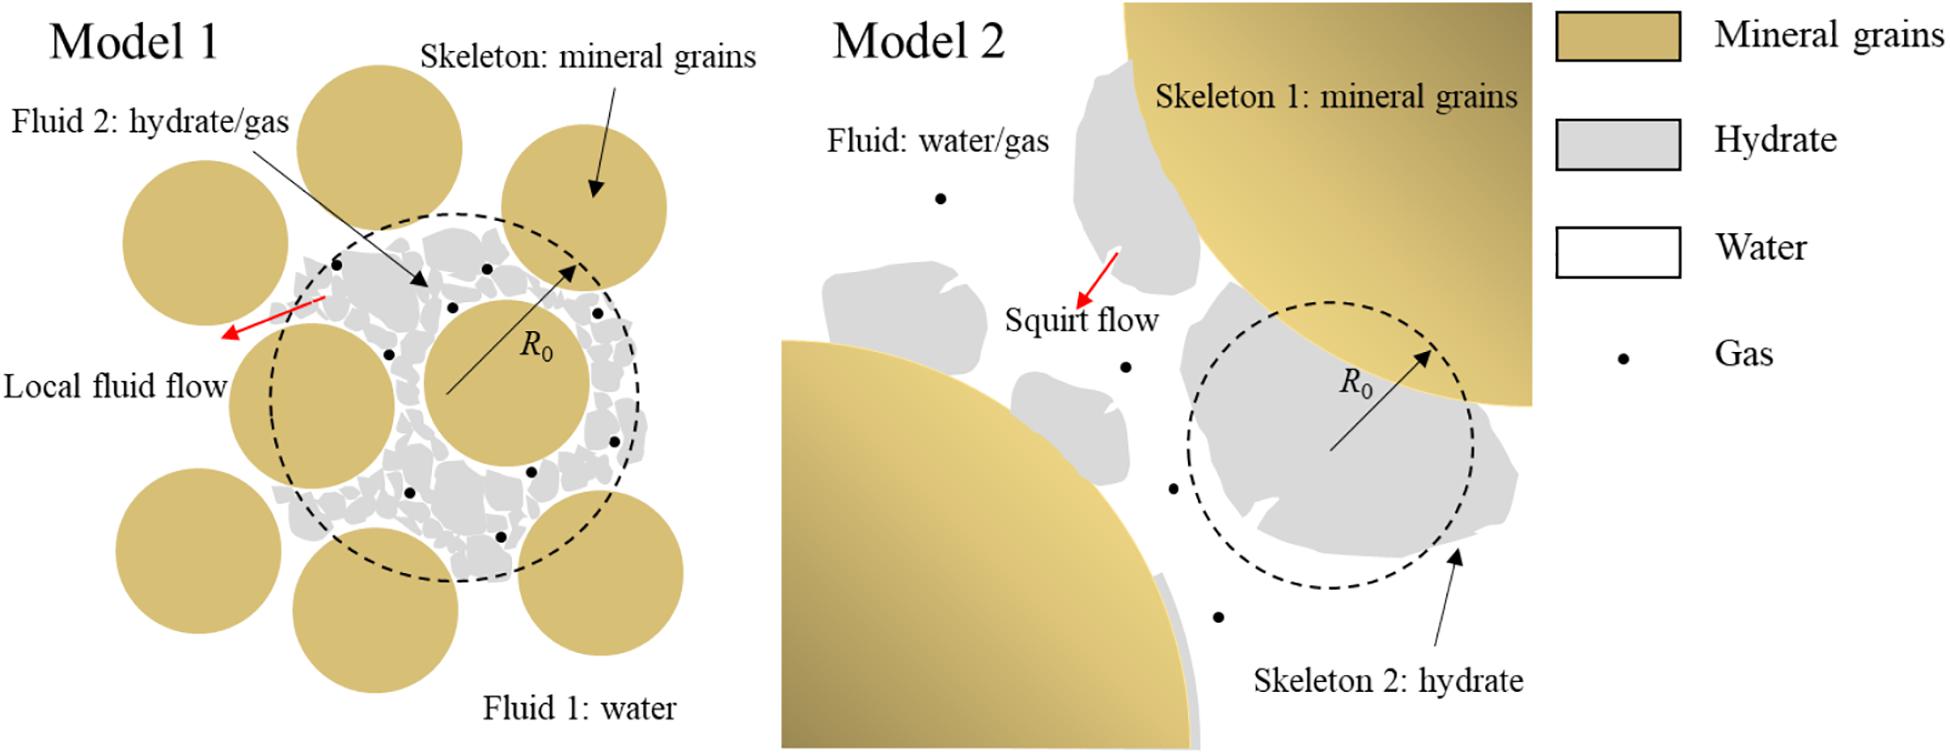
Figure 4. The two models used in the workflow with the definition of the inclusion radius.
Model 1: Hydrate as Pore Infill
At low concentrations, hydrate can be assumed as pore infill (Lee et al., 2010), such that a fluid is formation water and the other is a mixture of solid hydrate and free gas (hydrate/gas shortly), with
where Kw and ρw are the water bulk modulus and density, respectively, and
where Kh and Kg are the bulk moduli of gas hydrate and free gas, respectively, and ch and cg are the respective volume ratios (ch + cg = 1). ρh and ρg are the densities of gas hydrate and free gas, respectively. The saturation of free gas is
with Sh + Sg + Sw = 1.
The bulk and shear moduli of the m-phase mineral mixture without hydrate (moduli of the mineral mixture, referred to as mineral moduli) are obtained with Hill’s average:
Where fi is the volumetric fraction of the i-th component and Ki and Gi are the respective bulk and shear moduli.
The dry-rock moduli can be obtained by combining Eqs 1–6 and the modified Hashin–Shtrikman theory given in Supplementary Appendix A. By substituting a plane-wave solution into the Biot-Rayleigh equations (see Supplementary Appendix B) of Ba et al. (2011, 2012), we obtain
where ω is the angular frequency, k is the complex P-wave wave number,
where x1 = i(ϕ2Q1 − ϕ1Q2)/Z, x2 = iϕ2R1/Z, x3 = −iϕ1R2/Z,
where ϕ1 and ϕ2 are the porosities of the water- and hydrate-saturated pores, respectively, ϕ10 and ϕ20 are the local porosities in the two regions, ρf, η1 and κ1 are the density, viscosity and permeability of the host phase fluid, respectively. b1 and b2 are Biot dissipation coefficients, ρ11, ρ12, ρ13, ρ22, and ρ33 are density coefficients, and A, Q1, Q2, R1, and R2 are stiffnesses (see Supplementary Appendix C).
The mixture of hydrate/gas forms a spherical inclusion of radius of R0. It is related to the scale of hydrate as a solid component or a hydrate (fluid type)-saturated porous solid, which are embedded in the host rock frame. The phase velocity and quality factor are (Carcione, 2014).
The volume ratios of formation water and hydrate/gas mixture are υ1 and υ2, respectively. According to the Biot-Rayleigh theory of patchy-saturated rocks with one solid phase and two fluid phases (Ba et al., 2012; Sun et al., 2015), ϕ1 = ϕ10υ1, ϕ2 = ϕ20υ2, and ϕ10 = ϕ20 = ϕ. The volume ratio of mixture of hydrate/gas mixture is
Examples
The properties of the components the of hydrate-bearing sediment are given in Table 1, and other properties are shown in Table 2 (Best et al., 2013). The free gas properties in Table 1 are given in Ecker et al. (2000), and the free gas ratio is set as cg = 0.02.
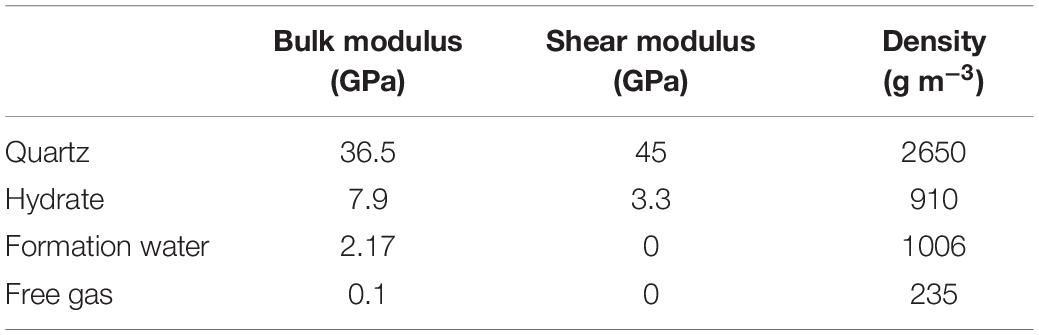
Table 1. Properties of the sediment constituents.
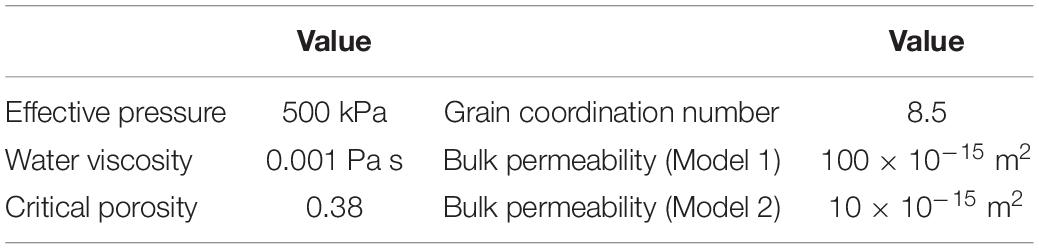
Table 2. Other input properties.
The energy losses caused by local fluid flow depends on the inclusion radius of the mixture of hydrate/gas in the pores. Four radii are selected to illustrate the physics. Figure 5 shows the P-wave phase velocity (Figure 5A) and dissipation factor (Figure 5B) as a function of frequency for different inclusion radii. Two peaks occur, corresponding to the local and global flow mechanisms. The first moves towards the low frequencies with increasing radius. The radius mainly controls the location of the peak and has no significant effect on the global flow dispersion/attenuation, which occurs at high frequencies.
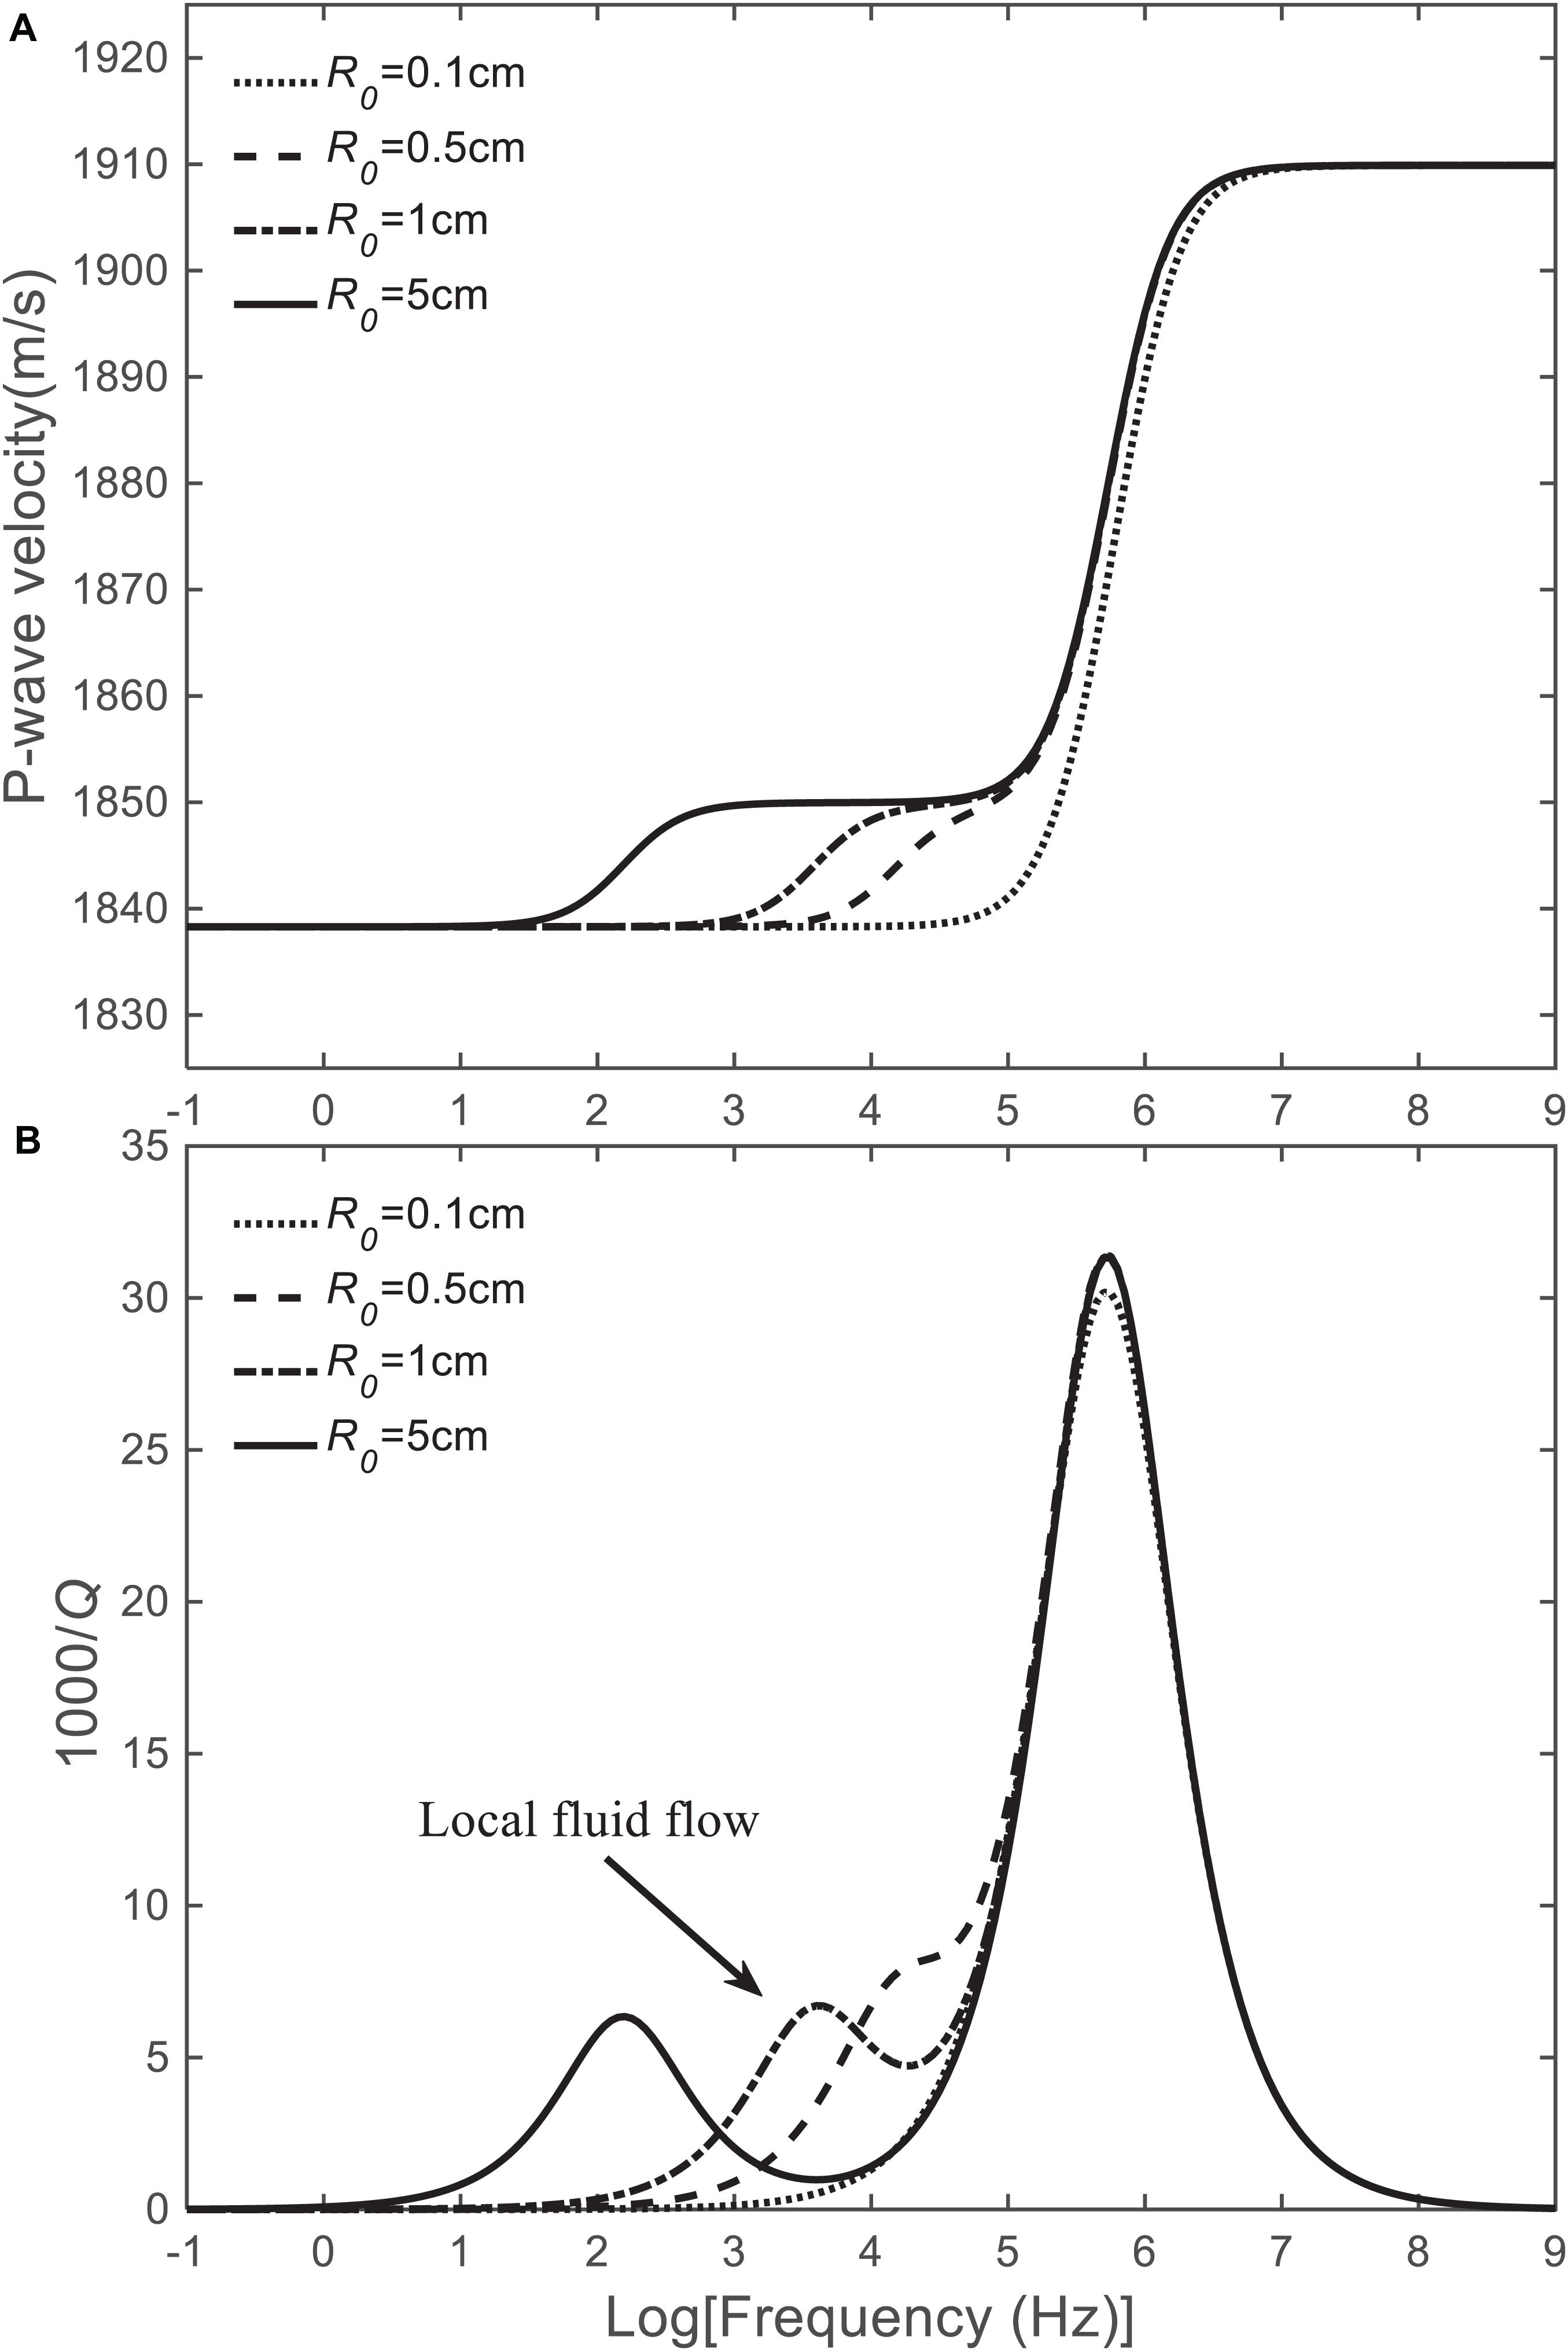
Figure 5. Model 1. P-wave velocity (A) and dissipation factor (B) as a function of frequency for different inclusion radii of hydrate/gas. The hydrate concentration is 20%, and the porosity is 40%.
Porosity is an important reservoir property that affects the dry-rock moduli. The porosity of core samples in gas hydrate-bearing sediments of the Nankai Trough ranges between 35 and 43% (Zhan and Matsushima, 2018), while the porosity in Qilian Mountain permafrost is much smaller, with values between 1 and 5% (Lin et al., 2019). Figure 6 shows the P-wave phase velocity (Figure 6A) and dissipation factor (Figure 6B) as a function of frequency for different porosities. Velocity decreases and the local and global-flow attenuations increase with increasing porosity. At 10% porosity, these loss mechanisms start to be evident and at higher porosities the two peaks split, with the global-flow one more affected.
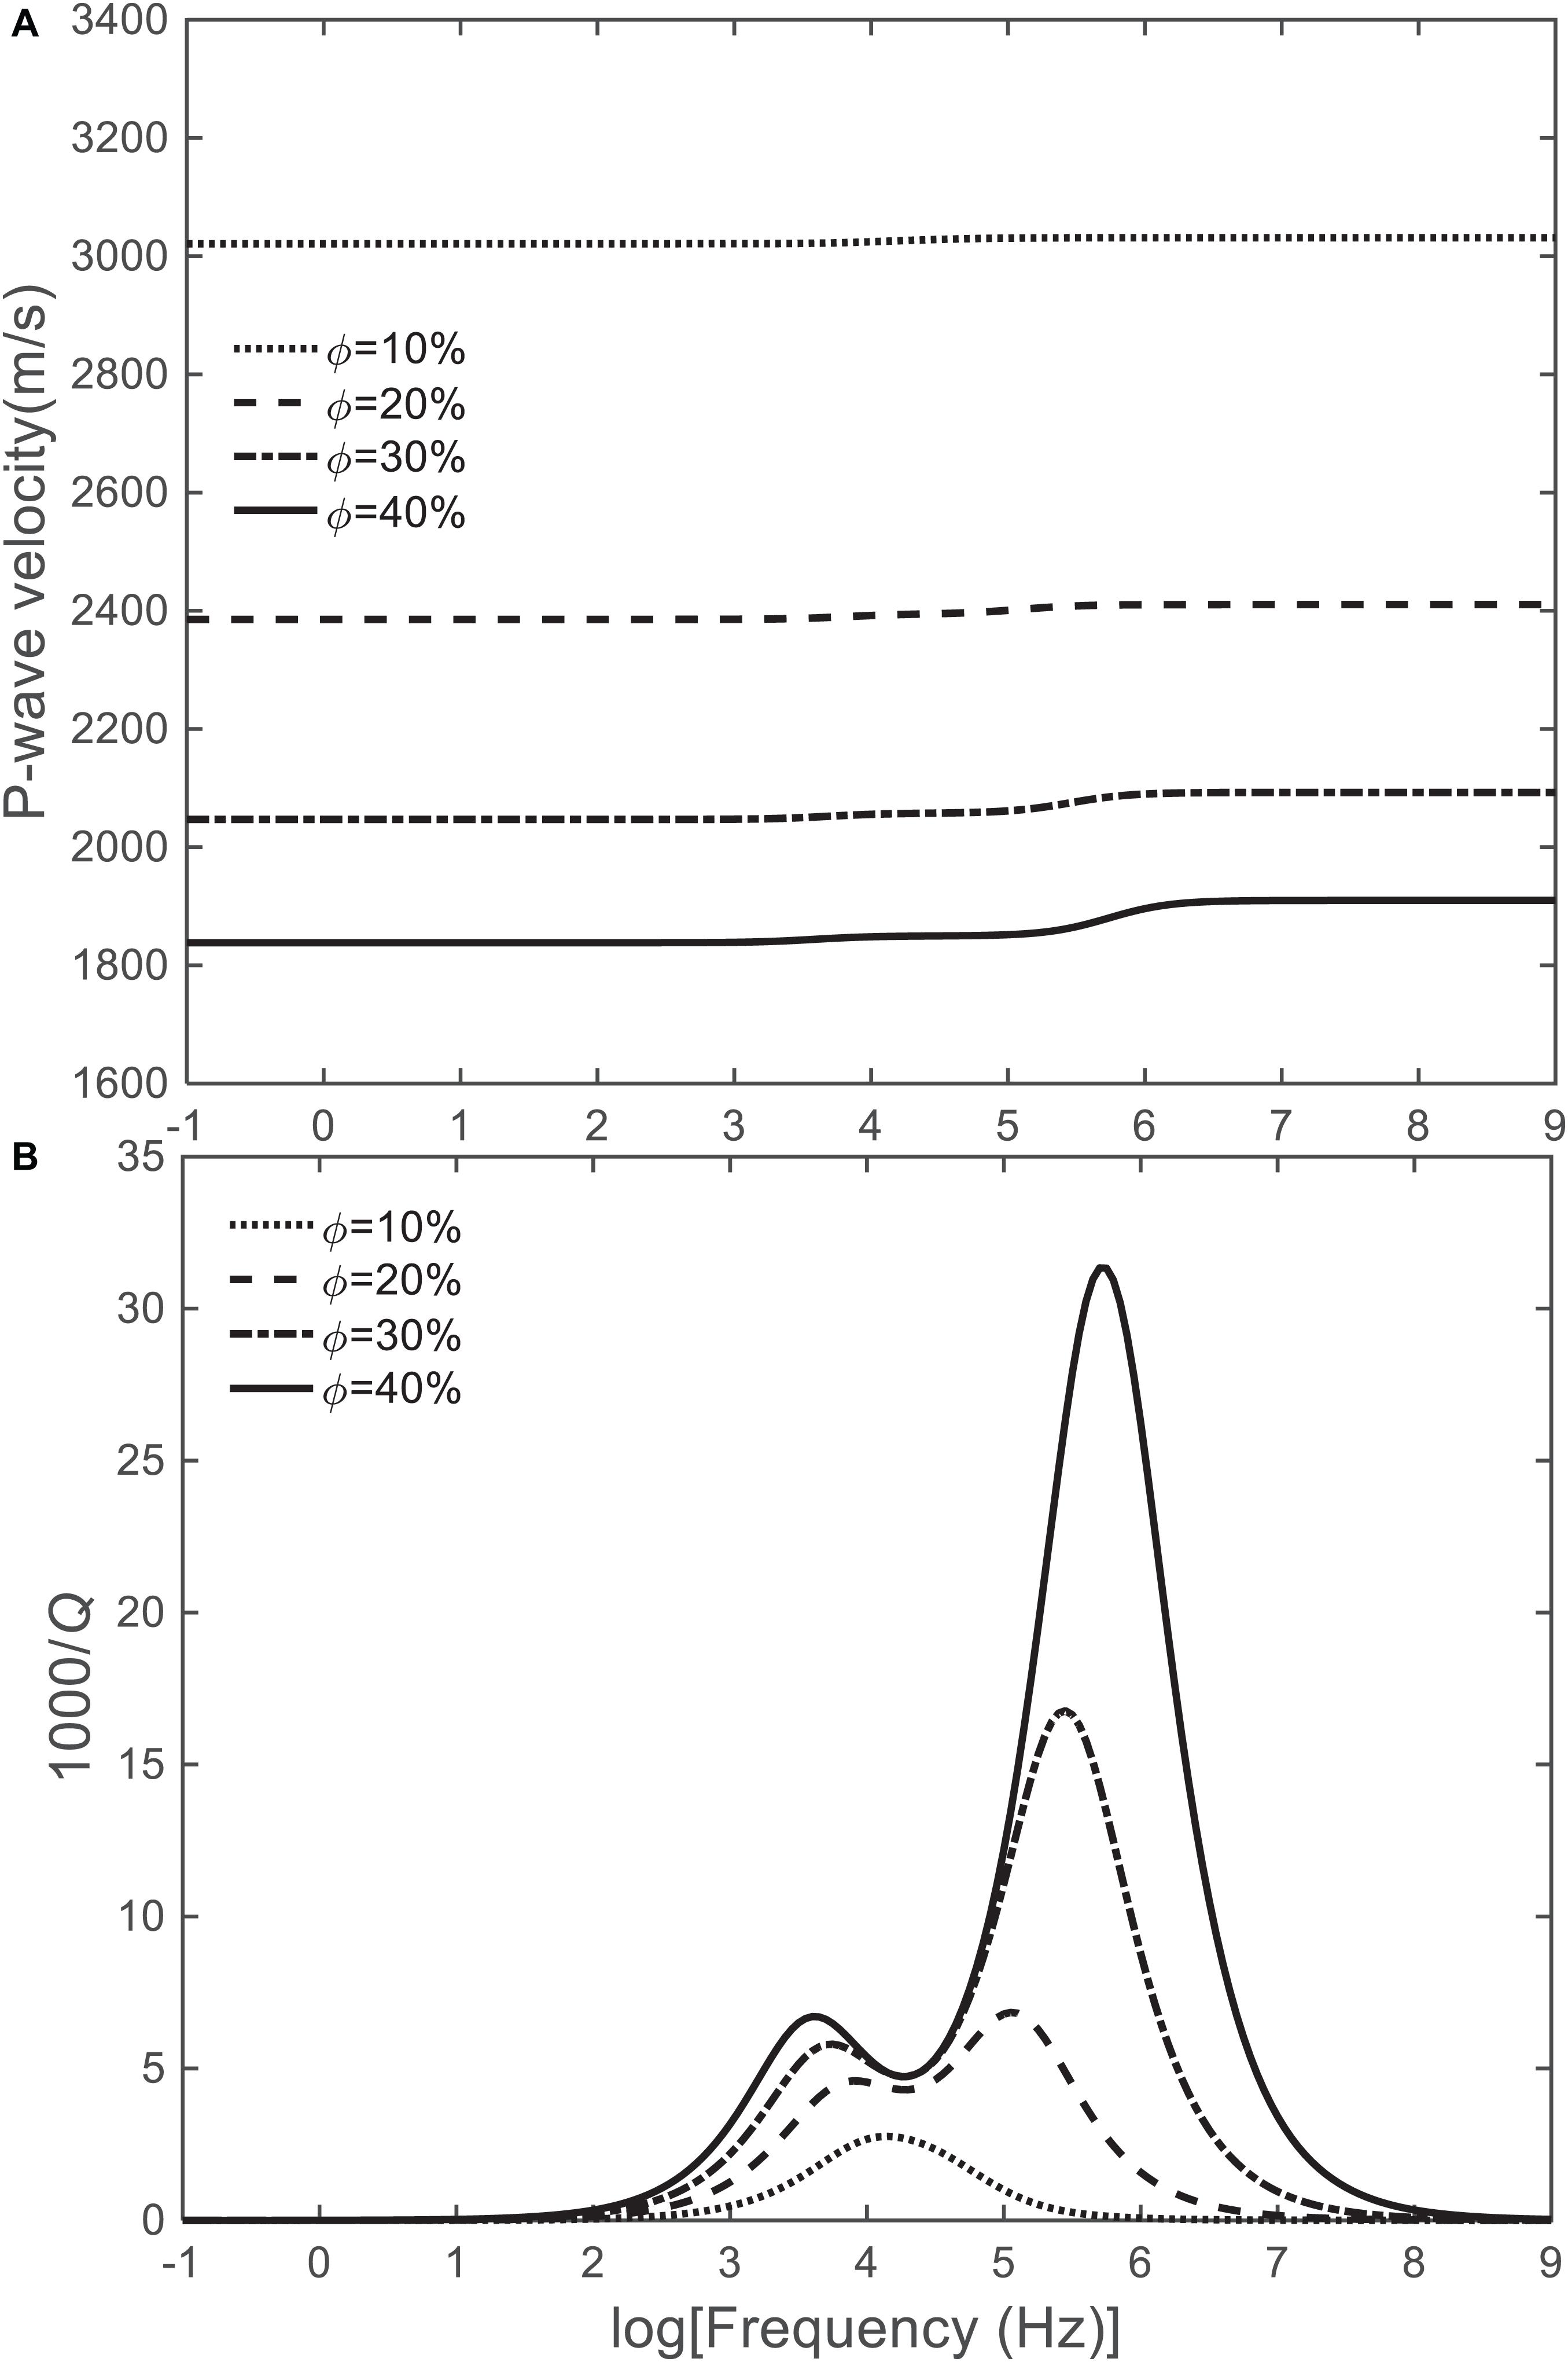
Figure 6. Model 1. P-wave velocity (A) and dissipation factor (B) as a function of frequency for different rock porosities. The inclusion radius is 1 cm, and hydrate concentration is 20%.
Figure 7 shows the P-wave phase velocity (Figure 7A) and dissipation factor (Figure 7B) as a function of frequency for different hydrate concentrations. Model 1 is assumed for hydrate content less than 40%. Velocity increases with hydrate concentration. The local- and global flow peak amplitude increase with concentration. The locations of peaks are hardly affected. Basically, Figure 7B shows that attenuation depends on hydrate content and frequency.
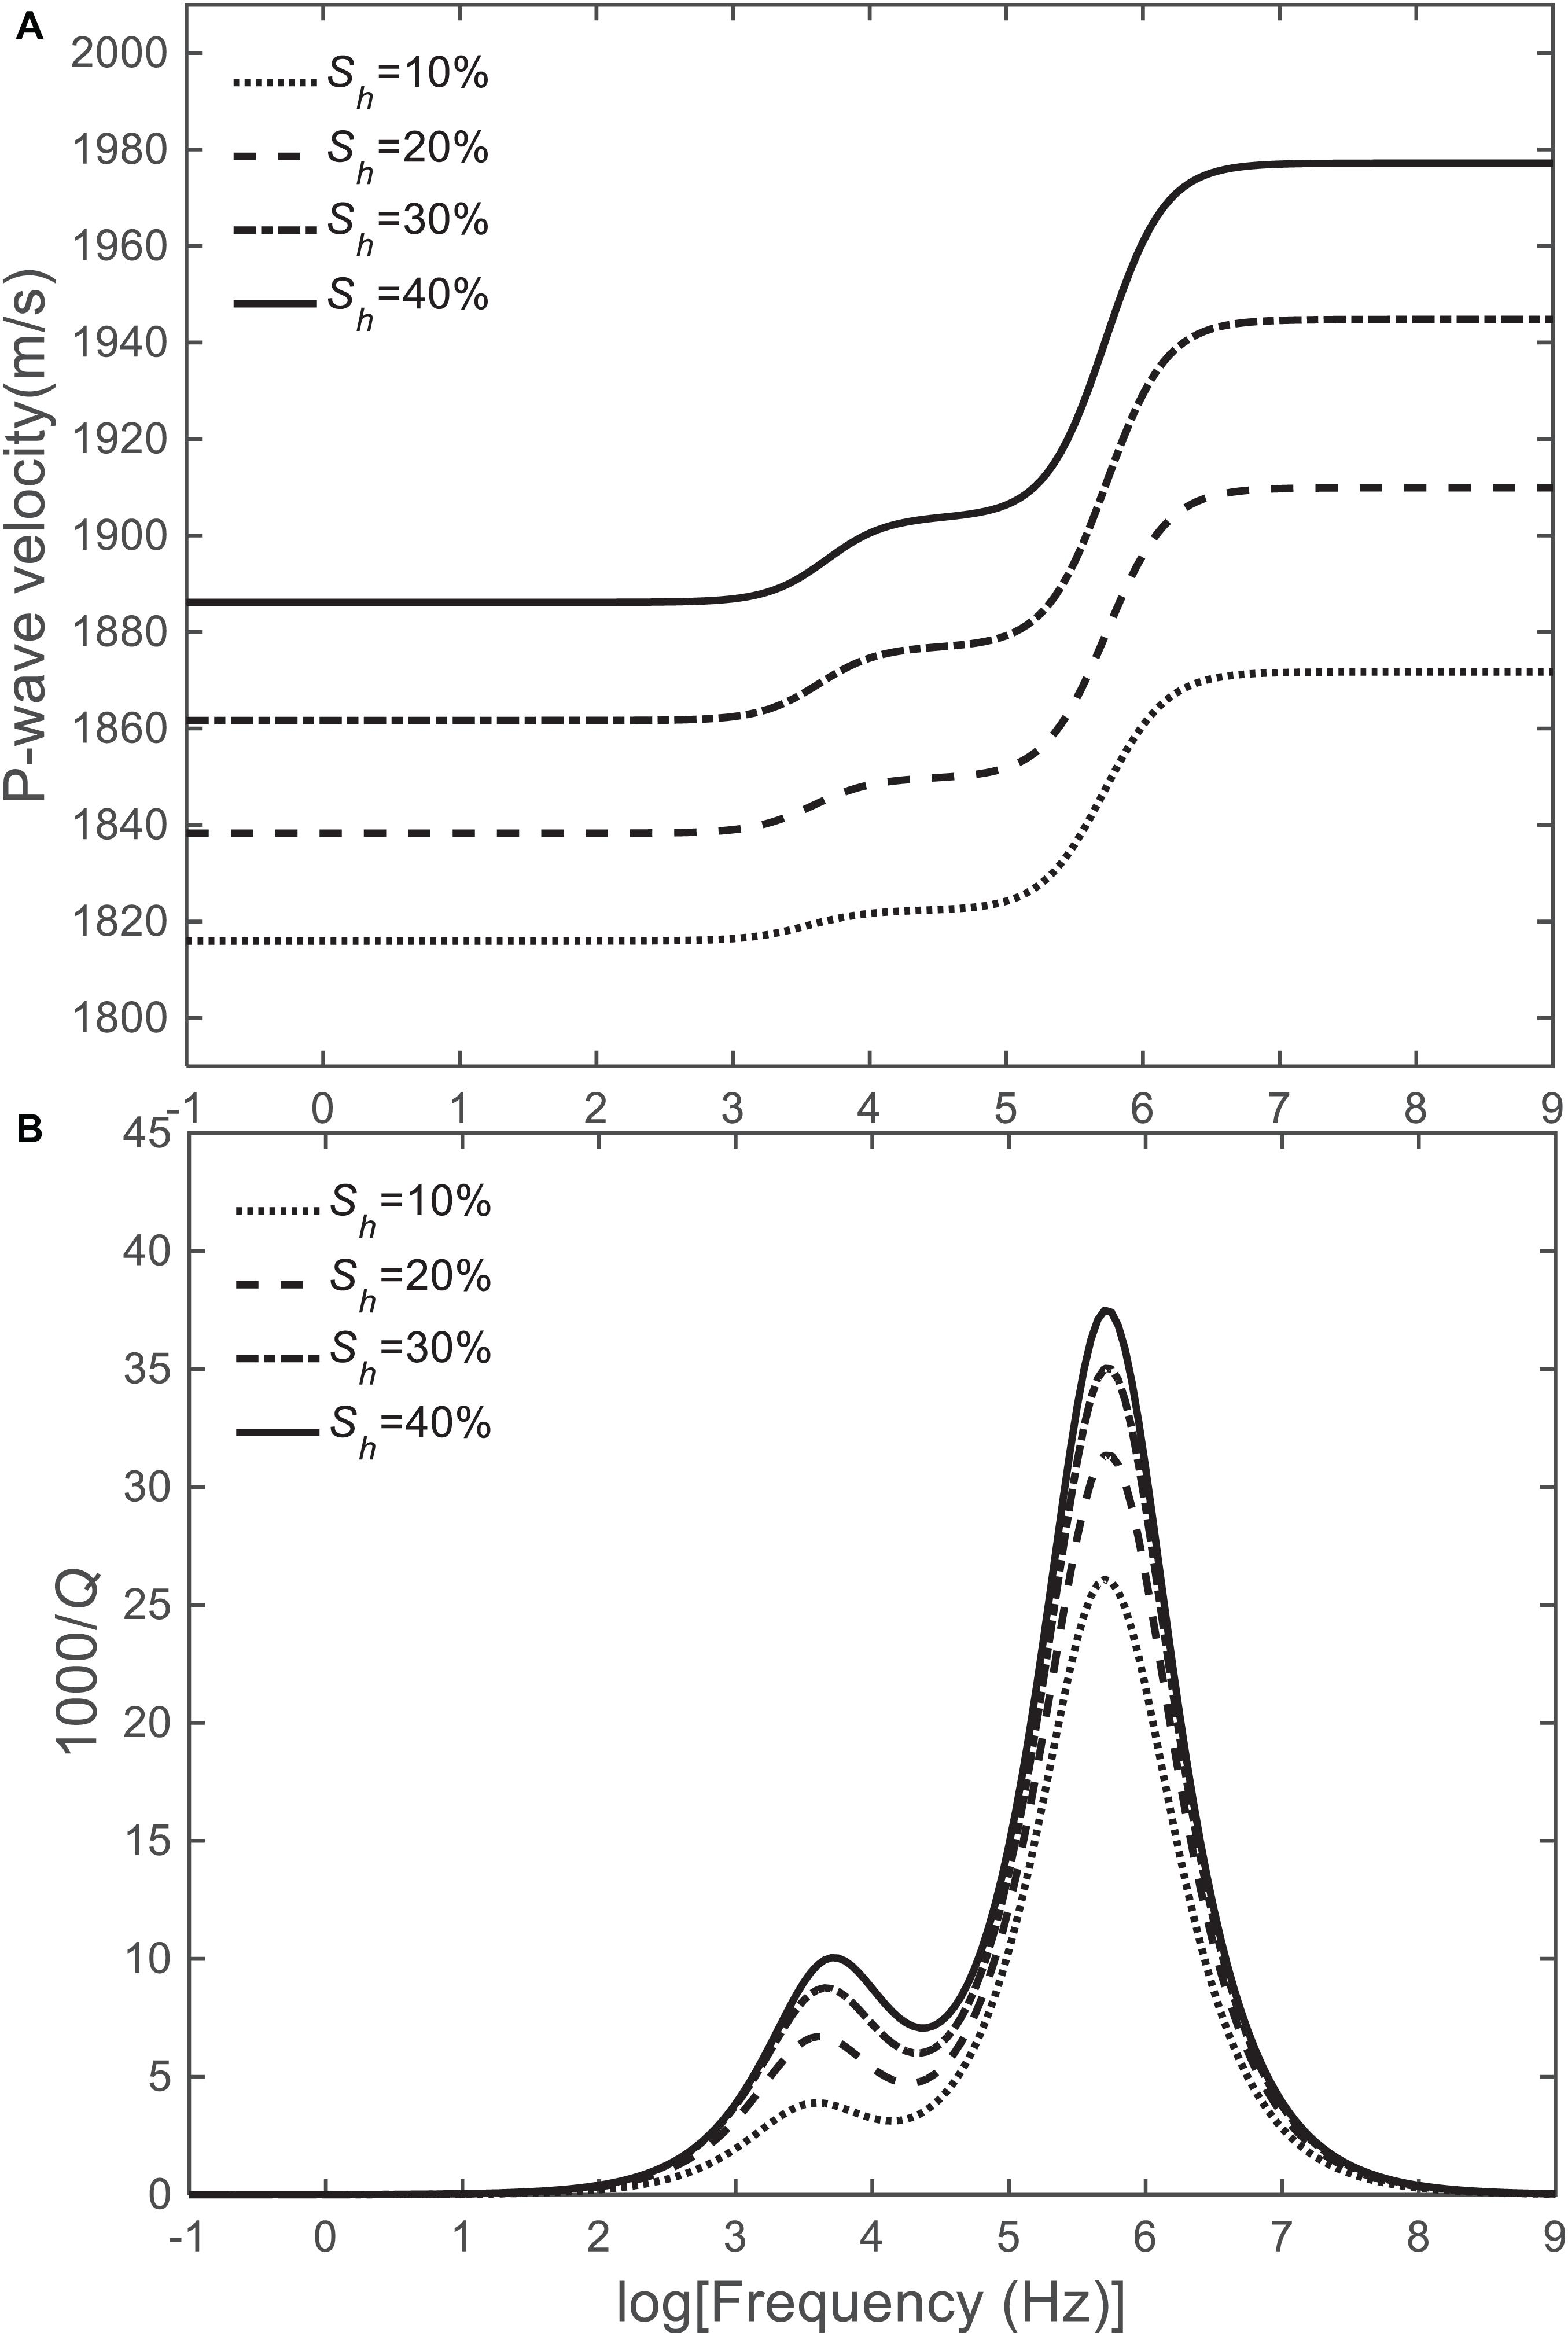
Figure 7. Model 1. P-wave velocity (A) and dissipation factor (B) as a function of frequency for different hydrate contents. The inclusion radius is 1 cm and the porosity is 40%.
Model 2: Hydrate as an Additional Skeleton
In this case, the pore fluid is a mixture of water and free gas, such that the effective bulk modulus is
where Sg + Sw = 1.
The density of the pore fluid is
The porosity, after the gas-hydrate deposition can be obtained as (Helgerud et al., 1999; Ecker et al., 2000)
and the volume percentage of hydrate in the solid matrix is
According to Eq. 6, the mineral moduli considering the presence of hydrate are
where Kn and Gn are the bulk modulus and shear modulus of the mineral mixtures without hydrate, respectively.
Clay is a solid component in the theory of Ba et al. (2016), i.e., and the host skeleton is composed of grains and intergranular pores, forming two solids and one fluid (water/gas). The clay squirt-flow mechanism induced by acoustic waves is discussed in that paper. Compared with hydrate as a pure solid, the hydrate micropores and intergranular pores are connected to favor squirt flow. Here, gas hydrate is modeled as clay, and it is considered to also cause wave-induced fluid flow and dissipation (Best et al., 2013; Marín-Moreno et al., 2017; Sahoo et al., 2019). X-ray CT analysis has observed the contact and cementation of gas hydrate and mineral grains in the core samples, supporting the setup of skeleton type model (Lei et al., 2018).
The dry-rock moduli are also determined with the modified Hashin–Shtrikman theory given in Supplementary Appendix A and the wave propagation by Eq. 7, redefining the variables and properties as in Supplementary Appendix C (Ba et al., 2011; Sun et al., 2015). ϕ10 and ϕ20 are the local porosities of the main skeleton and inclusions, and ϕ1 and ϕ2 are the absolute porosities of the main skeleton and inclusions, respectively. The hydrate skeleton forms a spherical inclusion with a radius of R0.
The volume ratio of the inclusion phase is υ2, and that of main skeleton is υ1, with υ1 + υ2 = 1. The inclusion porosity is set ϕ20 = 0.05%. ϕ1 = ϕ10υ1 and ϕ2 = ϕ20υ2, with
The porosity of the main skeleton is
and the total porosity is .
Examples
The inclusion radius of hydrate, which contains micropores, also affects the squirt flow. We choose the same four inclusion radii for the comparison with Model 1. Figure 8 shows the P-wave phase velocity (Figure 8A) and dissipation factor (Figure 8b) as a function of frequency for different inclusion radii. If the radius increases, the local fluid-flow attenuation peak moves to the low frequencies. The global fluid-flow peak, occurring at high frequencies, is much weaker, almost negligible.
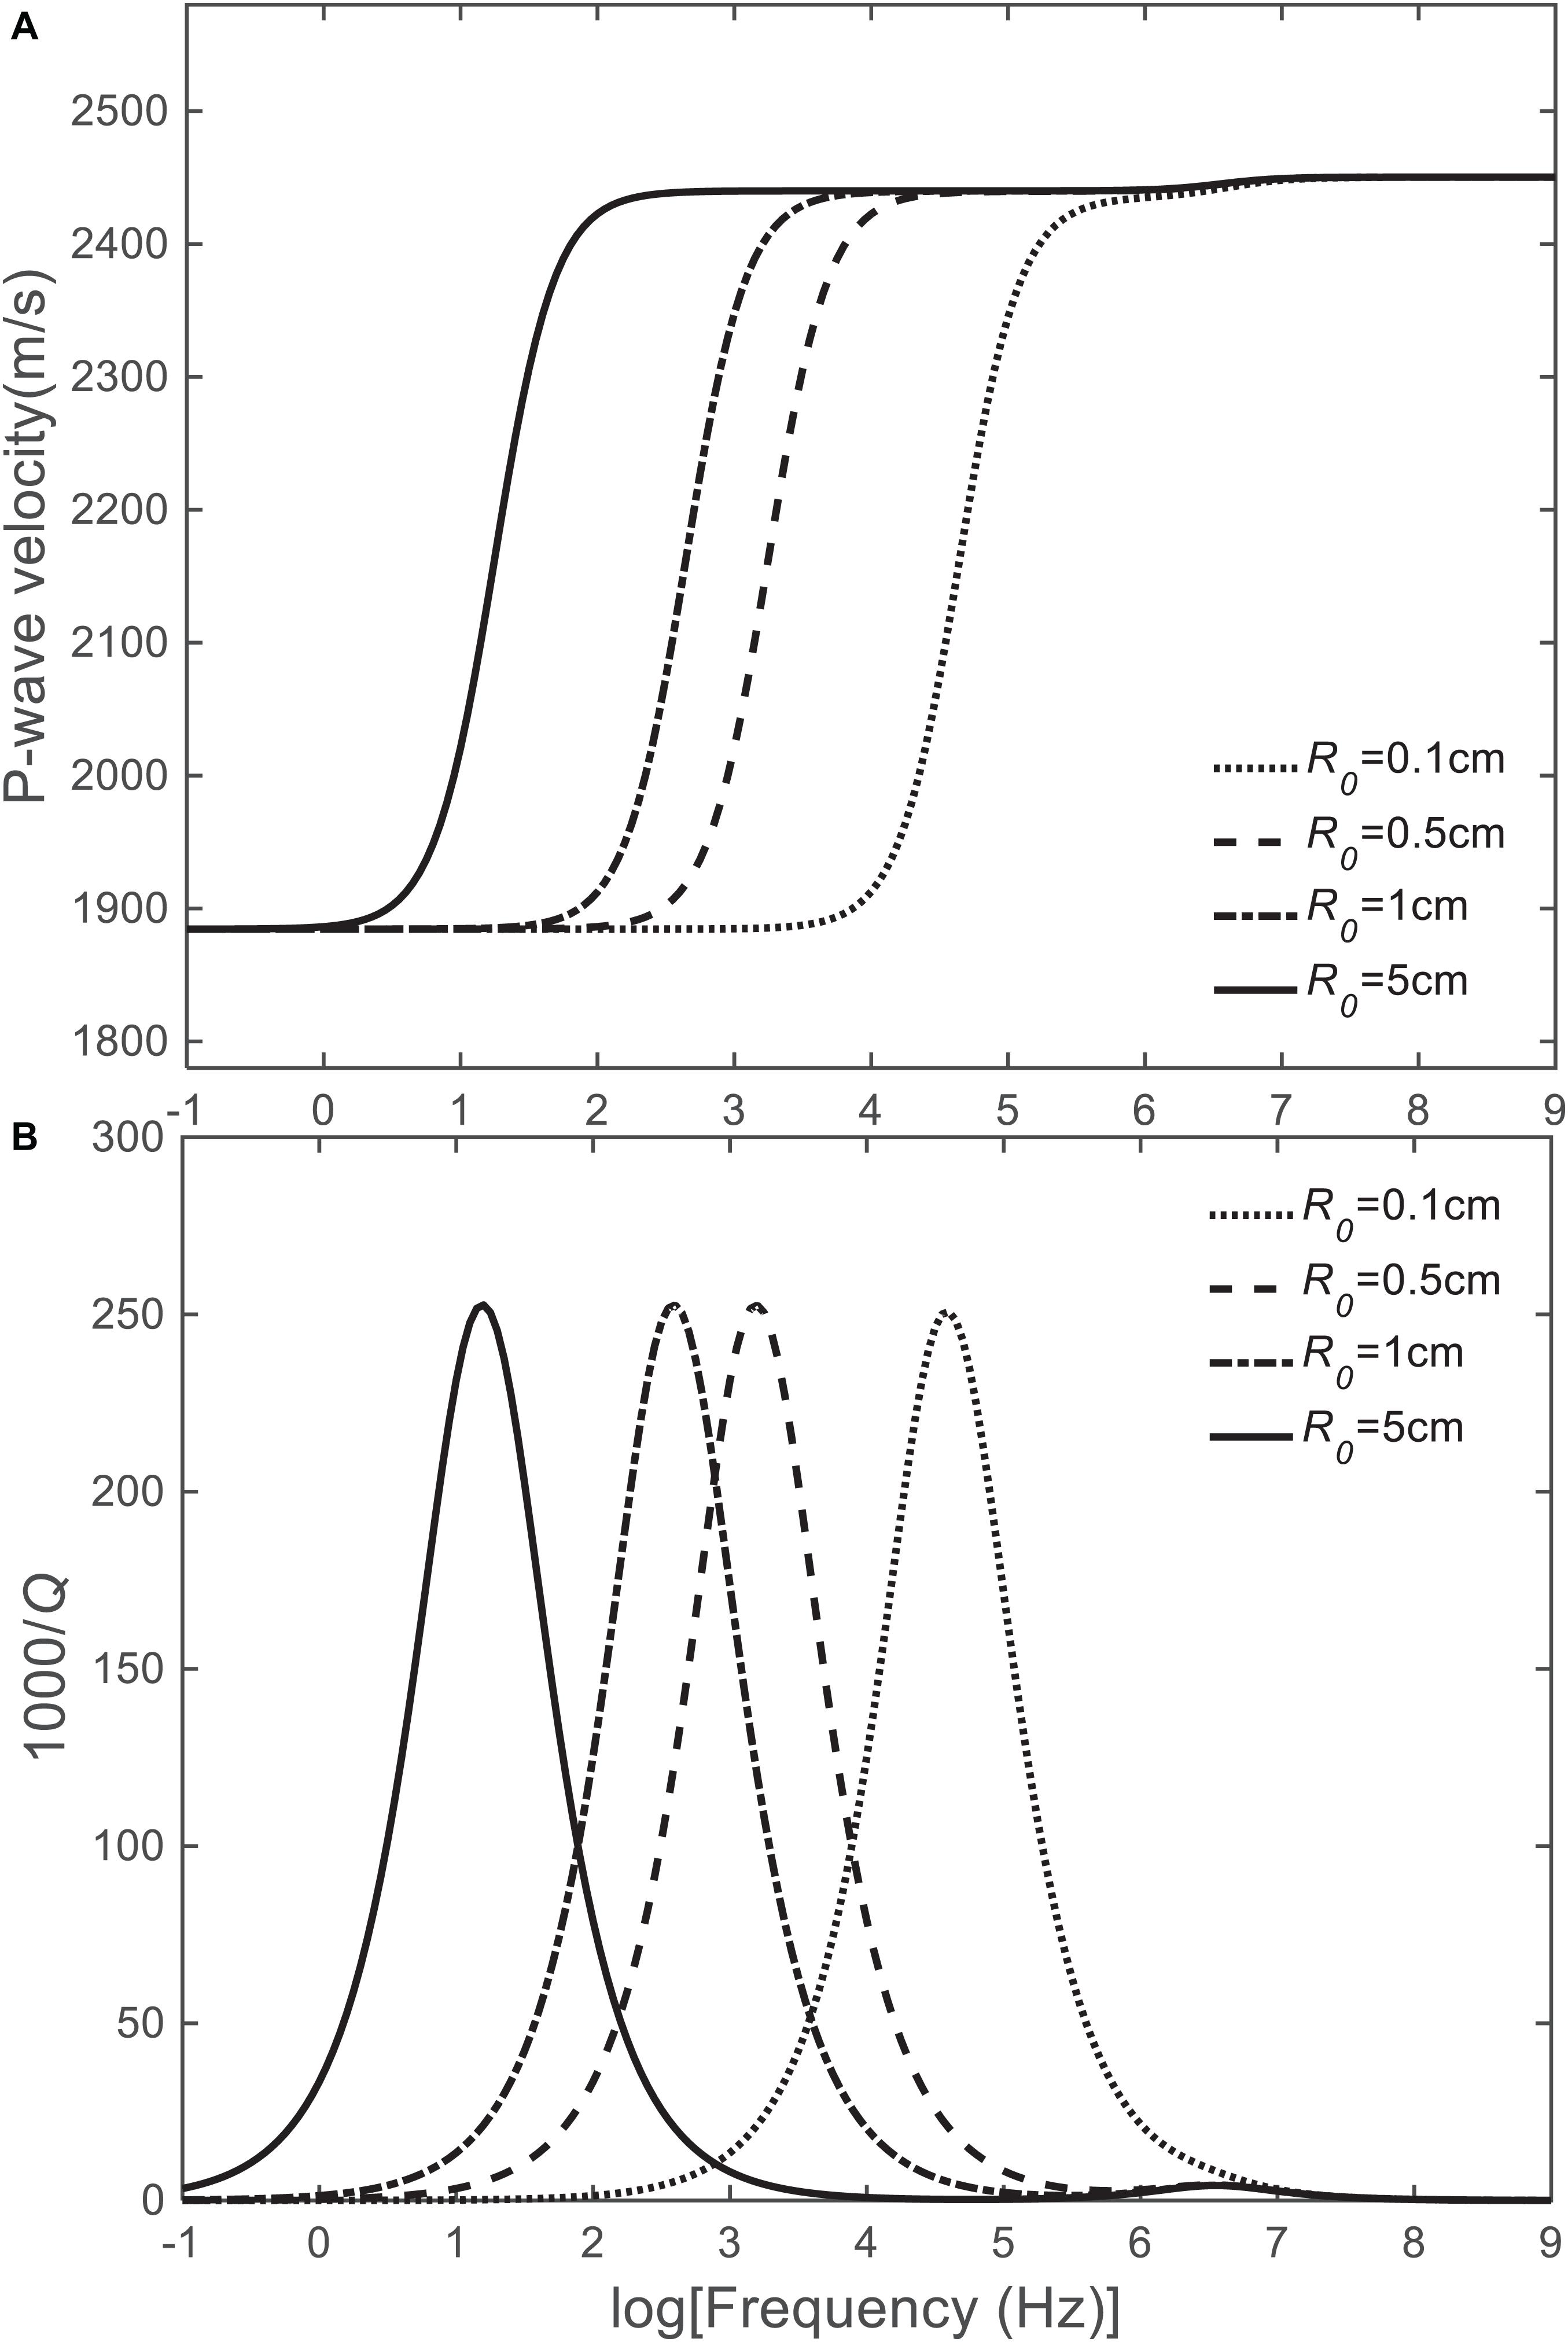
Figure 8. Model 2. P-wave velocity (A) and dissipation factor (B) as a function of frequency for different inclusion radii of hydrate/gas. The hydrate concentration is 20% and the porosity is 40%.
Figure 9 shows the P-wave phase velocity (Figure 9A) and dissipation factor (Figure 9B) as a function of frequency for different porosities. As in Model 1, increasing porosity implies decreasing P-wave velocity and increasing local-flow attenuation. Beyond 40%, two attenuation peaks can be observed, with the weaker one at high frequencies being the global-flow one.
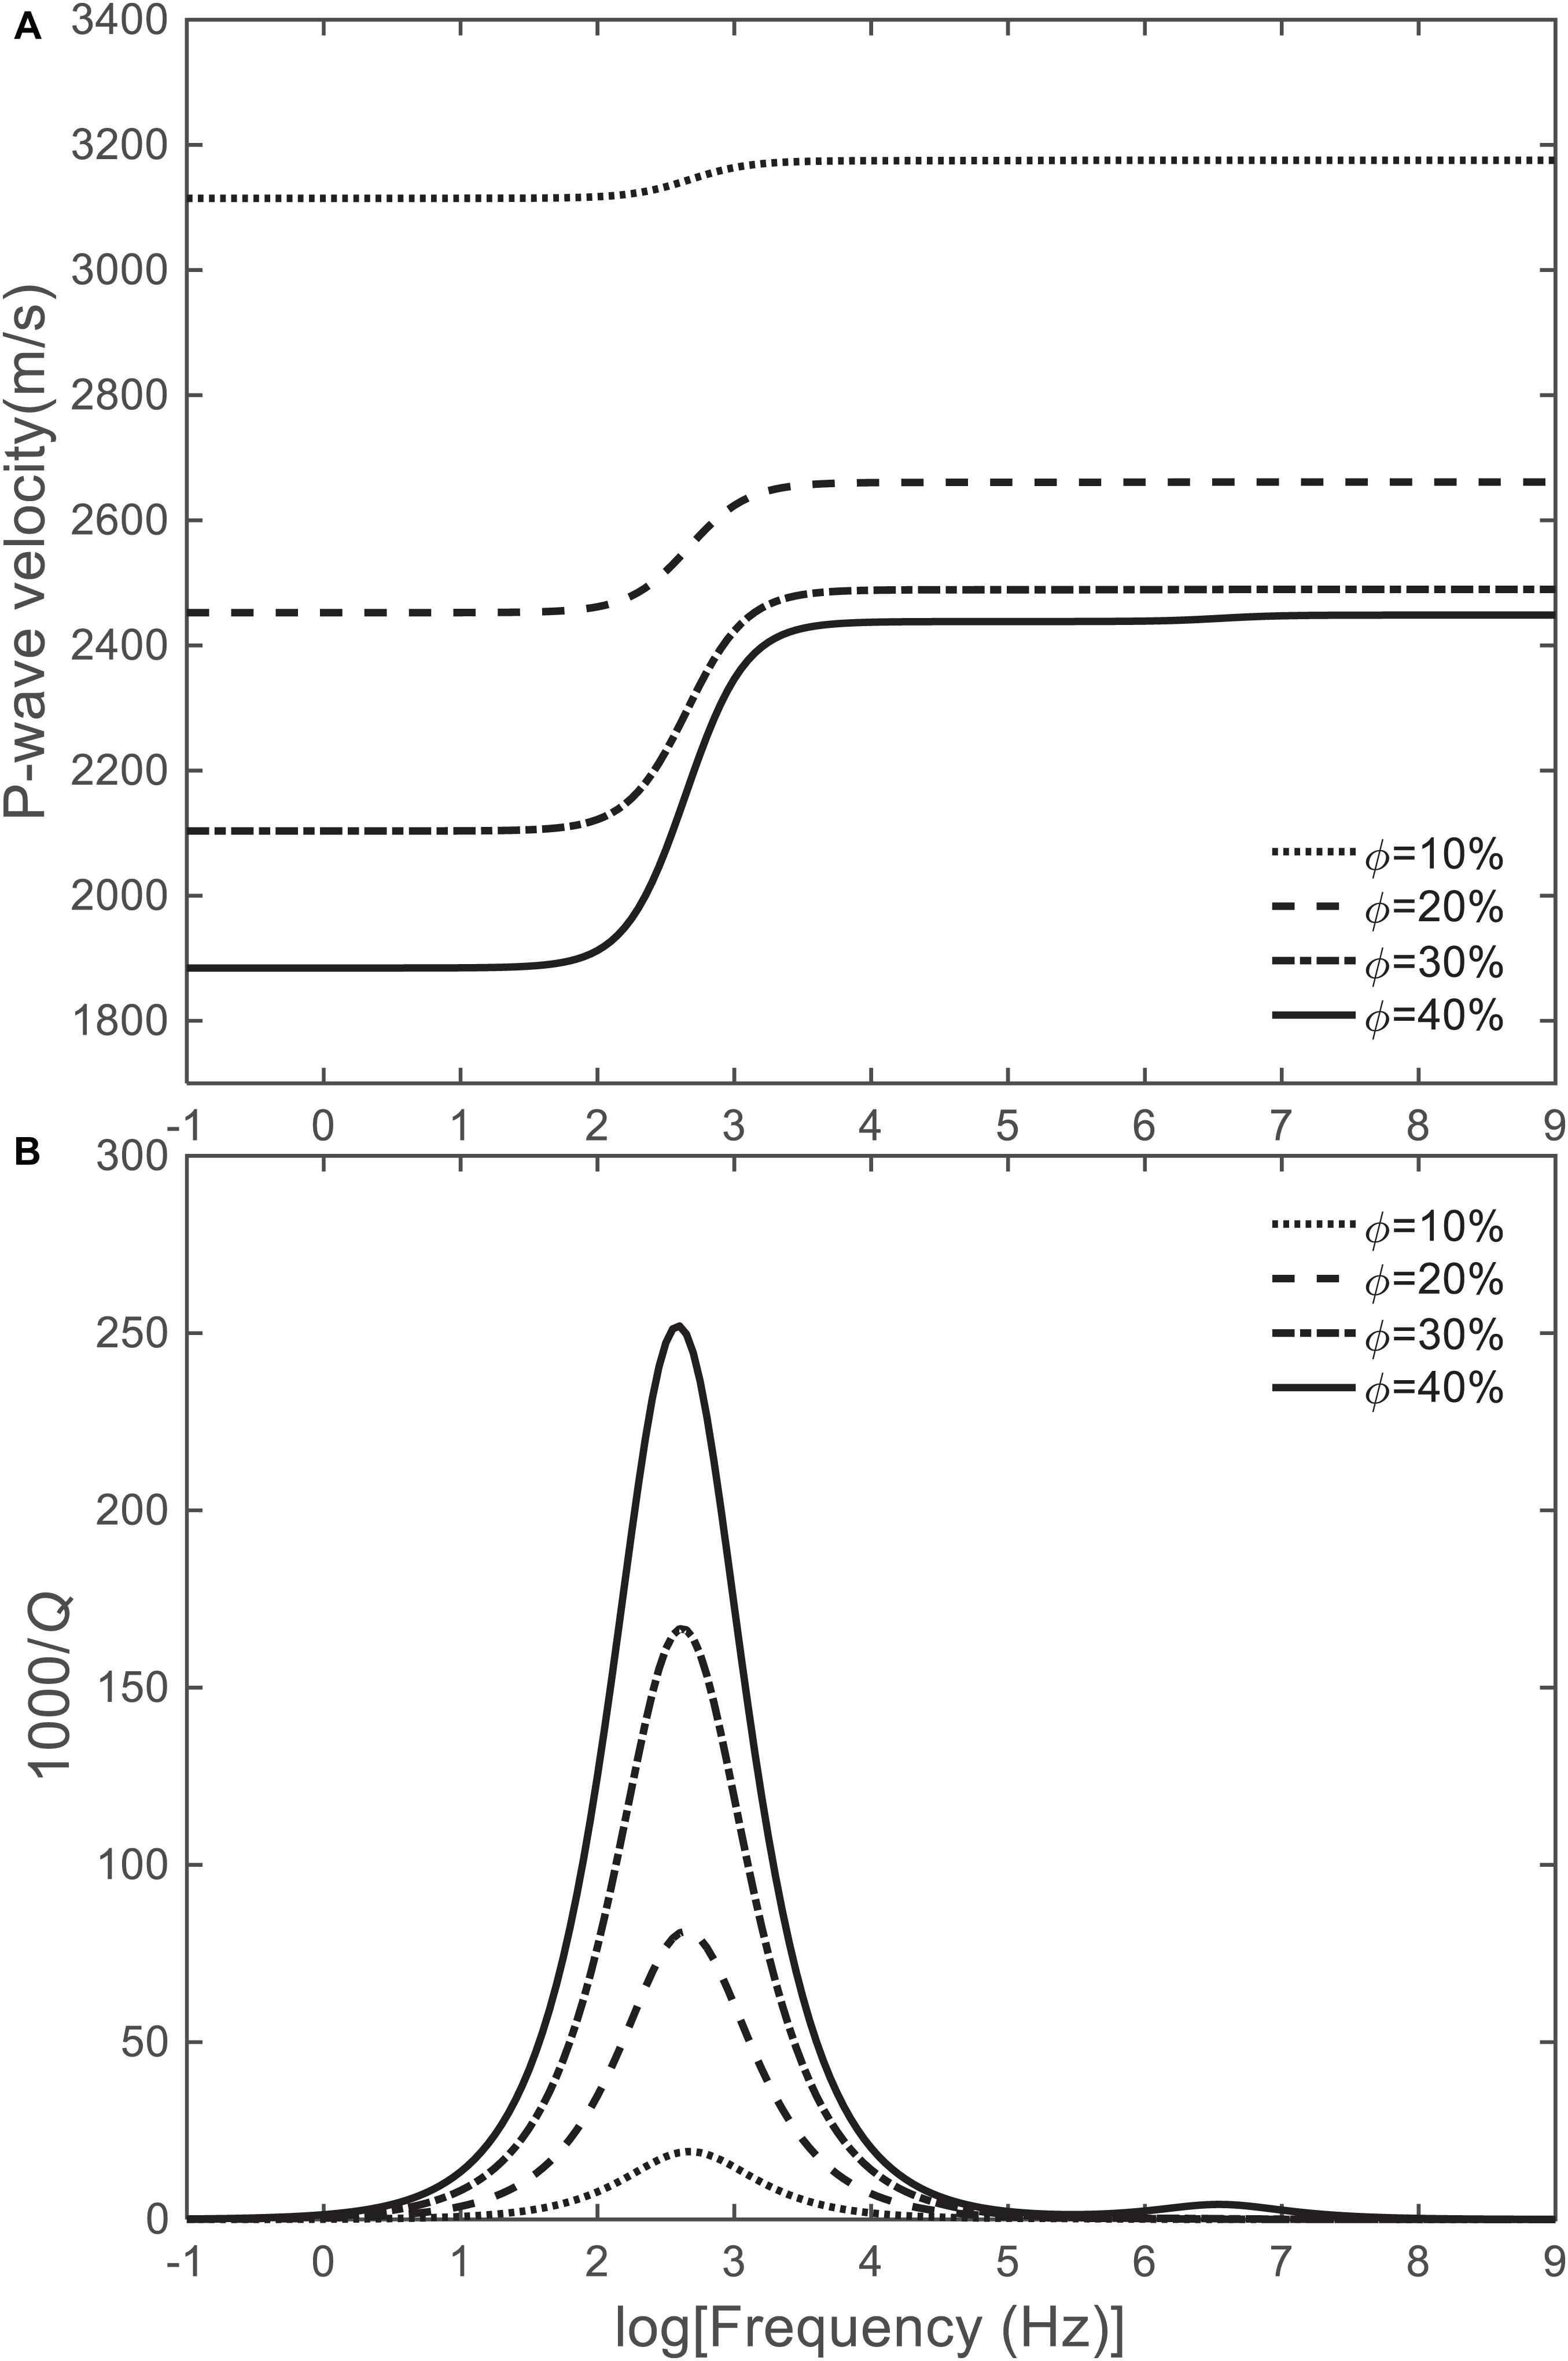
Figure 9. Model 2. P-wave velocity (A) and dissipation factor (B) as a function of frequency for different rock porosities. The inclusion radius is 1 cm, and hydrate concentration is 20%.
Figure 10 shows the P-wave phase velocity (Figure 9A) and dissipation factor (Figure 9B) as a function of frequency for different hydrate concentrations. The P-wave velocity increases with the concentration and the local-flow peak dissipation has a maximum value at 30% and then decreases, while the global-flow peak is weak. The first peak is mainly located at seismic frequencies.
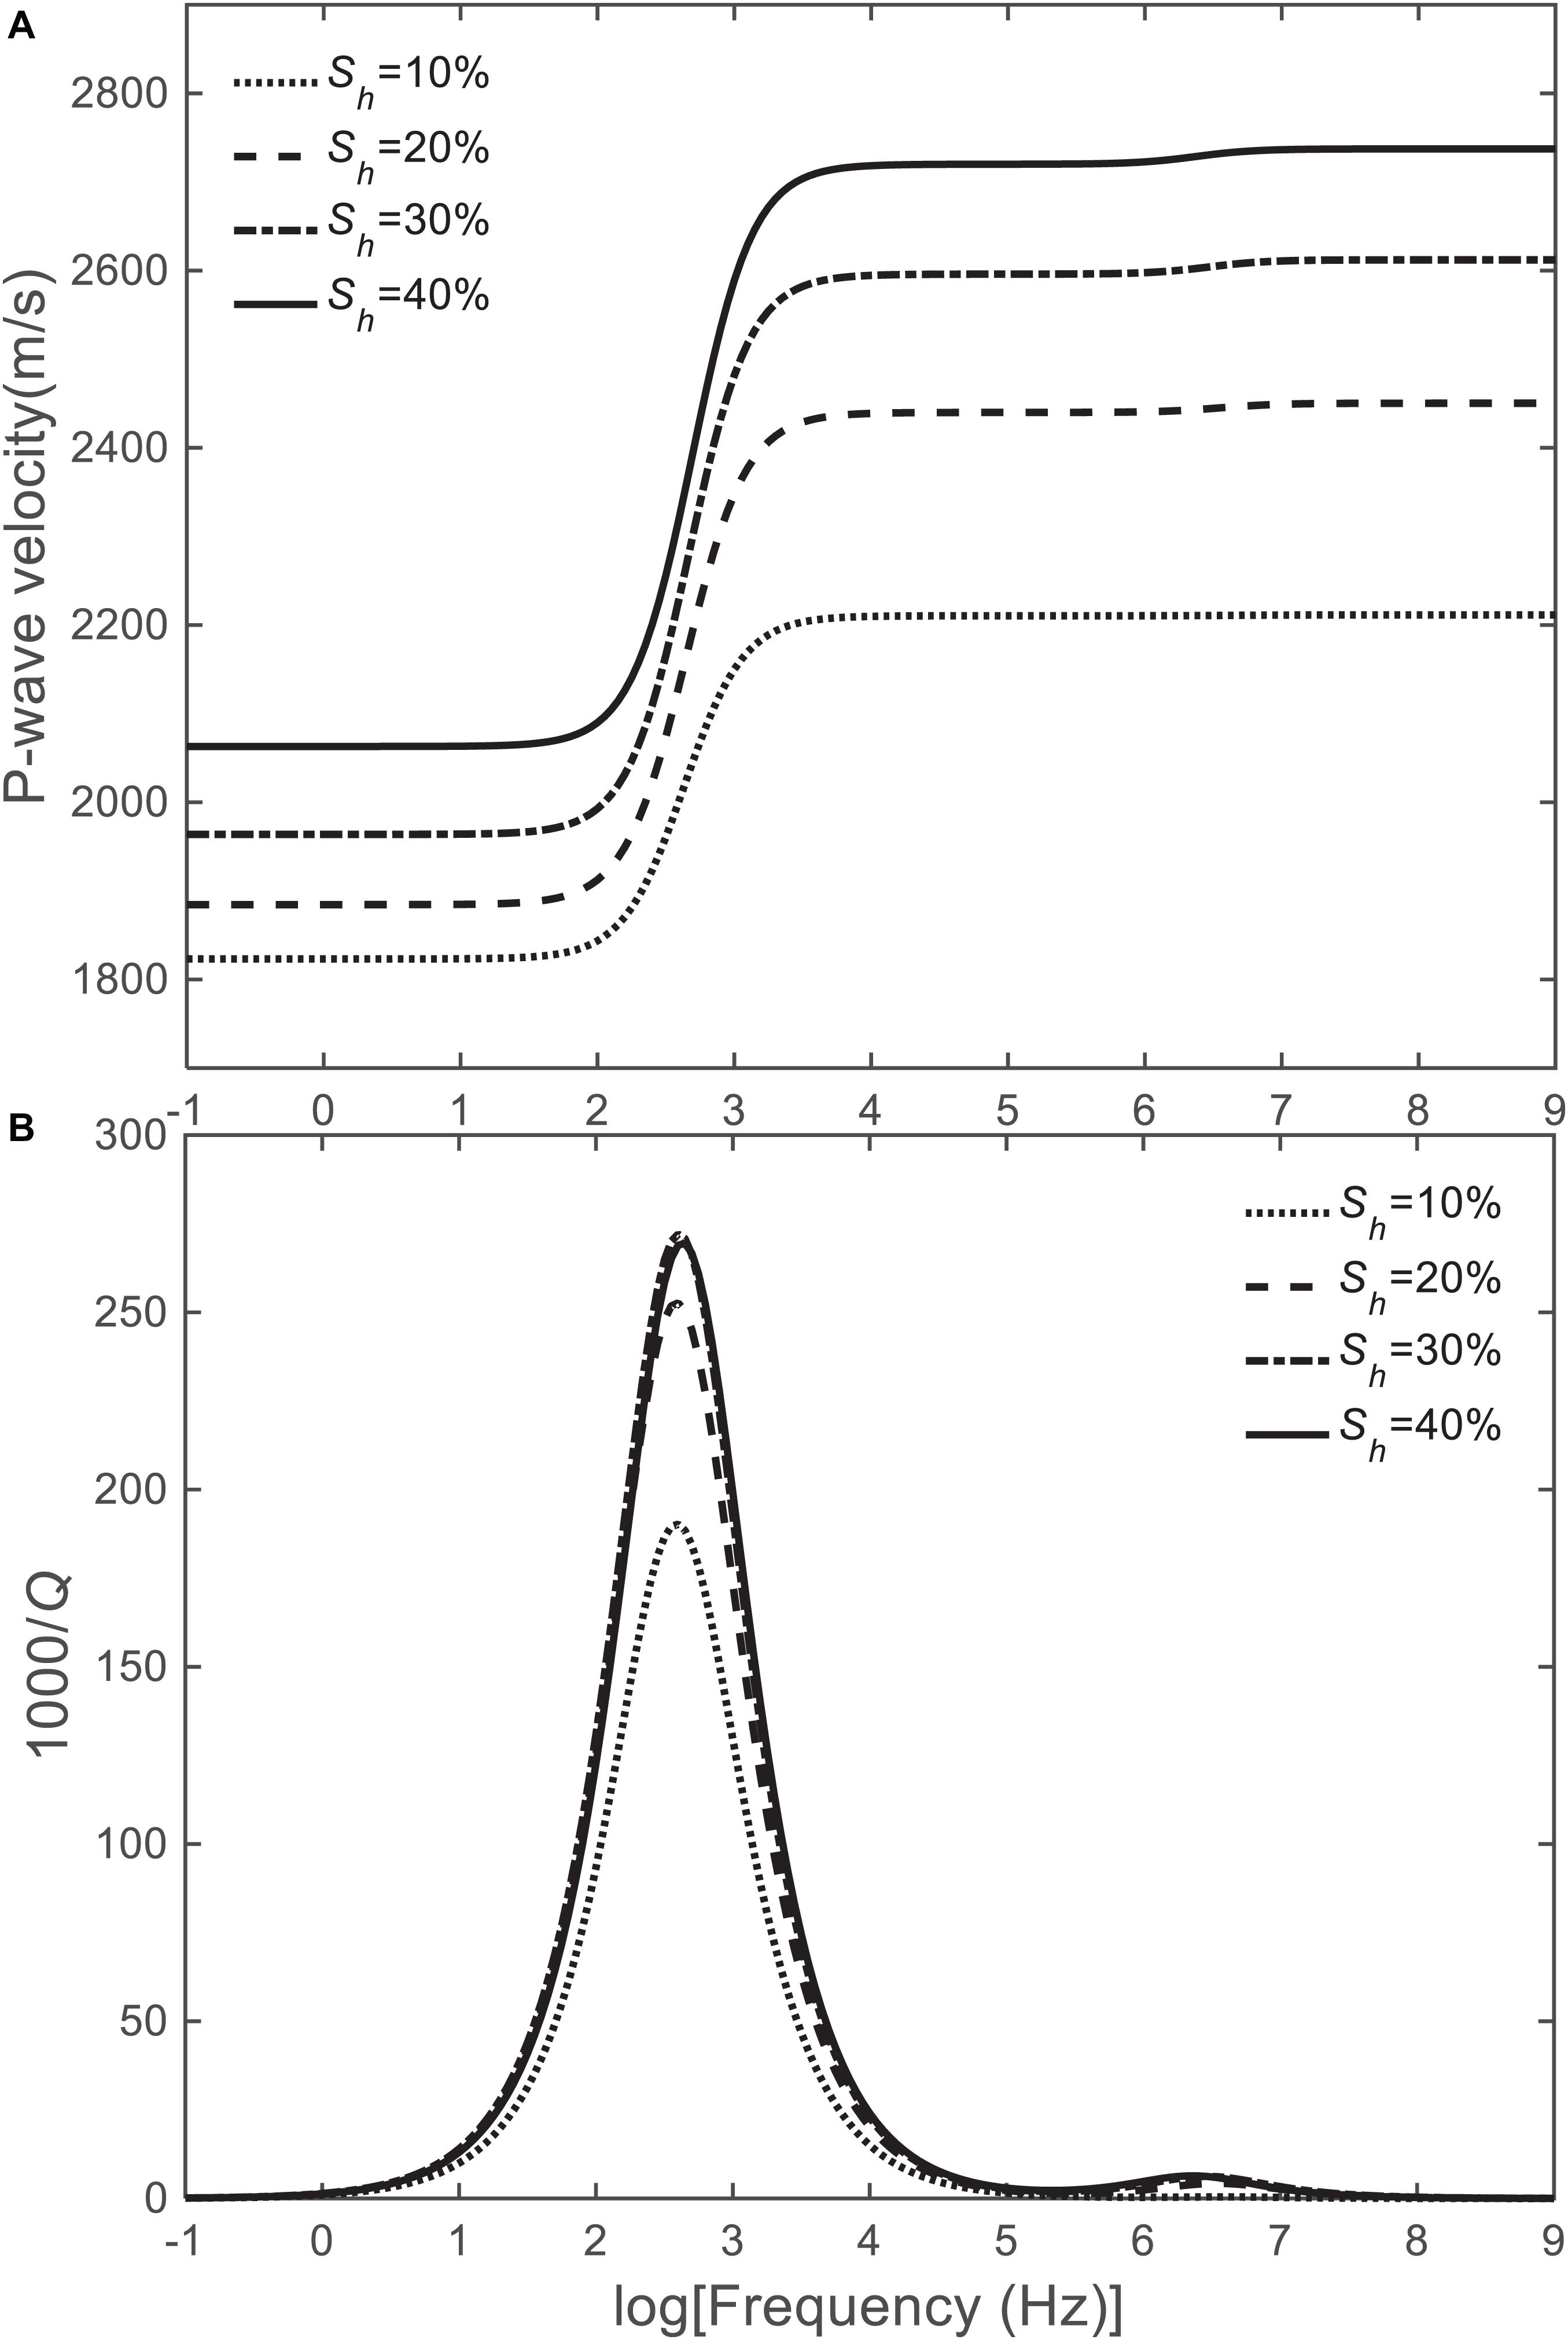
Figure 10. Model 2. P-wave velocity (A) and dissipation factor (B) as a function of frequency for different hydrate contents. The inclusion radius is 1 cm and the porosity is 40%.
Comparison with Real Data
Laboratory Data
We have used the experimental data from Priest et al. (2005, 2009) and Best et al. (2013), who performed the resonance-column experiments on synthetic hydrates, to further analyze the two models. Two methods, termed “excess water” and “excess gas,” are implement to generate solid hydrate (Priest et al., 2009). P-wave velocity and attenuation at an effective pressure of 500 kPa were measured in sand samples (Priest et al., 2005; Priest et al., 2009; Best et al., 2013). The moduli, permeability, and critical porosity are given in Tables 1, 2. In section “Laboratory Data,” we choose the same grain coordination number n = 4 as Best et al. (2013), to compare the theoretical curves proposed by those authors.
Excess-Water Method
The continuously injected water reacts with a certain amount of methane gas to form small quantities of hydrates, which are not in contact with the grains. In this case, we have the assumption of Model 1 (Best et al., 2013; Tuan et al., 2019), with hydrate concentrations less than 40% (Priest et al., 2009; Zhao et al., 2015). Figures 11, 12 compare the theoretical and experimental P-wave velocities and dissipation factors as a function of hydrate concentration around 200 Hz, respectively. Porosities are 40 and 42%, respectively. The inclusion radius is 0.8 and 4 cm, respectively, based on fitting. We assume a small free-gas volume ratio (0.002), considering that the free gas does not fully react with water during the experiment. As the hydrate content increases, it gradually cements the mineral grains and we have Model 2. Chen et al. (2020) applied microtomography (CT) to analyze the evolution of hydrate pore habit during hydrate formation. Therefore, at low concentrations, the P-wave velocity increases slowly with hydrate content (Ecker et al., 1998).
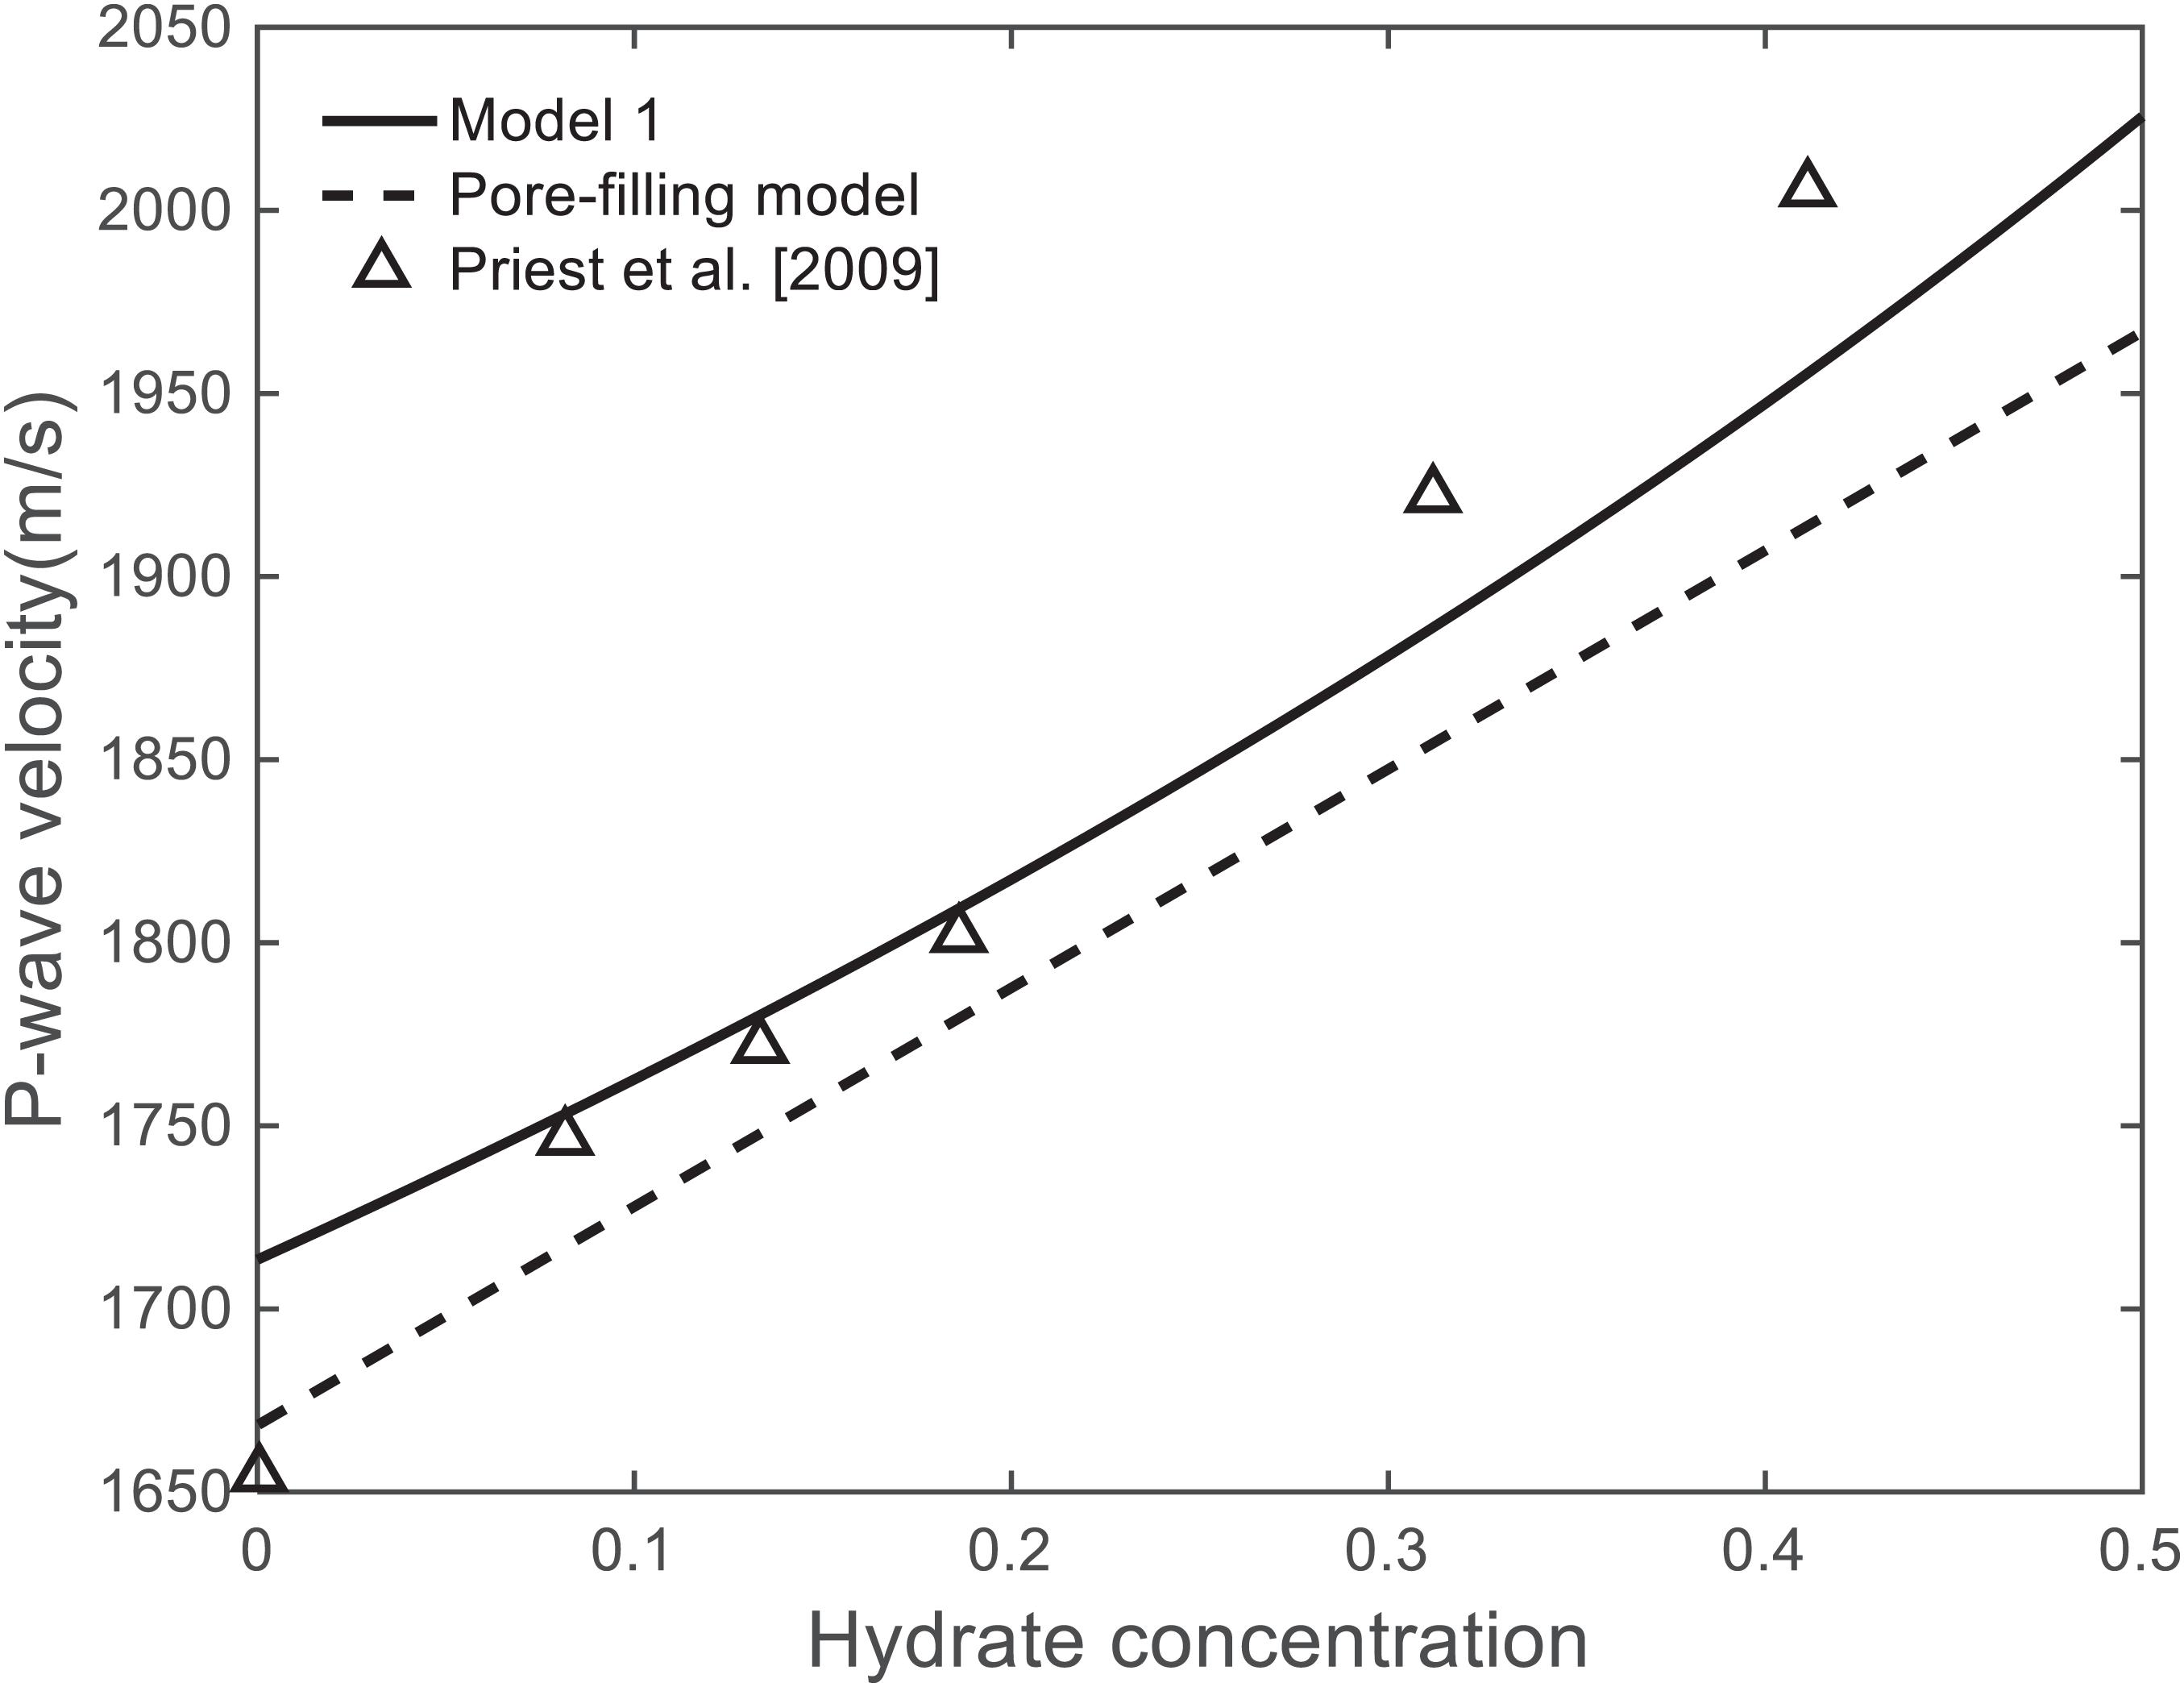
Figure 11. Model 1. P-wave velocity as a function of hydrate concentration. The frequency is around 200 Hz. The pore-filling model curve and the experimental data (triangles) are taken from Priest et al. (2009).
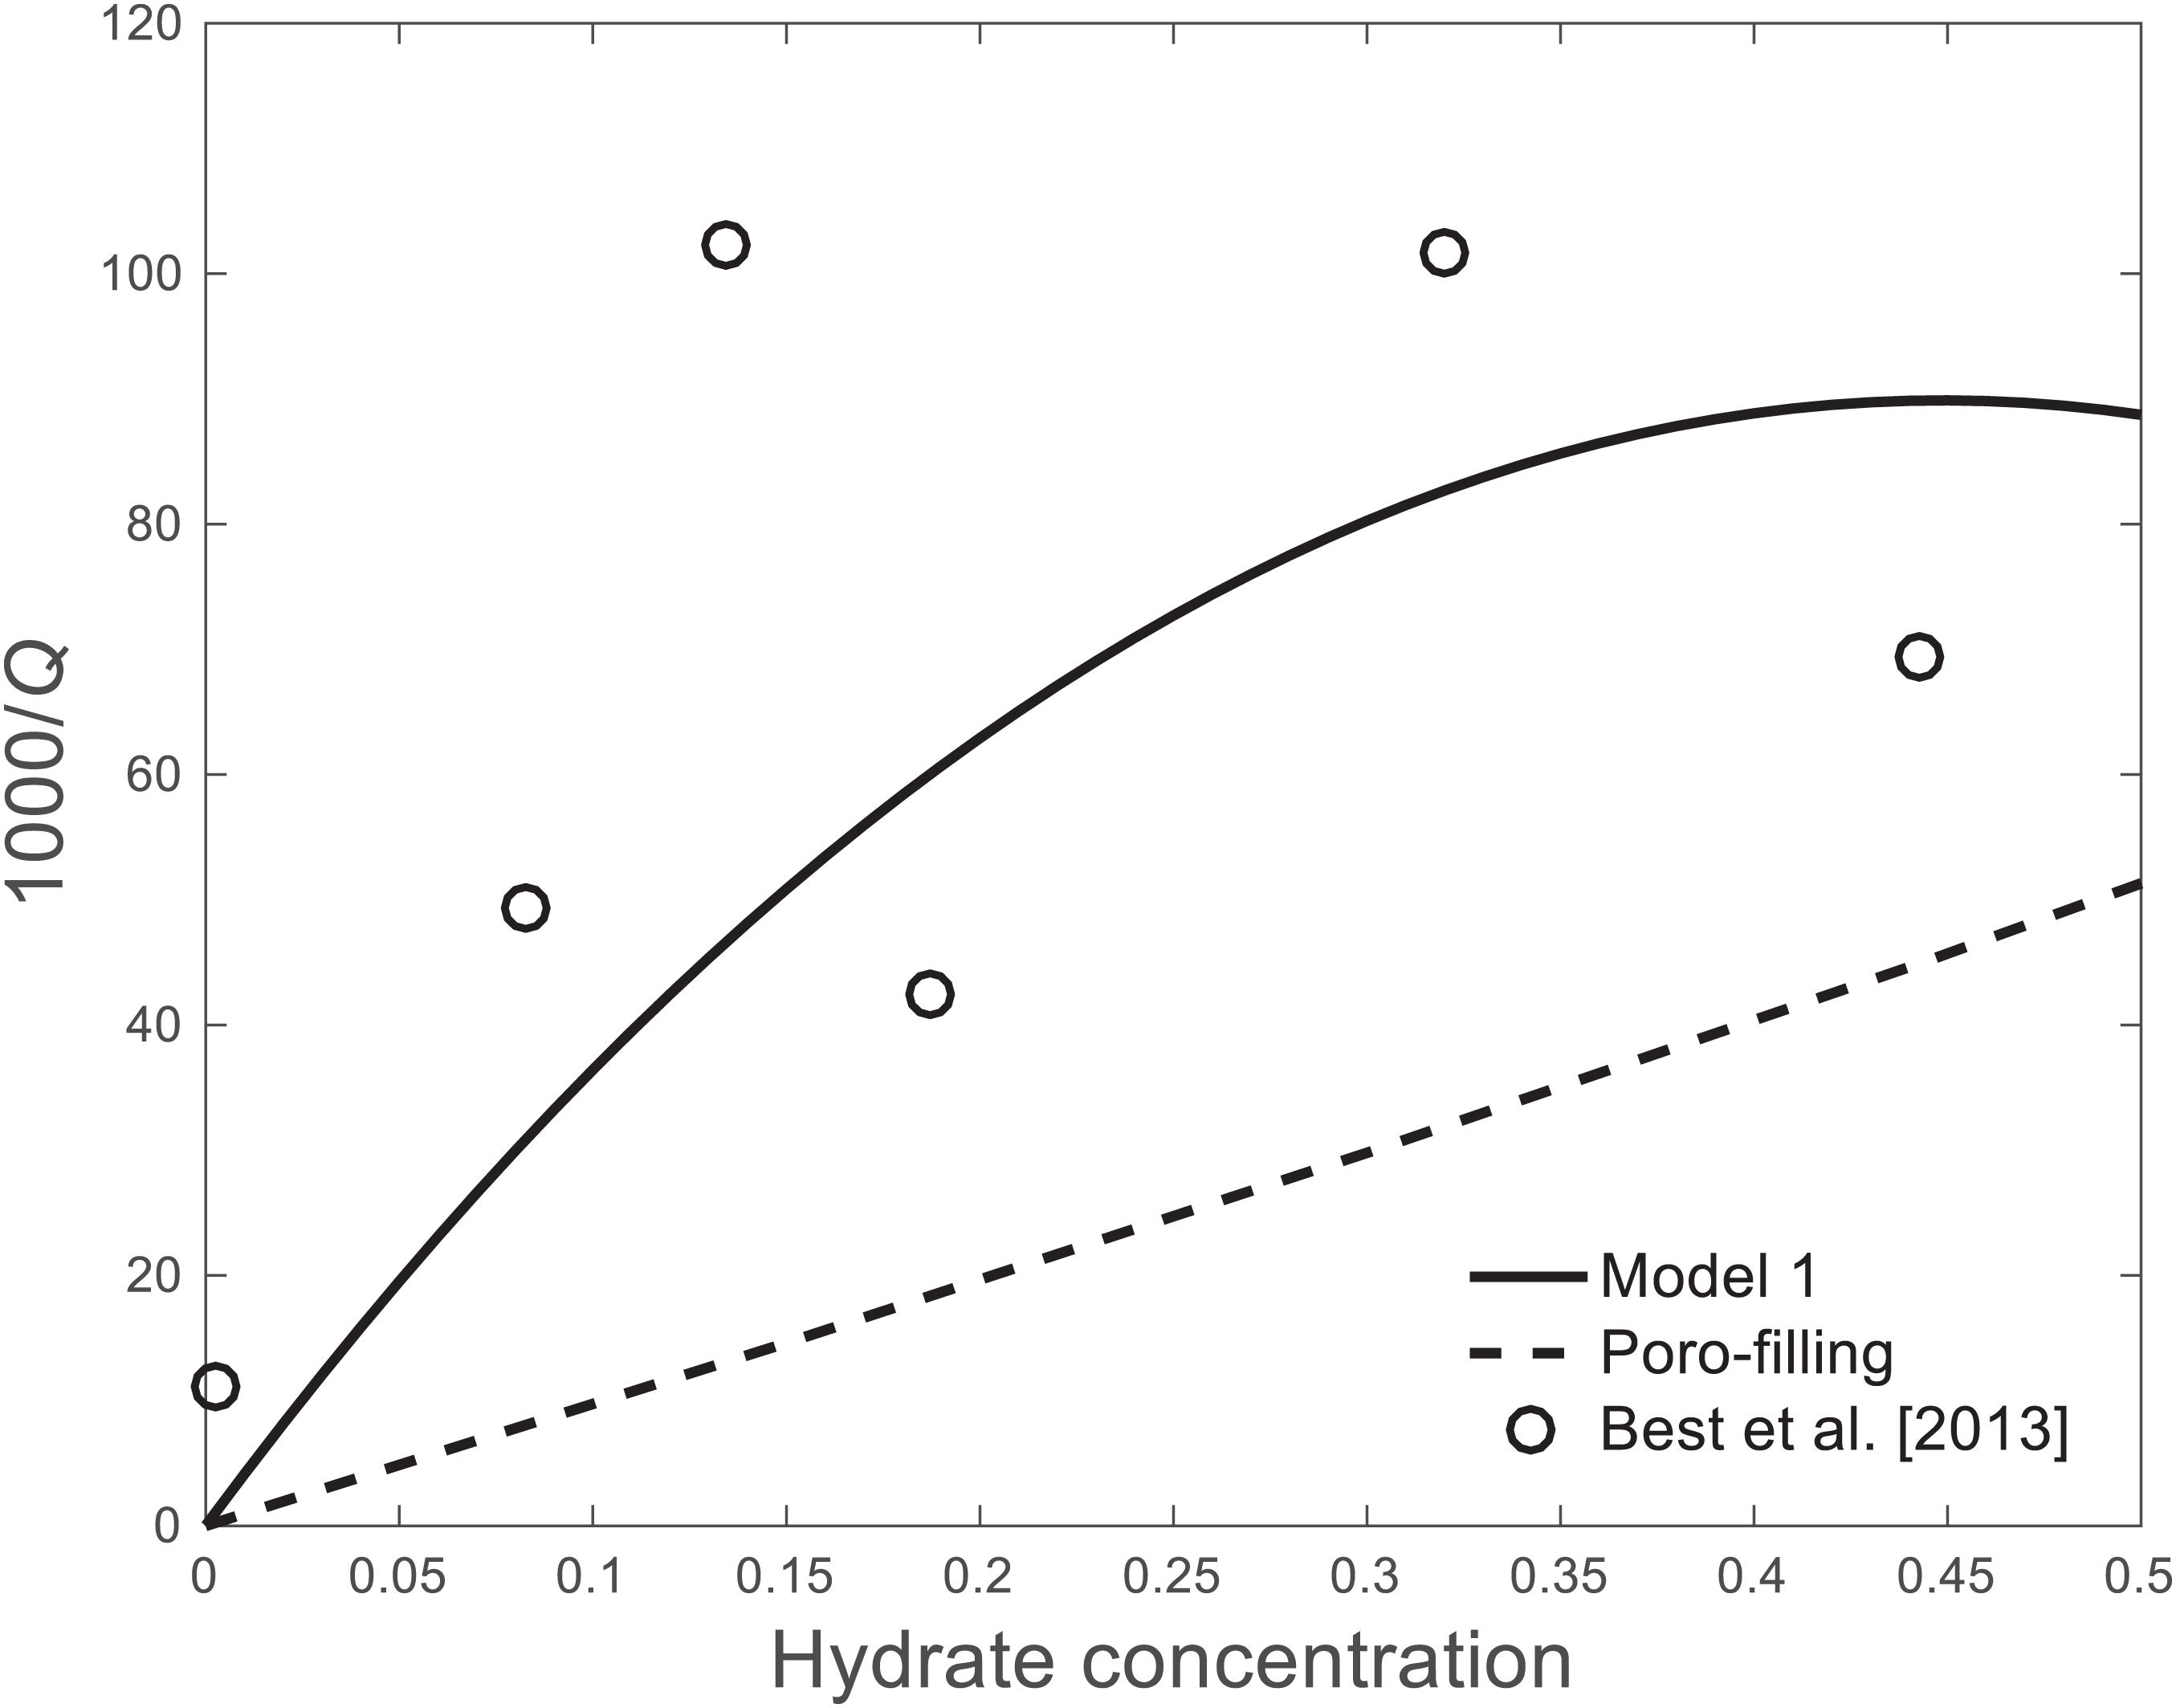
Figure 12. Model 1. Dissipation factor as a function of hydrate concentration. The frequency is around 200 Hz. The pore-filling model and the experimental data (circles) are taken from Best et al. (2013).
Both the pore-filling model and cementing model proposed by Priest et al. (2009) are based on effective-medium theories, because Gassmann equation cannot describe the characteristics of rocks with a double-porosity structure. Therefore, Model 1 can better describe the P-wave velocity, as shown in Figure 11. As the hydrate content exceeds 30%, Model 1 does not fit the P-wave velocity and the assumptions of Model 2 hold. Best et al. (2013) used the effective-medium theory and the correspondence principle to model attenuation (poro-filling curve shown in Figure 12). Their prediction results are lower than the measured attenuation values, while Model 1 provides a relatively good fit. The key parameter is the size of the hydrate-inclusion radius.
Excess-Gas Method
A high amount of methane gas is injected to react with water, and then gas hydrate is formed at the grain contacts or at the surface of the grains. Thus, we have the conditions of Model 2 (Best et al., 2013; Tuan et al., 2019). Figures 13, 14 compare the theoretical and experimental P-wave velocities and dissipation factors as a function of hydrate concentration around 200 Hz, respectively (the porosities are 42%). The hydrate inclusion radius are 2 and 0.2 cm, respectively, and as in section “Excess-Water Method,” the free-gas volume ratio is 0.002.
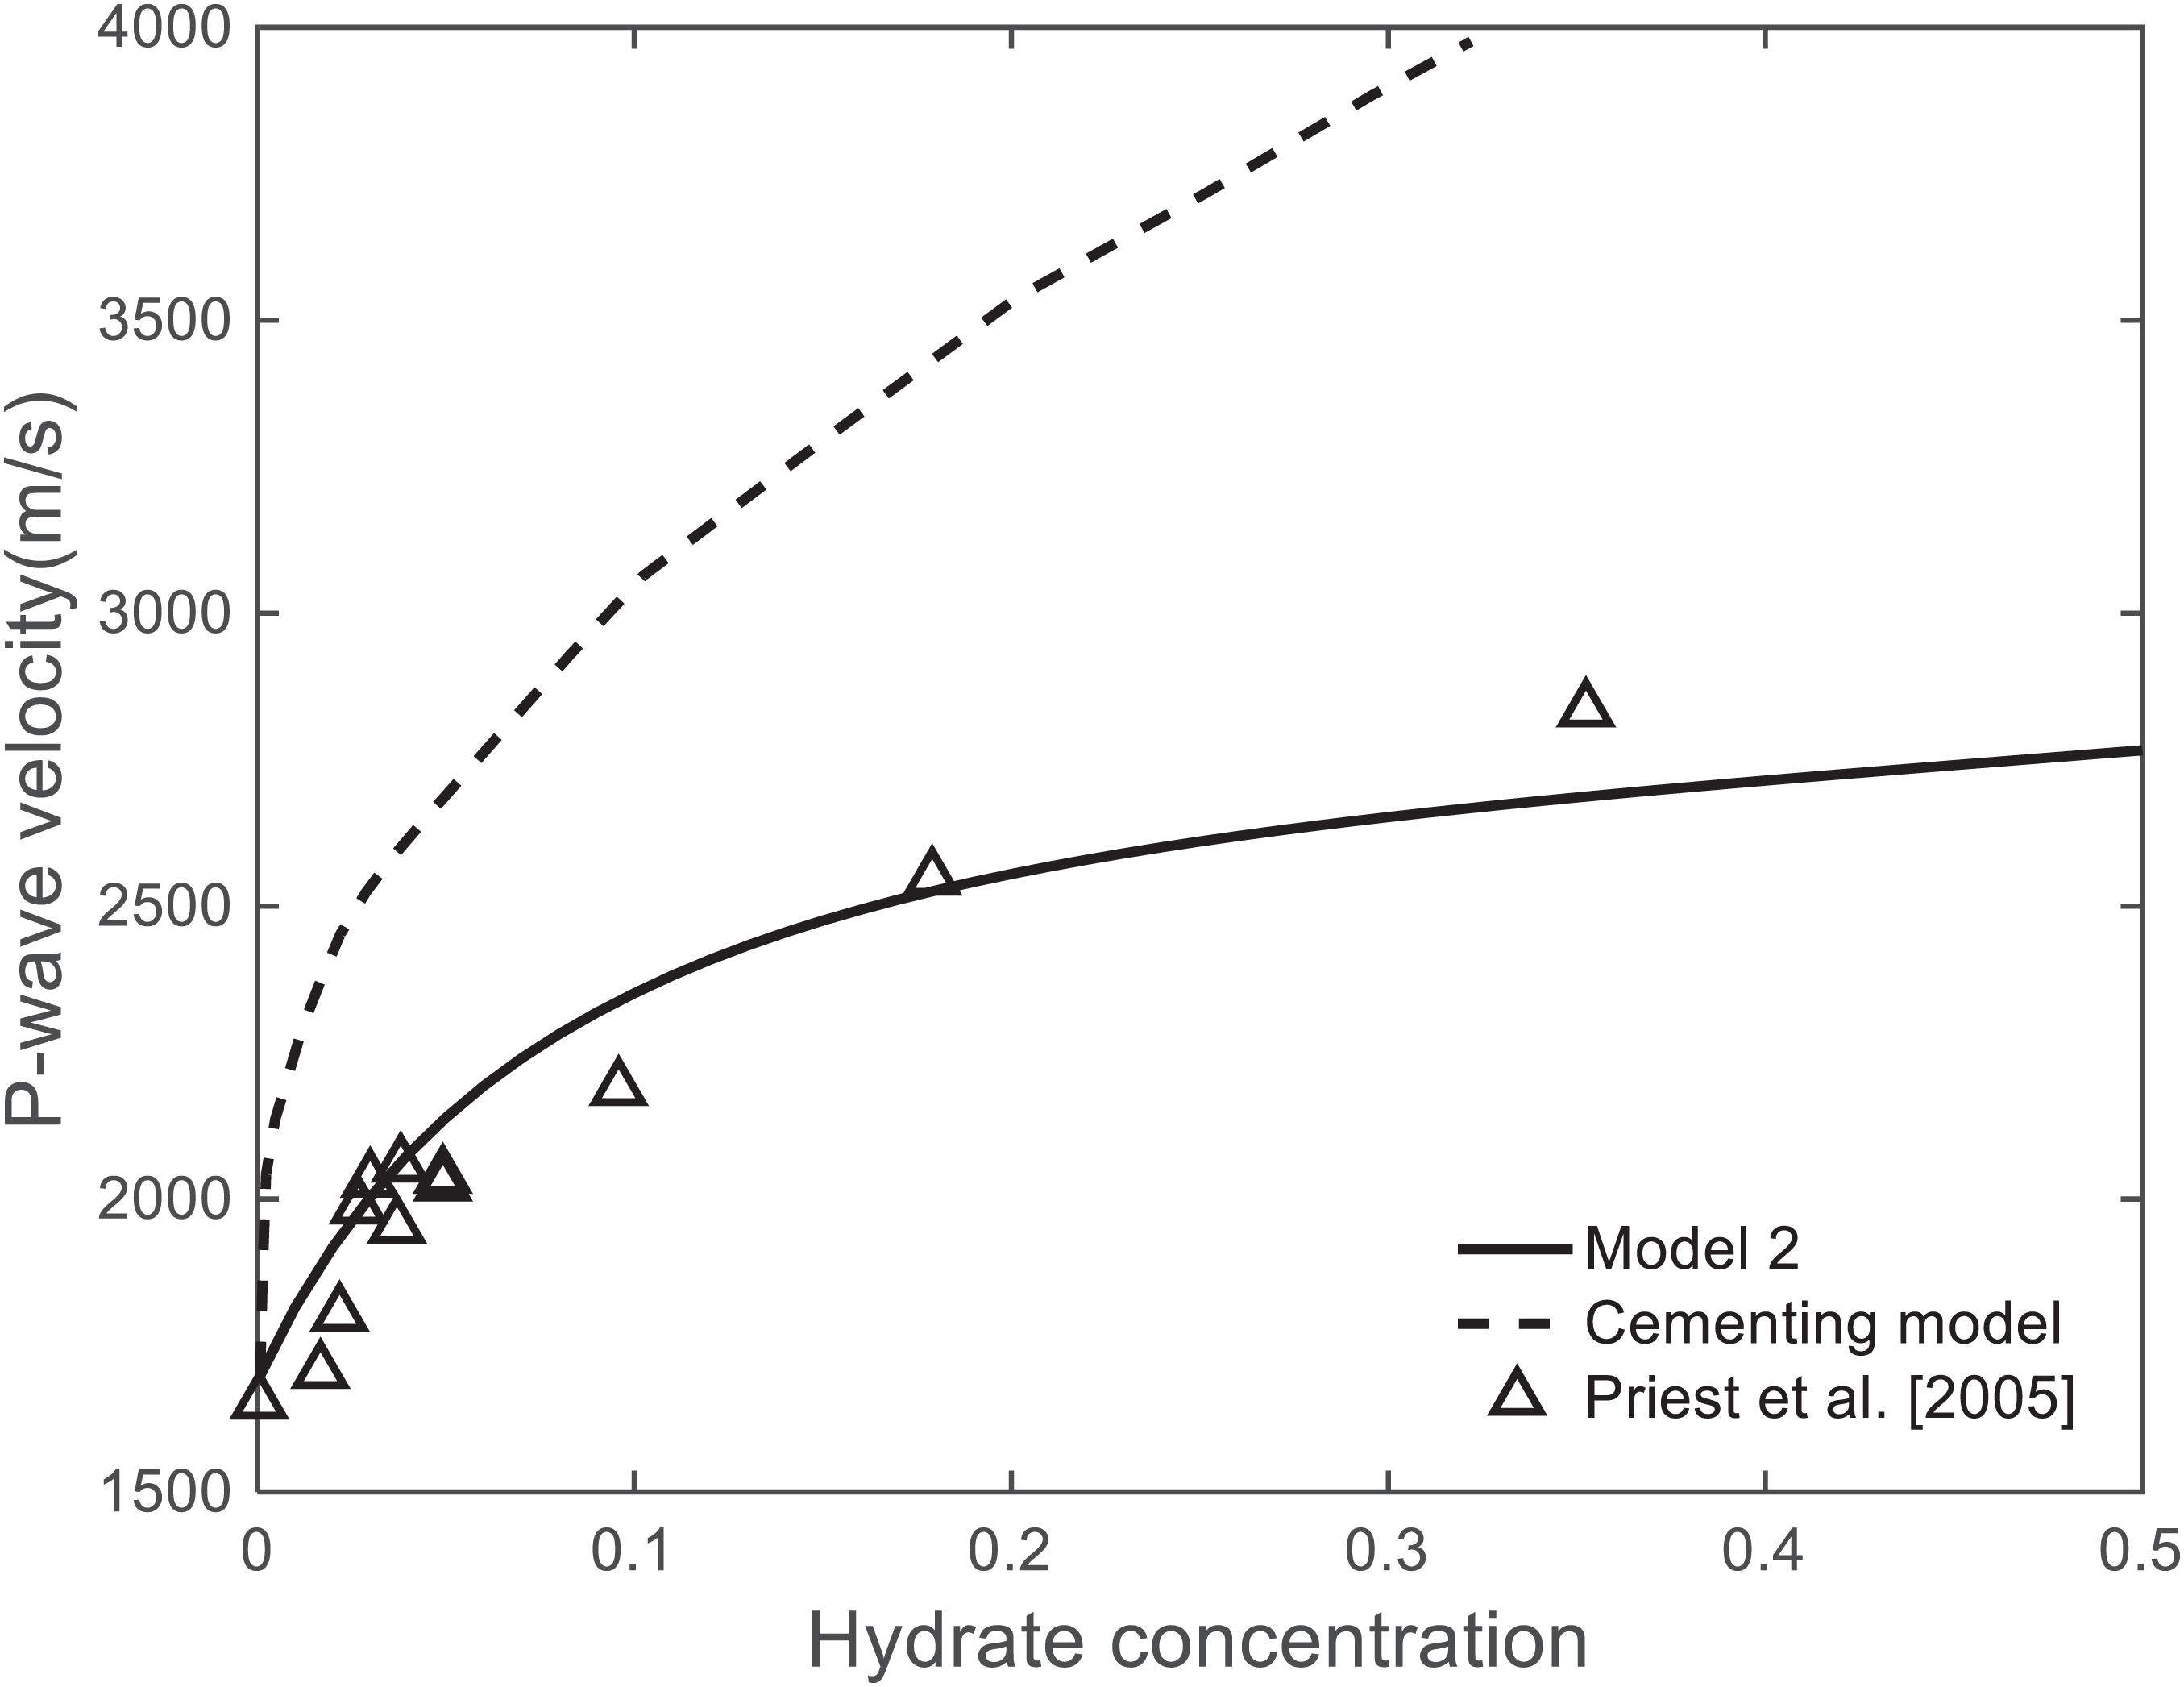
Figure 13. Model 2. P-wave velocity as a function of hydrate concentration. The frequency is around 200 Hz. The cementing-model curve and experimental data (triangles) are taken from Priest et al. (2005).
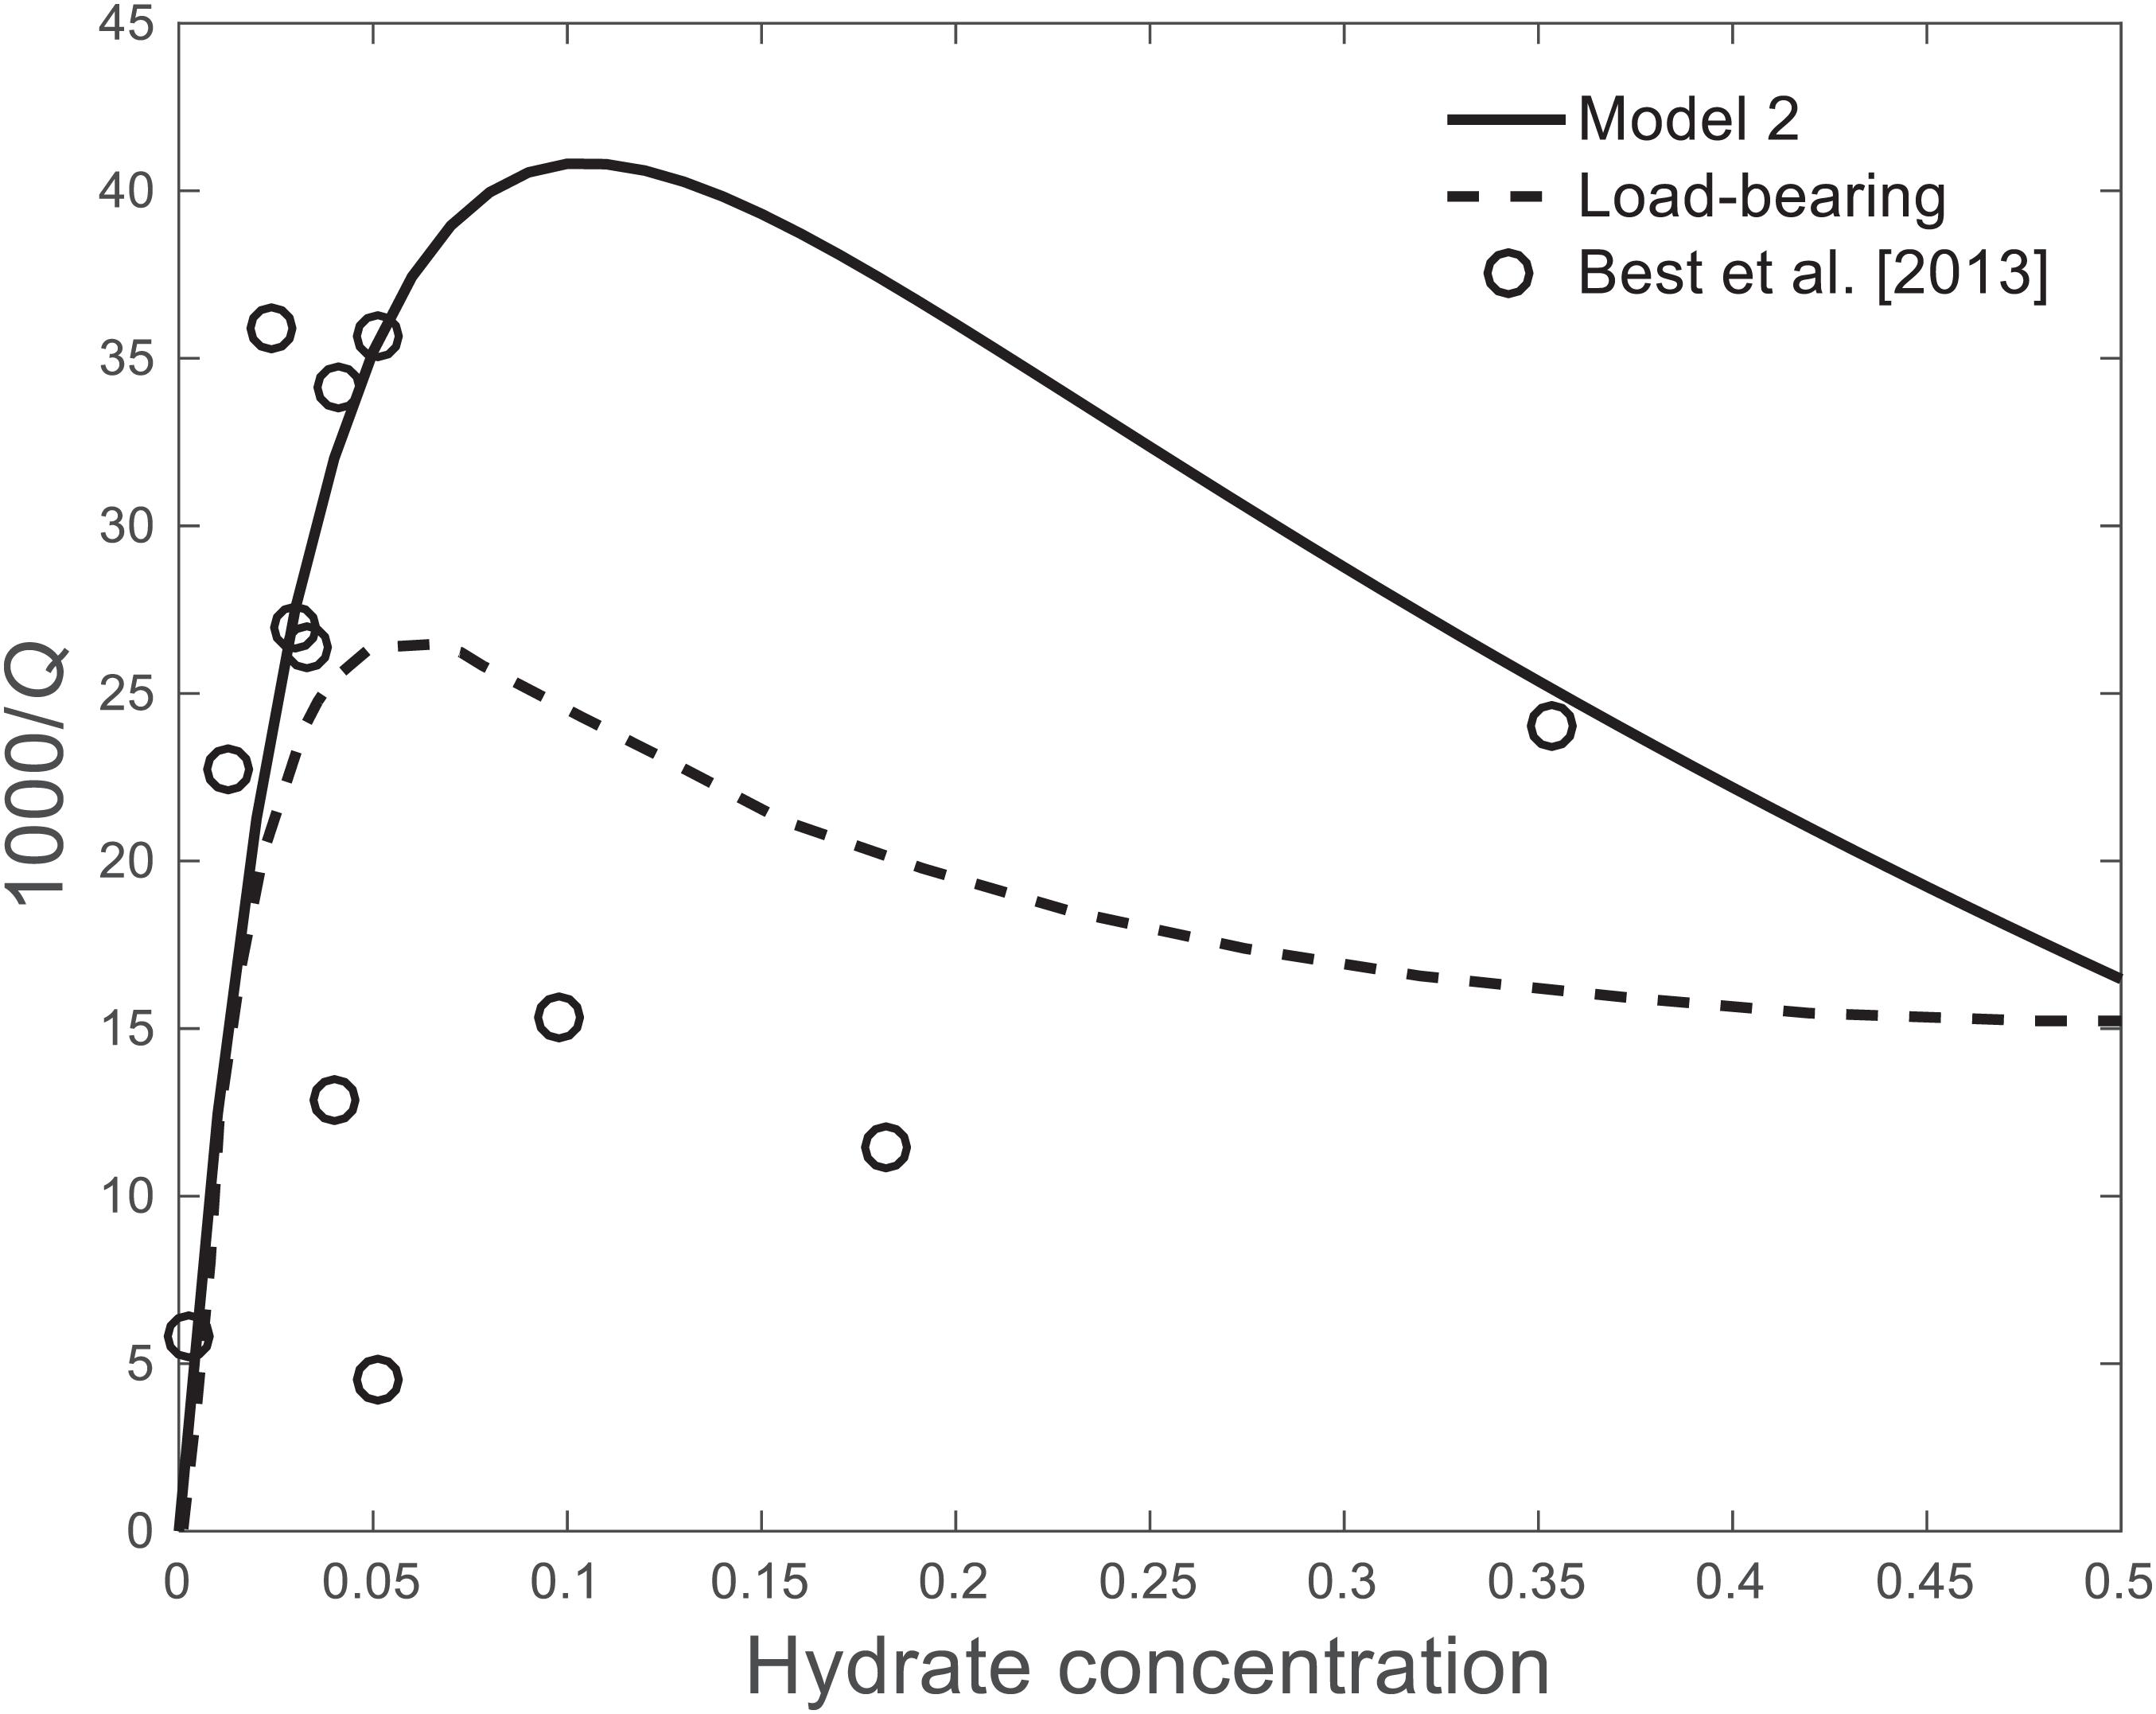
Figure 14. Model 2. Dissipation factor as a function of hydrate concentration. The frequency is around 200 Hz. The load-bearing model curve and experimental data (circles) are taken from Best et al. (2013).
The hydrate cementing the grains significantly increases the dry-rock moduli and the P-wave velocity. Although the P-wave velocity of the cementing model proposed by Priest et al. (2009) does not fit the experimental data (Figure 13), it follows the trend at low hydrate content. The results from Model 2 show that the P-wave velocity increases sharply at low hydrate saturations. It is evident that Model 2 better describes the P-wave velocity data. In Figure 14, the load-bearing curve proposed by Best et al. (2013) agrees with the data when the hydrate content is lower than 10%, but the match of the attenuation peak of attenuation is not good. Instead, Model 2, shows a better agreement.
Sonic-Logging Data
In the hydrate-bearing sediments, estimations of hydrate concentration based on a single model may not be appropriate, because of the different spatial distributions of the hydrate. For instance, Liu et al. (2020) confirmed the coexistence of different gas-hydrate distributions from seismic velocity.
We have used the sonic-log data obtained by Zhan and Matsushima (2018) in Nankai Trough of Japan for the analysis, data required by the two models. In their work, the sonic-log (magnetic monopoles) frequency is 14 kHz, the average porosity is 40%, the grain coordination number is 8.5, the seawater viscosity is 0.0018 Pa s, and the effective pressure is about 500 kPa. The hydrate inclusion radius is 0.18 cm. Figure 15 shows the results. The sonic-log data in Figure 15A shows that the P-wave velocity gradually increases with hydrate content, showing a linear relation. Zhan and Matsushima (2018) used the Marín-Moreno and Guerin models to predict P-wave velocity and attenuation, respectively. When the hydrate saturation is higher than 20%, the Guerin model is consistent with the P-wave velocity of sonic-logging data. The Marín-Moreno model considers 20% pore-filling hydrate and 80% contact cementing hydrate, giving a better prediction. Without considering the diverse hydrate morphologies, the Models 1 and 2 are applied to predict the velocities in the lower and higher bounds, respectively. Figure 15B, shows that the experimental dissipation factor is distributed on a wide range, which may be related to different geometrical distributions of the hydrate. Model 1 predicts low values, while those of Model 2 are more consistent with the data. The attenuation of P-wave increases first and then decreases with hydrate saturation increasing. Rossi et al. (2007) estimated a lower dissipation factor when hydrate is present at lower frequencies than those involved in Figure 15B. The increasing attenuation at low concentrations can be due to a local-flow mechanism or to scattering loss, since the data corresponds to sonic frequencies.
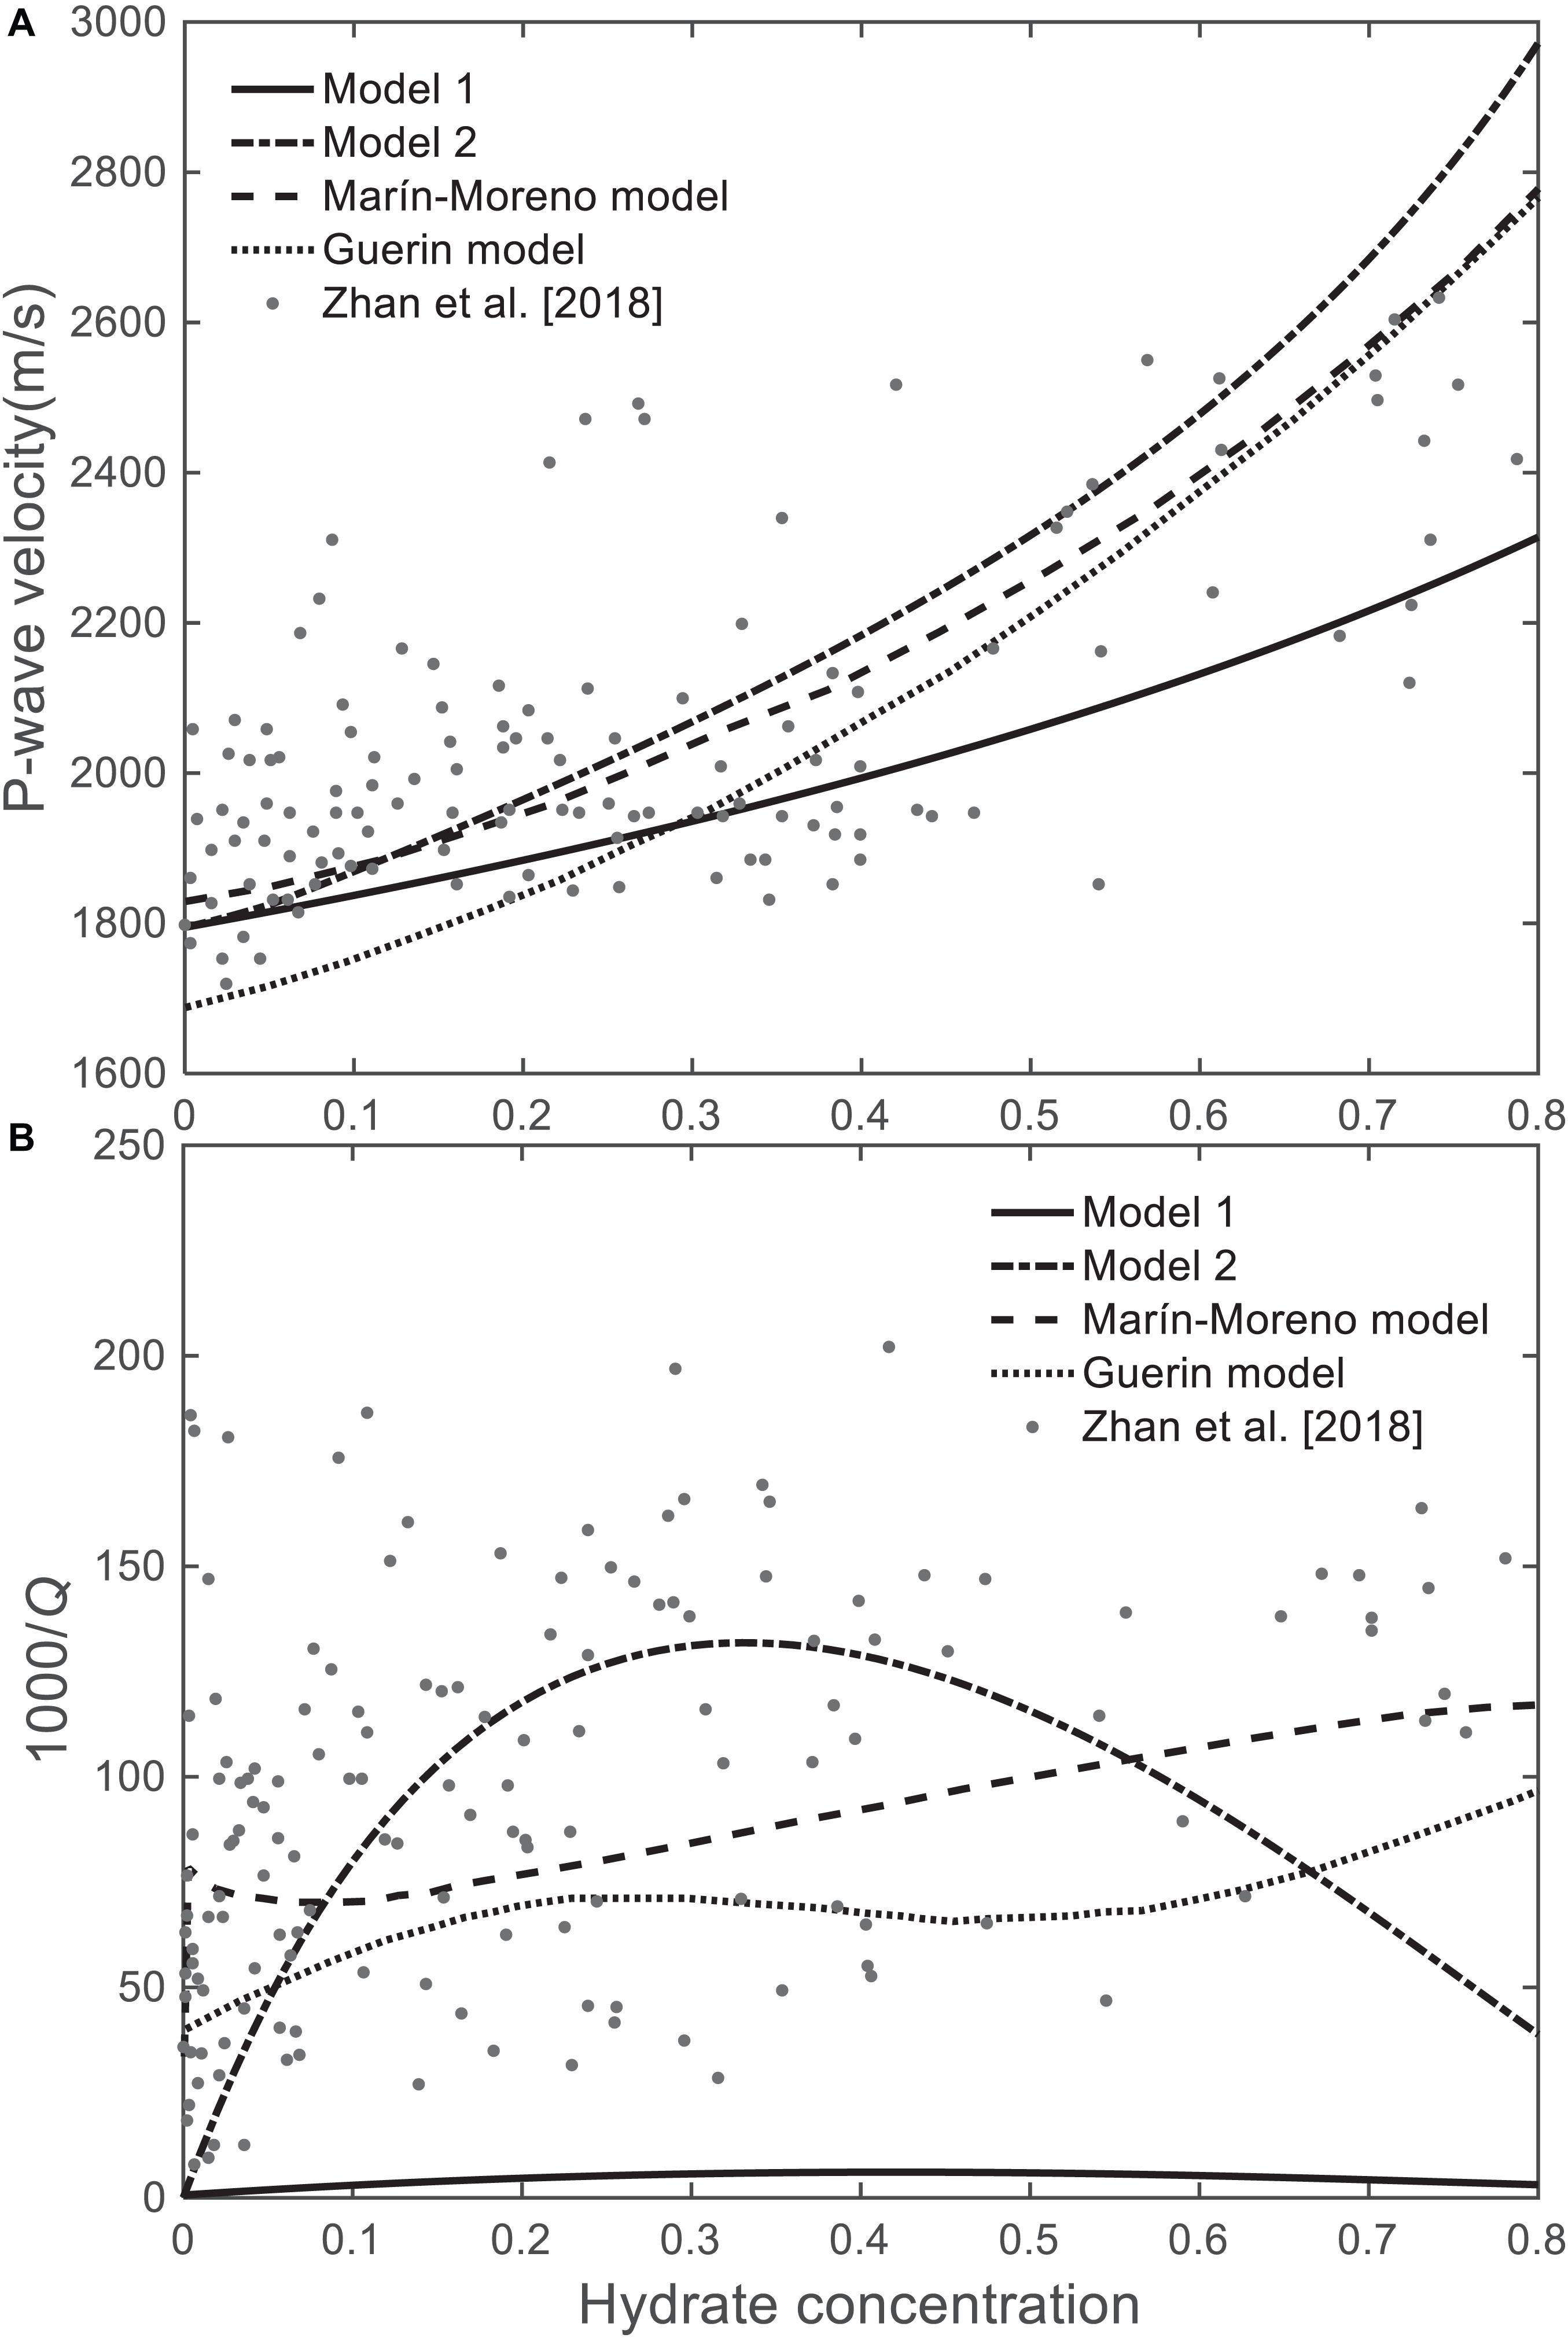
Figure 15. Model comparison with those of the other authors. (A) P-wave velocity and (B) dissipation factor.
Conclusion
We propose two models to calculate the wave velocity and attenuation of gas-hydrate bearing sediments, based on the Biot-Rayleigh double-porosity theory and two different distributions of the hydrate in the porous medium. The difference is that in one case hydrate is part of the pore infill and in the other constitutes an additional (load-bearing) skeleton. The local inclusion radius of the Biot-Rayleigh theory is related to the hydrate/gas mixture in the first model and to the hydrate frame in the second. The models predict two relaxation peaks, namely the local-flow one (mesoscopic loss) and the classical global flow one, also predicted by the Biot theory. As expected, P-wave velocity decreases and attenuation increases with porosity. The local-flow relaxation (attenuation) peak moves to the low frequencies with increasing inclusion radius. More hydrate content has the effect to increase the attenuation at low values, reach a maximum loss and then decrease it. Modeling results are compared with data obtained from the excess-water and excess-gas experiments, which generally reproduce the conditions of the first and second models, respectively. The predictions describe quite satisfactory the measured data in both cases. Moreover, comparisons with log data show a good agreement, in particular the second model (hydrate forming a frame). The models can be useful to estimate gas-hydrate content from seismic data.
Data Availability Statement
The original contributions presented in the study are included in the article/Supplementary Material, and further inquiries can be directed to the corresponding author/s.
Author Contributions
WW: modeling and writing. JB: modeling and writing and verification. JC: translation and suggestion. XL: suggestion. LZ: communication and guidance. All authors contributed to the article and approved the submitted version.
Funding
The authors were grateful to the support of the Jiangsu Innovation and Entrepreneurship Plan, the research funds from SINOPEC Key Laboratory of Geophysics, Jiangsu Province Science Fund for Distinguished Young Scholars (BK20200021), and National Natural Science Foundation of China (41974123).
Conflict of Interest
The authors declare that the research was conducted in the absence of any commercial or financial relationships that could be construed as a potential conflict of interest.
Supplementary Material
The Supplementary Material for this article can be found online at: https://www.frontiersin.org/articles/10.3389/feart.2021.640424/full#supplementary-material
References
Ba, J., Carcione, J. M., Cao, H., Du, Q. Z., Yuan, Z. Y., and Lu, M. H. (2012). Velocity dispersion and attenuation of P waves in partially-saturated rocks: wave propagation equations in double-porosity medium. Chinese J. Geophys. (in Chinese) 55, 219–231.
Ba, J., Carcione, J. M., and Nie, J. X. (2011). Biot-Rayleigh theory of wave propagation in double-porosity media. J. Geophys. Res. Solid Earth 116:B06202.
Ba, J., Zhao, J., Carcione, J. M., and Huang, X. X. (2016). Compressional wave dispersion due to rock matrix stiffening by clay squirt flow. Geophys. Res. Lett. 43, 6186–6195. doi: 10.1002/2016gl069312
Best, A. I., Priest, J. A., Clayton, C. R. I., and Rees, E. V. L. (2013). The effect of methane hydrate morphology and water saturation on seismic wave attenuation in sand under shallow sub-seafloor conditions. Earth Planetary Sci. Lett. 368, 78–87. doi: 10.1016/j.epsl.2013.02.033
Carcione, J. M. (2014). Wave Fields in Real Media. Theory and Numerical Simulation of Wave Propagation in Anisotropic, Anelastic, Porous and Electromagnetic Media, 3rd Edn. Amsterdam: Elsevier.
Carcione, J. M., and Gei, D. (2004). Gas-hydrate concentration estimated from P- and S-wave velocities at the Mallik 2L-38 research well, Mackenzie Delta. Canada. J. Appl. Geophys. 56, 73–78. doi: 10.1016/j.jappgeo.2004.04.001
Carcione, J. M., Gei, D., Rossi, G., and Madrussani, G. (2005). Estimation of gas-hydrate concentration and free-gas saturation at the Norwegian-Svalbard continental margin. Geophys. Prospect. 53, 803–810. doi: 10.1111/j.1365-2478.2005.00502.x
Carcione, J. M., Gei, D., Rossi, G., and Tinivella, U. (2012). Wave Theory, Simulation, and Determination of Gas-hydrate Content in Sediments. Tulsa, OK: Society of Exploration Geophysicists.
Carcione, J. M., and Tinivella, U. (2000). Bottom-simulating reflectors: seismic velocities and AVO effects. Geophysics 65, 54–67. doi: 10.1190/1.1444725
Chand, S., and Minshull, T. A. (2003). Seismic constraints on the effects of gas hydrate on sediment physical properties and fluid flow: a review. Geofluids 3, 275–289. doi: 10.1046/j.1468-8123.2003.00067.x
Chand, S., and Minshull, T. A. (2004). The effect of hydrate content on seismic attenuation: a case study for Mallik 2L-38 well data, Mackenzie delta. Canada. Geophys. Res. Lett. 31:L14609.
Chand, S., Minshull, T. A., Gei, D., and Carcione, J. M. (2004). Elastic velocity models for gas-hydrate-bearing sediments—a comparison. Geophys. J. Int. 159, 573–590. doi: 10.1111/j.1365-246x.2004.02387.x
Chand, S., Minshull, T. A., Priest, J. A., Best, A. I., Clayton, C. R. I., and Waite, W. F. (2006). An effective medium inversion algorithm for gas hydrate quantification and its application to laboratory and borehole measurements of gas hydrate-bearing sediments. Geophys. J. Int. 166, 543–552. doi: 10.1111/j.1365-246x.2006.03038.x
Chen, X. Y., Espinoza, D. N., Luo, J. S., Tisato, N., and Flemings, P. B. (2020). Pore-scale evidence of ion exclusion during methane hydrate growth and evolution of hydrate pore-habit in sandy sediments. Mar. Petroleum Geol. 117:104340. doi: 10.1016/j.marpetgeo.2020.104340
Dvorkin, J., and Nur, A. M. (1993). Dynamic poroelasticity: a unified model with the squirt and the Biot mechanisms. Geophysics 58, 524–533. doi: 10.1190/1.1443435
Dvorkin, J., Nur, A. M., Uden, R., and Taner, T. (2003). Round table—rock physics of a gas hydrate reservoir. Leading Edge 22, 842–847. doi: 10.1190/1.1614153
Dvorkin, J., Prasad, M., Sakai, A., and Lavoie, D. (1999). Elasticity of marine sediments: rock physics modeling. Geophys. Res. Lett. 26, 1781–1784. doi: 10.1029/1999gl900332
Ecker, C., Dvorkin, J., and Nur, A. M. (1998). Sediments with gas hydrates: internal structure from seismic AVO. Geophysics 63, 1659–1669. doi: 10.1190/1.1444462
Ecker, C., Dvorkin, J., and Nur, A. M. (2000). Estimating the amount of gas hydrate and free gas from marine seismic data. Geophysics 65, 565–573. doi: 10.1190/1.1444752
Gei, D., and Carcione, J. M. (2003). Acoustic properties of sediments saturated with gas hydrate, free gas and water. Geophys. Prospect. 51, 141–158. doi: 10.1046/j.1365-2478.2003.00359.x
Guerin, G., and Goldberg, D. (2002). Sonic waveform attenuation in gas hydrate-bearing sediments from the Mallik 2L-38 research well, Mackenzie Delta, Canada, Mackenzie Delta, Canada. J. Geophys. Res. Solid Earth 107:2088.
Guerin, G., and Goldberg, D. (2005). Modeling of acoustic wave dissipation in gas hydrate-bearing sediments. Geochem. Geophys. Geosystems 6:Q07010.
Helgerud, M. B., Dvorkin, J., Nur, A., Sakai, A., and Collett, T. (1999). Elastic-wave velocity in marine sediments with gas hydrates: effective medium modeling. Geophys. Res. Lett. 26, 2021–2024. doi: 10.1029/1999gl900421
Konno, Y., Jin, Y., Yoneda, J., Kida, M., Egawa, K., Ito, T., et al. (2015). Effect of methane hydrate morphology on compressional wave velocity of sandy sediments: analysis of pressure cores obtained in the Eastern Nankai Trough. Mar. Petroleum Geol. 66, 425–433. doi: 10.1016/j.marpetgeo.2015.02.021
Kuhs, W. F., Genov, G., Goreshnik, E., Zeller, A., Techmer, K. S., and Bohrmann, G. (2004). The impact of porous microstructures of gas hydrates on their macroscopic properties. Int. J. Offshore Polar Eng. 14, 305–309.
Leclaire, P., Cohen-Tenoudji, F., and Aguirre-Puente, J. (1994). Extension of Biot’s theory of wave propagation to frozen porous media. J. Acoustical Soc. Am. 96, 3753–3768.
Lee, J. Y., Francisca, F. M., Santamarina, J. C., and Ruppel, C. (2010). Parametric study of the physical properties of hydrate-bearing sand, silt, and clay sediments: 2. Small-strain mechanical properties. J. Geophys. Res. Solid Earth 115:B11105.
Lee, M. W. (2002a). Biot–Gassmann theory for velocities of gas hydrate-bearing sediments. Geophysics 67, 1711–1719. doi: 10.1190/1.1527072
Lee, M. W. (2002b). Modified biot-gassmann theory for calculating elastic velocities for unconsolidated and consolidated sediments. Mar. Geophys. Res. 23, 403–412. doi: 10.1023/b:mari.0000018195.75858.12
Lee, M. W., and Waite, W. F. (2008). Estimating pore-space gas hydrate saturations from well log acoustic data. Geochem. Geophys. Geosystems 9:Q07008.
Lei, L., Seol, Y., Choi, J. H., and Jarvis, K. (2018). Pore-Scale visualization of methane hydrate-bearing sediments with micro-CT. Geophys. Res. Lett. 104, 451–467.
Leurer, K. C. (1997). Attenuation in fine-grained marine sediments: extension of the Biot-Stoll model by the “effective grain model” (EGM). Geophysics 62, 1465–1479. doi: 10.1190/1.1444250
Lin, Z. Z., Dong, H. M., Pan, H., Sun, J. M., Fang, H., and Wang, X. J. (2019). Study on the equivalence between gas hydrate digital rocks and hydrate rock physical models. J. Petroleum Sci. Eng. 181:UNS106241.
Liu, J., Liu, J. P., Cheng, F., Wang, J., and Liu, X. X. (2017). Rock-physics models of hydrate-bearing sediments in permafrost, Qilian Mountains, China. Appl. Geophys. 14, 31–39. doi: 10.1007/s11770-017-0608-y
Liu, X. X., Yin, X. Y., and Luan, X. W. (2018). Seismic rock physical modelling for gas hydrate-bearing sediments. Sci. China-Earth Sci. 61, 1261–1278. doi: 10.1007/s11430-017-9214-2
Liu, Z. C., Ning, F. L., Hu, G. W., Liu, L. L., Liu, C. L., Peng, L., et al. (2020). Characterization of seismic wave velocity and attenuation and interpretation of tetrahydrofuran hydrate-bearing sand using resonant column testing. Mar. Petroleum Geol. 122:104620. doi: 10.1016/j.marpetgeo.2020.104620
Marín-Moreno, H., Sahoo, S. K., and Best, A. I. (2017). Theoretical modeling insights into elastic wave attenuation mechanisms in marine sediments with pore-filling methane hydrate. J. Geophys. Res. Solid Earth 122, 1835–1847.
Matsushima, J. (2006). Seismic wave attenuation in methane hydrate-bearing sediments: vertical seismic profiling data from the Nankai Trough exploratory well, offshore Tokai, central Japan. J. Geophys. Res. Solid Earth 111:B10101.
Pan, H. J., Li, H. B., Chen, J. Y., Zhang, Y., Liu, X. B., Cai, S. J., et al. (2019). Evaluation of gas hydrate resources using hydrate morphology-dependent rock physics templates. J. Petroleum Sci. Eng. 182:106268. doi: 10.1016/j.petrol.2019.106268
Priest, J. A., Best, A. I., and Clayton, C. R. I. (2005). A laboratory investigation into the seismic velocities of methane gas hydrate-bearing sand. J. Geophys. Res. Solid Earth 110:B04102.
Priest, J. A., Rees, E. V. L., and Clayton, C. R. I. (2009). Influence of gas hydrate morphology on the seismic velocities of sands. J. Geophys. Res. Solid Earth 114:B11205.
Qu, L., Zou, C. C., Lu, Z. Q., Yu, C. Q., Li, N., Zhu, J. C., et al. (2016). Elastic-wave velocity characterization of gas hydrate-bearing fractured reservoirs in a permafrost area of the Qilian Mountain, Northwest China. Mar. Petroleum Geol. 88, 1047–1058. doi: 10.1016/j.marpetgeo.2016.08.017
Rossi, G., Gei, D., Bohm, G., and Madrussani, G. (2007). Attenuation tomography: an application to gas-hydrate and free-gas detection. Geophys. Prospect. 55, 655–669. doi: 10.1111/j.1365-2478.2007.00646.x
Sahoo, S. K., North, L. J., Marín-Moreno, H., Minshull, T. A., and Best, A. I. (2019). Laboratory observations of frequency-dependent ultrasonic P-wave velocity and attenuation during methane hydrate formation in Berea sandstone. Geophys. J. Int. 219, 713–723. doi: 10.1093/gji/ggz311
Sell, K., Quintal, B., Kersten, M., and Saenger, E. H. (2018). Squirt flow due to interfacial water films in hydrate bearing sediments. Solid Earth 9, 699–711. doi: 10.5194/se-9-699-2018
Sell, K., Saenger, E. H., Falenty, A., Chaouachi, M., Haberthur, D., Enzmann, F., et al. (2016). On the path to the digital rock physics of gas hydrate-bearing sediments - processing of in situ synchrotron-tomography data. Solid Earth 7, 1243–1258. doi: 10.5194/se-7-1243-2016
Sun, W. T., Ba, J., Muller, T. M., Carcione, J. M., and Cao, H. (2015). Comparison of P-wave attenuation models of wave-induced flow. Geophys. Prospect. 63, 378–390. doi: 10.1111/1365-2478.12196
Tinivella, U., and Carcione, J. M. (2001). Estimation of gas-hydrate concentration and free-gas saturation from log and seismic data. Leading Edge 20, 200–203. doi: 10.1190/1.1438914
Tuan, N. S., Tang, A. M., To, Q. D., and Vu, M. N. (2019). A model to predict the elastic properties of gas hydrate-bearing sediments. J. Appl. Geophys. 169, 154–164. doi: 10.1016/j.jappgeo.2019.05.003
Waite, W. F., Santamarina, J. C., Cortes, D. D., Dugan, B., Espinoza, D. N., Germaine, J., et al. (2009). Physical properties of hydrate-bearing sediments. Rev. Geophys. 47:RG4003.
Zhan, L. S., and Matsushima, J. (2018). Frequency-dependent P-wave attenuation in hydrate-bearing sediments: a rock physics study at Nankai Trough, Japan. Geophys. J. Int. 214, 1961–1985. doi: 10.1093/gji/ggy229
Keywords: Biot-Rayleigh double-porosity theory, rock-physical model, effective medium theory, velocity dispersion, attenuation, gas hydrate
Citation: Wang W, Ba J, Carcione JM, Liu X and Zhang L (2021) Wave Properties of Gas-Hydrate Bearing Sediments Based on Poroelasticity. Front. Earth Sci. 9:640424. doi: 10.3389/feart.2021.640424
Received: 11 December 2020; Accepted: 06 April 2021;
Published: 29 April 2021.
Edited by:
Jack Petrovich Dvorkin, Stanford University, United StatesReviewed by:
Nicola Tisato, University of Texas at Austin, United StatesDavid Iacopini, University of Naples Federico II, Italy
Copyright © 2021 Wang, Ba, Carcione, Liu and Zhang. This is an open-access article distributed under the terms of the Creative Commons Attribution License (CC BY). The use, distribution or reproduction in other forums is permitted, provided the original author(s) and the copyright owner(s) are credited and that the original publication in this journal is cited, in accordance with accepted academic practice. No use, distribution or reproduction is permitted which does not comply with these terms.
*Correspondence: Jing Ba, amJhQGhodS5lZHUuY24=