 Changsheng Li1,2,3
 Hongwei Yin3*
 Zhenyun Wu1,2*
 Peng Zhou4Wei Wang3Rong Ren5
 Shuwei Guan5Xiangyun Li6Haoyu Luo6
 Dong Jia3
- 1State Key Laboratory of Nuclear Resources and Environment, East China University of Technology, Nanchang, China
- 2School of Earth Sciences, East China University of Technology, Nanchang, China
- 3School of Earth Sciences and Engineering, Nanjing University, Nanjing, China
- 4Resource Exploration Office, Tarim Oilfield Branch Company, PetroChina, Korla, China
- 5PetroChina Research Institute of Petroleum Exploration and Development, Beijing, China
- 6Research Institute of Petroleum Exploration and Development, Tarim Oilfield Branch Company, PetroChina, Korla, China
The salt layer is critical for the structural deformation in the salt-bearing fold-and-thrust system, which not only acts as the efficient décollement layer but also flows to form salt tectonics. Kuqa Depression has a well-preserved thin-skinned fold-and-thrust system with the salt layer as the décollement. To investigate the effects of salt thickness on the structural deformation in the Kuqa Depression, three discrete element models with different salt thicknesses were constructed. The experiment without salt was controlled by several basal décollement dominant faults, forming several imbricate sheets. The experiments with salt developed the decoupled deformation with the salt layer as the upper décollement (subsalt, intrasalt, and suprasalt), significantly similar to the Kuqa Depression along the northern margin of Tarim Basin. Basal décollement dominant imbricated thrusts formed at the subsalt units, while the monoclinal structure formed at the suprasalt units. The decoupled deformation was also observed in the tectonic deformation graphics, distortional strain fields, and max shear stress fields. However, the salt layer was thickened in the thick salt model, and the salt thickness of the thin salt model varied slightly because the thin salt weakened the flowability of the salt. The lower max shear stress zone was easily formed in the distribution region of salt under the action of compression stress, which is conducive to the flow convergence of salt and the crumpled deformation of interlayer in salt. The results are well consistent with the natural characteristics of structural deformation in the Kuqa Depression. Our modeling result concerns the structural characteristics and evolution of salt-related structures and the effects of salt thickness on the structural deformation in the compressional stress field, which might be helpful for the investigations of salt-related structures in other salt-bearing fold-and-thrust belts.
Introduction
The Kuqa Depression is a peripheral foreland basin placed at the southern piedmont of Tianshan Orogen, Northwest China (Figure 1). It develops from the Late Permian to Quaternary with strong compressional deformation since the late Cenozoic (Nishidai and Berry (1990); (Lu et al., 1994; Yin et al., 1998; Lu et al., 1999; Liu et al., 2000)). Bounded by the Kuqa River, the depression can be divided into the eastern Kuqa Depression and the western Kuqa Depression (Xin et al., 2002). From the north to south, five main structural belts are divided according to the different structural features in the western Kuqa Depression: the North structural belt (NSB), Kelasu structural belt (KLSSB), Baicheng sag (BCS), Qiulitage structural belt (QLTGSB), and the South basement slope belt (SBSB) (Figure 1) (Yin et al., 1998; Xin et al., 2002). As one of the most important hydrocarbon-bearing evaporite basins in China (Yu et al., 2014; Feng et al., 2018; Song et al., 2019), numerous salt-related structures were widely developed in the Kuqa Depression, especially in the Kelasu structural belt with obvious topographic relief features and obvious structural deformation features (Tang et al., 2004; Wu et al., 2014; Yu et al., 2014; Wu et al., 2015a; Zhao and Wang, 2016; Wang et al., 2017; Neng et al., 2018).
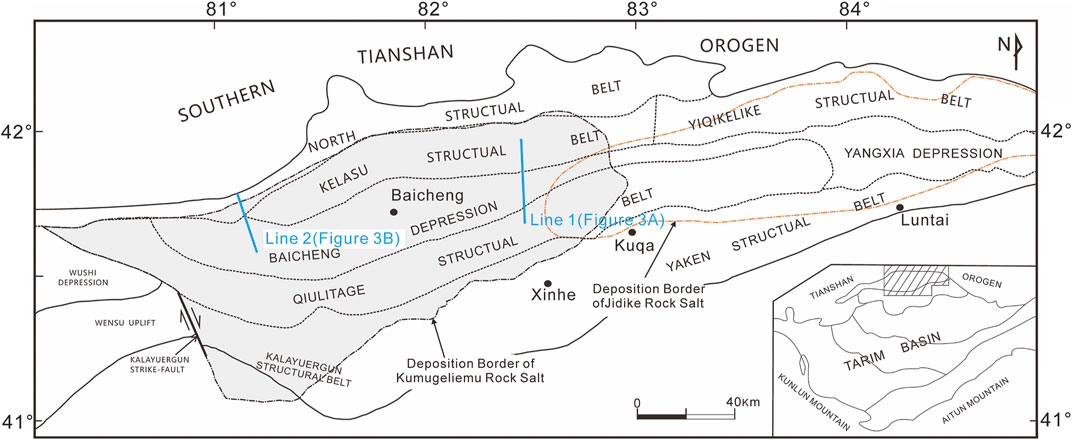
FIGURE 1. Structural units of the Kuqa Depression, Tarim Basin.
In recent years, based on structural analysis of seismic profiles with the application of several structural analysis techniques, such as the interpretation or balanced analysis of seismic profiles (Li and Qi, 2012; Neng et al., 2012; Neng et al., 2013; Yu et al., 2015; Hou et al., 2019), the area–depth–strain method (Xie et al., 2015; Wang et al., 2017), and the Coulomb wedge theory (Suppe, 2007; Lin et al., 2017), and structural simulated techniques, such as the sandbox physical simulation (Wang et al., 2010; Yin et al., 2011; Li and Qi, 2012; Xu et al., 2012; Wu et al., 2014) and numerical simulation (Wang et al., 2010; Xu et al., 2012; Li W. et al., 2017; Duan et al., 2017; Li, 2019; Li et al., 2020), further understanding has been obtained on the research of structures in the Kelasu structural belt. In many compressional salt-bearing basins around the world, the rock salt, as the important décollement layer, has been demonstrated to have important impact on regional structural evolution (Cotton and Koyi, 2000; Wu et al., 2014; Wu et al., 2015b). Meanwhile, much attention has been paid on the differential thickness distribution of Kumugeliemu salt and Jidike salt in the western and eastern Kuqa Depression (Chen et al., 2004; Tang et al., 2004; Li et al., 2012; Yu et al., 2014; Tang et al., 2015; Zhao and Wang, 2016; Wang et al., 2017). How did differential thickness distribution of these two salt layers influence the structural deformation in the western and eastern depression? It is worthy of further research to explore the influence of the differential thickness of rock salt on the structural evolution, especially from the perspective of experimental simulation.
In this study, two seismic profiles were presented to reveal the differential structural deformation caused by the difference in the thickness of the salt layers. Besides, three two-dimensional discrete element models with different salt thicknesses were constructed to investigate the characteristics of the differential structural deformation in the western Kuqa Depression. The experimental setup, the model construction technique, the material, and the wall properties were prescribed. Based on three simulation experiments, we focused on the internal relationship between the experimental results and structural deformation characteristics in the northern margin of the Kuqa area, e.g., the formation of the "accommodative space" in the salt strata and the crumpled deformation of the dolomite interbed in the Kelasu structural belt.
Geological Setting
The Kelasu structural belt is a strong structural deformation belt placed at the northern part of the western Kuqa Depression (Figure 1). The stratigraphy of the Kuqa Depression has been summarized regionally (Yin et al., 1998; Chen et al., 2004; Wang et al., 2011). Isolated by the evaporative rock salt, the stratigraphic column could be subdivided into three parts (Figure 2): (1) Palaeozoic and Mesozoic subsalt basement; (2) the Palaeocene–Eocene Kumugeliemu (E1-2km) evaporative rock salt; and (3) Eocene–Quaternary overburden which is composed of old strata to young strata by Suweiyi formation (E2-3s), Jidike formation (N1j), Kangcun formation (N1k), Kuqa formation (N2k), and Xiyu formation (Q1x). The strata E2–3s to N1k were interpreted as prekinematic strata (Figure 3A) which were deposited before salt flow began. The prekinematic strata (syn, isopachous layer) interval’s initial stratigraphic thickness is constant above a salt structure (Jackson and Talbot, 1991). These record sedimentation before salt movement. The strata N2k to the Quaternary (Q) were interpreted as synkinematic strata (Figure 3A) which accumulated during salt flow and may include internal onlap or truncation (Jackson and Talbot, 1991; Wu et al., 2014). The thickness of the synkinematic sedimentation is about 6–8 km in the western Kuqa Depression (Wang et al., 2011). According to the interpreted seismic profiles (Figure 3), the differential thickness and the vertical distribution of the salt layer were presented, i.e., the thick salt model with ca. 1,000 m salt in the western Kelasu structural belt (Wu et al., 2014) and the thin salt model with ca. 200 m salt in the eastern Kelasu structural belt (Wang et al., 2017). Several typical structural characteristics were summarized as follows based on the comprehensive comparison and analysis of typical seismic profiles.
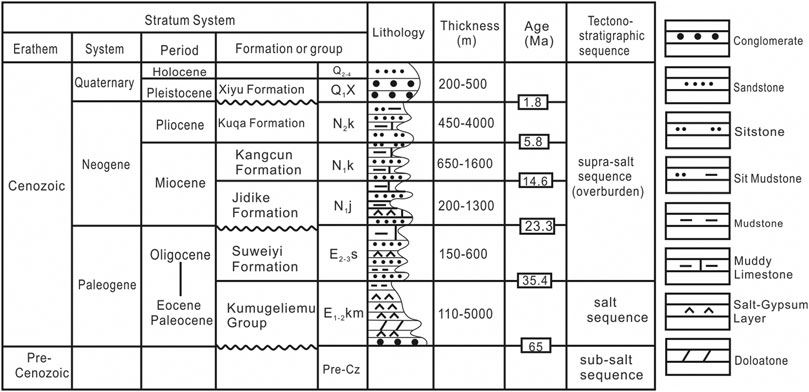
FIGURE 2. Stratigraphy of the Kuqa Foreland Basin.
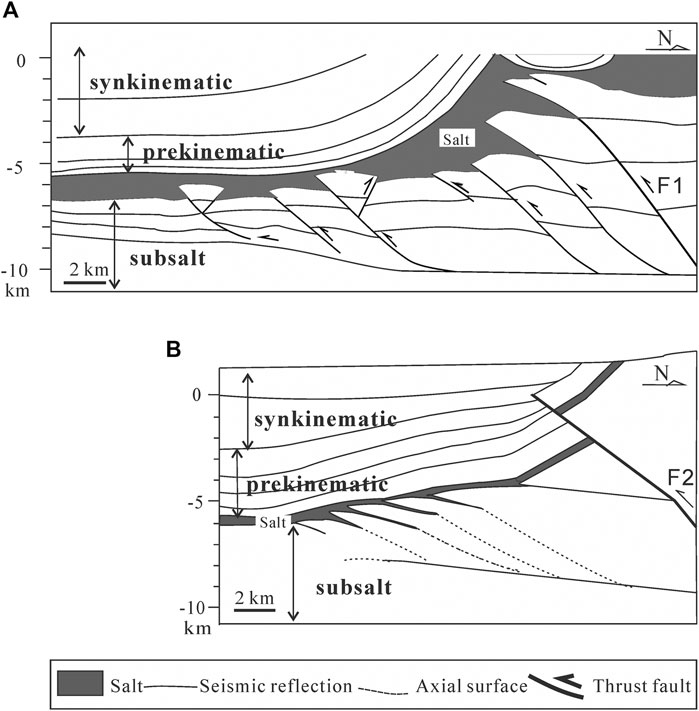
FIGURE 3. Two interpreted models of seismic profiles in the northern margin of western Kuqa Depression. (A) The thick salt model. Interpreted seismic section Line 1 (see Figure 1 for location) of the western Kelasu structure in the western Kuqa Depression; data revised from Wang et al. (2017). (B) The thin salt model. Interpreted seismic section Line 2 (see Figure 1 for location) of the eastern Kelasu structure in the western Kuqa Depression; data revised from Wu et al. (2014). The prekinematic strata (syn, isopachous layer) interval whose initial stratigraphic thickness is constant above a salt structure. It records sedimentation before salt movement. The synkinematic layer accumulated during salt flow and may include internal onlap or truncation. The subsalt strata were sedimentary units immediately underlying salt.
The Western Kelasu Structural Belt
The salt layer was thickened in the thick salt model (Figure 3A) because the flowability of the salt could be enhanced. The fault F1 (Figure 3A) pinched out on the salt layer. Two major décollement levels exist in Kuqa Depression, i.e., an upper décollement with salt–gypsum lithologies (the Paleogene–Miocene Kumgeliem and Jidike strata) and the lower décollement mostly within Jurassic coal and mudstone strata (Wang et al., 2011). Imbricate thrust faults and duplex structures linking the two décollements developed with salt that flowed into the cores of the duplex structure (F1, Figure 3A). The differences in the geometries of salt structures in different regions show that the thickness of the salt sequences has an important influence on the development of salt-cored décollement folds and related thrust faults in the Tarim Basin (Wu et al., 2014).
The Eastern Kelasu Structural Belt
The fault F2 (Figure 3B) in the piedmont thrust fold belt of the Kuqa Depression directly cuts through all the layers and nappes to the shallow strata from the deep of orogenic belts. The thin salt between the salt substratum and the slat superstratum shows no obvious rheological properties, so the salt thickness shows little variation (Figure 3B).
Experimental Method and Model Setup
The discrete element method (DEM) has been applied to the study of geological and geophysical problems in recent decades (Hardy et al., 2009; Yin et al., 2009; Liu et al., 2015; Morgan, 2015; Botter et al., 2016; Buiter et al., 2016; Morgan and Bangs, 2017; Li, 2019; Li et al., 2020; Xu et al., 2021). A full, detailed description of the theory behind this modeling approach and its application to geological problems is given by Morgan (2015) and Li C. et al. (2017, 2018, 2021), Li (2019). A geological body is simplified into an assemblage of ball elements which obey Newton’s equations of motion and can move under the action of the forces which are generated by interaction with pairs by elastic springs. Our implementation of DEM in the discrete element software ZDEM was summarized by Li (2019).
Three experiments presented here were all initialized by randomly generating particles within a 40 km wide × 14 km–tall domain. Particles were allowed to settle under gravity, bound by two vertical walls and a basal row of fixed particles. The resulting particle assembly was 40 km wide and 5 km thick, and values were chosen to allow typical sedimentary covers to be modeled, large absolute values of convergence to be achieved, and model boundaries to be far from the locus of deformation (Figure 4). The particle packing consisted of 12,234 particles, with uniform distribution radii of 60.0 and 80.0 m. To examine the influence of salt thickness on the structural deformation, three experiments were carried out on initially identical homogeneous packings and boundary and initial conditions and dimensions but using different sets of the salt thickness (Figure 4). As a reference experiment, there is no salt layer in Exp. 1. The salt thickness of Exp. 2 was set to ca. 300 m tall, and the salt thickness of Exp. 3 was set to ca. 1,000 m tall.
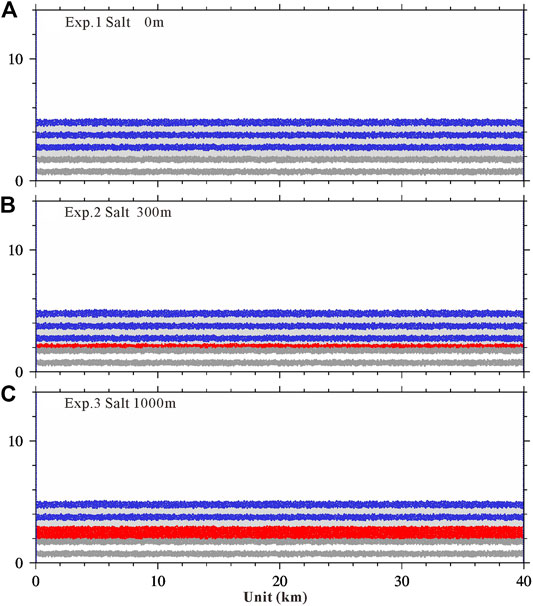
FIGURE 4. Initial models. (A) Reference experiment without salt. (B) Experiment with thin salt (ca. 300 m tall). (C) Experiment with thick salt (ca. 1,000 m tall). White and gray denote the subsalt stratum. Red denotes the salt layer. Blue and gray denote the prekinematic layer.
The particle properties of experiments are presented in Table 1. Upon settling, bonds of assigned strengths (Table 2) were introduced at all interparticle contacts, except salt layers. Interparticle friction was set to 0.3 throughout the bonded domain (i.e., rock layer). There are two major décollement levels existing in the Kuqa Depression, i.e., an upper décollement in the salt layer and the lower décollement mostly within Jurassic coal and mudstone strata (Wang et al., 2011). As the low décollement, the interparticle friction of the foot wall was set to 0.15. As the upper décollement, the interparticle friction of the salt layers was set to 0.0 to ensure its lower strength.
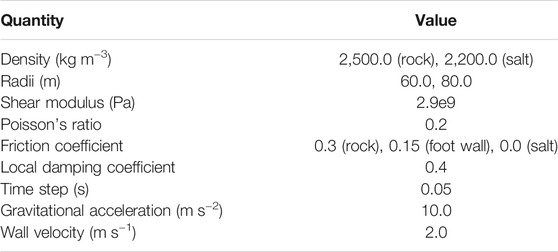
TABLE 1. Particle properties and basic parameters for DEM simulation.
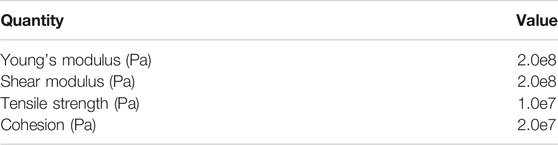
TABLE 2. Interparticle bond properties of rock layers for DEM simulation.
The bulk mechanical properties of the numerical materials used in these experiments were prescribed by particle properties and bond parameters in Tables 1 and 2. These parameters in Tables 1 and 2 were consistent with previous studies (Morgan, 2015; Li, 2019). They were calibrated through a series of repose angles and two-dimensional biaxial tests based on the method presented by Li, (2019; 2021) and Morgan (2015). In numerical simulations, a local damping coefficient, which was the one most commonly used (Potyondy and Cundall, 2004; Itasca Consulting Group 2008; Kozicki and Donzé, 2008; O'Sullivan, 2011; Scholtès and Donzé, 2013; Weatherley et al., 2014; Zhao, 2015; Li, 2019; Xu et al., 2021), was added to damp the reflected waves from the boundary of the particle and to avoid buildup of kinetic energy in the closed system (Itasca Consulting Group 2008; Li, 2019). The meaning of the other parameters in Tables 1 and 2 was given by Morgan (2015) and Li (2019). The value of cohesion of rock layer and salt layer is, respectively, ca. 10.5 MPa and ca. 1.8 MPa (Li, 2019). The values of friction angles of rock layer and salt layer are ca. 18.6° and ca. 4.3°, respectively (Li, 2019). The value of cohesion is consistent with the strength of shallow crustal sediments (Camac et al., 2009; Jaeger et al., 2009; Schumann et al., 2014). Note that the values of friction angle are significantly lower than the typical value of friction angle, 30° (Jaeger et al., 2009; Wu et al., 2014), which is a common characteristic of these numerical materials (Morgan, 1999; Aharonov and Sparks, 2004; Morgan, 2004; Vidal and Bonneville, 2004; Dean et al., 2013; Gray et al., 2014; Morgan, 2015; Li, 2019), and consistent with shear experiments on smooth glass rods (Frye and Marone, 2002; Sun et al., 2016; Li, 2019).
The horizontal contraction was initiated by capturing particles along the right sidewall and applying a constant velocity of 2.0 m/s to the left. The time step per cycle was 0.05 s, producing 0.1 m of wall displacement per cycle. The synkinematic sedimentation played an important role in structural deformation in Kuqa Depression (Yin et al., 2011; Wu et al., 2014). After the first thrust was formed (ca. 2 km of shortening), ca. 0.5 km-thick synkinematic layer was deposited for every 1 km of shortening. The final thickness of the synkinematic layer was ca. 5 km.
Experiment Results
Distribution Deformation
Comparative plots of the final particle configurations (12 km wall displacement) of the three experiments with different salt thicknesses are shown in Figure 5. Three experiments have the same initial model but use different sets of salt thickness. As the reference experiment, Exp. 1 is without salt (Figure 5A). The salt thickness is ca. 300 m in Exp. 2 with thin salt (Figure 5B), while salt thickness is ca. 1,000 m in Exp. 3 with thick salt (Figure 5C).
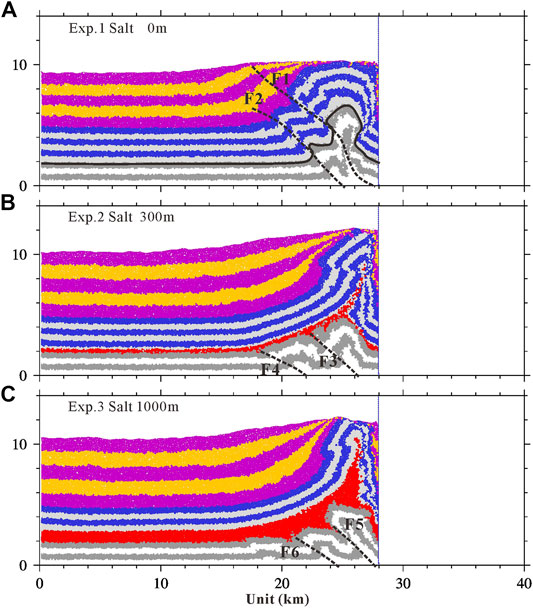
FIGURE 5. Final deformations of three shortening experiments with different salt thicknesses after 12 km of shortening. (A) Reference experiment. (B) Experiment with thin salt (ca. 300 m). (C) Experiment with thick salt (ca. 1,000 m). White and gray denote the subsalt layer. Red denotes the salt layer. Blue and gray denote the prekinematic layer. Violet and yellow denote the synkinematic layer. Bonds of assigned strengths (Table 2) were introduced at all interparticle contacts, except the synkinematic layer (violet and yellow) and salt layer (red). Dashed lines denote faults. The figures of each step are included in the Supplementary Material.
Two faults form in Exp. 1 without salt layer, and the growth strata show the features of fault-propagation fold in accordance with the fault activity (Figure 5A). But, the deformation was apparently divided into two parts in Exp. 2 (ca. 300 m salt, Figure 5B) and Exp. 3 (ca. 1,000 m salt, Figure 5C) containing the salt layer. Deformation above and below the salt layer was decoupled, with the imbricate structure formed in the subsalt units and back-thrust fault formed in suprasalt units.
In Figure 3B, continuous progradation from the southern Tianshan piedmont until the end of the late Miocene–early Pliocene made Kumugeliemu salt flow basinward and F2 developed (Li et al., 2012). Accelerated crustal shortening since the end of the late Pliocene–early Pleistocene amplified the Misikantake anticline and formed the Quele salt nappe, and several new forward subsalt structures developed and they do not extend to the surface (Li et al., 2012). Previous studies have shown that frictional resistance increases with salt pinch-out (Dooley et al., 2007) and buttressing effects of a distal salt pinch-out can control the location and style of distal salt structures (Costa and Vendeville, 2002; Couzens-Schultz et al., 2003; Dooley et al., 2007). Faults can easily cut through rock layers without salt layers (Figure 5A), but they rarely cut the thick salt layers; instead, they detach along with the salt layers (Figure 3A, 5C).
Distortional Strain
The distortional strain was used to quantify the results for DEM and was calculated according to the study by Morgan (2015). Distortional strain, i.e., strain-induced distortion, can be quantified as the second invariant of the deviatoric finite strain tensor (Morgan, 2015). Throughout the experiments, particle positions and interparticle forces were output every 10,000 cycles (1 km wall displacement), an interval referred to as an “increment.” Subsequent calculations of particle displacements are made at whole increments, and this unit is used for plotting purposes.
The results of the three experiments are shown in Figure 6 with plots of cumulative distortional strain after 12 km (the shortening rate 20%) of shortening. The experiments were accommodated by largely distributed shear deformation with occasional local zones of more intense top-to-the-left shearing (Figure 6, blue zones). Dip angles of the forward thrust (Figure 6, blue zones) were ca. 45° in all three experiments. They were in the same range as the dip angles (ca. 30°–50°, Figures 3A,B) of the forward thrust in the subsalt units.
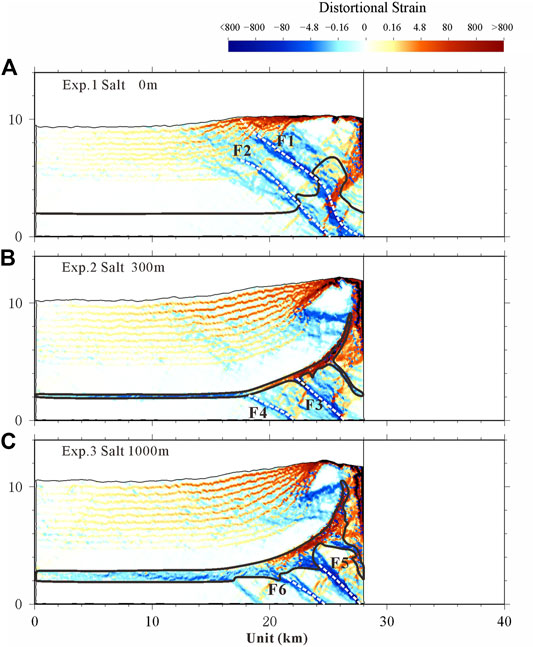
FIGURE 6. Distortional strain illustrated after 12 km of shortening. (A) Reference experiment. (B) Experiment with thin salt (ca. 300 m). (C) Experiment with thick salt (ca. 1,000 m). Shear strain magnitude is shown by color intensity. Red denotes the top-to-the-right sense of shear; blue denotes the top-to-the-left sense of shear. Dashed lines denote faults. The areas that are trapped by the black solid line denote the salt. The figures of distortional strain for each step are included in the Supplementary Material.
As shown in Figure 6B,C, F3–F6 did not cut through the salt layer; instead, they detached along with the salt layer because of the flow of salt that contributes significantly to structural relief in this part of the Kuqa fold-and-thrust belt. On the contrary, F1 and F2 (Figure 6A) could easily cut through the rock layer. The salt layer was obviously thickened near the right wall when the initial thickness of salt was ca. 1,000 m (Figure 6C). The thickness of salt had a little change when the initial thickness of salt was ca. 300 m (Figure 6B) because the flowability of thin salt is weaker. The salt could be one of the main factors leading to differential tectonics. The contour map of distortional strain (Figures 6A–C) shows local strain concentration around the fault, indicating that faulting played an important role in the fracture development in the damage zone surrounding the fault. This mechanism explained the higher density of shear fractures that developed in the near-fault area and the salt layers.
Max Shear Stress
Stress invariants for all of the systems are calculated and plotted for 1 × 1 km elements (summing over ca. 25 particles), with colors scaled by stress magnitude. The final structure of each series (Figure 7) is superimposed by plotting regions of high distortional strain (i.e., the absolute value is greater than 4.8 in Figure 6) in black. Similar to the simulation results of Morgan (2015), there is a distinct variability within the wedges about the maximum shear stress, τmax (Figures 7A–C). τmax increased with depth due to the combined increase in both vertical and horizontal stresses with burial (Morgan, 2015). Moreover, τmax was relatively high near the moving wall and in the foot walls of major shear zones. The highest values of τmax usually appeared directly in front of the frontal thrusts, outlining regions of unfaulted material that still supported high shear stresses (Morgan, 2015). The frontal regions of high τmax expanded with decreasing salt thickness (Figure 7), demonstrating the flowability of salt layers to dissipate shear stresses. The stress also had obvious stratification characteristics in the experiments with the salt layer.
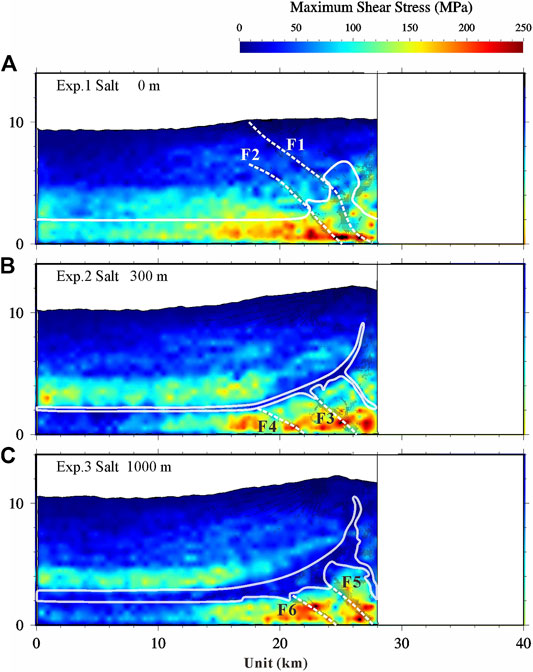
FIGURE 7. Max shear stress illustrated after 12 km of shortening. (A) Reference experiment. (B) Experiment with thin salt (ca. 300 m). (C) Experiment with thick salt (ca. 1,000 m). The final structure of each series is superimposed by plotting regions of high distortional strain (i.e., the absolute value is greater than 4.8 in Figure 6) in black. Dashed lines denote faults. The areas that are trapped by the white solid line denote the salt. The figures of max shear stress for each step are included in the Supplementary Material.
Discussion
Both the regional geological structure analysis and the structural simulation experiments show that if there is a regional distribution of salt rock as an important décollement layer in the fold orogenic belt and its foreland basin, the strata will undergo obvious structural stratification deformation in the vertical direction (Figures 5, 6) (Wang et al., 2010; Yin et al., 2011; Xu et al., 2012; Wu et al., 2014; Yang, 2017; Neng et al., 2018; Li, 2019; Li et al., 2020; Sun et al., 2021; Xu et al., 2021). The results of these experiments well reflect the regional structural characteristics of the northern margin of the western Kuqa Depression (Figure 8). In the northern margin of the western section of Kuqa Depression, the basement involved thrust faults into the salt with a large displacement. When the salt is thick, the thrust fault will make the overlying salt significantly thicken and create favorable "accommodative space," which is conducive to the formation of the salt anticline and salt diapir (Figure 3A, 8A). When the salt is thin, it is easy to cut through by faults, which is not conducive to the formation of favorable "accommodative space" (Figure 3B, 8B).
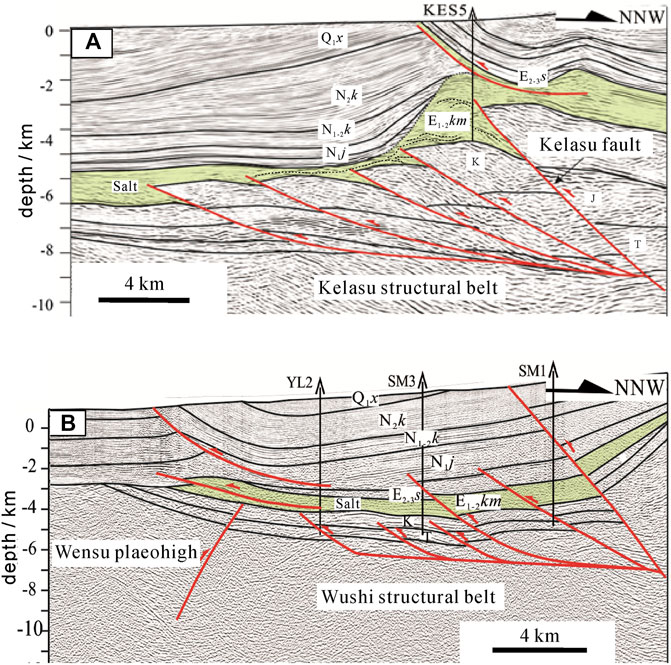
FIGURE 8. Structural deformation characteristics caused by the differential thickness of the salt layer in (A) the Kelasu structural belt and (B) the Wushi structural belt; seismic profiles cited from Yang (2017).
The results of the three simulations also show that a lower max shear stress zone is easily formed in the distribution region of salt under the action of compression stress, which is conducive to the flow convergence of salt and the crumpled deformation of interlayer in salt (Figures 7, 9). When the thickness of salt decreases, the fluidity of salt decreases obviously which is not conducive to salt convergence to form salt-related structures (Figure 8B). While the salt is thick enough, its fluidity is obviously enhanced which is conducive to the flow and convergence of salt from the high-stress area to the low-stress area and forms larger salt structures, such as salt anticline or salt diapir structures (Figure 8A)
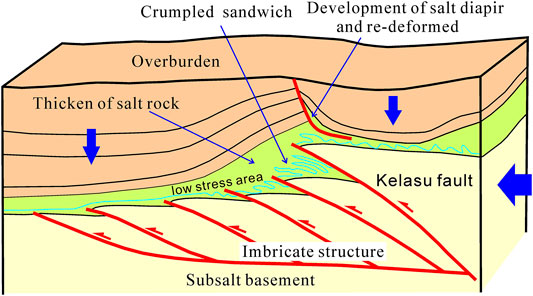
FIGURE 9. Deformation model of the dolomite interbeds in the Kelasu structural belt; the crumpled data from Yang (2017).
There are a fewer imbricate faults of the subsalt units in three discrete element simulations (Figure 5C) than in the interpreted seismic sections of the Kelasu structure in the Kuqa Depression (Figure 3A, 8A). The displacement of shortening, the slope, and the thickness of substrate décollement may control the distribution range and the number of imbricate faults in the subsalt units. We would make further analysis in the later study.
Conclusion
Effects of salt thickness on the structural deformation were discussed using different seismic profiles in the foreland fold-and-thrust belt of the Kuqa Depression, which indicated that the thickness of the salt had an important influence on the structural styles.
The experiment without salt was controlled by several basal décollement dominant faults, forming several imbricate sheets. The experiments with salt developed the decoupled deformation with the salt layer as the upper décollement (subsalt, intrasalt, and suprasalt), significantly similar to the Kuqa Depression in the northern margin of Tarim Basin. Basal décollement dominant imbricated thrusts formed at the subsalt units, while the monoclinal structure formed at the suprasalt units. The decoupled deformation was also observed in the tectonic deformation graphics, distortional strain fields, and max shear stress fields. However, the salt layer was thickened in the thick salt model and the salt thickness of the thin salt model varied slightly because the thin salt weakened the flowability of the salt evidently. The lower max shear stress zone was easily formed in the distribution region of salt under the action of compression stress, which is conducive to the flow convergence of salt and the crumpled deformation of interlayer in salt. These phenomena are well consistent with the natural characteristic of structural deformation in the Kuqa Depression, Tarim Basin.
The modeling results in this study concern the structural characteristics and evolution of salt-related structures and the effects of salt thickness on the structural deformation in the compressional stress field, which might be helpful for the investigations of salt-related structures in other salt-bearing fold-and-thrust belts.
Data Availability Statement
The original contributions presented in the study are included in the article/Supplementary Material; further inquiries can be directed to the corresponding author.
Author Contributions
Conceptualization: CL and HY; methodology: CL, HY, and ZW; formal analysis and investigation: CL, HY, ZW, PZ, and WW; writing—original draft preparation: CL and ZW; writing—review and editing: HY, ZW, DJ, SG, RR, XL, and HL; funding acquisition: HY, CL, ZW, DJ, SG, and RR.
Funding
The authors gratefully acknowledge the financial support provided by the National Natural Science Foundation of China (grants 41972219, 41927802, 41572187, and 41602208), National S&T Major Project of China (grants 2016ZX05026-002-007, 2016ZX05003-001, and 2016ZX005008-001-005), the PhD Starting Foundation of East China University of Technology (grants DHBK2019024 and DHBK2019053), and Project of PetroChina Company Limited (grant 2018A-0101). CL was also supported by program B for being an outstanding PhD candidate of Nanjing University.
Publisher’s Note
All claims expressed in this article are solely those of the authors and do not necessarily represent those of their affiliated organizations, or those of the publisher, the editors, and the reviewers. Any product that may be evaluated in this article, or claim that may be made by its manufacturer, is not guaranteed or endorsed by the publisher.
Conflict of Interest
The authors PZ, SG, RR, XL, and HL were employed by the PetroChina Company Limited (PetroChina).
The remaining authors declare that the research was conducted in the absence of any commercial or financial relationships that could be construed as a potential conflict of interest.
Acknowledgments
The authors would like to thank Julia K. Morgan and Thomas Fournier for generously sharing their postprocessing scripts and algorithms, which have been used to process and display the model outputs presented here. HY would like to thank Prof. Morgan for generously sharing her discrete element code RICEBAL (v. 5.1, modified from Peter Cundall’s TRUBAL v. 1.51) and Rice University for hosting his collaborative visit in 2009, providing him with the opportunity to further develop his knowledge of DEM and geomechanics principles and learn the capabilities of these methods. The authors also would like to thank Wenqiao XU for the fruitful discussions on this manuscript. The authors are grateful for thoughtful reviews by two reviewers, which resulted in significant improvements in this paper. The authors acknowledge Beijing PARATERA Tech CO., Ltd. (https://paratera.com) for providing HPC resources that have contributed to the research results reported within this paper. Data used in this paper and the discrete element software ZDEM will be available online at https://geovbox.com, and more examples are given on this website. Modeling results and information can be obtained by contacting CL at bGljaGFuZ3NoZW5nQGVjdXQuZWR1LmNu.
Supplementary Material
The Supplementary Material for this article can be found online at: https://www.frontiersin.org/articles/10.3389/feart.2021.655173/full#supplementary-material
References
Aharonov, E., and Sparks, D. (2004). Stick-slip Motion in Simulated Granular Layers. J. Geophys. Res. 109, a–n. doi:10.1029/2003JB002597
Botter, C., Cardozo, N., Hardy, S., Lecomte, I., Paton, G., and Escalona, A. (2016). Seismic Characterisation of Fault Damage in 3D Using Mechanical and Seismic Modelling. Mar. Pet. Geology. 77, 973–990. doi:10.1016/j.marpetgeo.2016.08.002
Buiter, S. J. H., Schreurs, G., Albertz, M., Gerya, T. V., Kaus, B., Landry, W., et al. (2016). Benchmarking Numerical Models of Brittle Thrust Wedges. J. Struct. Geology. 92, 140–177. doi:10.1016/j.jsg.2016.03.003
Camac, B. A., Hunt, S. P., and Boult, P. J. (2009). Predicting Brittle Cap-Seal Failure of Petroleum Traps: an Application of 2D and 3D Distinct Element Method. Pet. Geosci. 15, 75–89. doi:10.1144/1354-079309-796
Chen, S., Tang, L., Jin, Z., Jia, C., and Pi, X. (2004). Thrust and Fold Tectonics and the Role of Evaporites in Deformation in the Western Kuqa Foreland of Tarim Basin, Northwest China. Mar. Pet. Geology. 21, 1027–1042. doi:10.1016/j.marpetgeo.2004.01.008
Costa, E., and Vendeville, B. C. (2002). Experimental Insights on the Geometry and Kinematics of Fold-And-Thrust Belts above Weak, Viscous Evaporitic Décollement. J. Struct. Geology. 24, 1729–1739. doi:10.1016/S0191-8141(01)00169-9
Cotton, J. T., and Koyi, H. A. (2000). Modeling of Thrust Fronts above Ductile and Frictional Detachments: Application to Structures in the Salt Range and Potwar Plateau, Pakistan. Geol. Soc. America Bull. 112, 351–363. doi:10.1130/0016-7606(2000)112%3C351:MOTFAD%3E2.0.CO;2
Couzens-Schultz, B. A., Vendeville, B. C., and Wiltschko, D. V. (2003). Duplex Style and triangle Zone Formation: Insights from Physical Modeling. J. Struct. Geology. 25, 1623–1644. doi:10.1016/S0191-8141(03)00004-X
Dean, S. L., Morgan, J. K., and Fournier, T. (2013). Geometries of Frontal Fold and Thrust Belts: Insights from Discrete Element Simulations. J. Struct. Geology. 53, 43–53. doi:10.1016/j.jsg.2013.05.008
Dooley, T. P., Jackson, M. P. A., and Hudec, M. R. (2007). Initiation and Growth of Salt-Based Thrust Belts on Passive Margins: Results from Physical Models. Basin Res. 19, 165–177. doi:10.1111/j.1365-2117.2007.00317.x
Duan, Y., Shaoying, H., Li, W., Zhang, H., Ma, X., and Liao, F. (2017). Using Discrete Element Numerical Simulation Method to Study Salt Tectonic Deformation Mechanism of Kelasu Structural Belt. Xinjiang Pet. Geology. 38, 1. 2017. (in Chinese with English abstract). doi:10.7657/XJPG20170406
Feng, J., Dai, J., Lu, J., and Li, X. (2018). Quantitative Prediction of 3-D Multiple Parameters of Tectonic Fractures in Tight sandstone Reservoirs Based on Geomechanical Method. IEEE Access 6, 39096–39116. doi:10.1109/ACCESS.2018.2847723
Frye, K. M., and Marone, C. (2002). The Effect of Particle Dimensionality on Granular Friction in Laboratory Shear Zones. Geophys. Res. Lett. 29, 22-1–22-4. doi:10.1029/2002GL015709
Gray, G. G., Morgan, J. K., and Sanz, P. F. (2014). Overview of Continuum and Particle Dynamics Methods for Mechanical Modeling of Contractional Geologic Structures. J. Struct. Geology. 59, 19–36. doi:10.1016/j.jsg.2013.11.009
Hardy, S., McClay, K., and Anton Muñoz, J. (2009). Deformation and Fault Activity in Space and Time in High-Resolution Numerical Models of Doubly Vergent Thrust Wedges. Mar. Pet. Geology. 26, 232–248. doi:10.1016/j.marpetgeo.2007.12.003
Hou, G., Sun, S., Zheng, C., Tang, Y., Zhou, L., and Mo, T. (2019). Subsalt Structural Styles of Keshen Section in the Kelasu Tectonic Belt. Xinjiang Pet. Geology. 40, 21. (in Chinese with English abstract). doi:10.7657/XJPG20190103
Itasca Consulting Group (2008). PFC2D (Particle Flow Code in 2 Dimensions) Online Manual. Version 4.0. Minnesota: Itasca Consulting Group Inc.
Jackson, M., and Talbot, C. J. (1991). A Glossary of Salt Tectonics Geological Circular. Austin, TX, USA: The University of Texas at AustinBureau of Economic Geology, 1–44.
Jaeger, J. C., Cook, N. G., and Zimmerman, R. (2009). Fundamentals of Rock Mechanics. John Wiley & Sons. doi:10.1007/978-3-540-92128-8
Kozicki, J., and Donzé, F. V. (2008). A New Open-Source Software Developed for Numerical Simulations Using Discrete Modeling Methods. Comput. Methods Appl. Mech. Eng. 197, 4429–4443. doi:10.1016/j.cma.2008.05.023
Li, C. (2019). Quantitative Analysis and Simulation of Structural Deformation in the Fold and Thrust belt Based on Discrete Element Method. Doctor Thesis. Nanjing, China: NanJing University. (in Chinese with English abstract).
Li, C., Yin, H., Jia, D., Zhang, J., Wang, W., and Xu, S. (2018). Validation Tests for Discrete Element Codes Using Single-Contact Systems. Int. J. Geomechanics 18, 06018011. doi:10.1061/(ASCE)GM.1943-5622.0001133
Li, C., Yin, H., Liu, C., and Cai, S. (2017a). Design and Test of Parallel Discrete Element Method Program of Shared Memory Type. J. Nanjing University(Natural Science) 53, 1161–1170 (in Chinese with English abstract). doi:10.13232/j.cnki.jnju.2017.06.018
Li, C., Yin, H., Wu, C., Zhang, Y., Zhang, J., Wu, Z., et al. (2021). Calibration of the Discrete Element Method and Modeling of Shortening Experiments. Front. Earth Sci. 9, 636512. doi:10.3389/feart.2021.636512
Li, J., Zhang, Y., Wang, H., and Wang, D. (2020). Three-dimensional Discrete Element Numerical Simulation of Paleogene Salt Structures in the Western Kuqa Foreland Thrust belt. Pet. Exploration Develop. 47, 68–79. doi:10.1016/S1876-3804(20)60006-4
Li, S., Wang, X., and Suppe, J. (2012). Compressional Salt Tectonics and Synkinematic Strata of the Western Kuqa Foreland basin, Southern Tian Shan, China. Basin Res. 24, 475–497. doi:10.1111/j.1365-2117.2011.00531.x
Li, W., Li, J., Wang, H., Huang, S., and Neng, Y. (2017b). Deformation Mechanisms of Kelasu Tectonic belt in Kuqa Foreland Thrust belt: Insight from Discrete Element Numerical Simulation. Geotectonica et Metallogenia 41, 1001–1010. (in Chinese with English abstract). doi:10.16539/j.ddgzyckx.2017.06.001
Li, Y., and Qi, J. (2012). Delamination Contractional Deformation and it Main Controlled Factors of Kelasu Structural Zone in Kuqa Depression. Chin. J. Geology. (Scientia Geologica Sinica). (in Chinese with English abstract).
Lin, C., Yin, H., Wang, W., Li, C., Neng, Y., Zhou, P., et al. (2017). Application of the Critical Taper Model in the Subsalt Structural Wedges—Example from Kelasu Structure belt of Kuqa Depression. Geol. J. China Universities 23, 491–498. (in Chinese with English abstract). doi:10.16108/j.issn1006-7493.2016209
Liu, C., Pollard, D. D., Gu, K., and Shi, B. (2015). Mechanism of Formation of Wiggly Compaction Bands in Porous sandstone: 2. Numerical Simulation Using Discrete Element Method. J. Geophys. Res. Solid Earth 120, 8153–8168. doi:10.1002/2015JB012374
Liu, Z. H., Lu, H., Li, X., Jia, C. Z., Lei, G., Chen, C. M., et al. (2000). Tectonic Evolution of Kuqa Rejuvenated Foreland basin. Scientia Geologica Sinica 35, 482–492. (in Chinese with English abstract).
Lu, H., Howell, D. G., Jia, D., Cai, D., Wu, S., Chen, C., et al. (1994). Rejuvenation of the Kuqa Foreland basin, Northern Flank of the Tarim basin, Northwest China. Int. Geology. Rev. 36, 1151–1158. doi:10.1080/00206819409465509
Lu, H., Jia, D., Chen, C., Liu, Z., Wang, G., and Jia, C. (1999). Nature and Timing of the Kuqa Cenozoic Structures. Earth Sci. Front. 6, 215–221. (in Chinese with English abstract).
Morgan, J. K., and Bangs, N. L. (2017). Recognizing Seamount-Forearc Collisions at Accretionary Margins: Insights from Discrete Numerical Simulations. Geology 45, 635–638. doi:10.1130/G38923.1
Morgan, J. K. (2015). Effects of Cohesion on the Structural and Mechanical Evolution of Fold and Thrust Belts and Contractional Wedges: Discrete Element Simulations. J. Geophys. Res. Solid Earth 120, 3870–3896. doi:10.1002/2014JB011455
Morgan, J. K. (1999). Numerical Simulations of Granular Shear Zones Using the Distinct Element Method: 2. Effects of Particle Size Distribution and Interparticle Friction on Mechanical Behavior. J. Geophys. Res. 104, 2721–2732. doi:10.1029/1998jb900055
Morgan, J. K. (2004). Particle Dynamics Simulations of Rate- and State-dependent Frictional Sliding of Granular Fault Gouge. Comput. Earthquake Sci. 161, 1877–1891. doi:10.1007/978-3-0348-7873-9_5
Neng, Y., Sun, H., Xu, L., and Cao, S. (2013). Research on Structural Transfer Based on 3D Seismic Data----A Case Study from KL1 and KL2 Structures of Foreland Thrust Belt, Kuqa Depression. China Pet. Exploration 18, 12. doi:10.3969/j.issn.1672-7703.2013.03.002
Neng, Y., Xie, H., Li, Y., Lei, G., and Yang, X. (2012). The character of deformation style and its distribution law in the middle Part of Kuqa depression, northern margin of Tarim Basin, NW China. Dizhi Kexue/Chin. J. Geology. 47, 629–639. (in Chinese with English abstract).
Neng, Y., Xie, H., Yin, H., Li, Y., and Wang, W. (2018). Effect of basement structure and salt tectonics on deformation styles along strike: An example from the Kuqa fold-thrust belt, West China. Tectonophysics 730, 114–131. doi:10.1016/j.tecto.2018.02.006
Nishidai, T., and Berry, J. L. (1990). Structure and hydrocarbon potential of the Tarim Basin (NW China) from satellite imagery. J. Pet. Geol 13, 35–58. doi:10.1111/j.1747-5457.1990.tb00250.x
O'Sullivan, C. (2011). Particulate Discrete Element Modelling. Taylor & Francis. doi:10.1201/9781482266498
Potyondy, D. O., and Cundall, P. A. (2004). A bonded-particle model for rock. Int. J. Rock Mech. Mining Sci. 41, 1329–1364. doi:10.1016/j.ijrmms.2004.09.011
Scholtès, L., and Donzé, F.-V. (2013). A DEM model for soft and hard rocks: Role of grain interlocking on strength. J. Mech. Phys. Sol. 61, 352–369. doi:10.1016/j.jmps.2012.10.005
Schumann, K., Behrmann, J. H., Stipp, M., Yamamoto, Y., Kitamura, Y., and Lempp, C. (2014). Geotechnical behavior of mudstones from the Shimanto and Boso accretionary complexes, and implications for the Nankai accretionary prism. Earth, Planets and Space 66, 129. doi:10.1186/1880-5981-66-129
Song, X., Lü, X., Shen, Y., and Guo, S. (2019). Hydrocarbon migration and accumulation history in deep reservoirs: a case study of Mesozoic sandstone gas reservoirs in the Kelasu-Yiqikelike structural belt of the Kuqa Depression, Tarim Basin. Geosci. J. 23, 69–86. doi:10.1007/s12303-018-0011-6
Sun, C., Jia, D., Yin, H., Chen, Z., Li, Z., Shen, L., et al. (2016). Sandbox modeling of evolving thrust wedges with different preexisting topographic relief: Implications for the Longmen Shan thrust belt, eastern Tibet. J. Geophys. Res. Solid Earth 121, 4591–4614. doi:10.1002/2016JB013013
Sun, C., Li, Z., Wu, S., He, Z., Zhao, S., and Wang, P. (2021). Structural Significance of the Mid-level Décollement Within the Western Sichuan Fold-And-Thrust Belt (WSFTB), Insights From Sandbox Modeling. Front. Earth Sci. 9, 109. doi:10.3389/feart.2021.631405
Suppe, J. (2007). Absolute fault and crustal strength from wedge tapers. Geol 35, 1127–1130. doi:10.1130/G24053A.1
Tang, L.-J., Jia, C.-Z., Jin, Z.-J., Chen, S.-P., Pi, X.-J., and Xie, H.-W. (2004). Salt tectonic evolution and hydrocarbon accumulation of Kuqa foreland fold belt, Tarim Basin, NW China. J. Pet. Sci. Eng. 41, 97–108. doi:10.1016/S0920-4105(03)00146-3
Tang, P., Rao, G., Li, S., and Wang, R. (2015). The impact of salt layer thickness on the structural characteristics and evolution of detachment folds in the leading edge of Kuqa fold and thrust belt. Earth Sci. Front. 22, 312–327. doi:10.13745/j.esf.2015.01.027
Vidal, V., and Bonneville, A. (2004). Variations of the Hawaiian hot spot activity revealed by variations in the magma production rate. J. Geophys. Res. 109. doi:10.1029/2003JB002559
Wang, W., Yin, H., Jia, D., and Li, C. (2017). A sub-salt structural model of the Kelasu structure in the Kuqa foreland basin, northwest China. Mar. Pet. Geology. 88, 115–126. doi:10.1016/j.marpetgeo.2017.08.008
Wang, X., Suppe, J., Guan, S., Hubert-Ferrari, A., Gonzalez-Mieres, R., and Jia, C. (2011). “Cenozoic structure and tectonic evolution of the Kuqa fold belt, southern Tianshan, China,” in Thrust Fault-Related Folding: AAPG Memoir 94. Editors K. McClay, J. H. Shaw, and J. Suppe, 215–243. doi:10.1306/13251339M94389
Wang, X., Wang, Z., Xie, H., Li, S., Tang, P., Yin, H., et al. (2010). Cenozoic salt tectonics and physical models in the Kuqa depression of Tarim Basin, China. Sci. China Earth Sci. 40, 1655–1668. (in Chinese with English abstract).
Weatherley, D., Hancock, W., Abe, S., and Boros, V. (2014). ESyS-Particle Tutorial and User's Guide Brisbane, Queensland, Australia. Version 2.3.1
Wu, Z., Yin, H., Wang, X., and Xu, S. (2015a). The Structural features and formation mechanism of exposed salt diapirs in the front of fold-thrust belt, western Kuqa Depression. J. Nanjing Univ. (Natural Sciences) 51, 612–625. (in Chinese with English abstract). doi:10.13232/j.cnki.jnju.2015.03.018
Wu, Z., Yin, H., Wang, X., Zhao, B., and Jia, D. (2014). Characteristics and deformation mechanism of salt-related structures in the western Kuqa depression, Tarim basin: Insights from scaled sandbox modeling. Tectonophysics 612-613, 81–96. doi:10.1016/j.tecto.2013.11.040
Wu, Z., Yin, H., Wang, X., Zhao, B., Zheng, J., Wang, X., et al. (2015b). The structural styles and formation mechanism of salt structures in the Southern Precaspian Basin: Insights from seismic data and analog modeling. Mar. Pet. Geology. 62, 58–76. doi:10.1016/j.marpetgeo.2015.01.010
Xie, H., Yin, H., Tang, Y., Wang, W., Wei, H., and Wu, Z. (2015). Research on subsalt structure in the central Kelasu structure belt based on the area-depth technique. Geotectonica et Metallogenia 39, 1033–1040. (in Chinese with English abstract). doi:10.16539/j.ddgzyckx.2015.06.005
Xin, W., Chengzao, J., Shufeng, Y., Hubert‐Ferrari, A., and Suppe, J. (2002). The time of deformation on the Kuqa fold-and-thrust belt in the southern Tianshan-based on the Kuqa river area. Acta Geologica Sinica 76, 55–63. (in Chinese with English abstract).
Xu, W., Yin, H., Jia, D., Li, C., Wang, W., Yang, G., et al. (2021). Structural Features and Evolution of the Northwestern Sichuan Basin: Insights From Discrete Numerical Simulations. Front. Earth Sci. 9, 653395. doi:10.3389/feart.2021.653395
Xu, Z., Xie, H., Li, Y., Lei, G., Wu, C., and Neng, Y. (2012). Characteristics and controlling factors of the subsalt differential structure in the Kelasu structural belt, Kuqa Depression. Nat. Gas Geosci. 6, 1034–1038. (in Chinese with English abstract).
Yang, K. (2017). Differential Structural Deformations and Controlling Factors of Salt Tectonic in the Middle Segment of the Kuqa Depression. Beijing, China: Doctor ThesisChina University of Petroleum (Beijing. (in Chinese with English abstract). doi:10.1130/abs/2017am-298817
Yin, A., Nie, S., Craig, P., Harrison, T. M., Ryerson, F. J., Xianglin, Q., et al. (1998). Late Cenozoic tectonic evolution of the southern Chinese Tian Shan. Tectonics 17, 1–27. doi:10.1029/97TC03140
Yin, H., Wang, Z., Wang, X., and Wu, Z. (2011). Characteristics and mechanics of Cenozoic salt-related structures in Kuqa foreland basins: Insights from physical modeling and discussion. Geol. J. China Universities 17, 308–317. (in Chinese with English abstract). doi:10.16108/j.issn1006-7493.2011.02.020
Yin, H., Zhang, J., Meng, L., Liu, Y., and Xu, S. (2009). Discrete element modeling of the faulting in the sedimentary cover above an active salt diapir. J. Struct. Geology. 31, 989–995. doi:10.1016/j.jsg.2008.10.007
Yu, H., Qi, J., Shi, J., Wu, C., Zhang, W., Fan, S., et al. (2015). Basement fault activities have influenced on caprock tectonic deformation in Kuqa depression. Chin. J. Geology. 50, 50–62. (in Chinese with English abstract). doi:10.3969/j.issn.0563-5020.2015.03
Yu, Y., Tang, L., Yang, W., Huang, T., Qiu, N., and Li, W. (2014). Salt structures and hydrocarbon accumulations in the Tarim Basin, northwest China. Bulletin 98, 135–159. doi:10.1306/05301311156
Keywords: salt-related structures, salt thickness, Kuqa Depression, DEM, strain-stress
Citation: Li C, Yin H, Wu Z, Zhou P, Wang W, Ren R, Guan S, Li X, Luo H and Jia D (2021) Effects of Salt Thickness on the Structural Deformation of Foreland Fold-and-Thrust Belt in the Kuqa Depression, Tarim Basin: Insights From Discrete Element Models. Front. Earth Sci. 9:655173. doi: 10.3389/feart.2021.655173
Received: 18 January 2021; Accepted: 19 July 2021;
Published: 24 August 2021.
Edited by:
A. Alexander G. Webb, The University of Hong Kong, ChinaReviewed by:
Junpeng Wang, China University of Geosciences Wuhan, ChinaDaniel Mège, Space Research Center (PAN), Poland
Copyright © 2021 Li, Yin, Wu, Zhou, Wang, Ren, Guan, Li, Luo and Jia. This is an open-access article distributed under the terms of the Creative Commons Attribution License (CC BY). The use, distribution or reproduction in other forums is permitted, provided the original author(s) and the copyright owner(s) are credited and that the original publication in this journal is cited, in accordance with accepted academic practice. No use, distribution or reproduction is permitted which does not comply with these terms.
*Correspondence: Hongwei Yin, aHd5aW5Abmp1LmVkdS5jbg==; Zhenyun Wu, emhlbnl1bl93dUBlY3V0LmVkdS5jbg==