 Hakan Tanyaş
 Dalia Kirschbaum
 Tolga Görüm
 Cees J. van Westen1†
 Luigi Lombardo
- 1Faculty of Geo-Information Science and Earth Observation (ITC), University of Twente, Enschede, Netherlands
- 2Hydrological Sciences Laboratory, NASA Goddard Space Flight Center, Greenbelt, MD, United States
- 3Universities Space Research Association (USRA), Columbia, MD, United States
- 4Eurasia Institute of Earth Sciences, Istanbul Technical University, Istanbul, Turkey
Earthquakes do not only trigger landslides in co-seismic phases but also elevate post-seismic landslide susceptibility either by causing a strength reduction in hillslope materials or by producing co-seismic landslide deposits, which are prone to further remobilization under the external forces generated by subsequent rainfall events. However, we still have limited observations regarding the post-seismic landslide processes. And, the examined cases are rarely representative of tropical conditions where the precipitation regime is strong and persistent. Therefore, in this study, we introduce three new sets of multi-temporal landslide inventories associated with subsets of the areas affected by 1) 2016 Reuleuet (Indonesia, Mw = 6.5), 2) 2018 Porgera (Papua New Guinea, Mw = 7.5) and 3) 2012 Sulawesi (Indonesia, Mw = 6.3), 2017 Kasiguncu (Indonesia, Mw = 6.6) and 2018 Palu (Indonesia, Mw = 7.5) earthquakes. Overall, our findings show that the landslide susceptibility level associated with the occurrences of new landslides return to pre-seismic conditions in less than a year in the study areas under consideration. We stress that these observations might not be representative of the entire area affected by these earthquakes but the areal boundaries of our study areas.
Introduction
Based on the number of casualties, earthquakes and precipitation are the most common landslide triggers (Petley, 2012) and near-real-time global landslide susceptibility assessment methods are separately available for both earthquake- (e.g., Nowicki Jessee et al., 2018; Tanyaş et al., 2019) and rainfall-triggered (Kirschbaum and Stanley, 2018) landslides. However, none of these statistically based methods are capable of accounting for the coupled effect of earthquakes and precipitation. Nevertheless, characterizing these interactions is critical to advance effective landslide susceptibility assessment because various studies show that the combined effect of earthquakes and rainfall could increase landslide susceptibility (e.g., Sassa et al., 2007; Sæmundsson et al., 2018; Wistuba et al., 2018; Bontemps et al., 2020; Chen et al., 2020a). Specifically, earthquakes are recognized as an important predisposing factor increasing post-seismic landslide susceptibility either by disturbing the strength and/or geometry of hill slope materials or by producing co-seismic landslide deposits, which are prone to instabilities mostly due to subsequent rainfall events (e.g., Lin et al., 2004; Parker et al., 2015; Tanyaş et al., 2021). Either way, the seismic effect can cause a reduction in rainfall thresholds in post-seismic periods (e.g., Liu et al., 2008, Liu et al., 2021; Tanyaş et al., 2021).
To capture the preconditioning effect of seismic shaking for a rainfall-triggered landslide susceptibility assessment, we first need to understand the evolution of landslides in post-seismic periods.
In the geoscientific literature, the post-seismic landslide evolution is examined on the basis of the temporal variation of several parameters such as landslide rate (km2/year, in Barth et al., 2020), landslide density (m2/km2, in Marc et al., 2019), climate normalized landslide rate (Marc et al., 2015), number of landslides (Saba et al., 2010), total landslide area (Shafique, 2020) and cumulative landslide area/volume (Fan et al., 2018). The timespan of the post-seismic period required to restore a given area to pre-seismic landslide susceptibility levels is called landslide recovery time (e.g., Marc et al., 2015; Kincey et al., 2021). And, it is mostly identified using one of the parameters listed above.
Various factors can be interchangeably and/or simultaneously used to explain the mechanisms behind landslide recovery time. Positive correlations between landslide recovery time and various factors such as the amount of co-seismic landslide deposits (e.g., Chen et al., 2020b; Tian et al., 2020; Yunus et al., 2020), the intensity of seismicity in terms of both mainshocks and aftershocks (Fan et al., 2018; Tian et al., 2020) or revegetation rate (e.g., Chen et al., 2020; Xiong et al., 2020; Yunus et al., 2020) are emphasized in the literature. However, there is no agreement in the geoscientific community on the actual meaning of the term landslide recovery. On one hand, some geoscientists define the recovery as a mechanical healing process where the strength of hill slope material is restored (e.g., Marc et al., 2015). On the other hand, others argue that healing on strength of hill slope materials is not possible through natural processes under low pressure and temperature conditions (e.g., Parker et al., 2015).
Regardless of the landslide recovery definition, our knowledge regarding the post-seismic mass wasting processes mostly, if not entirely, depends on landslide inventories. In particular, multi-temporal landslide inventories are vital to understand the spatial and temporal evolution of landslides in post-seismic periods. However, cloud-free aerial images required to create multi-temporal landslide inventories especially for large areas are rarely available and therefore, multi-temporal inventories are not common (Guzzetti et al., 2012). To date, only nine earthquakes in the literature have been associated with post-seismic landslides recorded in a multi-temporal scheme (see Figure 1). These earthquakes correspond to: 1) 1993 Finisterre (Papua New Guinea, Mw = 6.9) (Marc et al., 2015), 2) 1999 Chi-Chi (Taiwan, Mw = 7.7) (e.g., Shou et al., 2011; Marc et al., 2015), 3) 2004 Niigata (Japan, Mw = 6.6) (Marc et al., 2015), 4) 2005 Kashmir (India-Pakistan, Mw = 7.6) (Saba et al., 2010; Shafique, 2020), 5) 2008 Iwate (Japan, Mw = 6.9) (Marc et al., 2015), 6) 2008 Wenchuan (China, Mw = 7.9) (e.g., Tang et al., 2016; Zhang et al., 2016; Yang et al., 2017; Fan et al., 2018; Chen et al., 2020b), 7) 2012 Haida Gwaii (Canada, Mw = 7.8) (Barth et al., 2020) and 9) 2015 Gorkha (Nepal, Mw = 7.8) (Marc et al., 2019; Kincey et al., 2021). Based on the analyses executed on these events, there is a general agreement that earthquakes elevate the landslide susceptibility in post-seismic periods and the landscape returns to pre-seismic susceptibility level over time.
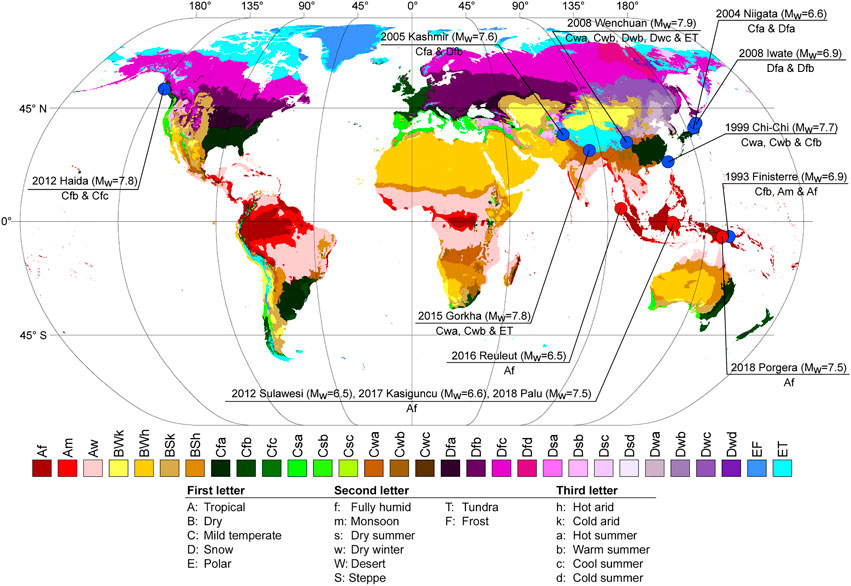
FIGURE 1. World map of the Köppen-Geiger climate classification (Kriticos et al., 2012) overlaid by the spatial distribution of cases (blue points) in which post-seismic landslide evolution processes were examined via multi-temporal landslide inventories. Red points indicate the sites where we mapped multi-temporal inventories for this study.
Nevertheless, the agreement reported above within the geoscientific community leaves room for an equal amount of disagreements on the duration of the recovery. In fact, even for the same earthquake, there are different observations regarding the time through which the elevated landslide susceptibility persists in post-seismic periods. For instance, Shafique (2020) examines a subset of the area affected by the 2005 Kashmir earthquake from 2004 to 2018 using multi-temporal landslide inventories and indicates that 13 years after the earthquake the level of landslide susceptibility is still larger than the level estimated in pre-seismic conditions. Conversely, Khan et al. (2013) monitored a sample of the hill slopes that failed during the Kashmir earthquake and suggested that the landscape returned to pre-seismic susceptibility level within five years after the earthquake.
In the same way as above, different timespans of elevated landslide susceptibility have also been suggested for other large earthquakes such as Chi-Chi (e.g., Shou et al., 2011; Marc et al., 2015), Wenchuan (e.g., Fan et al., 2018; Chen et al., 2020b) and Gorkha (e.g., Marc et al., 2019; Kincey et al., 2021) earthquakes. Notably, the inconsistency between different observations could be related to the boundaries of examined areas (e.g., Shafique, 2020; Yunus et al., 2020) because the ground shaking level spatially varies, hence its effect varies as well. In other words, the damage produced by ground motion is not homogeneous throughout the area affected by an earthquake. Kincey et al. (2021) elaborate on this issue and refer to both methodological and conceptual issues. They note that the method used to map landslides and, in particular, the data used for the mapping may play a role. They also indicate that post-seismic landslide evolution could be assessed by monitoring new landslides or both new landslides and reactivated co-seismic landslides. In turn, based on the target post-seismic landsliding processes, different conclusions regarding the post-seismic evolution of landslides could arise.
Taking aside these uncertainties, the actual landslide recovery time could also be different in each earthquake-affected area because of the diversity in environmental conditions (e.g., Kincey et al., 2021). For instance, landslide recovery time could be longer in areas affected by stronger earthquakes (e.g., Fan et al., 2018) and/or stronger and more numerous earthquake aftershocks (Tian et al., 2020). Also, the amount of co-seismic landslide deposits and precipitation patterns could influence the landslide recovery time (e.g., Tian et al., 2020). This shows that different seismic and climatic conditions could shape the general characteristics of post-seismic landslide evolution processes. In this context, new cases reflecting different environmental conditions are essential to better understand the post-seismic processes.
Specifically, new cases from the high-relief mountainous environments where the precipitation rate is high and persistent could provide valuable information regarding landslide recovery time because such conditions could trigger more landslides and allow us to create high-resolution, multi-temporal landslide inventories. However, the literature summarized above shows that post-seismic landslide evolution is rarely examined for fully humid, tropical conditions (Figure 1). The only case belonging to this climate zone is the 1993 Finisterre earthquake (Marc et al., 2015). Therefore, in this paper, we aim to contribute to the current literature by introducing three new sets of multi-temporal landslide inventories (two sites from Indonesia and one from Papua New Guinea) where the post-seismic periods are governed by strong and persistent precipitation regimes.
Materials and Methods
We examined the post-seismic landslide evolution associated with five earthquakes (Figure 1): 1) August 18, 2012 Sulawesi (Indonesia, Mw = 6.3), 2) May 29, 2017 Kasiguncu (Indonesia, Mw = 6.6), 3) September 28, 2018 Palu (Indonesia, Mw = 7.5), 4) December 6, 2016 Reuleuet (Indonesia, Mw = 6.5) and 5) February 25, 2018 Porgera (Papua New Guinea, Mw = 7.5). In each case, we investigated subsets of areas affected by co-seismic landslides and created multi-temporal inventories by only mapping new landslides (Table 1).
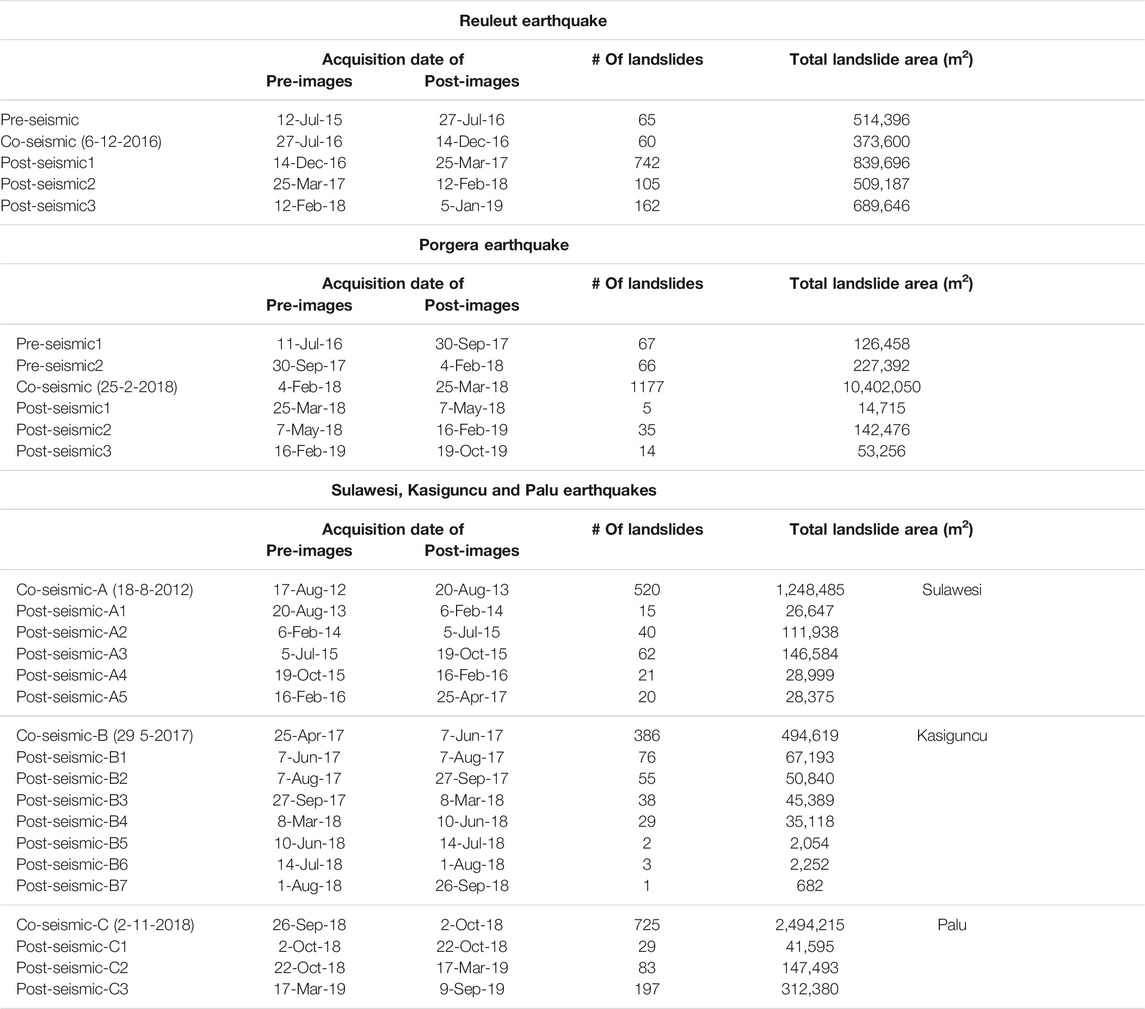
TABLE 1. Details of the multi-temporal landslide inventories.
The area affected by the Reuleuet earthquake is the first site we examined (Figure 2). The second area is affected by the Porgera earthquake (Figure 3). The third site is affected by three earthquakes: the Sulawesi, Kasiguncu and Palu earthquakes (Figure 4). We should note that the aggregated version of the inventories mapped for the first and the third sites were also examined by Tanyaş et al. (2021) to investigate the legacy of earthquakes as a predisposing factor in susceptibility assessments run for rainfall-induced landslides in post-seismic periods. Specifically, the authors run statistically based multivariate analyses to monitor the contribution of Peak Ground Acceleration (PGA) through time from co-seismic to post-seismic periods. However, landslide recovery time was not elaborated by Tanyaş et al. (2021) as we focus on in this contribution.
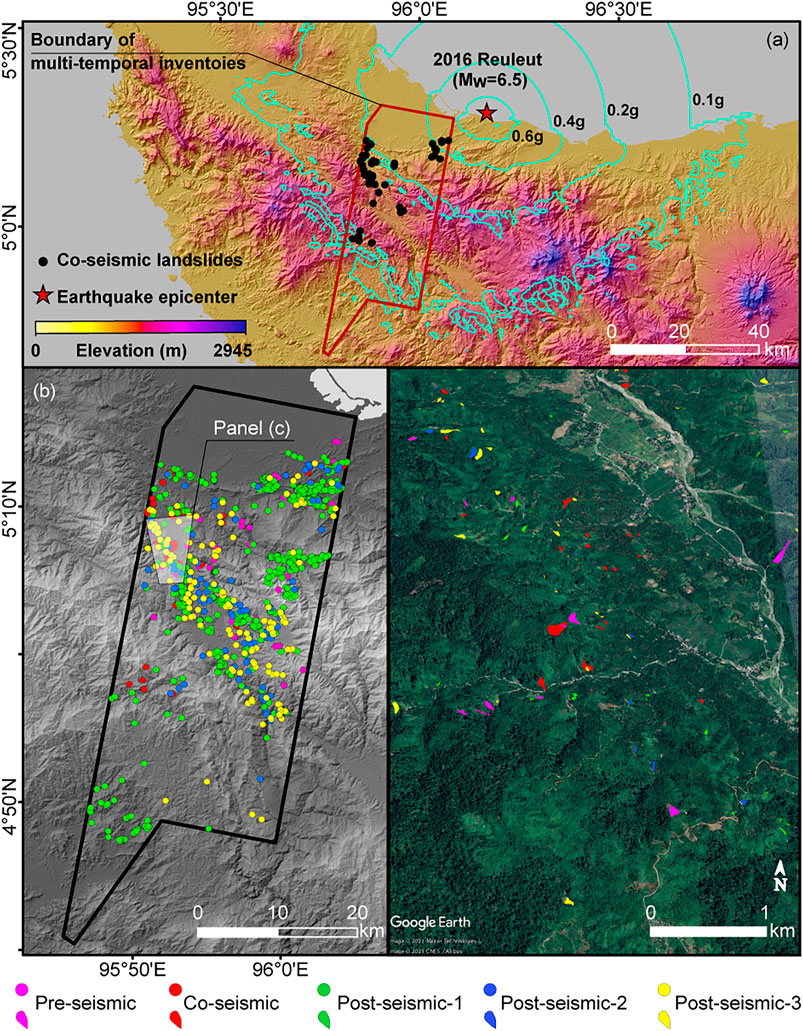
FIGURE 2. Maps showing (A) areal extent of multi-temporal inventories we mapped for the 2017 Reuleut earthquake, (B) spatial distribution of mapped landslides and (C) Google Earth scene as a sample view of multi-temporal landslide inventories for a subset of the area. In Panel A cyan contour lines show PGA values are acquired from the USGS ShakeMap system (Worden and Wald, 2016).
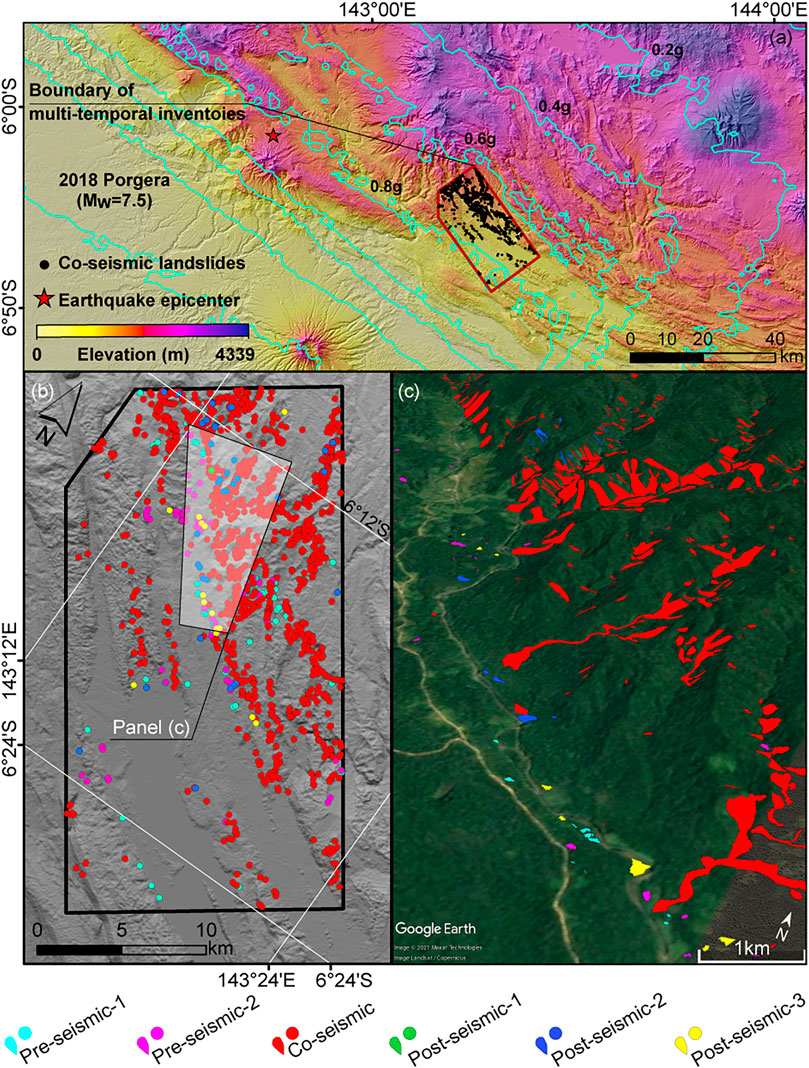
FIGURE 3. Maps showing (A) areal extent of multi-temporal inventories we mapped for the 2018 Porgera earthquake, (B) spatial distribution of mapped landslides and (C) Google Earth scene as a sample view of multi-temporal landslide inventories for a subset of the area. In Panel A cyan contour lines show PGA values are acquired from the USGS ShakeMap system (Worden and Wald, 2016).
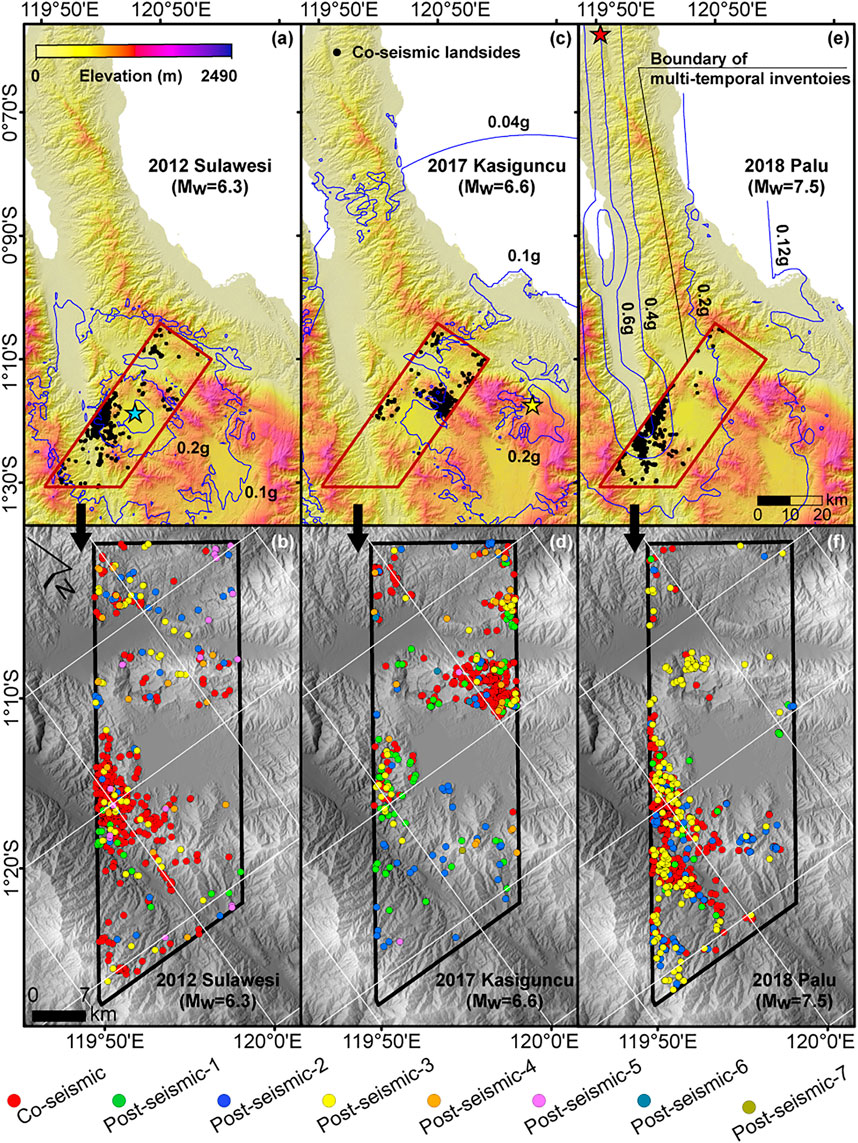
FIGURE 4. Maps showing areal extent of the examined area and spatial distribution of landslides we mapped for (A–B) 2012 Sulawesi (C–D) 2017 Kasiguncu and (E–F) 2018 Palu earthquakes. In Panels A, C and E blue contour lines show PGA values are acquired from the USGS ShakeMap system (Worden and Wald, 2016).
To map multitemporal inventories we used PlanetScope (3–5 m), Rapid Eye (5 m) images acquired from Planet Labs (Planet Team, 2018) and high-resolution Google Earth scenes. The details of the satellite images we used are presented in Supplementary Tables S1, S2 and S3 (see Supplementary Material). We systematically examined the satellite images through visual observation, which is the ideal mapping technique reported in the literature (e.g., Xu 2015; Tanyaş et al., 2021). We did not differentiate source and depositional areas of landslides and delineated them as a part of the same polygon.
For each earthquake-affected area, we initially examined all available remotely sensed scenes and choose the largest available cloud-free regions. In turn, all the multitemporal images we used for mapping convey the real landslide distribution over time during pre- and post-seismic periods. Notably, we could not follow a fixed temporal resolution to create the inventories. We mapped as many inventories as the imagery availability allowed (Table 1). In each inventory, we eliminated landslides that have previously occurred and only include new failures.
The 2012 Reuleuet earthquake occurred along a strike-slip fault and it triggered only 60 co-seismic landslides over a scanned area of 1356 km2 (Figure 2). We created one landslide inventory associated with pre-seismic conditions, a co-seismic landslide inventory and three post-seismic ones (Table 1). Intermediate, basic volcanic and mixed sedimentary rocks are the dominant lithologic units (Sayre et al., 2014) in which landslides are triggered. Based on our interpretation, the co-seismic failures are primarily characterized by shallow translational slides (60 landslides, 0.4 km2 landslide area). The percentage of post-seismic landslides that interact with previously occurred failures is negligible (<1% of the post-seismic landslide population) and no remobilization was observed in the post-seismic period. In other words, most post-seismic failures are characterized by new landslides.
As for the 2018 Porgera earthquake, which occurred on a thrust fault, we examined a 491 km2 window and mapped a co-seismic landslide inventory including 1,168 landslides with a total surface of 9.8 km2 (Figure 3). Landslides were triggered in basic volcanic and carbonate sedimentary rocks (Sayre et al., 2014). Rock/debris avalanches and translational landslides are observed as part of the co-seismic landslide inventory. We also mapped two pre-seismic and three post-seismic landslide inventories (Table 1). Despite the relatively large deposits of co-seismic landslides, we did not observe any connection between post-seismic landslides and those within previously occurred deposits or sliding surfaces. In other words, we mapped only new landslides.
The areas affected by the 2012 Sulawesi (strike-slip), 2017 Kasiguncu (normal fault) and 2018 Palu (strike-slip) earthquakes overlap (Figure 4). We mapped the landslides associated with the three earthquakes over an area of 1078 km2. The co-seismic landslide inventories we created for the overlapping area contained 520 (1.2 km2), 386 (0.5 km2) and 725 landslides (2.3 km2), respectively. We also mapped five, seven and three post-seismic landslide inventories for Sulawesi, Kasiguncu and Palu earthquakes, respectively (Table 1). In each case, we interpret the majority of landslides as shallow slides which were triggered in metamorphic and acid plutonic rocks (Sayre et al., 2014). Also, in each case, post-seismic landslides appeared as new failures regardless of the locations of co-seismic landslides and their deposits. The percentage of the post-seismic landslides that appeared to have interacted with previous failures is less than 5%.
Once the multi-temporal inventories were compiled, we examined the temporal evolution of land sliding based on the changes in both the number of landslides and landslide rates. We calculated the landslide rates as the total landslide area divided by the length of the scanned time window (m2/year).
We also analyzed the variation in the precipitation regime to evaluate the role of rainfall. We used the Integrated Multi-Satellite Retrievals (IMERG) Final Run product (Huffman et al., 2015), which is available through Giovanni (v.4.32) (Acker and Leptoukh, 2007) online data system. Using this product, we first calculated the mean and standard deviation of daily accumulated precipitation from a 20-years (from January 1, 2000 to March 31, 2020) time series and compared it with variation in landslide occurrences. Second, we created boxplots of daily accumulated precipitation for each time window that we mapped a landslide inventory and again compared it with variation in landslide occurrences.
Results
For the area affected by the Reuleuet (December 6, 2016) earthquake, we compiled one landslide inventory associated with pre-earthquake conditions, a co-seismic landslide inventory and three post-seismic ones (Table 1). We observed the peak landslide rate in our first post-seismic inventory that we created comparing the imageries acquired on December 14, 2016 and March 25, 2017. After the first post-seismic inventory, a strong decline in landslide rates arises toward pre-seismic conditions (Table 1 and Figure 5).
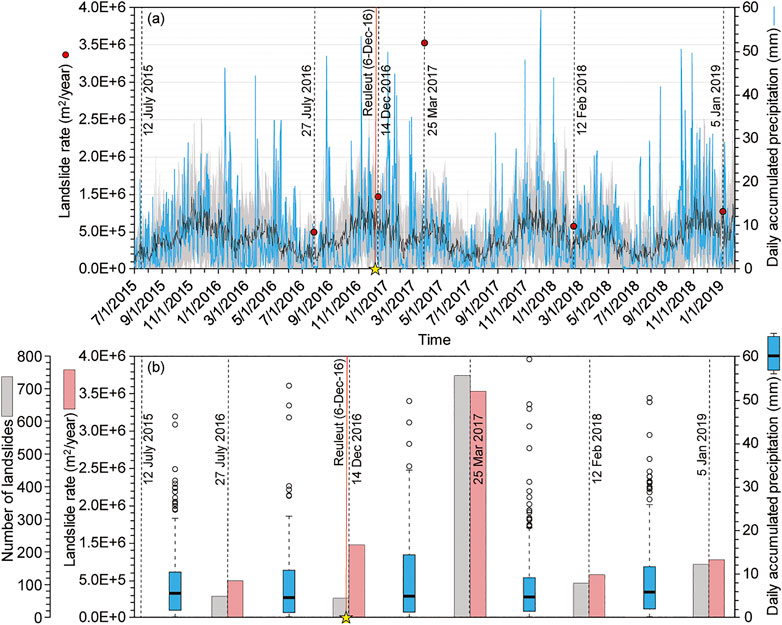
FIGURE 5. Landslide rates, number of landslides and daily precipitation regarding the examined time windows for the 2016 Reuleuet earthquakes. Yellow stars show the date of the earthquake. Vertical dashed black lines indicate the dates of the satellite imagery used for mapping. In Panel A, the mean and standard deviation of daily accumulated precipitation of the respective time windows are calculated from a 20-years time series are shown by black and gray lines, respectively. In Panel B, boxplots show minimum, median and maximum precipitation amounts as well as first, third quartiles and outliers.
We created the second post-seismic landslide inventory comparing the imageries acquired on March 25, 2017 and February 12, 2018. Precipitation amounts show that during the period that we mapped the second post-seismic inventory, the study area was exposed to more intense rainfall events compared to the pre-seismic period we examined (Figure 5). Also, the time window we scanned to create both pre-seismic and second post-seismic landslide inventories have approximately the same length, which is one year. However, the landslide rates and the number of landslides triggered by rainfall are still at the same level in both phases. This shows that landslide rates that we calculated for the occurrences of new landslides return to pre-seismic levels by February 12, 2018 (Figure 5). This case shows that the elevated landslide susceptibility is only valid until March 25, 2017. Also, we note that the highest daily accumulated precipitation for this four-month time window (i.e., between the Reuleut earthquake and March 25, 2017) is observed soon after the earthquake on January 4, 2017. However, due to the lack of availability of more frequent imagery, we could not create a landslide event inventory for that specific rainfall event.
It is worth noting that the landslide rate of landslides triggered by the Reuleut earthquake provided a rare observation where the co-seismic landslide rate is smaller than their post-seismic counterpart (Tanyaş et al., 2021). The peak landslide rate is mostly introduced by co-seismic landslide events in the literature (e.g., Saba et al., 2010; Fan et al., 2018). However, in this case, the earthquake does not trigger widespread co-seismic landslides although it most likely disturbs hill slope materials and makes them more susceptible. As a result, the subsequent rainfall event causes a higher landslide rate compared to the co-seismic phase (Tanyaş et al., 2021).
Regarding the Porgera (February 25, 2018) earthquake, we created two landslide inventories for pre-earthquake conditions, a co-seismic one and three additional post-seismic inventories (Table 1). We compared two sets of images from February 4, 2018 and March 25, 2018 to map the co-seismic landslides. We observed the peak landslide rate in the co-seismic phase and then all post-seismic inventories gave rates in the same range with pre-seismic observations (Table 1 and Figure 6). This shows that landslide rates that we calculated for the occurrences of new landslides return to pre-seismic levels by March 25, 2018 (Figure 6). Within the 50-days gap between the two sets of images we used to create our co-seismic landslide inventory, we noticed two peaks in daily accumulated precipitation on March 12th and 21st. Therefore, those rainfall events may have already triggered some of the post-seismic landslides and our co-seismic inventory may also include post-seismic landslides. However, we do not have landslide inventories capturing those specific rainfall events.
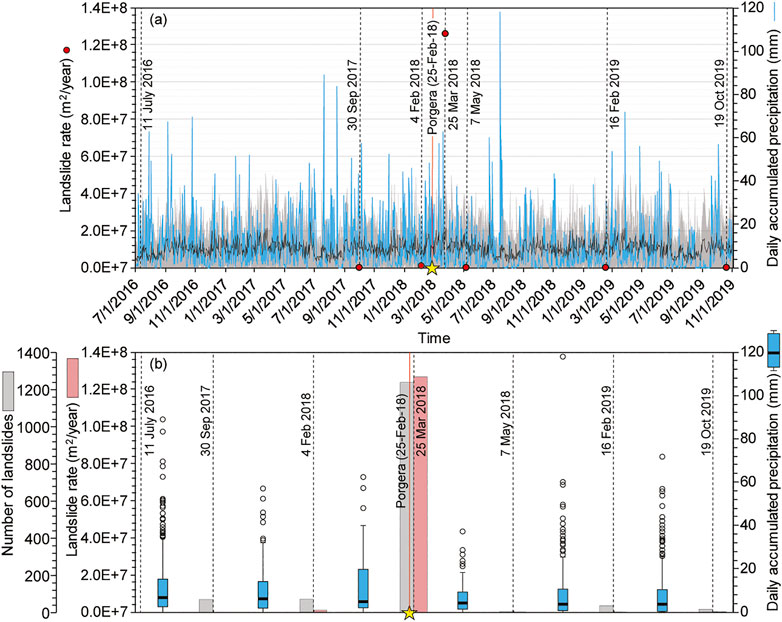
FIGURE 6. Landslide rates, number of landslides and daily precipitation regarding the examined time windows for the 2018 Porgera earthquakes. Yellow stars show the date of the earthquake. Vertical dashed black lines indicate the dates of the satellite imagery used for mapping. In Panel A, the mean and standard deviation of daily accumulated precipitation of the respective time windows are calculated from a 20-years time series are shown by black and gray lines, respectively. In Panel B, boxplots show minimum, median and maximum precipitation amounts as well as first, third quartiles and outliers.
In the third site, affected by three earthquakes (2012 Sulawesi, 2017 Kasiguncu and 2018 Palu earthquakes), we separately compiled co-seismic landslide inventories for each case. Furthermore, we mapped five inventories between the 2012 Sulawesi and 2017 Kasiguncu earthquakes. Similarly, we digitized seven inventories to monitor landslide rates between the 2017 Kasiguncu and 2018 Palu earthquakes. Ultimately, we compiled three additional inventories describing post-seismic conditions with reference to the last (Palu) earthquake (Table 1). Below, we present each earthquake and associated pre-, co- and post-seismic landslide inventories separately.
The inventory featuring the co-seismic landslides triggered by the Sulawesi earthquake (August 18, 2012) lacked the support of pre-earthquake imageries. Moreover, we could not find cloud-free images showing the situation through the entire area until the August 20, 2013. However, we acquired some scenes, (e.g., 17th and August 21, 2012, September 4, 2012 and February 4, 2013) which allowed us to partly but consistently observe pre- and co-seismic conditions in a fraction of the study area. Therefore, the peak landslide rate we observed in the first post-seismic inventory (August 20, 2013) likely reflects the presence of some pre- and post-seismic landslides in addition to the co-seismic ones (Figure 7). Nevertheless, the six intra-seismic inventories mapped between the August 20, 2013 and the April 25, 2017 showed significantly lower landslide rates compared to the first post-seismic one. As a result, we can still assume that the August 20, 2013 inventory mostly encompasses co-seismic landslides.
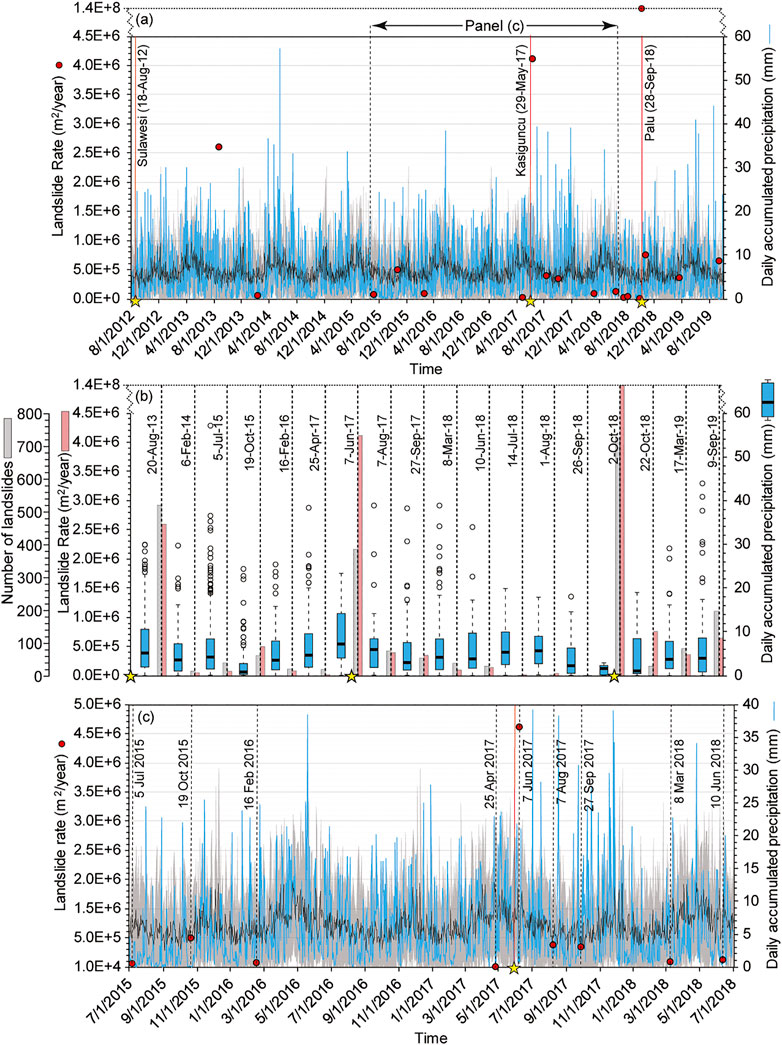
FIGURE 7. Landslide rates, number of landslides and daily precipitation regarding (A–B) the largest time-window where we examined the landslides associated with three earthquakes (2012 Sulawesi, 2017 Kasiguncu and 2018 Palu earthquakes) and (C) a zoomed-in view plotted for pre-, co- and post-seismic landslides associated with the 2017 Kasiguncu earthquake. Yellow stars show the date of the earthquakes. Vertical dashed black lines indicate the dates of the satellite imagery used for mapping. In Panels A and C, the mean and standard deviation of daily accumulated precipitation is calculated from a 20-years time series are shown by black and gray lines, respectively. In Panel B, boxplots show minimum, median and maximum precipitation amounts as well as first, third quartiles and outliers.
For the Kasiguncu (May 29, 2017) earthquake, we observed another co-seismic landslide peak (Figure 7). We compiled this inventory using images acquired on seventh, 10th and June 26, 2017. Therefore, we can confidently argue that co-seismic landslides cause this peak. We also mapped seven intra-seismic landslide inventories before the occurrence of the Palu earthquake. The first two intra-seismic inventories showed relatively higher landslide rates than the rest (Figure 7). These relatively high rates can be linked to extreme precipitation discharged after the Kasiguncu earthquake (please note six rainfall peaks in Figure 7C), although these rates are still in range or lower than the ones before the Kasiguncu earthquake (Figure 7). Notably, the third post-Kasiguncu inventory (March 8, 2018) highlights a regular or pre-seismic landslide regime which implies that landslide rates that we calculated for the occurrences of new landslides return to pre-seismic levels by March 8, 2018 (Figure 7).
For the Palu (September 28, 2018) earthquake (Mw = 7.5), we also compiled a co-seismic landslide inventory using scenes acquired on second and October 5, 2018. In this case, the associated landslide rate is significantly higher due to the strong shaking with respect to the previous two earthquakes (2012 Sulawesi, Mw = 6.3 and 2017 Kasiguncu, Mw = 6.6), which took place in the same area (Figure 4). The three post-seismic inventories highlight a rapid decline in landslide rates, although it should be noted that these rates did not align along with the low to very low-rate trends shown in pre-Palu conditions (Figures 7A,B). Nevertheless, we do not have an adequate series of observations as we have for the Kasiguncu case and because of this, it is not clear whether these low landslide rates imply a return to pre-seismic levels.
Discussion
As noted earlier in the text, in this study we focused on sites where post-seismic landslide processes are mostly governed by occurrences of new landslides in tropics where precipitation is high and persistent. We examined five earthquakes in total and mapped multi-temporal landslide inventories for each of them from pre-to post-seismic phases. Between five earthquakes, the landslide time series we created for Sulawesi and Palu earthquakes, on one hand, did not provide adequate information to cover the entire process of landslide evolution. In the Sulawesi case, we could not map a pre-seismic landslide inventory, whereas in the Palu earthquake our inventories did not cover a period long enough to monitor the entire post-seismic landslide evolution. On the other hand, for three of the examined cases (2012 Reuleut, 2017 Kasiguncu and 2018 Porgera), our multi-temporal inventories showed that after the earthquake the elevated landslide susceptibility levels return to pre-seismic conditions in less than a year.
We stress that these observations may not be representative of the entire area affected by these earthquakes but the areal boundaries of our study areas. This means that for the whole areas affected by these earthquakes these observations may not valid. However, compared to the similar works in the literature suggesting at least a few years for returning to the pre-seismic susceptibility levels (e.g., Marc et al., 2015; Fan et al., 2018; Kincey et al., 2021), our findings still point out a relatively short period.
Among the examined cases, the 2016 Reuleut earthquake is a clear example to discuss the possible factors controlling this relatively short period to return to pre-seismic landslide rates. The Reuleut earthquake triggered only 60 shallow landslides in the examined area although, within 110 days from the earthquake, we observed 742 new landslides in the same site (Table 1 and Figure 5). This later series of landslides is larger than the common landslide rate in the area. However, from this time onward, the landslide rate recovers to its pre-earthquake pattern (Figure 5). The limited number of shallow co-seismic landslides implies that there is not much material deposited on hill slopes and the remobilization processes through, for instance, debris flows are negligible. This shows that the post-seismic process is governed by occurrences of new landslides and therefore, returning to pre-seismic landslide rates could be relatively quick (e.g., Tian et al., 2020).
By discarding the contribution of deposit availability, the most likely explanation for the high landslide susceptibility following the earthquake can be associated with strength reduction in hillslope regolith and/or bedrock caused by ground shaking (e.g., Parker et al., 2015; Fan et al., 2019). In such cases, the post-seismic landsliding processes may be controlled by two mechanisms already postulated in the literature (e.g., Saba et al., 2010; Marc et al., 2015): 1) healing of soil and/or rock mass strength parameters and/or 2) the environmental stress due to the subsequent rainfall discharge.
The healing of soil strength parameters is a proven process under certain circumstances (Lawrence et al., 2009; Fan et al., 2015; Bontemps et al., 2020). Specifically, in tropical landscapes, we can expect relatively fast recovery rates in the vegetation cover, which may play a large role in lateral root reinforcement for shallow landslide mitigation (e.g., Schwarz et al., 2010). However, vegetation recovery is a gradually occurring process and it may take three years even for the fast-growing tree species in the tropics (Dislich and Huth, 2012). For instance, Yunus et al. (2020) examined the relationship between vegetation recovery and landslide rates via Normalized Difference Vegetation Index (NDVI) values and concluded that just based on the established NDVI trend, pre-seismic landslide rates can be obtained within 18 years. Moreover, considering the persistent external stress caused by the precipitation regime in Reuleut, Indonesia (i.e., in the absence of dry season), in such a short post-seismic period (i.e., 110 days), healing in soil strength parameters is not likely to take place.
The second alternative refers to the intensity and duration of the post-earthquake rainfall regime. Precipitation may negatively affect disturbed hillslopes that the earthquake has brought to a Factor of Safety (FoS) close to one. However, the rainfall may not be enough to bring the FoS to the brink of actual instability and failure. As a result, regardless of the abovementioned healing processes, post-seismic landslide rates might decrease gradually through time or might decline rapidly based on the climatic conditions, particularly based on intensity and persistence of precipitation.
We can further discuss the intensity of landslide triggers, for instance, considering post-seismic landslides following the 2005 Kashmir earthquake. After the first monsoon season following the Kashmir earthquake, Saba et al. (2010) observed only a few landslides despite the heavy precipitation. Our interpretation is in line with theirs, stating that the rainfall intensity might not be enough to trigger further landslides. On the other hand, they also note that another possible reason for the lack of landslides is that all unstable slopes might have already failed by that moment. However, the unstable slope is a relative term and a failure can occur on any slope if there is an access amount of external forces disturbing the stability conditions.
In this context, our newly developed landslide dataset allows us to elaborate on the relativity of the term “unstable slope” and to make a simplified comparison between the intensity of rainfall and earthquake events as triggering agents that exacerbate slope stability conditions. The area affected by three earthquakes (2012 Sulawesi, 2017 Kasiguncu and 2018 Palu) shows that even relatively low-intensity ground shaking might be more effective than intense precipitation at triggering landslides. After the Sulawesi earthquake, the post-seismic landslide rates remain low until the 2017 Kasiguncu earthquake, although several intense rainfall events occurred between 2014 and 2017 (Figure 7). However, the high landslide rate associated with the 2017 Kasiguncu earthquake occurs despite the relatively weak ground shaking estimates reported by the U.S. Geological Survey, ShakeMap system for the examined area (PGA≈0.08–0.10 g) (Worden and Wald, 2016) (Figure 8A). This implies that having a limited number of landslides related to rainfall events may not be due to the removal of all unstable slopes or healing on hill slope materials but because of a lack of triggers with sufficient intensity to cause failures on hill slopes, even when some of them have been previously damaged.
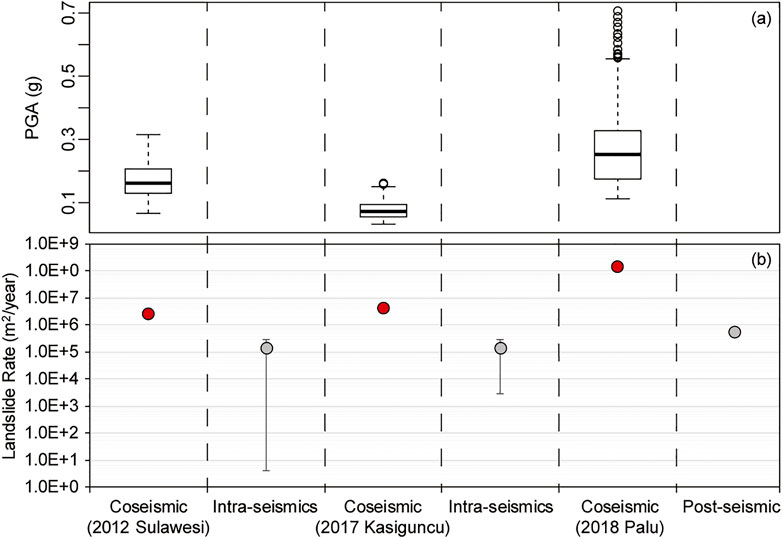
FIGURE 8. Plot showing (A) central tendencies and ranges of PGA for Sulawesi, Kasiguncu and Palu earthquakes and (B) the evolution of landslide rates in time for both co-seismic and post-seismic (intra-seismic) landslides. The error bars are given for the first standard deviation of landslide rates for each examined and post-seismic (intra-seismic) set of landslides.
This research also provides some findings regarding the argument that the legacy of the previous earthquakes can be valid years after an earthquake occurs (Parker et al., 2015). The Indonesia case where we mapped three co-seismic landslide inventories for the same site shows that there is an increasing trend in the co-seismic landslide rates over time (Figure 8B). With co-seismic landslides, the intensity of ground shaking is naturally the main factor controlling the landslide rates. In fact, the 2018 Palu earthquake (Mw = 7.5) caused one of the biggest landslide events observed in this region, though the site was hit by several large earthquakes previously (Watkinson and Hall, 2019). The Palu earthquake created strong ground motions within our study area with PGA values ranging from 0.20 to 0.68 g (Figure 8A). Therefore, the peak landslide rate related to the Palu earthquake is a natural consequence of such a large earthquake. On the other hand, within the same study area, the severity of ground shaking related to the 2017 Kasiguncu earthquake (PGA≈0.08–0.10 g) was relatively lower than the 2012 Sulawesi earthquake (PGA≈0.08–0.26 g). The level of ground shaking caused by the Kasiguncu earthquake is out of the zone in which the large majority of landslides (90% of the total landslide population) are located in most of the earthquake-induced landslide inventories in the literature. Specifically, Tanyaş and Lombardo (2019) identify the 0.12 g contour as the areal boundary of the zone containing at least 90% of the landslides. They also identify 0.05 g as the minimum PGA value triggering landslides. This means that our study area is located in a zone where we do not expect so many failures caused by the Kasiguncu earthquake. However, the Kasiguncu earthquake triggered 382 landslides and the post-seismic landslide rates of Kasiguncu earthquake is relatively higher than the Sulawesi earthquake (Figure 8B), although there is no significant change in the precipitation regime (Figure 7). The relatively high landslide rates, in this case, might be explained by various factors such as frequency and/or duration of ground shaking (Jibson et al., 2004, 2019; Jibson and Tanyaş, 2020) and detailed analyses are required to better understand these controlling factors. Yet, among various possible explanations, we can also count the legacy of the Sulawesi earthquake as a factor dictating the higher landslide rate concerning the Kasiguncu earthquake.
The variation in the mean (and standard deviation) of landslide rates for these three sets of post-seismic landslide inventories (see gray dots in Figure 8B) also suggests a similar conclusion that the legacy of the previous earthquakes might play a role in the trend of increasing post-seismic landslide rates through time. The accumulated disturbance on hill slope materials might cause a small increase in the average landslide rate of a site. As a result, the background level for the landslide susceptibility might be higher after each earthquake compared to previous earthquakes.
Conclusion
In this work, we examined the temporal evolution of landslides during post-seismic periods in which the combined effect of earthquakes and rainfall causes a particularly elevated landside susceptibility. Specifically, we examined some cases where rainfall acts as the main landslide trigger and seismicity plays the role of a predisposing factor. We focused on earthquakes that occurred in fully humid, tropical conditions because of two reasons. First, post-seismic landslide processes have been rarely investigated in these settings. Therefore, providing a new dataset belonging to rarely examined conditions could provide valuable information to better understand the post-seismic processes, which are mainly governed by site-specific environmental factors (e.g., seismicity, climate, etc.) (e.g., Tian et al., 2020). The second reason is due to the high and persistent precipitation regimes typical of tropical environments. In fact, these settings provide the perfect conditions for continuous genesis of slope failures, making it possible to obtain high spatial and temporal resolution time series of landslide inventories. The average temporal resolutions of our inventories are approximately eight, seven and five months for the areas affected by Reuleut, Porgera and Palu earthquakes, respectively (Table 1).
We observed that landslide susceptibility levels associated with the occurrences of new landslides return to pre-seismic conditions in less than a year, for the environmental settings under consideration. This implies that the elevated landslide susceptibility could disappear rapidly if the area is exposed to strong and persistent rainfall discharges. However, this does not mean that prolonged and strong precipitation regimes always bring a rapid decline in elevated landslide susceptibility. Site-specific characteristics of a study area such as seismotectonic, morphologic, geologic and climatic conditions, as well as sediment budget associated with co-seismic landslide events, govern the evolution of post-seismic periods. In this context, the possible roles of these factors need to be examined by further analyses.
Data Availability Statement
The original contributions presented in the study are included in the article/Supplementary Material, the inventories we mapped for this study are shared through NASA Landslide Viewer (https://landslides.nasa.gov). Further inquiries can be directed to the corresponding author.
Author Contributions
HT, DK, TG, LL and CW contributed to conception and design of the study. All authors contributed to manuscript revision, read, and approved the submitted version.
Conflict of Interest
The authors declare that the research was conducted in the absence of any commercial or financial relationships that could be construed as a potential conflict of interest.
Supplementary Material
The Supplementary Material for this article can be found online at: https://www.frontiersin.org/articles/10.3389/feart.2021.700546/full#supplementary-material
References
Barth, S., Geertsema, M., Bevington, A. R., Bird, A. L., Clague, J. J., Millard, T., et al. (2020). Landslide Response to the 27 October 2012 Earthquake (MW 7.8), Southern Haida Gwaii, British Columbia, Canada. Landslides 17, 517–526. doi:10.1007/s10346-019-01292-7
Bontemps, N., Lacroix, P., Larose, E., Jara, J., and Taipe, E. (2020). Rain and Small Earthquakes Maintain a Slow-Moving Landslide in a Persistent Critical State. Nat. Commun. 11, 1–10. doi:10.1038/s41467-020-14445-3
Chen, L., Mei, L., Zeng, B., Yin, K., Shrestha, D. P., and Du, J. (2020a). Failure Probability Assessment of Landslides Triggered by Earthquakes and Rainfall: a Case Study in Yadong County, Tibet, China. Sci. Rep. 10, 16531. doi:10.1038/s41598-020-73727-4
Chen, M., Tang, C., Xiong, J., Shi, Q. Y., Li, N., Gong, L. F., et al. (2020b). The Long-Term Evolution of Landslide Activity Near the Epicentral Area of the 2008 Wenchuan Earthquake in China. Geomorphology 367, 107317. doi:10.1016/j.geomorph.2020.107317
Dislich, C., and Huth, A. (2012). Modelling the Impact of Shallow Landslides on forest Structure in Tropical Montane Forests. Ecol. Model. 239, 40–53. doi:10.1016/j.ecolmodel.2012.04.016
Fan, L., Lehmann, P., and Or, D. (2015). Effects of Hydromechanical Loading History and Antecedent Soil Mechanical Damage on Shallow Landslide Triggering. J. Geophys. Res. Earth Surf. 120, 1990–2015. doi:10.1002/2015JF003615
Fan, X., Domènech, G., Scaringi, G., Huang, R., Xu, Q., Hales, T. C., et al. (2018). Spatio-temporal Evolution of Mass Wasting after the 2008 Mw 7.9 Wenchuan Earthquake Revealed by a Detailed Multi-Temporal Inventory. Landslides 15, 2325–2341. doi:10.1007/s10346-018-1054-5
Fan, X., Scaringi, G., Domènech, G., Yang, F., Guo, X., Dai, L., et al. (2019). Two Multi-Temporal Datasets that Track the Enhanced Landsliding after the 2008 Wenchuan Earthquake. Earth Syst. Sci. Data 11, 35–55. doi:10.5194/essd-11-35-2019
Guzzetti, F., Mondini, A. C., Cardinali, M., Fiorucci, F., Santangelo, M., and Chang, K.-T. (2012). Landslide Inventory Maps: New Tools for an Old Problem. Earth-Science Rev. 112, 42–66. doi:10.1016/j.earscirev.2012.02.001
Huffman, G. J., Bolvin, D. T., Braithwaite, D., Hsu, K., Joyce, R., Kidd, C., et al. (2015). NASA Global Precipitation Measurement (GPM) Integrated Multi-satellitE Retrievals for GPM (IMERG) Prepared for: Global Precipitation Measurement (GPM) National Aeronautics and Space Administration (NASA); Algorithm Theoretical Basis Document Version 4.5. Washington, DC: National Aeronautics and Space Administration, 26
Jibson, R. W., Harp, E. L., Schulz, W., and Keefer, D. K. (2004). Landslides Triggered by the 2002 Denali Fault, Alaska, Earthquake and the Inferred Nature of the strong Shaking. Earthquake Spectra 20, 669–691. doi:10.1193/1.1778173
Jibson, R. W., R. Grant, A. R., Witter, R. C., Allstadt, K. E., Thompson, E. M., and Bender, A. M. (2019). Ground Failure from the Anchorage, Alaska, Earthquake of 30 November 2018. Seismol. Res. Lett. 91, 19–32. doi:10.1785/0220190187
Jibson, R. W., and Tanyaş, H. (2020). The Influence of Frequency and Duration of Seismic Ground Motion on the Size of Triggered Landslides-A Regional View. Eng. Geology. 273, 105671. doi:10.1016/j.enggeo.2020.105671
Khan, S. F., Kamp, U., and Owen, L. A. (2013). Documenting Five Years of Landsliding after the 2005 Kashmir Earthquake, Using Repeat Photography. Geomorphology 197, 45–55. doi:10.1016/j.geomorph.2013.04.033
Kincey, M. E., Rosser, N. J., Robinson, T. R., Densmore, A. L., Shrestha, R., Pujara, D. S., et al. (2021). Evolution of Coseismic and Post‐seismic Landsliding After the 2015 M W 7.8 Gorkha Earthquake, Nepal. J. Geophys. Res. Earth Surf. 126, e2020JF005803. doi:10.1029/2020JF005803
Kirschbaum, D., and Stanley, T. (2018). Satellite-Based Assessment of Rainfall-Triggered Landslide Hazard for Situational Awareness. Earth's Future 6, 505–523. doi:10.1002/2017EF000715
Kriticos, D. J., Webber, B. L., Leriche, A., Ota, N., Macadam, I., Bathols, J., et al. (2012). CliMond: Global High-Resolution Historical and Future Scenario Climate Surfaces for Bioclimatic Modelling. Methods Ecol. Evol. 3, 53–64. doi:10.1111/j.2041-210X.2011.00134.x
Lawrence, Z., Bodin, P., and Langston, C. A. (2009). In Situ measurements of Nonlinear and Nonequilibrium Dynamics in Shallow, Unconsolidated Sediments. Bull. Seismological Soc. America 99, 1650–1670. doi:10.1785/0120080177
Lin, C.-W., Shieh, C.-L., Yuan, B.-D., Shieh, Y.-C., Liu, S.-H., and Lee, S.-Y. (2004). Impact of Chi-Chi Earthquake on the Occurrence of Landslides and Debris Flows: Example from the Chenyulan River Watershed, Nantou, Taiwan. Eng. Geology. 71, 49–61. doi:10.1016/S0013-7952(03)00125-X
Liu, C.-N., Huang, H.-F., and Dong, J.-J. (2008). Impacts of September 21, 1999 Chi-Chi Earthquake on the Characteristics of Gully-type Debris Flows in central Taiwan. Nat. Hazards 47, 349–368. doi:10.1007/s11069-008-9223-9
Liu, S., Hu, K., Zhang, Q., Zhang, S., Hu, X., and Tang, D. (2021). Quantitative Analysis of the Effects of an Earthquake on Rainfall Thresholds for Triggering Debris-Flow Events. Front. Earth Sci. 9, 417. Available at: https://www.frontiersin.org/article/10.3389/feart.2021.676470. doi:10.3389/feart.2021.676470
Marc, O., Behling, R., Andermann, C., Turowski, J. M., Illien, L., Roessner, S., et al. (2019). Long-term Erosion of the Nepal Himalayas by Bedrock Landsliding: The Role of Monsoons, Earthquakes and Giant Landslides. Earth Surf. Dynam. 7, 107–128. doi:10.5194/esurf-7-107-2019
Marc, O., Hovius, N., Meunier, P., Uchida, T., and Hayashi, S. (2015). Transient Changes of Landslide Rates after Earthquakes. Geology 43, 883–886. doi:10.1130/G36961.1
Nowicki Jessee, M. A., Hamburger, M. W., Allstadt, K., Wald, D. J., Robeson, S. M., Tanyas, H., et al. (2018). A Global Empirical Model for Near‐Real‐Time Assessment of Seismically Induced Landslides. J. Geophys. Res. Earth Surf. 123, 1835–1859. doi:10.1029/2017JF004494
Parker, R. N., Hancox, G. T., Petley, D. N., Massey, C. I., Densmore, A. L., and Rosser, N. J. (2015). Spatial Distributions of Earthquake-Induced Landslides and Hillslope Preconditioning in the Northwest South Island, New Zealand. Earth Surf. Dynam. 3, 501–525. doi:10.5194/esurf-3-501-2015
Petley, D. (2012). Global Patterns of Loss of Life from Landslides. Geology 40, 927–930. doi:10.1130/G33217.1
Planet Team (2018). Planet Application Program Interface: In Space for Life on Earth. San Francisco, CA. Available at: https://api.planet.com (Accessed March 20, 2020).
Saba, S. B., van der Meijde, M., and van der Werff, H. (2010). Spatiotemporal Landslide Detection for the 2005 Kashmir Earthquake Region. Geomorphology 124, 17–25. doi:10.1016/j.geomorph.2010.07.026
Sæmundsson, Þ., Morino, C., Helgason, J. K., Conway, S. J., and Pétursson, H. G. (2018). The Triggering Factors of the Móafellshyrna Debris Slide in Northern Iceland: Intense Precipitation, Earthquake Activity and Thawing of Mountain Permafrost. Sci. Total Environ. 621, 1163–1175. doi:10.1016/j.scitotenv.2017.10.111
Sassa, K., Fukuoka, H., Wang, F., and Wang, G. (2007). “Landslides Induced by a Combined Effect of Earthquake and Rainfall,” in “Landslides Induced by a Combined Effect of Earthquake and Rainfall,” in Progress in Landslide Science. Editors K. Sassa, H. Fukuoka, F. Wang, and G. Wang (Berlin, Heidelberg: Springer Berlin Heidelberg)), 193–207. doi:10.1007/978-3-540-70965-7_14
Sayre, R., Dangermond, J., Frye, C., Vaughan, R., Aniello, P., Breyer, S., et al. (2014). A New Map of Global Ecological Land Units-An Ecophysiographic Stratification Approach. Washington, DC: Assoc. Am. Geogr.
Schwarz, M., Lehmann, P., and Or, D. (2010). Quantifying Lateral Root Reinforcement in Steep Slopes - from a Bundle of Roots to Tree Stands. Earth Surf. Process. Landforms 35, 354–367. doi:10.1002/esp.1927
Shafique, M. (2020). Spatial and Temporal Evolution of Co-seismic Landslides after the 2005 Kashmir Earthquake. Geomorphology 362, 107228. doi:10.1016/j.geomorph.2020.107228
Shou, K. J., Hong, C. Y., Wu, C. C., Hsu, H. Y., Fei, L. Y., Lee, J. F., et al. (2011). Spatial and Temporal Analysis of Landslides in Central Taiwan after 1999 Chi-Chi Earthquake. Eng. Geology. 123, 122–128. doi:10.1016/j.enggeo.2011.03.014
Tang, C., Van Westen, C. J., Tanyas, H., and Jetten, V. G. (2016). Analysing post-earthquake Landslide Activity Using Multi-Temporal Landslide Inventories Near the Epicentral Area of the 2008 Wenchuan Earthquake. Nat. Hazards Earth Syst. Sci. 16, 2641–2655. doi:10.5194/nhess-16-2641-2016
Tanyaş, H., Kirschbaum, D., and Lombardo, L. (2021). Capturing the Footprints of Ground Motion in the Spatial Distribution of Rainfall-Induced Landslides. Bull. Eng. Geol. Environ. 80, 4323. doi:10.1007/s10064-021-02238-x
Tanyaş, H., and Lombardo, L. (2019). Variation in Landslide-Affected Area under the Control of Ground Motion and Topography. Eng. Geol. 260, 105229. doi:10.1016/j.enggeo.2019.105229
Tanyas, H., Rossi, M., Alvioli, M., van Westen, C. J., and Marchesini, I. (2019). A Global Slope Unit-Based Method for the Near Real-Time Prediction of Earthquake-Induced Landslides. Geomorphology 327, 126–146. doi:10.1016/j.geomorph.2018.10.022
Tian, Y., Owen, L. A., Xu, C., Ma, S., Li, K., Xu, X., et al. (2020). Landslide Development within 3 Years after the 2015 Mw 7.8 Gorkha Earthquake, Nepal. Landslides 17, 1251–1267. doi:10.1007/s10346-020-01366-x
Watkinson, I. M., and Hall, R. (2019). Impact of Communal Irrigation on the 2018 Palu Earthquake-Triggered Landslides. Nat. Geosci. 12, 940–945. doi:10.1038/s41561-019-0448-x
Wistuba, M., Malik, I., Krzemień, K., Gorczyca, E., Sobucki, M., Wrońska-Wałach, D., et al. (2018). Can Low-Magnitude Earthquakes Act as a Triggering Factor for Landslide Activity? Examples from the Western Carpathian Mts, Poland. CATENA 171, 359–375. doi:10.1016/j.catena.2018.07.028
Worden, C. B., and Wald, D. J. (2016). ShakeMap Manual Online: Technical Manual, User’s Guide, and Software Guide. Golden, Colorado: U. S. Geological Survey. doi:10.5066/F7D21VPQ
Xiong, J., Tang, C., Chen, M., Zhang, X., Shi, Q., and Gong, L. (2020). Activity Characteristics and Enlightenment of the Debris Flow Triggered by the Rainstorm on 20 August 2019 in Wenchuan County, China. Bull. Eng. Geol. Environ. 80, 873–888. doi:10.1007/s10064-020-01981-x
Xu, C. (2015). Preparation of Earthquake-Triggered Landslide Inventory Maps Using Remote Sensing and GIS Technologies: Principles and Case Studies. Geosci. Front. 6, 825–836. doi:10.1016/j.gsf.2014.03.004
Yang, W., Qi, W., Wang, M., Zhang, J., and Zhang, Y. (2017). Spatial and Temporal Analyses of post-seismic Landslide Changes Near the Epicentre of the Wenchuan Earthquake. Geomorphology 276, 8–15. doi:10.1016/j.geomorph.2016.10.010
Yunus, A. P., Fan, X., Tang, X., Jie, D., Xu, Q., and Huang, R. (2020). Decadal Vegetation Succession from MODIS Reveals the Spatio-Temporal Evolution of post-seismic Landsliding after the 2008 Wenchuan Earthquake. Remote Sensing Environ. 236, 111476. doi:10.1016/j.rse.2019.111476
Keywords: landslide, earthquake, precipitation, landslide recovery, post-seismic landslides
Citation: Tanyaş H, Kirschbaum D, Görüm T, van Westen CJ and Lombardo L (2021) New Insight into Post-seismic Landslide Evolution Processes in the Tropics. Front. Earth Sci. 9:700546. doi: 10.3389/feart.2021.700546
Received: 26 April 2021; Accepted: 22 June 2021;
Published: 06 July 2021.
Edited by:
Carmine Galasso, University College London, United KingdomReviewed by:
Joern Lauterjung, German Research Center for Geosciences, GermanyMariano Di Napoli, University of Genoa, Italy
Copyright © 2021 Tanyaş, Kirschbaum, Görüm, van Westen and Lombardo. This is an open-access article distributed under the terms of the Creative Commons Attribution License (CC BY). The use, distribution or reproduction in other forums is permitted, provided the original author(s) and the copyright owner(s) are credited and that the original publication in this journal is cited, in accordance with accepted academic practice. No use, distribution or reproduction is permitted which does not comply with these terms.
*Correspondence: Hakan Tanyaş, aC50YW55YXNAdXR3ZW50ZS5ubA==
†ORCID: Hakan Tanyaş, orcid.org/0000-0002-0609-2140; Dalia Kirschbaum, orcid.org/0000-0001-5547-2839; Tolga Görüm, orcid.org/0000-0001-9407-7946; Cees J. van Westen orcid.org/0000-0002-2992-902X; Luigi Lombardo, orcid.org/0000-0003-4348-7288