 Sebastián Vivero
 Hanne Hendrickx3
 Amaury Frankl
 Reynald Delaloye
 Christophe Lambiel
- 1Institute of Earth Surface Dynamics, University of Lausanne, Lausanne, Switzerland
- 2Department of Geosciences/Geography, University of Fribourg, Fribourg, Switzerland
- 3Department of Geography, Ghent University, Ghent, Belgium
- 4INRAE, AMAP, IRD, CIRAD, CNRS, University of Montpellier, Montpellier, France
Accurately assessing landform evolution and quantifying rapid environmental changes are gaining importance in the context of monitoring techniques in alpine environments. In the European Alps, glaciers and rock glaciers are among the most characteristic cryospheric components bearing long and systematic monitoring periods. The acceleration in rock glacier velocities and the onset of destabilization processes, mainly since 1990, have raised several concerns due to the potential effects on the high alpine natural and anthropic environments. This study presents a combination of uncrewed aerial vehicle (UAV) and terrestrial laser scanning (TLS) surveys for monitoring the current changes on the quickly accelerating, destabilised Tsarmine rock glacier in the Arolla Valley, Western Swiss Alps, delivering a considerable volume of debris to a steep torrential gully. High-resolution digital elevation models (DEMs) and orthomosaics are derived from UAV image series combined with structure from motion (SfM) photogrammetry techniques. Multitemporal orthomosaics are employed for measuring spatially continuous rock glacier kinematics using image matching algorithms. Superficial displacements are evaluated with simultaneous in-situ differential global navigation satellite system (GNSS) measurements. Elevation and volume changes are computed from TLS and UAV-derived DEMs at similar periods. Between June 2017 and September 2019, both datasets showed a similar elevation change pattern and surface thinning rates of 0.15 ± 0.04 and 0.16 ± 0.03 m yr−1, respectively. Downward of a rupture zone developing about 150 m above the front, the rock glacier doubled its overall velocity during the study period, from around 5 m yr−1 between October 2016 and June 2017 to more than 10 m yr−1 between June and September 2019. The kinematic information reveals striking differences in the velocity between the lower and upper rock glacier sections. The monitoring approach based on close-sensing techniques provides accurate surface velocity and volume change information, allowing an enhanced description of the current rock glacier dynamics and its surface expression.
Introduction
Rock glaciers represent one of the most iconic and abundant landforms of the mountain permafrost realm (Barsch, 1996; Jones et al., 2018). As conspicuous periglacial landforms, they have been regarded as valuable indicators of past and present permafrost conditions in different mountain ranges (Konrad et al., 1999; Kellerer-Pirklbauer et al., 2008; Sorg et al., 2015; Winkler and Lambiel, 2018; Steinemann et al., 2020). The dynamics of rock glaciers includes not only the acting forces on the creeping body but also the 3-D changes over time (Kääb, 2005). Whereas the former can only be derived from modelling approaches, the latter (i.e., kinematics) can be monitored by different remote sensing and in-situ measurements (Haeberli et al., 2006). As such, superficial displacements are expected to reflect mainly the creep of the permafrost body inside the rock glacier (Arenson et al., 2002). This creeping process is dominated by the high deformation rate at the shear horizon, which accommodates a large portion of the observable surface displacement (60–90%), and it is usually located at a depth of 10–30 m from the surface (Wagner, 1992; Arenson et al., 2002; Haeberli et al., 2006; Krainer et al., 2015; Cicoira et al., 2021).
Rock glacier kinematics are commonly derived from consecutive acquisition epochs, forming different time series of seasonal, annual, and decadal observation periods (Kääb et al., 2007; Delaloye et al., 2010). One of the first monitoring efforts goes back to the summer of 1938 at the outer Hochebenkar in the Ötztal Alps of Western Austria (Schneider and Schneider, 2001; Hartl et al., 2016). Subsequently, systematic kinematic monitoring programs were initiated in 1979 at the Laurichard rock glacier in the French Alps (Francou and Reynaud, 1992; Bodin et al., 2009); and in 1995 at the Dösen rock glacier in the Hohe Tauern Range of the central Austrian Alps (Kaufmann, 2016; Kellerer-Pirklbauer et al., 2017). Wahrhaftig and Cox (1959) reported rock glacier kinematics measurements between 1949 and 1957 in their seminal work on the Alaska Range’s rock glaciers. Early but intermittent rock glacier kinematics surveys in the Southern Hemisphere were performed in the summer of 1970 at the Pedregoso rock glacier in the Chilean Andes (Marangunic, 1976). Later, kinematic monitoring efforts were reported between 2012 and 2016 from the Varas rock glacier in the Andes of northwestern Argentina (Martini et al., 2017). In the Swiss Alps, particularly under the Swiss Permafrost Monitoring Network (PERMOS) coordination, continuous and systematic long-term kinematics data series have been obtained for several rock glaciers as early as 1994 at the Gemmi/Furggentälti rock glacier (PERMOS, 2019a). These time series consist mainly of data from annual surveys derived from in-situ measurements (i.e., total station and differential GPS), providing an updated picture of the overall state of rock glacier kinematics. The wealth of such systematic observations have revealed strong correlations of relative velocities changes on an interannual basis for a majority of rock glaciers, and consequently, their association with changes in the thermal state of permafrost (Roer et al., 2005; Delaloye et al., 2008; Kellerer-Pirklbauer et al., 2018).
Reported rock glacier superficial velocities have ranged from a few centimetres to some metres per year (Barsch, 1996; Delaloye et al., 2010; Janke et al., 2013), but, for very fast rock glaciers, the velocities can reach several metres per year (Valenzuela, 2004; Hartl et al., 2016) up to more than 50 m per year (Delaloye et al., 2013; Eriksen et al., 2018). Rapid acceleration and longitudinal extension develop surface disturbances (e.g., cracks, crevasses and scarps) as signs of the so-called landform destabilization (Delaloye et al., 2013; Marcer et al., 2019; Vivero and Lambiel, 2019; Marcer et al., 2020; RGIK, 2022). In this context, the main factors of rock glacier acceleration and destabilization have been attributed to permafrost degradation due to increased atmospheric warming (Roer et al., 2005; Roer et al., 2008; Deline et al., 2015; Bodin et al., 2017), and by related feedback mechanisms such as increasing water content (Ikeda et al., 2008; Wirz et al., 2016; Buchli et al., 2018; Cicoira et al., 2019). Likewise, mechanical overload caused by rockfall deposits (Delaloye et al., 2013; Scotti et al., 2017) or artificial overload by mining waste deposits (Valenzuela, 2004) have also been identified as triggers of rock glacier destabilization.
Rock glacier kinematics have been traditionally measured by ground surveying techniques such as theodolite or total station instruments (Francou and Reynaud, 1992; Koning and Smith, 1999), differential GPS (Berthling et al., 1998), differential real-time kinematic (RTK) GPS (Lambiel and Delaloye, 2004) and permanent GPS stations (Wirz et al., 2016; Buchli et al., 2018). Nevertheless, remote sensing techniques such as aerial photogrammetry (Groh and Blöthe, 2019), high-resolution optical satellite imagery (Necsoiu et al., 2016; Blöthe et al., 2021), satellite radar interferometry (InSAR, Rignot et al., 2002; Strozzi et al., 2020) and airborne laser scanning (ALS, Bollmann et al., 2015) have become more broadly employed in recent years, mainly due to their ability to monitor vast and remote regions. In a recent study, Kääb et al. (2021) have pioneered the combination of high-resolution optical and radar data to reconstruct the kinematics of several rock glaciers in a remote region of central Asia since the 1950s. Since the earliest examples of permafrost creep measurements extracted from analogue photogrammetry (e.g., Messerli and Zurbuchen, 1968), the quality and availability of remote sensing datasets have allowed a substantial evolution to be achieved in rock glacier research (Kaufmann, 1998; Kääb and Vollmer, 2000; Müller et al., 2016; Cusicanqui et al., 2021).
The rapid development of uncrewed aerial vehicle (UAV) systems has opened up significant new applications in the field of remote sensing due to their comparably lower prices and high customised settings (Nex and Remondino, 2014; Carbonneau and Dietrich, 2017; Cook, 2017). Alongside, new developments in the domain of image processing and photogrammetric techniques, such as structure from motion (SfM), have burgeoned during the last years (James and Robson, 2012; Westoby et al., 2012; Smith et al., 2016; Anderson et al., 2019). As such, the so-called UAV-SfM photogrammetric workflows have been used in different domains, such as the monitoring of landslide kinematics (Lucieer et al., 2013; Clapuyt et al., 2017) and for studying glacial (Ryan et al., 2015; Fugazza et al., 2018; Rossini et al., 2018; Benoit et al., 2019) and periglacial processes (Eichel et al., 2020; Hendrickx et al., 2020), among other applications. Until now, only a few study cases have reported on rock glacier monitoring by relying exclusively on UAV-SfM techniques (Dall’Asta et al., 2017; Vivero and Lambiel, 2019; Halla et al., 2021; Bearzot et al., 2022) or by a combination of UAV-SfM with additional remote sensing data (Kaufmann et al., 2018; Groh and Blöthe, 2019; Fey and Krainer, 2020; Blöthe et al., 2021).
In the context of rapid rock glacier acceleration and destabilization, accurate and self-sufficient monitoring techniques are desirable to reveal previously unseen changes. Likewise, despite the popularity of image matching techniques and the necessity for well-constrained uncertainties associated with the displacements derived from high-resolution UAV datasets, studies incorporating an evaluation of the accuracy based on independent and concurrent in-situ measurements remain rare. The aims of this study are twofold: 1) to document the kinematics of a destabilised rock glacier using high-resolution UAV surveys and to evaluate its quality by employing kinematic data obtained from terrestrial geodetic surveys (TGS); and 2) to highlight rapid geomorphic and surface destabilization changes in steep alpine terrain combining UAV and terrestrial laser scanning (TLS) surveys. To achieve this, we have performed repeated and simultaneous UAV and global navigation satellite system (GNSS) surveys at the Tsarmine rock glacier (Swiss Alps) from 2016 to 2019. Additionally, TLS surveys acquired at similar periods with the primary goal of documenting the sediment budget in the gully downwards of the rock glacier front (Kummert and Delaloye, 2018) are employed to complement the monitoring effort as the rock glacier surface is also captured in the TLS data. The close-range sensing approach allows for detailed rock glacier kinematic and surface change information, which helps better document the rapid mass wasting occurring on a destabilised rock glacier over three years.
Material and methods
Site description
The Tsarmine rock glacier (46°02′ N, 7°30′ E) is located in the Arolla Valley, Western Swiss Alps (Lambiel, 2021). The morphology corresponds to a long tongue-shaped form, displaying 550 m long and 120 m wide, and with an altitudinal range between 2470 (terminus) and 2700 (rooting zone) m a.s.l. (Figure 1). The rock glacier front is truncated, meaning the continuous crumbling of its front supplies a steep torrential gully in debris (Kummert and Delaloye, 2018). This active landform sits close to the regional lower limit of discontinuous permafrost in the area (Deluigi et al., 2017). Furthermore, geoelectrical surveys on the rock glacier and its connecting talus slope indicate that the active layer thickness ranges between 3 and 5 m, whereas the frozen body thickness reaches 15 m at least (Lambiel, 2006).
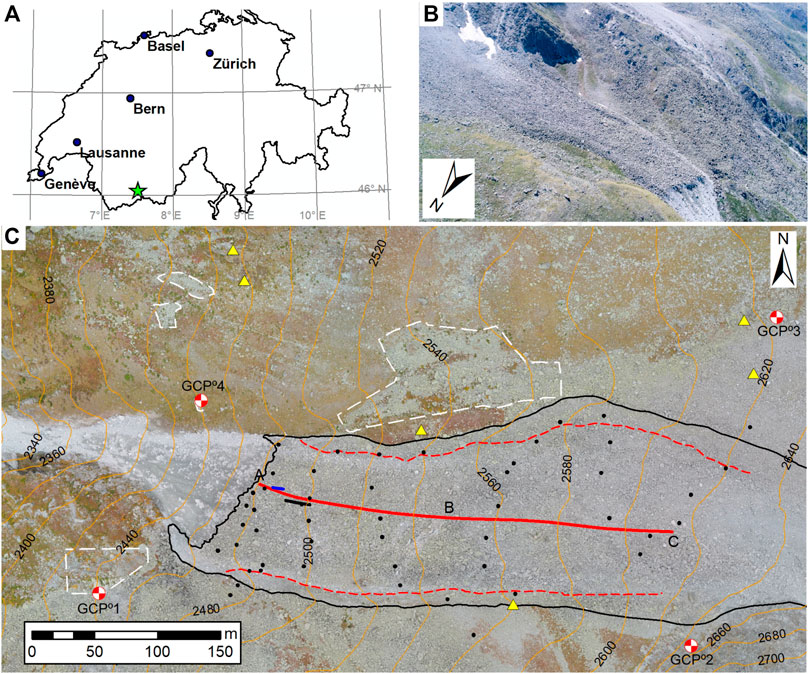
FIGURE 1. Overview of the Tsarmine rock glacier and its surveying setting. (A) Location of the rock glacier within the Western Swiss Alps (green star). (B) Oblique aerial image from Tsarmine in June 2017. (C) UAV-derived orthomosaic from September 2019. Black thin line corresponds to the rock glacier outline in 2019. White dashed areas correspond to the stable sectors without the significant vegetation used for the uncertainty evaluation during the image matching step (Surface Movements Derived from Sequential Orthomosaics Section). Blue and black thick lines correspond to the permanent GNSS station trajectories between 2016.01–2017.06 and 2017.06–2020.01, respectively. Red and dashed lines correspond to the location of the longitudinal velocity profiles (A, B, and C, Figure 5) and the lateral levees, respectively. Black dots and yellow triangles correspond to the rock glacier kinematics and TGS-CPs (stable points) network, respectively.
Sub-metric rocks to metric-sized boulders from an orthogneiss lithology (Arolla series) are abundant on the surface (“bouldery rock glacier” sensu Ikeda and Matsuoka 2006), whereas finer matrix sediments are visible at the steep front (Figure 1). Webcam images indicate that the main shear horizon is about 15 m below the front line edge (Kummert et al., 2018). Due to the absence of compression, the rock glacier surface is devoid of the “classical” ridge and furrow morphology (Frehner et al., 2015), but it displays protruding lateral margins or levees (Figure 1). Transverse scarps have developed since about 2015 in the median part of the rock glacier, where the slope is becoming steeper. Based on TLS surveys, Micheletti et al. (2017) indicated that between 2014 and 2015, the rock glacier terminus was providing sediments to the downstream gully in the order of ∼1500 m3 yr−1. Subsequently, and based on TLS surveys, Kummert and Delaloye (2018) calculated that between 2015 and 2016, the sediment transfer rate was about 3500 m3 yr−1.
Based on the analysis of archival aerial imagery, Micheletti et al. (2015) showed an acceleration of the Tsarmine rock glacier from 0.3 to more than 2 m yr−1 between 1967 and 2005. Between the beginning of the TGS measurements in 2004 and until 2012, mean annual surface velocities were around 2 m yr−1 (PERMOS, 2013). More recent TGS reveal a marked acceleration, with velocities of 4 m yr−1 between 2014 and 2016 and peaks up to 6 m yr−1 in 2016 (PERMOS, 2019a). In 2019/20, annual velocities reached 12 m yr−1 (PERMOS, 2019b). Additionally, a permanent mono-frequency GNSS station with hourly resolution captured a peak monthly velocity of up to 22 m yr−1 in October 2020 (unpublished data). Such high velocities are a clear sign of rock glacier destabilisation (Roer et al., 2008; Delaloye et al., 2010), and therefore, their development since the early 2010s no longer fits with the behaviour of the ensemble of rock glaciers velocities in this part of the Swiss Alps (PERMOS, 2019a). Aside from TGS surveys, monitoring activities performed in conjunction between the universities of Fribourg (UNIFR) and Lausanne (UNIL) also include the monitoring of ground surface temperatures, hourly acquisition of images by webcam devices (Kummert et al., 2018) and biannual TLS surveys of the rock glacier terminus and the subjacent gully since 2013 (Kummert and Delaloye, 2018).
Terrestrial geodetic surveys
The rock glacier kinematics have been measured biannually (early summer and autumn) at 58 points distributed along sub-parallel lines since 2004 (Figure 1). Additionally, six fixed checkpoints (TGS-CPs) on stable terrain outside the rock glacier are measured during each survey to cross-assess the consistency of the positional error. Their position was surveyed using either a Trimble R10 or a Leica GS10 differential GNSS setups (rover and base). The survey style follows the protocol elaborated by Lambiel and Delaloye (2004), employing differential GNSS devices with the RTK technique for rapid measurements over large areas. The positioning error usually lies in the 1–2 cm range in the horizontal coordinates but may rise to more than 2 cm in the elevation component. Additionally, a Post-Processing Kinematic (PPK) treatment was conducted on the Trimble R10 raw data using Trimble Business Center (TBC) v4 surveying software, linking our base station with the permanent base station in Zermatt from the Automatic GNSS Network for Switzerland (AGNES). This procedure also aided in evaluating the stability of the base station between 2016 and 2019.
Due to the loss of individually marked boulders at the rock glacier front and the inability to measure some markers covered by snow, we procured 35 points measured at the exact date (except for October 2016) of the UAV surveys (Table 1). We also measured four additional permanent ground control points (GCPs) located outside the rock glacier (Figure 1) and several checkpoints (UAV-CPs) during nearly each field campaign since 2017 (Table 2). The four permanent GCPs deployed in the field before October 2016 were employed during the UAV imagery processing to improve the SfM results and for a better co-alignment between UAV and GNSS surveys (Forlani et al., 2018). Moreover, the stability of those GCPs was confirmed with repeated measurements in October 2018 and September 2020.
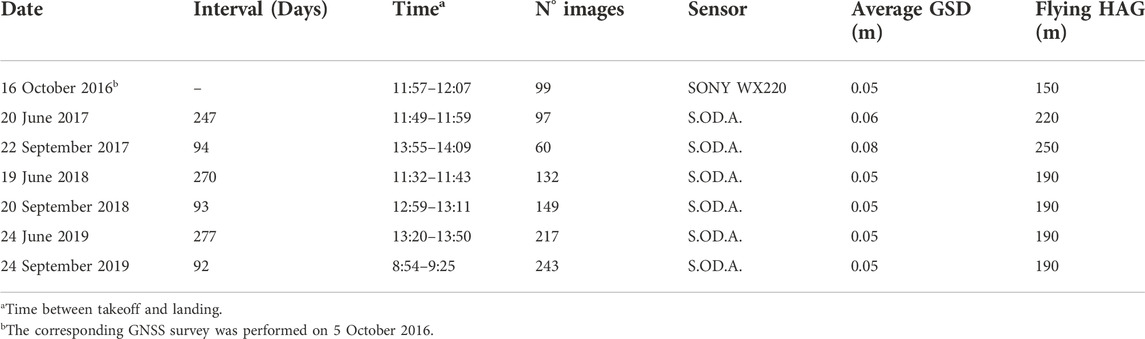
TABLE 1. Details of the UAV surveys of Tsarmine rock glacier.
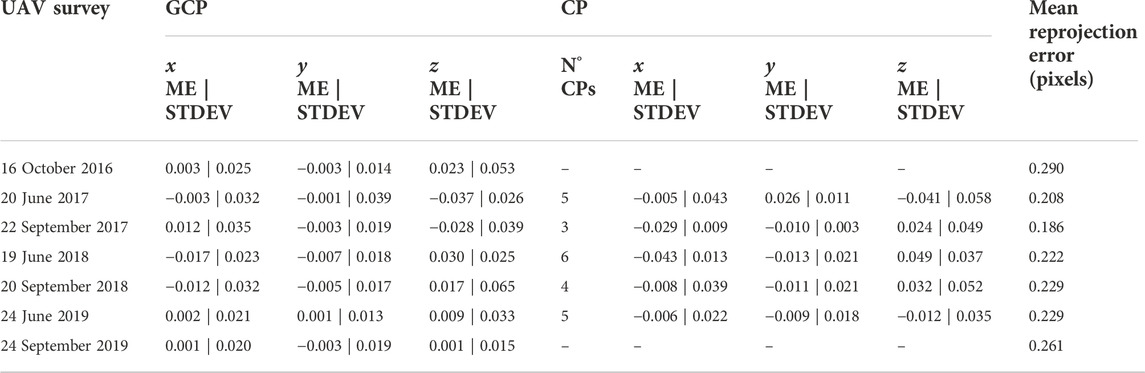
TABLE 2. UAV block orientation values using the same four ground control points (GCPs, see Figure 1) and a variable quantity of UAV-CPs located on the rock glacier surface. The mean error (ME) and standard deviation (STDEV) in x, y and z coordinates (in meters) are indicated for each UAV survey.
UAV surveys
The operation of UAV systems is often challenging in steep mountainous terrain. The UAV device must keep an elevation above the ground low enough to have a good high ground sampling density, but safe enough to avoid a potential collision with obstacles. Since October 2016, seven UAV surveys have been deployed using a lightweight SenseFly eBee RTK device (Table 1). This fixed-wing UAV is equipped with a built-in GNSS L1 and L2 signals antenna and with the capability of RTK differential corrections employing either a GNSS base station or a virtual reference station (VRS). Two digital cameras, a Sony WX220 18.2 megapixel (MP) with a 4.5 mm focal length (only available for the 2016 survey) and a SenseFly Sensor Optimised for Drone Applications (S.O.D.A.) 20 MP with a 10.5 mm fixed focal length were employed for the ensemble of UAV surveys. Nominal geo-tags using the RTK corrections stored in the image metadata are quoted to achieve around 3 cm horizontal and 5 cm vertical precision (i.e., camera positions). The UAV camera orientation values (Roll, Pitch, and Yaw angles) recorded by the Inertial Measurement Unit (IMU) device have low accuracy, hampering a reliable block orientation by the direct sensor orientation (DSO) method. Likewise, independent tests using different combinations of GCPs have found that the RTK position accuracies using this UAV device are mostly too optimistic, suggesting that some sort of ground or check control should be included during the image block orientation (Benassi et al., 2017).
UAV missions were planned and deployed using the SenseFly eMotion 3 software installed on a portable field computer. The flight missions were designed with a longitudinal overlap of 80% and a side overlap of 70%, giving a mean of five overlapping images for every point reconstructed throughout the surveyed area. The VRS was configured to acquire broadcasted differential corrections from the AGNES service using an RTCM 3.1 protocol. The eBee RTK was hand-launched by the operator, who monitored the flight plan, observed the UAV system, and managed the landing in a small flat area with alpine grass near the rock glacier (see Supplementary Figure S1). Moreover, and due to variable steep mountain terrain, each UAV survey was performed at a constant height above the ground (HAG) with the aid of the SwissALTI3D digital elevation model (DEM) loaded in the eMotion 3 planning step. In our study area, this DEM has a pixel size of 2 m and a vertical accuracy of ± 1–3 m (Swisstopo, 2018). Due to adjustments in the original flight plan caused by different cameras and crosswinds, the HAG fluctuated between 150 and 250 m (Table 1). The resulting ground sample distance (GSD) associated with these different HAG configurations ranged from 0.05 m to 0.08 m (Table 1).
TLS surveys
The TLS surveys were primarily designed to determine the sediment budget in the gully downwards of the rock glacier front, and on the latter, the time series started already in 2013 (Kummert and Delaloye, 2018). The entire rock glacier is also scanned and used in this study despite the topographic occlusion (shadow effect) caused by the almost horizontal illumination angle and the surface roughness of the rock glacier. We have considered the TLS surveys acquired biannually between June 2017 and September 2019 (see Supplementary Table S1) for the present study, using an ultra-long range Riegl VZ-6000 LiDAR system. This robust active sensing device has proven reliable performance in high mountain research due to its long effective range over different natural surfaces (Gabbud et al., 2015; Fischer et al., 2016; Pętlicki et al., 2017). During each TLS survey, two scan positions were combined from the other side of the Arolla Valley, nearly 4 km from the rock glacier front.
Data processing
Surface movements from GNSS surveys
Surface movements were calculated from the TGS by measuring the 2-D component of kinematic points at two sequential surveys. The corresponding horizontal displacements were calculated from the x and y coordinates in terms of the Revised Swiss Reference System (CH1903 + LV95) as
where ∆x and ∆y are components of the horizontal displacement in easting and northing coordinates, respectively. The resulting displacements were transformed to velocities in metres per year based on the time interval between the consecutive surveys (see Table 1). During the PPK treatment of the GNSS data acquired with the Trimble R10 equipment, the standard deviation errors of the x and y coordinates fluctuated between 1 and 3 cm, whereas errors of the z coordinate fluctuated between 1.5–4 cm. However, technical difficulties hampered the PPK treatment of the raw GNSS data acquired during the TGS with the LEICA GS10 equipment. Therefore, the standard deviation errors of the x, y and z coordinates were estimated based on the surveyed positions obtained for the six fixed points (Figure 1) during each TGS campaign. Thus, the uncertainty of each displacement was calculated using a rigorous estimation of the standard deviation of
where
SfM photogrammetric workflow
Recent improvements in photogrammetric processing capabilities, together with advances in computer vision algorithms, have facilitated the emergence of SfM with multi-view stereo (MVS) workflows. These developments have been capitalised by several open source and commercial SfM software packages, such as MicMac, Agisoft Metashape, 3DF Zephyr and Pix4DMapper, among others (Smith et al., 2016). This study applied the SfM workflow implemented in the commercial software Pix4DMapper Pro version 4.4 (https://pix4d.com/pix4dmapper-pro/, last access: 4 June 2021). This software provides a straightforward pipeline processing from raw images acquired by UAV devices to point clouds and orthomosaic generation through mainly three steps (Figure 2A). It is acknowledged that the quality of point clouds and derived by-products (e.g., DEMs and orthomosaics) from UAV-SfM photogrammetric workflows depend on several geometric, physical and processing parameters (Eltner et al., 2016; Benassi et al., 2017; Goetz et al., 2018; Hendrickx et al., 2019; Sanz-Ablanedo et al., 2020); however, a thorough quantification of the influence of these parameters on the quality of the derived products is beyond the scope of this study.
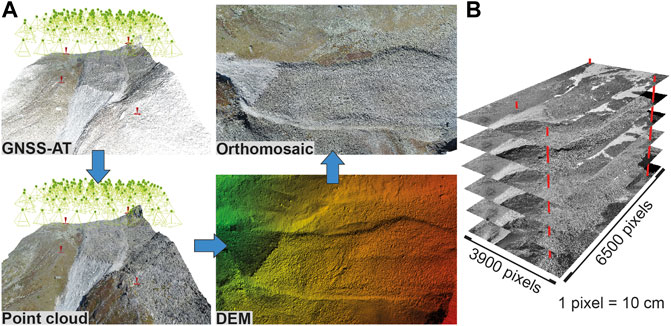
FIGURE 2. (A) SfM photogrammetric processing example from the UAV survey in June 2017. (B) Sequential SfM processing using four permanent GCP outside the rock glacier.
Primarily, a bundle block orientation of each set of raw images (Table 2) with their corresponding geolocation information (i.e., position and orientation values) was achieved using GNSS-supported aerial triangulation (GNSS-AT) and camera self-calibration methods (Benassi et al., 2017). The GNSS-AT used the initial geolocation information and four permanent GCPs next to the rock glacier (Figures 1, 2) to improve the initial values for the interior and exterior orientation parameters. In order to compensate for the geometric distortion caused by the complementary metal-oxide-semiconductor (CMOS) sensor in the Sony WX220 camera (2016 UAV survey), a rolling shutter camera model was applied during the bundle block adjustment (Vautherin et al., 2016). The camera self-calibration parameters such as principal point, focal length, radial and tangential distortion were consistent for all surveys using the same camera device. The mean reprojection error for each bundle block adjustment was small (Table 2), less than one-third of the native sensor pixel size in all settings. For the UAV surveys between June 2017 and June 2019, an additional set of checkpoints (UAV-CP) was employed to independently assess the quality of the bundle block orientation (Table 2). During the second step, the suitable image contrast and texture presented on the rock glacier surface facilitated the tie point extraction by feature matching algorithms with a scale-invariant feature transform (SIFT) operator (Lowe, 2004). A coarse 3-D point cloud is constructed from these tie points, and MVS methods are employed to reconstruct a densified 3-D point cloud (Carrivick et al., 2016; Smith et al., 2016). Average point densities ranged from 201 pt m−3 in June 2017 to 500 pt m−3 in June 2019. During the final step, the densified 3-D point clouds are gridded into seamless DEMs using an Inverse Distance Weighted (IDW) interpolator, whereas the ensemble of oriented images is orthorectified and mosaicked to generate true-distance colour orthomosaics at 0.1 m pixel size.
TLS workflow
The point cloud time series were post-processed using the RiScanPro® software version 3.3.438. Data were registered relatively to each other in a local coordinate system using the first scan of assumed stable geomorphological areas as a reference, such as those developed by Kummert and Delaloye (2018). The residuals of the corresponding stable areas between the reference and registered scans showed Gaussian distributions for all scans after the multi-station adjustment. Subsequently, the data from two scan positions were combined using an octree filter to obtain a new point cloud with a homogenized point density. An average co-registration error of 0.12 m was achieved (see Supplementary Table S1). After interpolation of these point clouds, six sequential DEMs with a resolution of 0.20 m were obtained. For more details about the TLS surveys at the Tsarmine rock glacier, we refer to Kummert and Delaloye (2018).
Surface movements derived from sequential orthomosaics
Image matching using a normalised cross-correlation (NCC) function on CIAS software (Kääb and Vollmer, 2000; Heid and Kääb, 2012) was applied to sequential orthomosaics (obtained from the previous section) covering the Tsarmine rock glacier and its environs. This procedure relies on the heterogeneity produced by the shape and size of the boulders at the rock glacier surface, providing high-quality contrasting and persistent targets. One of the main benefits of the NCC implemented in the spatial domain is its ability to better compare sequential images with different illumination conditions (Heid and Kääb, 2012). Basically, the NCC matches homologous points from the moving surface by correlating a window of reference pixel values (8-bit greyscale image) sampled from an initial image at time step 1 with a larger search window area contained in an overlapping image at time step 2. Cross-correlation values are calculated for potential homologous points of the reference window within the search window. The homologous point that obtains the highest correlation value is established to be the new point location, and therefore the 2-D displacement, from time 1 to time 2 (Kääb and Vollmer, 2000).
Horizontal surface displacements covering the Tsarmine rock glacier were derived from consecutive orthomosaics. The original orthomosaics were resampled to one-tenth of the original pixel size (i.e., 0.01 m) to achieve displacements at sub-pixel precisions (Debella-Gilo and Kääb, 2011). Surface points for image matching were regularly spaced within the landform boundaries based on a 10 m sampling grid in an Eulerian framework. A reference window (initial orthomosaic) of 128 × 128 pixels and a search window (subsequent orthomosaic) of 256 × 256 pixels were found suitable to compute surface displacements from a few centimetres up to around 13 m. Before applying CIAS, large sections with seasonal snow cover were masked out due to its interference in tracking surface boulders accurately. Also, the high mountain relief can cast significant shadows, but this effect was only observed in the rooting zone and the deep gully section below the rock glacier (both areas located outside the analysed surface). Furthermore, surface vectors were visually inspected considering the primary orientation and the slope gradient on the rock glacier, and obvious outliers were manually removed. Nevertheless, the percentage of spurious mismatches was below 5% of the total matches for all periods. An ordinary kriging interpolation was applied to single data voids (i.e., one or two consecutive mismatches) to fill the data gaps in our data.
An evaluation of the relative accuracy between sequential orthomosaics and the associated error using the NCC function was performed using a Helmert similarity transform available on CIAS (Kääb, 2021) on stable sectors near the Tsarmine rock glacier (Figure 1C). The delineation of the stable ground was based on the previous work done by Kummert and Delaloye (2018), who thoroughly assessed three stable sectors with repeated TLS surveys between 2013 and 2016. Nevertheless, TGS measurements revealed that the narrow and elongated southern stable sector had moved at about 0.15 m yr−1 between 2016 and 2019. Therefore, this sector was excluded during the orthomosaic evaluation. Estimates of the directional variance and the systematic (bias) errors were calculated for the consecutive orthomosaic pairs using between 62 and 69 (Table 3) stable rock surfaces circumscribed to the reassessed stable sectors (Figure 1C). The Helmert similarity transform can detect systematic rotations, translation (x-y-shift vector), and scale differences between the orthomosaics. However, we found neither scale nor rotation differences between the consecutive orthomosaics, thus demonstrating the horizontal positional quality of the SfM-derived products. Removing the systematic x-y-shift vector from the CIAS measurements provided a bias-free overall displacement. Similarly to Eq. 2, the uncertainty of the derived horizontal displacements using CIAS can be calculated, taking into account the NCC uncertainty’s anisotropy in both the x and y directions (Redpath et al., 2013). Furthermore, as the ∆x and ∆y have been corrected for the subpixel systematic (bias) errors (Table 3), the standard deviation for each displacement measured by CIAS is unique and follows:
where
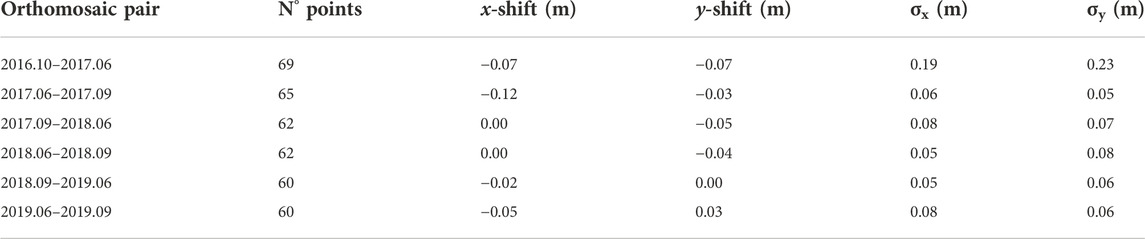
TABLE 3. Values obtained from the Helmert similarity transform available on CIAS between orthomosaic pair constituents. The points used for the evaluation are confined to the stable sectors (see Figure 1C).
Comparison with the TGS
The accuracy of the surface movements measured via UAV analyses was evaluated by comparing the displacements of 35 marked boulders, calculated as described in Surface movements from GNSS surveys Section. We employed the initial coordinates of each TGS point as additional points for sequential CIAS calculations for each period. In doing this, we sought to calculate the original CIAS displacements for the 35 boulders instead of interpolated values derived from the 10 m sampling grid. Furthermore, we applied the same combination of reference and search window sizes indicated in Surface Movements Derived from Sequential Orthomosaics Section. This combination constrained the detected displacements to a maximum limit of 13 m, nearly twice the maximum displacement estimated from the visual inspection of the sequential orthomosaics. Uncertainties in both the UAV-derived and reference values were provided by Eqs 2 and 3, respectively.
DEM assessment and elevation change analyses
The mean and standard deviation errors from the bundle bloc orientation (Table 2) provide the overall quality of the UAV-SfM-derived products. However, to further test the derived DEMs’ elevation component, their accuracy was evaluated by comparing their modelled z coordinate to the measured z coordinate from between 36 and 45 TGS points measured (described in Terrestrial geodetic surveys Section) on the rock glacier surface at the same date (see Supplementary Table S2). This procedure also allowed us to determine the possibility of systematic elevation errors (e.g., doming, dishing, tilt or shifts), which have been extensively reported for SfM-derived datasets (James et al., 2017; Sanz-Ablanedo et al., 2020).
Elevation and volume changes were obtained by computing DEMs of differences (DoD) from the UAV and TLS surveys using the Geomorphic Change Detection (GCD) software (Wheaton et al., 2010). Because the errors on the DEMs are propagated during the calculation of the DoD, only significantly positive and negative elevation changes (including their volumetric derivatives) were retained. A high confidence interval (i.e., LoD at 90%) allowed distinguishing significant elevation changes between two DEMs (Wheaton et al., 2010; Clapuyt et al., 2017). Using the DoD analysis, surface elevation and volume changes were derived from the difference between the gain and loss of material. Consecutive estimates of volume change were computed at the front (2356 m2) and the main rock glacier (39,482 m2) surfaces (see Figure 7), where the accumulation and erosion patterns are expected to differ (see Kummert and Delaloye, 2018).
Results
Orthomosaics and DEM quality assessments
The analysis of the apparent displacement for stable rock surfaces shows the mean rigid translation (i.e., without rotation or distortion) between orthomosaic pairs in the x and y directions (Table 3). These shifts are minor and demonstrate the quality of sequential SfM processing based on the eBee RTK device and four permanent GCPs. The standard deviations for the 2016.10–2017.06 orthomosaic pair in the x and y components are larger than the rest of the orthomosaic pairs (Table 3). These more significant standard deviations can reflect the unfavourable conditions during the first UAV survey (October 2016). Large shadows and a thin sheet of snow covering several boulders at both the rock glacier and stable ground were present during this image acquisition, leading to significant degradation of the quality of the CIAS analysis that included this survey. Slightly dissimilar standard deviations in the x and y directions reveal a small anisotropy in the kinematic uncertainties for each study period.
The evaluation of the UAV-derived DEMs using simultaneous TGS points displays a slight bias in the elevation components (see Supplementary Table S2). For example, the difference between the DEM and the TGS points was primarily positive during the June 2017 UAV survey, indicating that the z coordinates measured by GNSS are usually lower than the z coordinates derived from the DEM. Positive and negative values are widespread during the September 2019 UAV survey, and there is no spatial structure in this bias (see Supplementary Figure S2).
The sequential TLS surveys reached point cloud densities of 25 pt m−3 at the rock glacier front and the upper gully. The entire rock glacier surface and its rooting zone were also scanned but with a lesser resolution due to the decrease of the incidence angle and the roughness of the bouldery surface (7 pt m−3). This also results in substantial topographic occlusion on the horizontal plane and can therefore explain the different volumetric results when using UAV-derived products, which do not experience this type of topographic occlusion (Table 6). The significant point cloud coregistration errors (Supplementary Table S1) can also explain differences in the volume calculations. Nevertheless, these statistics are satisfactory regarding the considerable scanning distance of 4 km and are similar to the results of Gabbud et al. (2015) using the same TLS on a similar distance.
Validation of the UAV-derived velocities
Velocities obtained by in-situ GNSS surveys and UAV-derived data were analysed in detail for five consecutive periods from October 2016 to June 2019. Technical difficulties with the Leica AS10 GNSS base antenna impeded measuring all kinematic points during the last UAV survey in September 2019. Therefore, the comparison between GNSS and UAV-derived velocities was not completed for the June–September 2019 period. The whole range of UAV-derived velocities clearly agreed with these points’ displacements as measured by GNSS surveys, with an R2 = 0.98–0.99 and RMSE = 0.007–0.033 m yr−1 (Figure 3). Individual outliers are primarily associated with kinematic points marked near the boulder edge. This is mainly because the cross-correlation tends to mismatch homologous points due to substantial geometry and lighting conditions changes. On the contrary, kinematics points installed near the boulder centre provide ideal cross-correlation targets for finding homologous points.
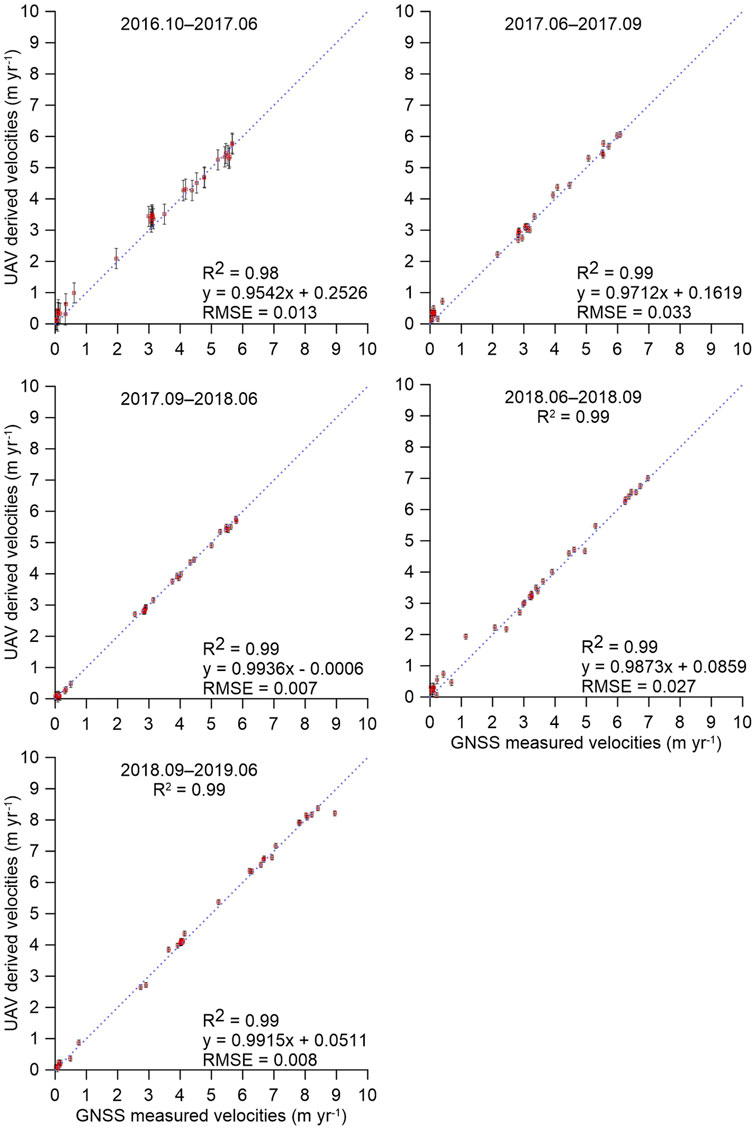
FIGURE 3. Scatterplots of five consecutive periods between velocities derived from UAV analysis and GNSS measurements on 35 kinematic points. The error bars show the calculated uncertainty for UAV-derived and GNSS measured velocities.
The individual LoDs calculated for each period (Table 4) displayed values ranging from 0.08 m (mainly for the 2017.06–2017.09 and 2018.06–2018.09 periods) up to 0.36 m (2016.10–2017.06 period). The large errors during the first period are associated with the lower matching quality of the corresponding orthomosaic pair (see Table 3). Still, values below LoD were concentrated at the northern and southern margins (levees), where the rock glacier surface is virtually stable (Figure 4).
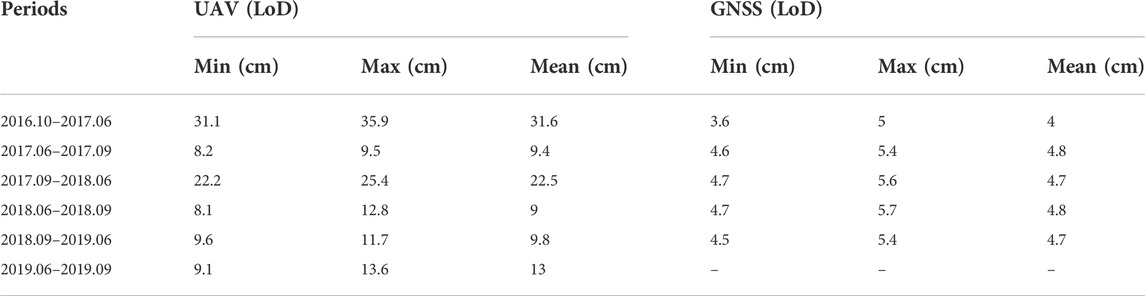
TABLE 4. Information on the minimum (Min), maximum (Max) and mean LoD (confidence limit of 90%) for each period.
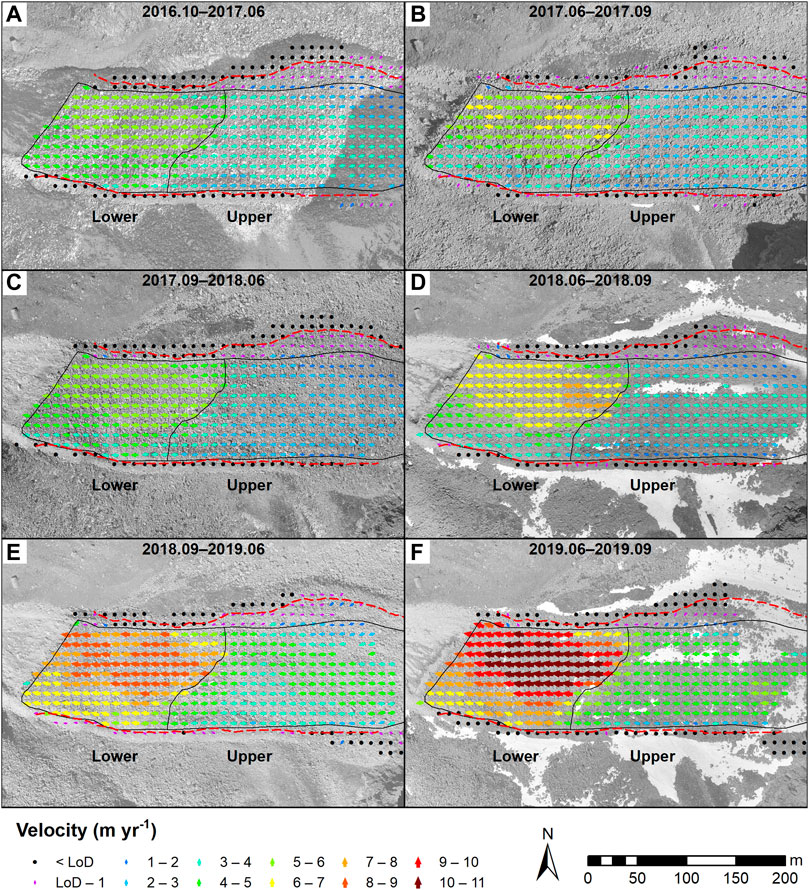
FIGURE 4. Maps of the horizontal surface velocities between 2016 and 2019. Background images correspond to the first orthomosaic used during each period of image matching. Black polygons correspond to the lower and upper sections, and red dashed lines correspond to the lateral levees.
Horizontal surface velocity fields
Spatially distributed surface velocity fields of the Tsarmine rock glacier between October 2016 and September 2019 are shown in Figure 4. Superficial velocities over 10 m yr−1 were measured during the last period analysed. The landform-wide velocity fields depict lateral shearing margins between the highly active central part and the mostly stagnant northern and southern levees (Figure 4). The velocities of both levees were below the LoD for most periods, but aside between September 2018 and June 2019, where the southern levee displayed mean velocities of 0.21 m yr−1 (Figure 4E) towards the west. Between 2016 and 2019, the broad surface flow field displays a rather persistent direction towards the west in the upper and lower sections, with mean values of 269° and 276°, respectively. A minor circular variance (i.e., how much vector directions deviate from the directional mean) with values approaching zero for each study period also confirms a relatively low variability of this persistent direction on the surface flow fields. This show that, even for a bouldery rock glacier moving between 5 and 10 m yr−1, the surface tends to be mostly not disturbed by the rapid motion rate.
Remarkably, and during the entire period from 2016 to 2019, a sharp discontinuity expressed morphologically by developing a scarp structure indicates the limit between two different kinematic units (shown as “B” in Figures 1, 5) with different temporal behaviours. The mean values for the horizontal surface velocity fields (excluding the levees zones, see Figure 4) on the lower section of the rock glacier, that is, the portion downstream of the scarp, ranged from 4.92 m yr−1 (2017.09–2018.06) to 8.74 m yr−1 (2019.06–2019.09), whereas upslope they ranged from 2.83 m yr−1 (2017.09–2018.06) to 4.43 m yr−1 (2019.06–2019.09). An almost continuous ratio decrease between the upper and lower sections (Table 5), passing from about 2/3 to 1/2 in 2.5 years, indicates the splitting of the rock glacier into two distinct parts (as reported from Grosse Grabe rock glacier in Delaloye et al., 2013). On the other hand, the mean surface displacements presented significant seasonal differences between the snow cover (October to mid-June) and snow-free (mid-June to late-September) periods. During the snow-free periods, displacement values share nearly a quarter of the yearly component of the surface displacement (Table 5). It is worth mentioning that these seasonal variations of rock glacier displacements are in line with those observed by in-situ methods (Delaloye and Staub, 2016).
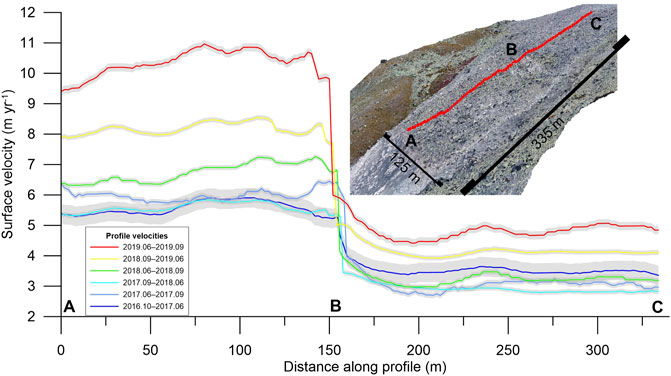
FIGURE 5. Longitudinal velocity profiles between 2016 and 2019 extracted from the red line shown on the inset (see Figure 1 for the plan view). The grey envelopes display the 90% confidence level (1.645×
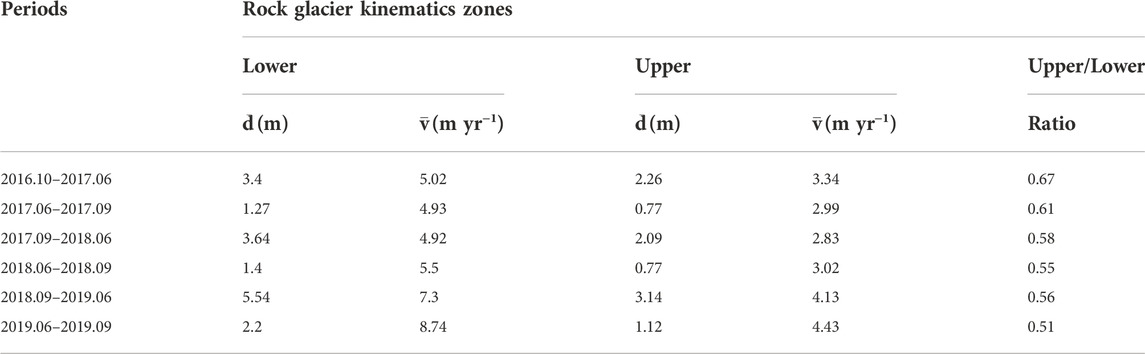
TABLE 5. UAV-derived mean horizontal displacements (
Front changes and scarp development
Aside from describing detailed surface velocity fields employing high-resolution orthomosaic pairs, the associated UAV-derived datasets, such as DEMs, also describe some remarkable geomorphic changes in the rock glacier. Frontal line changes between 2016 and 2019 are shown in Figure 6. The mean frontal positions (horizontally measured) relative to the October 2016 survey fluctuated between −0.79 m (September 2017) and +2.42 m (June 2019). These changes reflect the oscillatory position of the rock glacier front at the time of each UAV survey acquisition. Despite the substantial surface displacements during the snow-free periods, the rock glacier front faces net erosion (frontal retreat). Likewise, the rock glacier front displays a net advance during the snow cover period. This particular behaviour was also described between 2013 and 2016 by Kummert et al. (2018) using time series of in-situ webcam images.
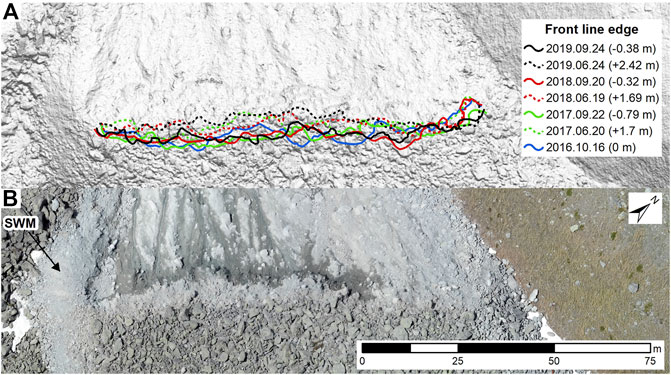
FIGURE 6. (A) Fluctuations of the front line edge between 2016 and 2019 based on the analysis of the respective orthomosaics. Dashed and continuous lines represent late spring/early summer and late summer/early autumn frontal rock glacier positions, respectively. The mean front line displacements (calculated over the entire line) relative to the 2016 position are indicated in parentheses. The background image corresponds to a DEM-derived hillshade from June 2019. (B) As an example, the southwestern margin (SWM) is indicated on the orthomosaic from June 2019.
The 3-year development of the scarp structure across the entire width of the rock glacier (Figure 5), which was already existing at the time of the first survey, can be observed from the dynamic visualisation of the hillshade images at the Supplementary Video SV1. At the time of the last UAV survey, the height of the scarp was reaching locally up to 10 m (Figure 9). This dynamic visualisation also shows the passive transfer of material and an almost negligible rotational movement of boulders. Additionally, the video depicts the progressive enlargement in the southwestern margin (Figure 6B), which is in direct contact with the stable southern levee, whereas in its northwestern portion, the rim has not expanded very significantly.
Elevation and volume changes
The DoD analyses from UAV and TLS revealed a strongly heterogeneous elevation change pattern along the rock glacier (Figure 7). Aggregated over the delimitated surface area (Figure 7), the net elevation changes between June 2017 and September 2019 reached between −0.37 ± 0.06 m (UAV-derived) and −0.33 ± 0.09 m (TLS-derived). Dappled patterns caused by local advection of large boulders are evident in the area above the scarp, whereas significant elevation changes between −7 and 7.5 m are concentrated below this scarp. During the same period, the estimated net volume changes equate to −13138 ± 3596 (TLS-derived) and −14613 ± 2552 m3 (UAV-derived), indicating that material wastage at the front and dynamic thinning are considerably more significant than the influx of material over the same surface. Furthermore, almost non-significant changes are encountered in both levees sectors. In the front area, the estimated net volume changes are mostly positive, indicating that accumulation is dominant to erosion processes for most periods (Table 6). It is important to remark that the upper gully area (below the front area) is not included in the DoD analyses (for detailed characterization, the reader is referred to Kummert and Delaloye, 2018).
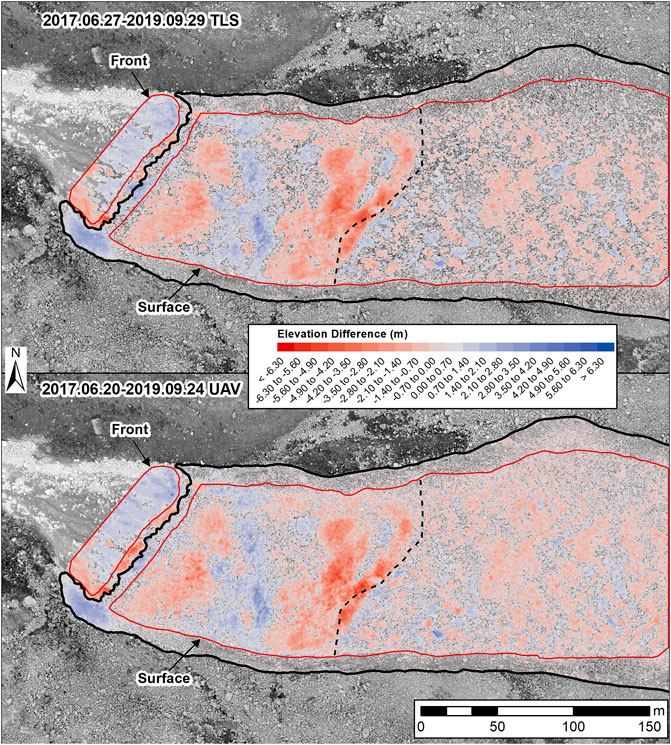
FIGURE 7. Elevation difference analyses using TLS (upper) and UAV (lower) datasets for 2017–2019. Black dashed lines correspond to the scarp position in 2017. The background image is a UAV-derived orthomosaic from September 2019.
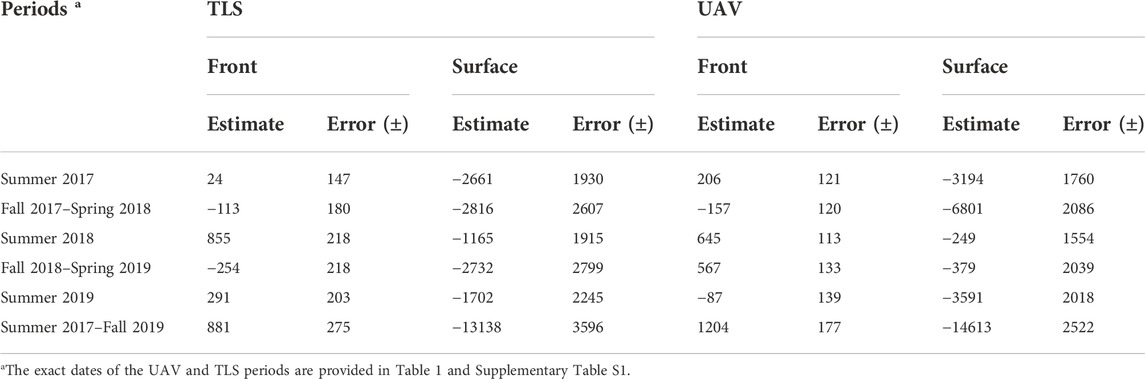
TABLE 6. Volume change (cubic metres) estimates derived from repeated TLS and UAV surveys.
Discussion
Recent kinematic behaviour
Overall, the rock glacier has displayed a nearly continuous acceleration and the ongoing development of a scarp feature during the survey period. This landform does not fit the conveyor belt advancing model (Kääb and Reichmuth, 2005) and corresponds to the less frequent rock glacier configuration with an advancing and eroding terminus (rock glacier type B sensu Kummert et al., 2018). At the front, active erosion processes have compensated for the average frontal displacement of 18 m between October 2016 and September 2019. Sediments are efficiently evacuated at the front of the rock glacier through a steep gully (Kummert and Delaloye, 2018), and therefore the rock glacier terminus oscillates from season to season (Figure 6). During most of the snow cover periods, the freezing of the active layer explains the net frontal advances identified in mid-June. This freezing leads to the cementing of the rock particles, consequently preventing any frontal erosion rates during the cold period of the year (Kummert et al., 2018). Contrarily, the thawing of the active layer and the freshly exposed permafrost ground during the snow-free periods generates increased erosion rates, and a net frontal retreat occurs over the June–September/October observation periods (Figure 6). The high velocities, their acceleration by a factor of two in a couple of years and the enhancement of the transversal scarp feature indicate an ongoing destabilisation phase (RGIK, 2022).
The onset of the scarp feature predates the monitoring period using UAV surveys, and the use of sparse velocity values from previous TGS can help reveal the initial conditions of this feature. Figure 8 shows the velocities of two kinematic points representing the lower (15) and upper (33) sections plotted between 2004 and 2020. They show a clear divergence in their surface velocities from 2012 onwards. The ongoing change in rock glacier dynamics has gradually produced a situation where the active layer and the upper permafrost core (primarily coarse-grained rocks and boulders with interstitial ice, see Figure 9B) are not capable of deforming fast enough to compensate for the stress-induced failures (Avian et al., 2009). Contrarily, around the position of the shear horizon (mostly a finer-grained sediment frozen layer), plastic deformation can still occur (Moore, 2014) and, therefore, could prevent the superficial failure to split the rock glacier into two independent sections as observed for instance at Dirru, Gugla-Bielzug and Grabengufer rock glaciers (Delaloye et al., 2013). Yet, the diverging kinematic behaviour above and below the scarp area (Figure 5), which has continued to occur over the period 2017–2019, points to the development of an effective splitting of the rock glacier into two independent sections. This particular behaviour has been previously observed at Petit-Vélan (Delaloye and Morard, 2011) and Grosse Grabe (Delaloye et al., 2013) rock glaciers, also situated in the Western Swiss Alps. However, a potential collapse of the landform is not expected so far, even if the high velocities persist, due to two main reasons: 1) the net surface elevation gain observed along the rock glacier front line, which is leading towards a concave profile of the terminal part (Figure 7) and; 2) the incremental sediment transfer rates concomitant with the rock glacier acceleration (Kummert and Delaloye, 2018).
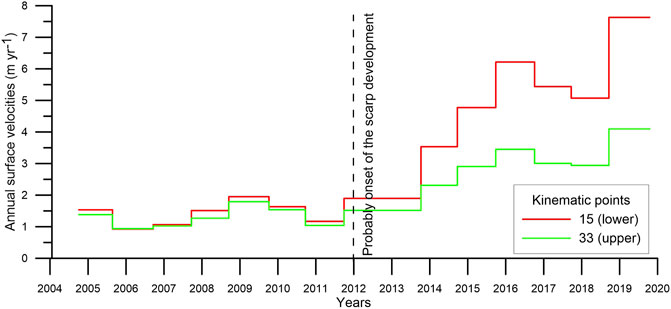
FIGURE 8. Annual horizontal surface velocities for two kinematics points from 2004 to 2020 represent the lower and upper rock glacier sections (PERMOS, 2019b).
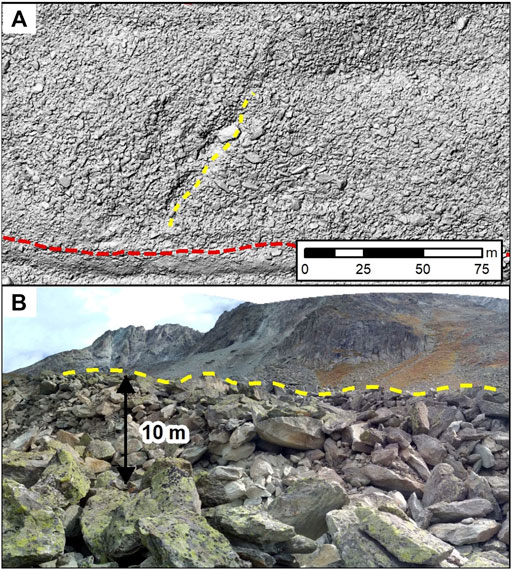
FIGURE 9. Illustration of the situation of the scarp during the last UAV survey. (A) Hillshade derived from the 24 September 2019 UAV survey showing the longitudinal extension of the scarp (yellow line). (B) Photograph acquired during the same day of the UAV survey (24 September 2019) indicates the vertical distance reached by the scarp front.
In a recent example, Strozzi et al. (2020) presented the results of satellite radar interferometry (InSAR) to monitor the kinematics of the Tsarmine rock glacier between 2009 and 2020. Using early Cosmo-SkyMed and recent Sentinel-1 radar imagery, they were able to display the occurrence of a substantial seasonal variability of the uppermost section of the rock glacier, which has been primarily in line with the one observed by the permanent GNSS station on its terminal part (see Figure 1). However, decorrelation problems between 2016 and 2019 caused by rapid displacements and the relatively small rock glacier surface area inhibited the capture of the spatial variability of the surface velocities. Hence, Strozzi et al. (2020) could not detect the significant velocity variations along the entire length of the central profile (Figure 5) between October 2016 and September 2019 and are restricted to the uppermost slower portion. Despite an acceleration up to 11 m yr−1 but thanks to the homogeneous behaviour in both rock glacier sections (Figure 4), the surface of the rock glacier is still mostly kept unchanged over time. This is also attested by persistent direction on the surface flow fields, making the close-range sensing of the rock glacier flow (e.g., image matching) to be tracked very efficiently. Regarding the recent popularity and extensive analysis of rock glaciers using InSAR (e.g., Villarroel et al., 2018; Bertone et al., 2019), precautions in the interpretation of landform kinematic should be taken when small, and rapid features with heterogeneous kinematic values are investigated. The quality of the high-resolution UAV-derived datasets leads us to stress that regular and spatially distributed surface velocity measurements would permit the monitoring of destabilised landforms in a satisfying way.
UAV monitoring strategies and their limitations
The close-range sensing approach based on repeated UAV surveys presented in this study shows some benefits compared to other more classical remote sensing and in-situ techniques. First, as each segment of the remote sensing chain is controlled (Schott, 2007), from image acquisition, processing, and analysis, this approach is highly customisable to different monitoring periods (i.e., temporal resolution) and the desired level of detail (i.e., spatial resolution). This is not trivial, as the users of classical photogrammetric surveys or satellite imagery cannot directly operate the platform, leaving their management in the hands of commercial or governmental agencies. Furthermore, the inherent trade-off among the optimal monitoring period, spatial resolution and prohibitive operational costs for a particular remote sensing strategy can be better accommodated with low-cost monitoring strategies (see Anderson et al., 2019 for a discussion about low-cost topographic surveying). Second, compared with TGS techniques, the time for data acquisition may be reduced when deploying UAV devices (provided that permanent GCPs are already established). On the field, a routine UAV flight image capture from the first to the last images usually takes no more than 30 min to cover the rock glacier and its environs (see Table 1 for details), whereas, a regular TGS may take some hours (For Tsarmine up to 2 h from the first to the last measurement depending on the personnel’s expertise) to measure the ensemble of kinematic points. With nearly optimal conditions during image acquisition, the LoD from UAV derived velocities is nearly as good as the one from GNSS measured velocities, but it can be substantially degraded during unfavourable conditions. Besides, the use of UAV helps increase personnel security by avoiding the terrestrial surveys on unstable sectors. This is especially the case in Tsarmine, where many boulders have become unstable and the frontal area is always prone to rockfalls due to the strong rock glacier acceleration. With operational fixed low costs and high spatial resolution, UAV surveys are well suited for studying medium-sized landforms (i.e., up to a few hectares) at high monitoring rates (Rodriguez et al., 2020).
Nevertheless, rock glacier kinematic monitoring by UAV surveys is restricted to the snow-free period and suitable weather conditions for flying. For our study area, the snow-free period usually spans four months a year (from mid-June to early October). Likewise, strong winds, fog, rain, ambient light, and suitable landing strips can further constrain or impede the operation of fixed-wing UAVs, particularly in high mountain terrain. In addition, potential threats to UAV operations are mountain birds, especially raptors, due to their aggressive response to small flying objects. Furthermore, national or international UAV regulations may pose additional restrictions or even prohibit the operation of some UAV models in specific areas. In Switzerland, the Federal Office of Civil Aviation (FOCA) bans the operation of UAV devices in protected areas for water and migratory birds typically. In addition, despite the promptness of the UAV data acquisition in the field, the overall time to obtain information on the landform kinematics can be relatively long due to the different steps, including the processing of the raw images via the SfM photogrammetric workflow, as well as the sequential image matching using the NCC function. The processing of UAV-derived data requires adequate computer and software capabilities. A single UAV survey at the Tsarmine rock glacier is processed using a DELL Precision Tower workstation (2 × 32 GB DDR4 2666 MHz memory and 58-core Intel Xeon E5-2695 @ 2.30 GHz processor) in less than 3 h. This is due to the highly parallelised software structure in Pix4D, which takes advantage of the different resources available (https://pix4d.com/pix4dmapper-pro/, last access: 4 June 2021). Likewise, depending on the grid sampling density and the search and reference window sizes, a single image matching using the NCC function on CIAS software takes around 30 min.
Regarding the specificities mentioned above, it is not surpassing that UAV monitoring approaches are gaining considerable momentum in geomorphology (Eltner et al., 2016; Cook, 2017; Śledź et al., 2021) and cryospheric research (Gaffey and Bhardwaj, 2020). With this rapid growth of interest in UAV and SfM research, it can become apparent that workflows and protocols need to be standardised (Eltner et al., 2016). In a pioneering effort using UAV-SfM techniques on a rock glacier, Dall’Asta et al. (2017) demonstrated that automatic methods outperformed the manual measurements of more than 1000 conjugate points by a trained operator. They achieved similar R2 values for a two-year period to our work but for a narrow range of displacements between 0 and 3 m. Furthermore, our approach evaluated the quality of the automatic image matching results using the available stable ground outside the rock glacier. Relevant studies have regarded this evaluation as a fundamental step for quantifying the uncertainties accompanying orthomosaic pair coregistration and the performance of different automatic displacements methods (Debella-Gilo and Kääb, 2011; Sorg et al., 2015; Groh and Blöthe, 2019; Kääb et al., 2021). We also sought to keep the use of GCPs to a minimum and provide independent quality examinations with the larger sample of kinematic points available. In this regard, such a small number of GCPs can better accommodate the monitoring requirements for rapid rock glaciers, where terrain constraints such as unstable ground and accessibility will compromise the safety of the monitoring efforts.
Comparison of the UAV and TGS frameworks
As we indicated in our methodology using sequential orthomosaics, we consider the calculation of UAV-derived velocities using a fixed grid system (Supplementary Video SV2) through which the rock glacier surface flows (i.e., Eulerian specification of the surface flow fields). It should be stressed that during the validation step, we actually employed the initial coordinates of the kinematic points that corresponded to each UAV survey acquisition (Surface Movements Derived from Sequential Orthomosaics Section). This procedure was necessary for comparing the UAV-derived and GNSS measured velocities on the same position (i.e., x and y coordinates CH1903 + LV95). By contrast, the TGS alone provides velocities values using a moving net of marked boulders (Supplementary Video SV3) as it moves along the rock glacier surface (i.e., Lagrangian specification of the surface flow fields). In the case of steady rock glacier velocities, or over short-term periods, the Lagrangian (TGS) and Eulerian (UAV-derived) systems are expected to provide comparable results. However, the values provided by each system might diverge during large displacements. This can be illustrated by the surveyed boulders initially labelled to belong to either the rooting or central zones, which are currently at (or heading to) the rock glacier upper central or frontal zones, respectively (PERMOS, 2019b). Thus, such measurements are not representing the original rock glacier zonification.
Conclusion
This work detailed the use of UAV and TLS surveys to monitor rapid kinematic and geomorphological changes on a destabilised rock glacier with enhanced temporal and spatial details. The customised UAV data acquisition and the subsequent data processing workflow delivered spatially distributed kinematics for this destabilised rock glacier. Between June and September 2019, superficial velocities in excess of 10 m yr−1 were measured on the lower part of the rock glacier. The combined DoD analysis highlighted significant elevation changes concentrated at the front and lower rock glacier sections. The UAV-derived velocities have provided valuable data that is in good agreement with those obtained by TGS using GNSS equipment. Our results provide strong support for the use of UAV and automatic image matching for the enhanced analysis of the spatio-temporal rock glacier kinematic, as well as going beyond traditional survey methods.
Furthermore, the scarp development and the specific spatiality of the abrupt velocity differences between the lower and upper rock glacier sections could be documented thanks to the very high resolution and spatial coverage. During similar periods, neither of these two characteristics has been described by TGS surveys nor other remote sensing data such as InSAR. In this regard, we stress the importance of timely and high-resolution surface observations to decipher landform dynamics and improve our understanding of rock glacier behaviour during destabilisation phases.
Autonomous and adaptable monitoring techniques are further needed to monitor rock glaciers and other mountain landforms that are reacting quickly to environmental changes. Hence, monitoring rock glacier kinematics with in-situ techniques (i.e., TGS) can be complemented using UAV surveys over selected rock glaciers. Repeated UAV and TLS surveys are adequate tools to monitor such landforms where rock glaciers are becoming highly unstable and dangerous.
In Tsarmine, additional work should address the influence of rock glacier acceleration on scarp development and evolution to better understand the rheology of destabilised rock glaciers. This work might include modelling approaches and quantifying historical velocities by reanalysing archival aerial photographs available for this rock glacier. Moreover, further developments of rock glacier studies should target the assessment of geodetic mass balance (see Cusicanqui et al., 2021) at very high resolution using UAV and TLS data.
Data availability statement
The UAV datasets collected during this study are available from the corresponding author upon reasonable request. The complete series of interactive 3-D models from the Tsarmine rock glacier is available at https://sketchfab.com/UNIL-IDYST/collections/tsarmine-rock-glacier. The kinematic data from the Tsarmine rock glacier is available from the PERMOS office upon request, and the reference website link is http://www.permos.ch/data.html.
Author contributions
SV performed UAV data acquisition, processing, and analyses, wrote the initial version of the manuscript and designed all the figures under the rigorous supervision of CL. HH performed TLS data acquisition and processing. RD assisted with GNSS data acquisition and critical feedback from the results. All authors contributed to editing the manuscript.
Funding
Open access funding was provided by the University of Lausanne.
Acknowledgments
We sincerely thank Gernot Seier and Stuart Lane for their detailed comments on this manuscript. Also, our gratitude goes to the Tsarmine field team from the Universities of Lausanne and Fribourg, especially to Sébastien Rüttimann (earlier UAV surveys) and Mario Kummert (earlier TLS surveys). We also acknowledge the opportunistic employment of the permanent GCPs installed during a previous study by Umberto Morra di Cella. HH benefited from three travel grants for the collection of the TLS data used in this study, provided by FWO Flanders, Belgium (V4.321.17N, V4.253.18N and V4.248.19N). We thank the editor, Mihai Ciprian Mărgărint, and two reviewers for their very useful comments on our manuscript.
Conflict of interest
The authors declare that the research was conducted in the absence of any commercial or financial relationships that could be construed as a potential conflict of interest.
Publisher’s note
All claims expressed in this article are solely those of the authors and do not necessarily represent those of their affiliated organizations, or those of the publisher, the editors and the reviewers. Any product that may be evaluated in this article, or claim that may be made by its manufacturer, is not guaranteed or endorsed by the publisher.
Supplementary material
The Supplementary Material for this article can be found online at: https://www.frontiersin.org/articles/10.3389/feart.2022.1017949/full#supplementary-material
References
Anderson, K., Westoby, M. J., and James, M. R. (2019). Low-budget topographic surveying comes of age: Structure from motion photogrammetry in geography and the geosciences. Prog. Phys. Geogr. Earth Environ. 43, 163–173. doi:10.1177/0309133319837454
Arenson, L. U., Hoelzle, M., and Springman, S. M. (2002). Borehole deformation measurements and internal structure of some rock glaciers in Switzerland. Permafr. Periglac. Process. 13, 117–135. doi:10.1002/ppp.414
Avian, M., Kellerer-Pirklbauer, A., and Bauer, A. (2009). LiDAR for monitoring mass movements in permafrost environments at the cirque Hinteres Langtal, Austria, between 2000 and 2008. Nat. Hazards Earth Syst. Sci. 9, 1087–1094. doi:10.5194/nhess-9-1087-2009
Barsch, D. (1996). Rockglaciers: Indicators for the present and former geoecology in high mountain environments. Berlin: Springer-Verlag. doi:10.1007/978-3-642-80093-1
Bearzot, F., Garzonio, R., Di Mauro, B., Colombo, R., Cremonese, E., Crosta, G. B., et al. (2022). Kinematics of an Alpine rock glacier from multi-temporal UAV surveys and GNSS data. Geomorphology 402, 108116. doi:10.1016/j.geomorph.2022.108116
Benassi, F., Dall’Asta, E., Diotri, F., Forlani, G., Morra di Cella, U., Roncella, R., et al. (2017). Testing accuracy and repeatability of UAV blocks oriented with GNSS-supported aerial triangulation. Remote Sens. (Basel). 9, 172. doi:10.3390/rs9020172
Benoit, L., Gourdon, A., Vallat, R., Irarrazaval Bustos, I., Gravey, M., Lehmann, B., et al. (2019). A high-resolution image time series of the Gorner Glacier - Swiss Alps - derived from repeated unmanned aerial vehicle surveys. Earth Syst. Sci. Data 11, 579–588. doi:10.5194/essd-11-579-2019
Berthling, I., Etzelmüller, B., Eiken, T., and Sollid, J. L. (1998). Rock glaciers on prins karls forland, svalbard. I: Internal structure, flow velocity and morphology. Permafr. Periglac. Process. 9, 135–145. doi:10.1002/(sici)1099-1530(199804/06)9:2<135::aid-ppp284>3.0.co;2-r
Bertone, A., Zucca, F., Marin, C., Notarnicola, C., Cuozzo, G., Krainer, K., et al. (2019). An unsupervised method to detect rock glacier activity by using Sentinel-1 SAR interferometric coherence: A regional-scale study in the Eastern European Alps. Remote Sens. (Basel). 11, 1711. doi:10.3390/rs11141711
Blöthe, J. H., Halla, C., Schwalbe, E., Bottegal, E., Trombotto Liaudat, D., and Schrott, L. (2021). Surface velocity fields of active rock glaciers and ice-debris complexes in the Central Andes of Argentina. Earth Surf. Process. Landforms 46, 504–522. doi:10.1002/esp.5042
Bodin, X., Krysiecki, J. M., Schoeneich, P., Le Roux, O., Lorier, L., Echelard, T., et al. (2017). The 2006 collapse of the Bérard rock glacier (Southern French Alps). Permafr. Periglac. Process. 28, 209–223. doi:10.1002/ppp.1887
Bodin, X., Thibert, E., Fabre, D., Ribolini, A., Schoeneich, P., Francou, B., et al. (2009). Two decades of responses (1986-2006) to climate by the Laurichard rock glacier, French Alps. Permafr. Periglac. Process. 20, 331–344. doi:10.1002/ppp.665
Bollmann, E., Girstmair, A., Mitterer, S., Krainer, K., Sailer, R., and Stötter, J. (2015). A rock glacier activity index based on rock glacier thickness changes and displacement rates derived from airborne laser scanning. Permafr. Periglac. Process. 26, 347–359. doi:10.1002/ppp.1852
Buchli, T., Kos, A., Limpach, P., Merz, K., Zhou, X., and Springman, S. M. (2018). Kinematic investigations on the Furggwanghorn rock glacier, Switzerland. Permafr. Periglac. Process. 29, 3–20. doi:10.1002/ppp.1968
Carbonneau, P. E., and Dietrich, J. T. (2017). Cost-effective non-metric photogrammetry from consumer-grade sUAS: Implications for direct georeferencing of structure from motion photogrammetry. Earth Surf. Process. Landforms 42, 473–486. doi:10.1002/esp.4012
Carrivick, J. L., Smith, M. W., and Quincey, D. J. (2016). Structure from Motion in the geosciences. Chichester, UK: John Wiley & Sons. doi:10.1002/9781118895818
Cicoira, A., Beutel, J., Faillettaz, J., and Vieli, A. (2019). Water controls the seasonal rhythm of rock glacier flow. Earth Planet. Sci. Lett. 528, 115844. doi:10.1016/j.epsl.2019.115844
Cicoira, A., Marcer, M., Gärtner-Roer, I., Bodin, X., Arenson, L. U., and Vieli, A. (2021). A general theory of rock glacier creep based on in-situ and remote sensing observations. Permafr. Periglac. Process. 32, 139–153. doi:10.1002/ppp.2090
Clapuyt, F., Vanacker, V., Schlunegger, F., and Van Oost, K. (2017). Unravelling Earth flow dynamics with 3-D time series derived from UAV-SfM models. Earth Surf. Dynam. 5, 791–806. doi:10.5194/esurf-5-791-2017
Cook, K. L. (2017). An evaluation of the effectiveness of low-cost UAVs and structure from motion for geomorphic change detection. Geomorphology 278, 195–208. doi:10.1016/j.geomorph.2016.11.009
Cusicanqui, D., Rabatel, A., Vincent, C., Bodin, X., Thibert, E., and Francou, B. (2021). Interpretation of volume and flux changes of the Laurichard rock glacier between 1952 and 2019, French Alps. J. Geophys. Res. Earth Surf. 126. doi:10.1029/2021JF006161
Dall’Asta, E., Forlani, G., Roncella, R., Santise, M., Diotri, F., and Morra di Cella, U. (2017). Unmanned Aerial Systems and DSM matching for rock glacier monitoring. ISPRS J. Photogramm. Remote Sens. 127, 102–114. doi:10.1016/j.isprsjprs.2016.10.003
Debella-Gilo, M., and Kääb, A. (2011). Sub-pixel precision image matching for measuring surface displacements on mass movements using normalized cross-correlation. Remote Sens. Environ. 115, 130–142. doi:10.1016/j.rse.2010.08.012
Delaloye, R., Avian, M., Bodin, X., Hausmann, H., Ikeda, A., Kääb, A., et al. (2008). “Recent interannual variations of rockglacier creep in the European Alps,” in Proceedings of the 9th International Conference on Permafrost, Fairbanks, Alaska, 29 June 2008 - 3 July 2008, 1–6.
Delaloye, R., Lambiel, C., and Gärtner-Roer, I. (2010). Overview of rock glacier kinematics research in the Swiss Alps. Geogr. Helv. 65, 135–145. doi:10.5194/gh-65-135-2010
Delaloye, R., Morard, S., Barboux, C., Abbet, D., Gruber, V., Riedo, M., et al. (2013). Rapidly moving rock glaciers in Mattertal. Gesellschaft: Jahrestagung der Schweizerischen Geomorphol, 21–31.
Delaloye, R., and Morard, S. (2011). “Le glacier rocheux déstabilisé du Petit-vélan (val d’Entremont, Valais): Morphologie de surface, vitesses de déplacement et structure interne,” in La géomorphologie Alp. entre patimoine contrainte. Actes du Colloq. la Société Suisse Géomorphologie, 3-5 Sept. 2009, Olivone (Géovisions n° 36) (Lausanne: Inst. géographie, Univ), 197–210.
Delaloye, R., and Staub, B. (2016). “Seasonal variations of rock glacier creep: Time series observations from the Western Swiss Alps,” in XI. International Conference On Permafrost, Fairbanks, Alaska, 29 June 2008 - 3 July 2008, 20–24.
Deline, P., Gruber, S., Delaloye, R., Fischer, L., Geertsema, M., Giardino, M., et al. (2015). “Ice loss and slope stability in high-mountain regions,” in Snow and ice-related hazards, risks and disasters (Amsterdam, Netherlands: Elsevier), 521–561. doi:10.1016/B978-0-12-394849-6.00015-9
Deluigi, N., Lambiel, C., and Kanevski, M. (2017). Data-driven mapping of the potential mountain permafrost distribution. Sci. Total Environ. 590–591, 370–380. doi:10.1016/j.scitotenv.2017.02.041
Eichel, J., Draebing, D., Kattenborn, T., Senn, J. A., Klingbeil, L., Wieland, M., et al. (2020). Unmanned aerial vehicle-based mapping of turf-banked solifluction lobe movement and its relation to material, geomorphometric, thermal and vegetation properties. Permafr. Periglac. Process. 31, 97–109. doi:10.1002/ppp.2036
Eltner, A., Kaiser, A., Castillo, C., Rock, G., Neugirg, F., and Abellán, A. (2016). Image-based surface reconstruction in geomorphometry-merits, limits and developments. Earth Surf. Dynam. 4, 359–389. doi:10.5194/esurf-4-359-2016
Eriksen, H. Ø., Rouyet, L., Lauknes, T. R., Berthling, I., Isaksen, K., Hindberg, H., et al. (2018). Recent acceleration of a rock glacier complex, Ádjet, Norway, documented by 62 years of remote sensing observations. Geophys. Res. Lett. 45, 8314–8323. doi:10.1029/2018GL077605
Fey, C., and Krainer, K. (2020). Analyses of UAV and GNSS based flow velocity variations of the rock glacier Lazaun (Ötztal Alps, South Tyrol, Italy). Geomorphology 365, 107261. doi:10.1016/j.geomorph.2020.107261
Fischer, M., Huss, M., Kummert, M., and Hoelzle, M. (2016). Application and validation of long-range terrestrial laser scanning to monitor the mass balance of very small glaciers in the Swiss Alps. Cryosphere 10, 1279–1295. doi:10.5194/tc-10-1279-2016
Forlani, G., Dall’Asta, E., Diotri, F., di Cella, U. M., Roncella, R., and Santise, M. (2018). Quality assessment of DSMs produced from UAV flights georeferenced with on-board RTK positioning. Remote Sens. (Basel). 10, 311. doi:10.3390/rs10020311
Francou, B., and Reynaud, L. (1992). 10 year surficial velocities on a rock glacier (Laurichard, French Alps). Permafr. Periglac. Process. 3, 209–213. doi:10.1002/ppp.3430030306
Frehner, M., Ling, A. H. M., and Gärtner-Roer, I. (2015). Furrow-and-ridge morphology on rockglaciers explained by gravity-driven buckle folding: A case study from the Murtèl rockglacier (Switzerland). Permafr. Periglac. Process. 26, 57–66. doi:10.1002/ppp.1831
Fugazza, D., Scaioni, M., Corti, M., D’Agata, C., Azzoni, R. S., Cernuschi, M., et al. (2018). Combination of UAV and terrestrial photogrammetry to assess rapid glacier evolution and map glacier hazards. Nat. Hazards Earth Syst. Sci. 18, 1055–1071. doi:10.5194/nhess-18-1055-2018
Gabbud, C., Micheletti, N., and Lane, S. N. (2015). Lidar measurement of surface melt for a temperate Alpine glacier at the seasonal and hourly scales. J. Glaciol. 61, 963–974. doi:10.3189/2015JoG14J226
Gaffey, C., and Bhardwaj, A. (2020). Applications of unmanned aerial vehicles in cryosphere: Latest advances and prospects. Remote Sens. (Basel). 12, 948. doi:10.3390/rs12060948
Goetz, J., Brenning, A., Marcer, M., and Bodin, X. (2018). Modeling the precision of structure-from-motion multi-view stereo digital elevation models from repeated close-range aerial surveys. Remote Sens. Environ. 210, 208–216. doi:10.1016/j.rse.2018.03.013
Groh, T., and Blöthe, J. H. (2019). Rock glacier kinematics in the Kaunertal, Ötztal Alps, Austria. Geosciences 9, 373. doi:10.3390/geosciences9090373
Haeberli, W., Hallet, B., Arenson, L. U., Elconin, R., Humlum, O., Kääb, A., et al. (2006). Permafrost creep and rock glacier dynamics. Permafr. Periglac. Process. 17, 189–214. doi:10.1002/ppp.561
Halla, C., Blöthe, J. H., Tapia Baldis, C., Trombotto Liaudat, D., Hilbich, C., Hauck, C., et al. (2021). Ice content and interannual water storage changes of an active rock glacier in the dry Andes of Argentina. Cryosphere 15, 1187–1213. doi:10.5194/tc-15-1187-2021
Hartl, L., Fischer, A., Stocker-Waldhuber, M., and Abermann, J. (2016). Recent speed-up of an alpine rock glacier: An updated chronology of the kinematics of outer hochebenkar rock glacier based on geodetic measurements. Geogr. Ann. Ser. A Phys. Geogr. 98, 129–141. doi:10.1111/geoa.12127
Heid, T., and Kääb, A. (2012). Evaluation of existing image matching methods for deriving glacier surface displacements globally from optical satellite imagery. Remote Sens. Environ. 118, 339–355. doi:10.1016/j.rse.2011.11.024
Hendrickx, H., De Sloover, L., Stal, C., Delaloye, R., Nyssen, J., and Frankl, A. (2020). Talus slope geomorphology investigated at multiple time scales from high-resolution topographic surveys and historical aerial photographs (Sanetsch Pass, Switzerland). Earth Surf. Process. Landforms 45, 3653–3669. doi:10.1002/esp.4989
Hendrickx, H., Vivero, S., De Cock, L., De Wit, B., De Maeyer, P., Lambiel, C., et al. (2019). The reproducibility of SfM algorithms to produce detailed Digital Surface Models: The example of PhotoScan applied to a high-alpine rock glacier. Remote Sens. Lett. 10, 11–20. doi:10.1080/2150704X.2018.1519641
Ikeda, A., Matsuoka, N., and Kääb, A. (2008). Fast deformation of perennially frozen debris in a warm rock glacier in the Swiss Alps: An effect of liquid water. J. Geophys. Res. 113, 010211–F1112. doi:10.1029/2007JF000859
Ikeda, A., and Matsuoka, N. (2006). Pebbly versus bouldery rock glaciers: Morphology, structure and processes. Geomorphology 73, 279–296. doi:10.1016/j.geomorph.2005.07.015
James, M. R., Robson, S., and Smith, M. W. (2017). 3-D uncertainty-based topographic change detection with structure-from-motion photogrammetry: Precision maps for ground control and directly georeferenced surveys. Earth Surf. Process. Landforms 42, 1769–1788. doi:10.1002/esp.4125
James, M. R., and Robson, S. (2012). Straightforward reconstruction of 3D surfaces and topography with a camera: Accuracy and geoscience application. J. Geophys. Res. 117, 1–17. doi:10.1029/2011JF002289
Janke, J. R., Regmi, N. R. R., Giardino, J. R., and Vitek, J. D. (2013). “Rock glaciers,” in Treatise on Geomorphology (Amsterdam, Netherlands: Elsevier), 238–273. doi:10.1016/B978-0-12-374739-6.00211-6
Jones, D. B., Harrison, S., Anderson, K., and Betts, R. A. (2018). Mountain rock glaciers contain globally significant water stores. Sci. Rep. 8, 2834–2910. doi:10.1038/s41598-018-21244-w
Kääb, A. (2021). Correlation image analysis software (CIAS). Available at: https://www.mn.uio.no/geo/english/research/projects/icemass/cias/(Accessed March 20, 2021).
Kääb, A., Frauenfelder, R., and Roer, I. (2007). On the response of rockglacier creep to surface temperature increase. Glob. Planet. Change 56, 172–187. doi:10.1016/j.gloplacha.2006.07.005
Kääb, A., and Reichmuth, T. (2005). Advance mechanisms of rock glaciers. Permafr. Periglac. Process. 16, 187–193. doi:10.1002/ppp.507
Kääb, A. (2005). Remote sensing of mountain glaciers and permafrost creep. Zürich: Geographisches Institut der Universität Zürich.
Kääb, A., Strozzi, T., Bolch, T., Caduff, R., Trefall, H., Stoffel, M., et al. (2021). Inventory and changes of rock glacier creep speeds in Ile Alatau and Kungöy Ala-Too, northern Tien Shan, since the 1950s. Cryosphere 15, 927–949. doi:10.5194/tc-15-927-2021
Kääb, A., and Vollmer, M. (2000). Surface geometry, thickness changes and flow fields on creeping mountain permafrost: Automatic extraction by digital image analysis. Permafr. Periglac. Process. 11, 315–326. doi:10.1002/1099-1530(200012)11:4<315::aid-ppp365>3.0.co;2-j
Kaufmann, V. (2016). 20 years of geodetic monitoring of Dösen rock glacier (Ankogel group, Austria): A short review. Joannea - Geol. Palaontologie 12, 37–44.
Kaufmann, V. (1998). “Deformation analysis of the Doesen rock glacier (Austria),” in Proc. 7th Int. Conf. Permafr., Canada, 551–556.
Kaufmann, V., Seier, G., Sulzer, W., Wecht, M., Liu, Q., Lauk, G., et al. (2018). Rock glacier monitoring using aerial photographs: Conventional vs. UAV-based mapping - a comparative study. Int. Arch. Photogramm. Remote Sens. Spat. Inf. Sci. 42, 239–246. doi:10.5194/isprs-archives-XLII-1-239-2018
Kellerer-Pirklbauer, A., Delaloye, R., Lambiel, C., Gärtner-Roer, I., Kaufmann, V., Scapozza, C., et al. (2018). “Interannual variability of rock glacier flow velocities in the European Alps,” in Proceedings of the 5th European Conference on Permafrost (EUCOP5-2018), Chamonix, France, June 2018, 396–397.
Kellerer-Pirklbauer, A., Lieb, G. K., and Kaufmann, V. (2017). The Dösen rock glacier in Central Austria: A key site for multidisciplinary long-term rock glacier monitoring in the Eastern Alps. Austrian J. Earth Sci. 110. doi:10.17738/ajes.2017.0013
Kellerer-Pirklbauer, A., Wangensteen, B., Farbrot, H., and Etzelmüller, B. (2008). Relative surface age-dating of rock glacier systems near Hólar in Hjaltadalur, northern Iceland. J. Quat. Sci. 23, 137–151. doi:10.1002/jqs.1117
Koning, D. M., and Smith, D. J. (1999). Movement of King's Throne rock glacier, Mount Rae area, Canadian Rocky Mountains. Permafr. Periglac. Process. 10, 151–162. doi:10.1002/(sici)1099-1530(199904/06)10:2<151::aid-ppp312>3.0.co;2-r
Konrad, S. K., Humphrey, N. F., Steig, E. J., Clark, D. H., Potter, N., and Pfeffer, W. T. (1999). Rock glacier dynamics and paleoclimatic implications. Geol. 27, 1131. doi:10.1130/0091-7613(1999)027<1131:rgdapi>2.3.co;2
Krainer, K., Bressan, D., Dietre, B., Haas, J. N., Hajdas, I., Lang, K., et al. (2015). A 10,300-year-old permafrost core from the active rock glacier Lazaun, southern Ötztal Alps (South Tyrol, northern Italy). Quat. Res. 83, 324–335. doi:10.1016/j.yqres.2014.12.005
Kummert, M., Delaloye, R., and Braillard, L. (2018). Erosion and sediment transfer processes at the front of rapidly moving rock glaciers: Systematic observations with automatic cameras in the Western Swiss Alps. Permafr. Periglac. Process. 29, 21–33. doi:10.1002/ppp.1960
Kummert, M., and Delaloye, R. (2018). Mapping and quantifying sediment transfer between the front of rapidly moving rock glaciers and torrential gullies. Geomorphology 309, 60–76. doi:10.1016/j.geomorph.2018.02.021
Lambiel, C., and Delaloye, R. (2004). Contribution of real-time kinematic GPS in the study of creeping mountain permafrost: Examples from the Western Swiss Alps. Permafr. Periglac. Process. 15, 229–241. doi:10.1002/ppp.496
Lambiel, C. (2021). “Glacial and periglacial landscapes in the hérens valley,” in World geomorphological landscapes. Editor E. Reynard (Berlin, Germany: Springer), 263–275. doi:10.1007/978-3-030-43203-4_18
Lambiel, C. (2006). Le pergélisol dans les terrains sédimentaires à forte déclivité: Distribution, régime thermique et instabilités. Lausanne: UNIL-Faculté des géosciences et de l'environnement-Institut de géographie.
Leprince, S., Ayoub, F., Klinger, Y., and Avouac, J. P. (2007). Co-Registration of Optically Sensed Images and Correlation (COSI-Corr): An operational methodology for ground deformation measurements. Int. Geosci. Remote Sens. Symp., 23-28 July 2007, Barcelona, Spain, 1943–1946. doi:10.1109/IGARSS.2007.4423207
Lowe, D. G. (2004). Distinctive image features from scale-invariant keypoints. Int. J. Comput. Vis. 60, 91–110. doi:10.1023/B:VISI.0000029664.99615.94
Lucieer, A., Jong, S. M. D., and Turner, D. (2013). Mapping landslide displacements using Structure from Motion (SfM) and image correlation of multi-temporal UAV photography. Prog. Phys. Geogr. Earth Environ. 38, 97–116. doi:10.1177/0309133313515293
Marangunic, C. (1976). “El glaciar de roca Pedregoso, río Colorado, V Region,” in Actas del Primer Congreso Geologico Chileno (Santiago, Chile), 291–300.
Marcer, M., Ringsø Nielsen, S., Ribeyre, C., Kummert, M., Duvillard, P.-A., Schoeneich, P., et al. (2020). Investigating the slope failures at the Lou rock glacier front, French Alps. Permafr. Periglac. Process. 31, 15–30. doi:10.1002/ppp.2035
Marcer, M., Serrano, C., Brenning, A., Bodin, X., Goetz, J., and Schoeneich, P. (2019). Evaluating the destabilization susceptibility of active rock glaciers in the French Alps. Cryosphere 13, 141–155. doi:10.5194/tc-13-141-2019
Martini, M. A., Strelin, J. A., Flores, E., Astini, R. A., and Kaplan, M. R. (2017). Recent climate warming and the Varas Rock glacier activity, cordillera oriental, central Andes of Argentina. GeoResJ 14, 67–79. doi:10.1016/j.grj.2017.08.002
Messerli, B., and Zurbuchen, M. (1968). Block-gletscher im Weissmies und Aletsch und ihre photogrammetrische Kartierung. Die Alp. 3, 139–152.
Micheletti, N., Lambiel, C., and Lane, S. N. (2015). Investigating decadal-scale geomorphic dynamics in an alpine mountain setting. J. Geophys. Res. Earth Surf. 120, 2155–2175. doi:10.1002/2015JF003656
Micheletti, N., Tonini, M., and Lane, S. N. (2017). Geomorphological activity at a rock glacier front detected with a 3D density-based clustering algorithm. Geomorphology 278, 287–297. doi:10.1016/j.geomorph.2016.11.016
Moore, P. L. (2014). Deformation of debris-ice mixtures. Rev. Geophys. 52, 435–467. doi:10.1002/2014RG000453
Müller, J., Vieli, A., and Gärtner-Roer, I. (2016). Rock glaciers on the run - understanding rock glacier landform evolution and recent changes from numerical flow modeling. Cryosphere 10, 2865–2886. doi:10.5194/tc-10-2865-2016
Necsoiu, M., Onaca, A., Wigginton, S., and Urdea, P. (2016). Rock glacier dynamics in Southern Carpathian Mountains from high-resolution optical and multi-temporal SAR satellite imagery. Remote Sens. Environ. 177, 21–36. doi:10.1016/j.rse.2016.02.025
Nex, F., and Remondino, F. (2014). UAV for 3D mapping applications: A review. Appl. Geomat. 6, 1–15. doi:10.1007/s12518-013-0120-x
PERMOS (2013). Permafrost in Switzerland 2008/2009 and 2009/2010. Glaciol. Rep. Permafr. 10/11, 80. doi:10.13093/permos-rep-2013-10-11
PERMOS (2019a). Permafrost in Switzerland 2014/2015 to 2017/2018, eds. J. Nötzli, C. Pellet, and B. Staub Cryospheric Commission of the Swiss Academy of Sciences.
PERMOS (2019b). PERMOS database, Swiss permafrost monitoring network. Switzerland: Fribourg and Davos. doi:10.13093/permos-2019-01
Pętlicki, M., Sziło, J., MacDonell, S., Vivero, S., and Bialik, R. (2017). Recent deceleration of the ice elevation change of Ecology Glacier (King George Island, Antarctica). Remote Sens. (Basel). 9, 520. doi:10.3390/rs9060520
Redpath, T. A. N., Sirguey, P., Fitzsimons, S. J., and Kääb, A. (2013). Accuracy assessment for mapping glacier flow velocity and detecting flow dynamics from ASTER satellite imagery: Tasman Glacier, New Zealand. Remote Sens. Environ. 133, 90–101. doi:10.1016/j.rse.2013.02.008
RGIK (2022). Towards standard guidelines for inventorying rock glaciers: Practical concepts (version 2.0). IPA Action Group Rock glacier inventories and kinematics, 10.
Rignot, E., Hallet, B., and Fountain, A. G. (2002). Rock glacier surface motion in Beacon Valley, Antarctica, from synthetic-aperture radar interferometry. Geophys. Res. Lett. 29, 1607–1651. doi:10.1029/2001GL013494
Rodriguez, J., Macciotta, R., Hendry, M. T., Roustaei, M., Gräpel, C., and Skirrow, R. (2020). UAVs for monitoring, investigation, and mitigation design of a rock slope with multiple failure mechanisms—A case study. Landslides 17, 2027–2040. doi:10.1007/s10346-020-01416-4
Roer, I., Haeberli, W., Avian, M., Kaufmann, V., Delaloye, R., Lambiel, C., et al. (2008). “Observations and considerations on destabilizing active rock glaciers in the European Alps,” in Proceedings of the 9th International Conference on Permafrost, Fairbanks, Alaska, 29 June 2008 - 3 July 2008, 1505–1510. doi:10.5167/uzh-6082
Roer, I., Kääb, A., and Dikau, R. (2005). Rockglacier acceleration in the Turtmann valley (Swiss Alps): Probable controls. Norsk Geografisk Tidsskrift - Nor. J. Geogr. 59, 157–163. doi:10.1080/00291950510020655
Rossini, M., Di Mauro, B., Garzonio, R., Baccolo, G., Cavallini, G., Mattavelli, M., et al. (2018). Rapid melting dynamics of an alpine glacier with repeated UAV photogrammetry. Geomorphology 304, 159–172. doi:10.1016/j.geomorph.2017.12.039
Ryan, J. C., Hubbard, A. L., Box, J. E., Todd, J., Christoffersen, P., Carr, J. R., et al. (2015). UAV photogrammetry and structure from motion to assess calving dynamics at Store Glacier, a large outlet draining the Greenland ice sheet. Cryosphere 9, 1–11. doi:10.5194/tc-9-1-2015
Sanz-Ablanedo, E., Chandler, J. H., Ballesteros-Pérez, P., and Rodríguez-Pérez, J. R. (2020). Reducing systematic dome errors in digital elevation models through better UAV flight design. Earth Surf. Process. Landforms 2147, 2134–2147. doi:10.1002/esp.4871
Savšek-Safić, S., Ambrožič, T., Stopar, B., and Turk, G. (2006). Determination of point displacements in the geodetic network. J. Surv. Eng. 132, 58–63. doi:10.1061/(ASCE)0733-9453(2006)132:2(58)
Schneider, B., and Schneider, H. (2001). Zur 60jährigen Messreihe der kurzfristigen Geschwindigkeitsschwankungen am Blockgletscher im Äusseren Hochebenkar, Ötztaler Alpen, Tirol. Z. für Gletscherkd. Glazialgeol. 37, 1–33.
Scotti, R., Crosta, G. B., and Villa, A. (2017). Destabilisation of creeping permafrost: The plator rock glacier case study (central Italian Alps). Permafr. Periglac. Process. 28, 224–236. doi:10.1002/ppp.1917
Śledź, S., Ewertowski, M. W., and Piekarczyk, J. (2021). Applications of unmanned aerial vehicle (UAV) surveys and Structure from Motion photogrammetry in glacial and periglacial geomorphology. Geomorphology 378, 107620. doi:10.1016/j.geomorph.2021.107620
Smith, M. W., Carrivick, J. L., and Quincey, D. J. (2016). Structure from motion photogrammetry in physical geography. Prog. Phys. Geogr. Earth Environ. 40, 247–275. doi:10.1177/0309133315615805
Sorg, A., Kääb, A., Roesch, A., Bigler, C., and Stoffel, M. (2015). Contrasting responses of Central Asian rock glaciers to global warming. Sci. Rep. 5, 8228. doi:10.1038/srep08228
Steinemann, O., Reitner, J. M., Ivy-Ochs, S., Christl, M., and Synal, H. A. (2020). Tracking rockglacier evolution in the Eastern Alps from the Lateglacial to the early Holocene. Quat. Sci. Rev. 241, 106424. doi:10.1016/j.quascirev.2020.106424
Strozzi, T., Caduff, R., Jones, N., Barboux, C., Delaloye, R., Bodin, X., et al. (2020). Monitoring rock glacier kinematics with satellite synthetic aperture radar. Remote Sens. (Basel). 12, 559. doi:10.3390/rs12030559
Swisstopo (2018). swissALTI3D - the high precision digital elevation model of Switzerland. Available at: https://www.swisstopo.admin.ch/en/geodata/height/alti3d.html.
Valenzuela, L. (2004). “Stability issues in natural and man made slopes in mining,” in Landslides: Evaluation and Stabilization/Glissement de Terrain: Evaluation et Stabilisation, Set of 2 Volumes: Proceedings of the Ninth International Symposium on Landslides. Editors W. A. Lacerda, M. Ehrlich, S. A. B. Fontoura, and A. S. F. Sayão (Rio de Janeiro: Taylor & Francis Group), 467–473.
Vautherin, J., Rutishauser, S., Schneider-Zapp, K., Choi, H. F., Chovancova, V., Glass, A., et al. (2016). Photogrammetric accuracy and modeling of rolling shutter cameras. ISPRS Ann. Photogramm. Remote Sens. Spat. Inf. Sci. 3, 139–146. doi:10.5194/isprsannals-III-3-139-2016
Villarroel, C., Tamburini Beliveau, G., Forte, A., Monserrat, O., and Morvillo, M. (2018). DInSAR for a regional inventory of active rock glaciers in the dry Andes mountains of Argentina and Chile with sentinel-1 data. Remote Sens. (Basel). 10, 1588. doi:10.3390/rs10101588
Vivero, S., and Lambiel, C. (2019). Monitoring the crisis of a rock glacier with repeated UAV surveys. Geogr. Helv. 74, 59–69. doi:10.5194/gh-74-59-2019
Wagner, S. (1992). Creep of alpine permafrost, investigated on the murtel rock glacier. Permafr. Periglac. Process. 3, 157–162. doi:10.1002/ppp.3430030214
Wahrhaftig, C., and Cox, A. (1959). Rock glacier in the Alaska range. Geol. Soc. Am. Bull. 70, 383–436. doi:10.1130/0016-7606(1959)70[383:rgitar]2.0.co;2
Westoby, M. J., Brasington, J., Glasser, N. F., Hambrey, M. J., and Reynolds, J. M. (2012). Structure-from-Motion” photogrammetry: A low-cost, effective tool for geoscience applications. Geomorphology 179, 300–314. doi:10.1016/j.geomorph.2012.08.021
Wheaton, J. M., Brasington, J., Darby, S. E., and Sear, D. A. (2010). Accounting for uncertainty in DEMs from repeat topographic surveys: Improved sediment budgets. Earth Surf. Process. Landforms 35, 136–156. doi:10.1002/esp.1886
Winkler, S., and Lambiel, C. (2018). Age constraints of rock glaciers in the Southern Alps/New Zealand – exploring their palaeoclimatic potential. Holocene 28, 778–790. doi:10.1177/0959683618756802
Keywords: rock glacier, UAV, high-resolution topography, permafrost, Valais
Citation: Vivero S, Hendrickx H, Frankl A, Delaloye R and Lambiel C (2022) Kinematics and geomorphological changes of a destabilising rock glacier captured from close-range sensing techniques (Tsarmine rock glacier, Western Swiss Alps). Front. Earth Sci. 10:1017949. doi: 10.3389/feart.2022.1017949
Received: 12 August 2022; Accepted: 20 October 2022;
Published: 10 November 2022.
Edited by:
Mihai Ciprian Margarint, Alexandru Ioan Cuza University, RomaniaReviewed by:
Alexandru Onaca, West University of Timișoara, RomaniaFrancesco Domenico Zucca, University of Pavia, Italy
Copyright © 2022 Vivero, Hendrickx, Frankl, Delaloye and Lambiel. This is an open-access article distributed under the terms of the Creative Commons Attribution License (CC BY). The use, distribution or reproduction in other forums is permitted, provided the original author(s) and the copyright owner(s) are credited and that the original publication in this journal is cited, in accordance with accepted academic practice. No use, distribution or reproduction is permitted which does not comply with these terms.
*Correspondence: Sebastián Vivero, c2ViYXN0aWFuLnZpdmVyb2FuZHJhZGVAdW5pbC5jaA==