- School of Resources and Planning, Guangzhou Xinhua University, Guangzhou, China
The urban integration of metropolitan areas is an important embodiment of the high-quality development of urban agglomerations. Using the data of 2012–2020 NPP-VIIRS night light, social economy, OSM, and Baidu migration, etc., we explore the characteristics of Guangzhou-Qingyuan’s urban integration from four dimensions, such as economic development, industrial structure, transportation facilities, and public services using the methods such as geographical information method, commodity urban integration index, industrial structure similarity index, etc. The research results are as follows: The spatial pattern of economic development in the Guangzhou-Qingyuan differs greatly, but with the advancement of the integration process, regional economic exchanges have been enhanced; the commodity urban integration index is on the increase, the degree of market segmentation is gradually shrinking, and the level of commodity market urban integration is constantly improving. The industrial integration of the Guang-Qing area has an obvious effect. Although the index of similarity of industrial structure is high, there is a trend of gradual convergence and coordination; the leading industries are not the same, and the industrial demands are complementary to realize the coordinated development of the industry. The trend of the transportation urban integration in Guangzhou-Qingyuan is obvious, and the road network develops rapidly, but the travel time between the two cities is still relatively long. The transportation accessibility presents a circle-layer structure on the whole, and the transportation accessibility at the boundary area between the two cities has been greatly improved. Due to the close links between the historical foundation and social culture, inter-city people flow frequently, the public service facilities in Guangzhou-Qingyuan show an obvious trend of urban integration, but the relevant infrastructure needs to be improved urgently.
1 Introduction
With the rapid development of economic globalization and urban integration, the attraction between cities has been continuously strengthened, and the ability of the central city to radiate and drive the surrounding cities and the ability to interact with each other has become increasingly obvious (Yin, 2016). In 2020, the National Development and Reform Commission of China proposed to focus on promoting the urban integration of metropolitan areas and promoting the high-quality development of urban-rural integration. The development status of urban integration in the metropolitan area is the highest form of regional integration (Song, 2021), and it is a new form of spatial clustering in the development of urban agglomerations. High-quality development of the metropolitan area has become an important part of China’s national strategy and spatial layout (Fu et al., 2020). The Metropolitan area is an important node in the construction of urban agglomerations in China, which plays an important role in amplifying the radiation power of core cities in urban agglomerations, breaking through the constraints of administrative boundaries, and realizing regional integration and development (Zhang and Lin, 2019). Currently, metropolitan area research focuses on the concept connotation, development characteristics, and mode. In terms of concept analysis, it is mainly divided into central cities and peripheral areas. For example, metropolitan areas in the United States and Japan are defined by the daily round-trip commuting time and scope between central and peripheral cities (Beaverstock et al., 1999). By contrast, in China, the concept of the metropolitan area is based on the division standard of peripheral areas, which mainly refers to the urban integration space form within the urban agglomeration, which is centered on super-large, extra-large cities or large cities with strong radiation and driving ability and with a radius of 1-h commuting circle (Sun and Song, 2021). In terms of development characteristics, the existing studies mainly focus on the analysis of the urban integration of metropolitan areas, urban integration, and urban agglomeration (Jean, 1957), and propose the concepts of Twin City, Sister City, Bi-National City, and Twin Track Cities, etc. (Turok and Bailey, 2004; Clarke, 2009). They emphasize the cultural exchanges and cross-border trade links in the metropolitan area (Ramasamy and Cremer, 1998), highlight regional residents’ awareness of self-identity (Ehlers, 2001), and fully reflect cities’ social cohesion and competitiveness. They also use the night light image (SNPP/VIIRS) (Zheng et al., 2020), floating population (Takanori et al., 2016), and other methods to study the measurement and characteristics of urban integration. In terms of development mode, the construction of foreign metropolitan areas (Tokyo metropolitan area, Paris metropolitan area, New York metropolitan area, London metropolitan area) mostly relies on scientific development planning, convenient transportation facilities, good administrative coordination mechanism, and perfect industrial coordination development to strengthen the elastic development and scale effect of the metropolitan area (Wang and Zhang, 2016; Francisco et al., 2021). In general, researchers have made extensive theoretical and empirical research on the spatial structure, growth process, influence effect, gradient model, development stage, and governance construction of metropolitan areas (Beaverstock et al., 1999; Zhang, 2003; Chen, 2018; Zhang, 2018; Francisco et al., 2021). However, there are still many problems to be solved, such as the administrative barriers in the metropolitan area inhibit the rational distribution of resources, the economic effects of urban agglomerations have not yet fully manifested, the inter-regional coordinated development faces institutional obstacles, and the human and social elements and ecological construction are not considered (Sun and Li, 2017; Li et al., 2022).
Due to the urban and cross-border issues brought about by the expansion of cities, the implementation of urban integration has emerged at a historic moment and has become an advanced form of current regional cooperation. The problem of urban integration in the metropolitan area has attracted increasing attention, and the understanding of urban integration is also deepening (Xu, 2009). At present, the main focus in this field is the concept of connotation, spatial form, type division, dynamic mode, and mode selection of urban integration (Turok and Bailey, 2004; Xu et al., 2014). Sang et al. believe that urban integration is the integration of regional space, economy, and institutions after the close economic and social connections between two or more cities with close geographical proximity, similar cultural history, and complementary development of industrial structures (Sang et al., 2009). At the same time, they deeply analyze the concept connotation of urban integration from different perspectives. The research perspective of social culture pays attention to the connection between urban culture and trade and believes that the residents of the cities have the same culture, which is easier for cultural identification. Through city construction, the feeling of living in urban integration can be achieved, have a common sense of community (Xie and Liu, 2009). Scholars in the economic field put more emphasis on urban regional economic cooperation and exchanges, and believe that the research on urban integration should focus on overcoming the disadvantages of the administrative regional economy to eliminate administrative barriers and achieve the free flow of various production factors and commodities. In terms of institution and management perspectives, they emphasize the characteristics of institutions and politics and highlight the sense of regional common identity. However, the characteristics of urban proximity, cross-border and integrated development have become a consensus (Xing, 2007; Zeng et al., 2012). In recent years, increasing attention has been paid to the process of urban integration, measurement and development measures in the metropolitan area (Ma and Dou, 2018; Geng et al., 2022). In terms of the dynamic mechanism of urban integration, it is widely believed that the breaking of regional administrative boundaries, regional economic cooperation, smooth infrastructure, organizational structure, and institutional cooperation are the main factors that promote the process of urban integration (Li et al., 2010). In terms of type division, the types of urban integration are divided based on the relationship between administrative divisions, spatial integration, administrative management, organizational management, and scale reconstruction. In the aspect of spatial development mode, the land use conditions and spatial development strategies in the intermediate zone are highlighted, such as the co-build new city mode, the distributed grouping mode, and the ecological green core + satellite town mode (Duan and Liu, 2012). In terms of coordination management, the commonly-used models include the cross-administrative council model, the local government head consultation model, the higher-level government dispatched agency model, and the joint party committee model (Wu, 2014). In general, urban integration is not limited by urban administrative divisions, and it realizes the rational allocation of resources and elements, the equalization of public services and infrastructure levels, and the integrated development of marketization and efficient circulation (Chen et al., 2022). Researchers have analyzed regional planning, population distribution, infrastructure and tourism development, etc. under the background of urban integration (Peng and Qu, 2011; Li et al., 2016a). The development process of urban integration is mainly investigated by constructing a measurement index system, and the indexes include transportation accessibility, inter-city flow of people, industrial structure similarity coefficient, and location entropy (Du and Zhou, 2021; Shen et al., 2021). In terms of the development mode and measures of urban integration in the metropolitan area, China mainly adopts the following measures such as transportation integration, information platform sharing, industrial chain integration, policy and system docking, resource connectivity, dislocation development, and ecological co-construction, and have achieved good results (Duan and Liu, 2012; Fang, 2020). It is worth mentioning that the management of the ecological environment is also the focus of the metropolitan area study. It is worth mentioning that the management of the ecological environment is also the focus of metropolitan area research (Ali Talib et al., 2022). Scholars have studied the relationship between urbanization and the ecological environment from different methods and quantitative models, and have provided development suggestions for green and low-carbon transition development of cities in the context of carbon emission and carbon neutrality (Fan et al., 2020; Hashmi et al., 2021). To sum up, the research on metropolitan areas mainly focuses on spatial connection, urban development, spatial form, etc. A large number of theoretical achievements and typical studies have been accumulated in the formation characteristics, comprehensive measurement, and development strategies of the metropolitan area, laying a solid foundation for subsequent research. However, the methods and data for the comprehensive measurement of urban integration in the metropolitan area are relatively few, which affects the reliability of the research results to a certain extent. Currently, it has become an important research paradigm to conduct research on urban integration in the metropolitan area from multiple data and multi-dimensional perspectives.
The Guangzhou metropolitan area is an important spatial organization in the regional economic development of Guangdong Province. At present, the Guangzhou-Foshan urban integration has made great breakthroughs, but there are still great challenges in urban integration and coordinated development within the Guangzhou metropolitan area (Li et al., 2016b). In December 2021, the 14th Five-Year Development Plan for the Integration of Guangzhou and Qingyuan (Draft for Public Comments) was released. The Plan points out that the integrated development of Guangzhou and Qingyuan will find a new path for the Guangdong-Hong Kong-Macao Greater Bay Area to radiate and drive the development of the eastern and northwestern regions of Guangdong, formulating the Guangzhou-Qingyuan Experience in the coordinated development of urban and rural areas in the new era, and helping to promote the urban-rural integration and high-quality development in the Guangzhou metropolitan area. Based on this, this paper first reviews the literature on urban integration and metropolitan area at domestic and abroad, and these lay the theoretical foundation for this paper. At the same time, using multi-source data (night lighting data, industrial and economic data, road network data, and population migration data), to explore the spatial characteristics, problems, and development countermeasures of Guangzhou-Qingyuan urban integration in four dimensions: economy, industry, traffic, and public services. This research aims to promote the regional division of labor and the combination of elements in the Guangzhou-Qingyuan area and form the coordinated development pattern of function-industry-population-public services of the metropolitan area, to expand the theories related to urban geography and regional economics, and promote cross-sectional studies of metropolitan areas. The research results provide a reference for the urban integration and high-quality development of the metropolitan area in China.
2 Study area and data sources
2.1 Study area
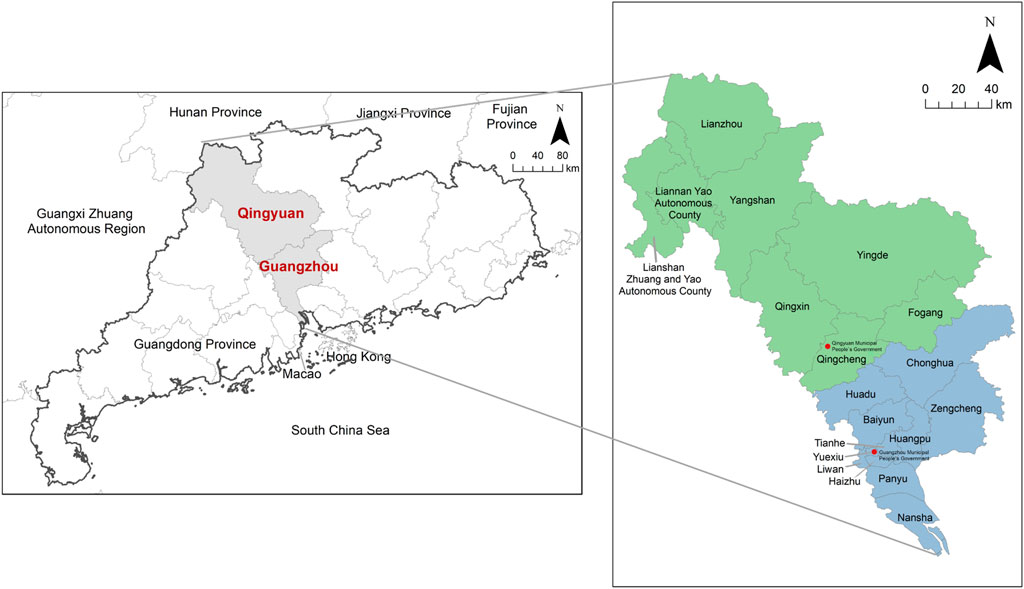
Guangzhou metropolitan area with Guangzhou as the central city and Foshan as the auxiliary city, which together play the role of the core city, leading the radiation of four cities, namely Zhaoqing, Qingyuan, Shaoguan, and Yunfu, to create make it a metropolitan area city group with global influence. The total area of the Guangzhou metropolitan area is about 71,573 square kilometers, accounting for 39.82% of Guangdong Province; the real GDP in 2019 is about 405.67 billion, accounting for 37.68% of Guangdong Province, ranking fourth in the national metropolitan area; the resident population is approximately 3,71,13,200, accounting for 32.21% of the province. As shown in Figure 1, Guangzhou is the central city of the Guangzhou metropolitan area. At the same time, Qingyuan is another neighboring city in the metropolitan area besides Foshan, which cooperates closely with Guangzhou. The rapid economic development of Guangzhou also drives the growth of Qingyuan. It is essential to speed up the co-creation of Guangzhou and Qingyuan so that Qingyuan can quickly integrate into the Guangzhou metropolitan area.
2.2 Data sources
The night light data comes from the National Center for Environmental Information (NCEI) under the National Oceanic and Atmospheric Administration (NOAA), and the data is downloaded and classified by month. The consumer price index (CPI) comes from the price categories in the 2016–2020 Guangdong Statistical Yearbook by the Statistics Bureau of Guangdong Province, covering eight categories of residential living consumption. The three major industrial value-added data come from the official website of the People’s Government of Guangdong Province, the Statistical Bulletin of the National Economic and Social Development of Guangzhou City, and the Statistical Bulletin of the National Economic and Social Development of Qingyuan. OSM data come from the official website of OpenStreetMap, which is free to download by year. Vector road network (line) and county (surface) elements are respectively converted into raster data with a size of 1,000 m. Baidu migration data comes from the Baidu migration platform in the eyes of Baidu Maps (https://qianxi.baidu.com/#/) (accessed on 31 December 2021).
3 Methods
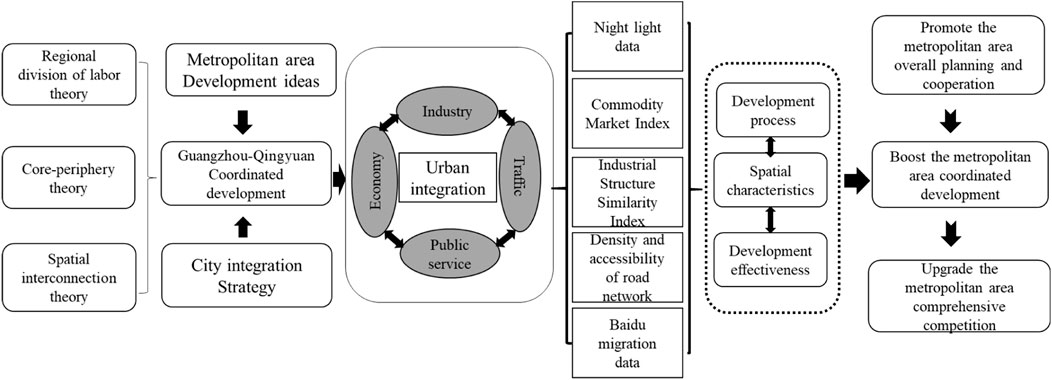
With integration as a goal-oriented approach, it can help cities break down administrative barriers, optimize the infrastructure of metropolitan areas, enhance internal communication and division of labor, and thus improve the operational efficiency of cities. The essence of integration is to form a development community. However, the study of the level measurement and development process of integration is very comprehensive and complex. In this study, we mainly refer to the relevant literature (Ma and Dou, 2018; Fu et al., 2020; Cai, 2021; Geng et al., 2022), based on the theories of regional division of labor, core-peripheral theory, and spatial interaction, and use multi-data to explore the actual process, spatial characteristics, and development effectiveness of Guangzhou-Qingyuan integration from four aspects of economic dimension, industrial dimension, transportation dimension, and public services dimension. Economic integration reflects the degree of agglomeration, economic connection, and market exchange of economic activities between cities; industrial structure integration mainly reflects the difference of industrial structure and agglomeration development effect between cities in the region; transportation integration mainly reflects the degree of development and accessibility of transportation infrastructure between cities; the public service integration mainly reflects the degree of sharing of public service undertakings and public recognition in the region. Figure 2 shows the framework and methodology of this study.
3.1 Economic dimension
3.1.1 NPP-VIIRS night light data
Compared with ordinary remote sensing satellite images, night light data can more intuitively reflect the aggregation of human economic activities, the level of regional economic development, and the concentration and distribution of the population by using surface light intensity information (Zhang et al., 2021), which can also reflect the development and integration trend between cities in time and space. The commonly-used light data are DMSP/OLS, NPP-VIIRS, and Luojia-1 satellite images. DMSP/OLS and NPP-VIIRS are all released by the US NOAA. Luojia-1 was launched by a research team from Wuhan University in 2018 (Cai, 2021). The night light data of DMSP/OLS is widely used, but its data are poorly comparable between different years, and the pre-processing is cumbersome. However, the NPP-VIIRS night light data produced in 2011 has been relatively improved in terms of time continuity, spatio-temporal, and radiation resolution (Chen et al., 2019). Given the handleability, availability, and timeliness of the data, the longitudinal comparison period of the study is long, so this paper selects the NPP-VIIRS night remote sensing image data with a resolution of 500 m, and the time interval is 4 years, namely 2012, 2016, and 2020.
3.1.2 Commodity urban integration index
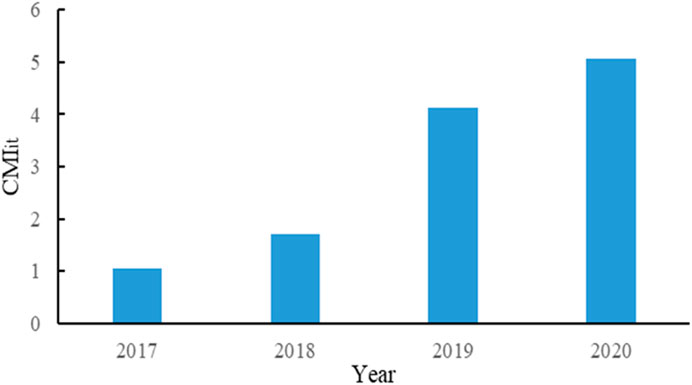
The level of urban integration of commodity markets can not only reflect the difference in consumer price levels between two or more cities but also measure the development level of urban integration of regional markets. Using the measurement method of the integration level of commodity markets (Zhang and Xiang, 2021), the variance of relative prices is used to measure the effect of inter-city market integration. The price refers to the consumer price index (CPI), and it reflects the daily consumption conditions and changes in service prices in a certain period, covering eight categories of residential living consumption, as shown in Table 1 and Table 2. The absolute value of the difference is taken to prevent the two cities from affecting the variance results due to their different locations. Since the urban integration of the commodity market is negatively correlated with the variance of the relative price index, we take the reciprocal of its variance (for readability, the conflict should be multiplied by 1,000) to obtain CMIit. The larger the index, the smaller the market segmentation level and the higher the inter-city commodity market urban integration level. The specific calculation equation is as follows:
where equation,
3.2 Industrial dimension
Industrial urban integration, also known as industrial isomorphism, refers to the development of the same industry and the production of the same type of products in different regions driven by interests, resulting in the same or similar industrial structure between cities (Liu, 2017). Industrial isomorphism is also one of the essential factors in measuring the development of inter-city urban integration. The study of regional industrial structure differences plays a vital role in optimizing the restricted spatial layout, adjusting and optimizing the industrial structure, and realizing the coordinated development of the industry. The similarity coefficient of industrial structure is the most common method of measuring the isomorphism of sectors to judge the degree of differentiation of industrial layout between cities (Xu, 2009). The calculation equation is as follows:
where equation, k represents the industry type, Xik represents the total industry proportion of industry k in region i, and Xjk represents the entire industry proportion of industry k in region j. Sij represents the industrial structure similarity coefficient between area i and region j, which ranges from 0 to 1. When Si is 0, the industrial structure is different. On the contrary, when Sij is 1, the industrial structure is the same. When Sij is more significant than 0.5, the degree of industrial structure convergence is high, and when Sij is less than 0.5, the degree of industrial structure convergence is small (Wei et al., 2010). If there are dynamic changes in different years, when ΔSij is positive, the industrial structure during this period is convergent. On the contrary, when ΔSij is negative, the industrial structure is divergent.
3.3 Transportation dimension
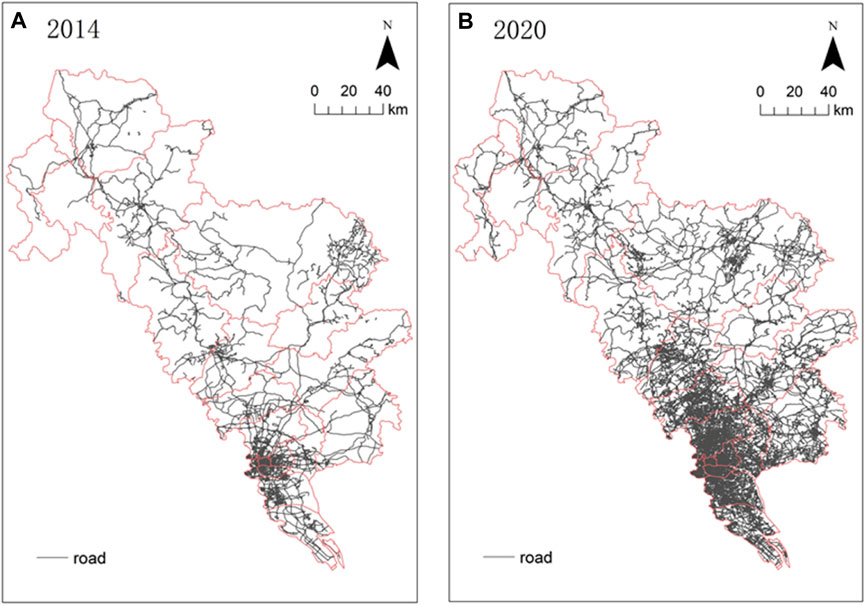
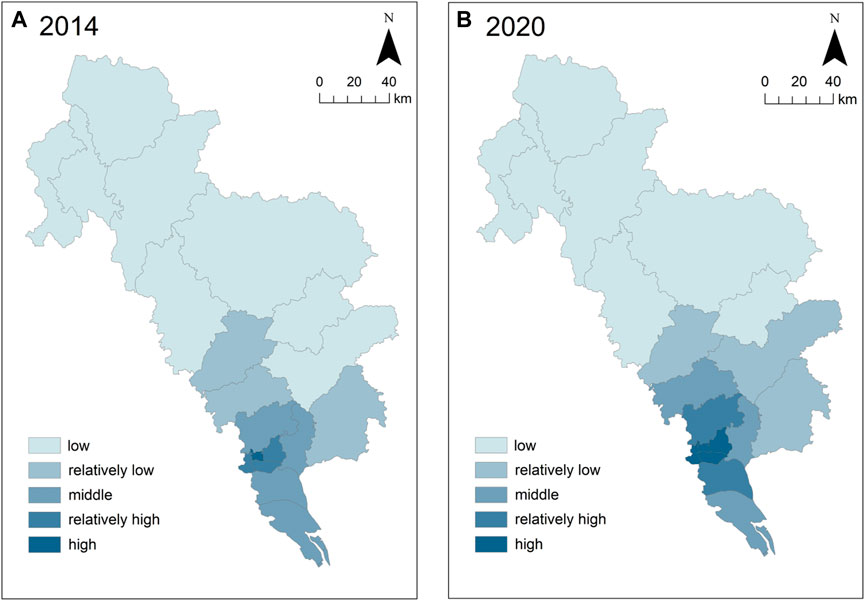
The urban road transportation network is one of the important facilities of a city, which provides a guarantee for the travel of residents and the delivery of goods, and promotes the development and cooperation between different urban areas (Wang et al., 2014). We import the OSM data selection road file into Arcgis, and import the processed Guangzhou-Qingyuan county-level layered file to obtain the original road network data of Guangzhou-Qingyuan in 2014 and 2020, as shown in Figure 3. The analysis is mainly conducted from two aspects, i.e., road network density and accessibility.
3.3.1 Road network density analysis
The road network density mainly evaluates the ratio of the total mileage of all roads in the area to the entire region. The larger the road network density, the denser the road network in the region, and the higher the level of transportation development in the region, which is conducive to planning inter-city transportation between cities and strengthening cooperation and exchanges. The specific equation is expressed as follows:
where equation, Dn represents the road network density in region n, in km/km2, Ln represents the total length of roads in region n, in km, and An represents the total land area in region n, in km2.
3.3.2 Transportation accessibility analysis
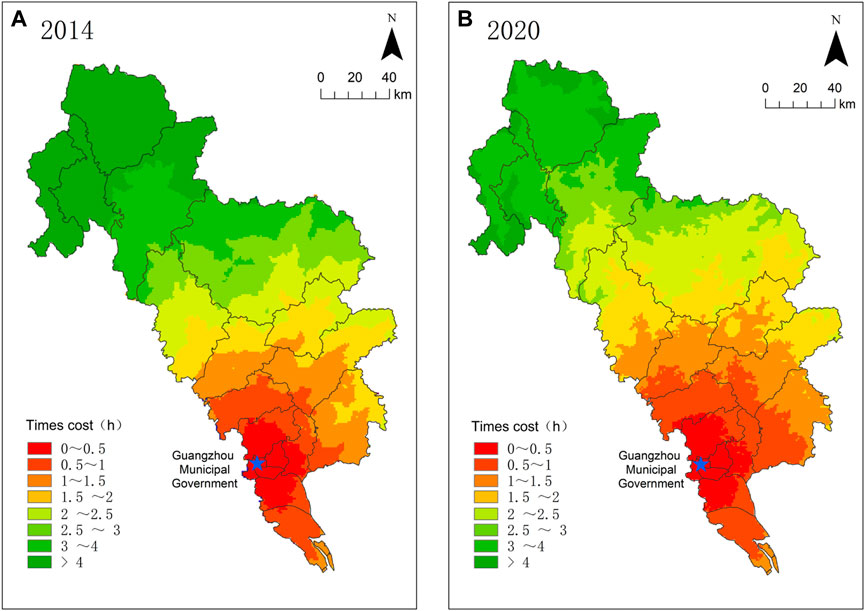
Transportation accessibility refers to the time cost of using the transportation system from the starting point to the destination (Liu et al., 2013). The less the transportation time between cities, the more conducive the economic, production, and life connections between regions. Since the Guangzhou metropolitan area is demarcated with Guangzhou city as the center, the accessibility in this paper refers to the time from the whole region of Guangzhou-Qingyuan to the Guangzhou city center (where the government is located). Specific operation steps: 1) import the Guangqing road network (line), Guangqing county boundary (surface), and Guangzhou city center (point) layer; 2) the road network attributes table to add “road classification” “design time” field and enter the road class against Table 3 and Table 4; 3) respectively vector road network (line) and county (surface) elements into a raster data of size 1,000 m, and use the raster calculator to make the county raster 1; 4) reclassification of the road network, the null value by line interpolation, environmental processing range and county raster the same; 5) open the raster calculator, so that the county raster one layer and the reclassified layer multiplied to get the raster traffic 6) use the raster calculator to convert the traffic time cost in “seconds” to “hours”; 7) use the manual classification of symbols into eight levels, 0–0.5, 0.5–1, 1–1.5, 1.5–2, 2–2.5, 2.5–3, 3-4, >4 h; 8) add cartographic elements and export the map.
3.4 Public service dimension
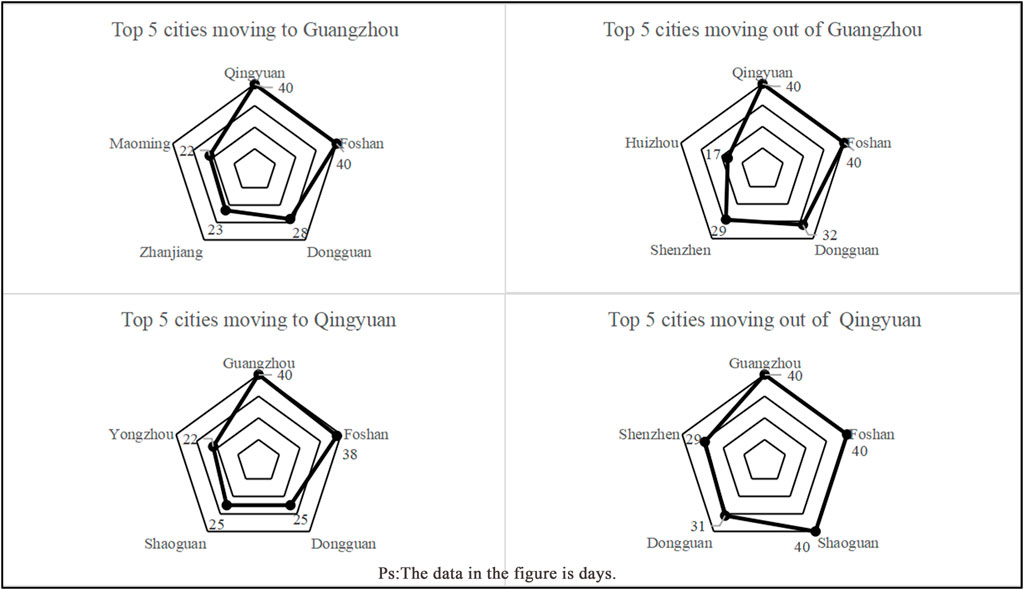
Population mobility is an important form of the exchange of regional social and economic activities. Population mobility reflects the functional relationship between cities to a certain extent, and thus reflects the characteristics of the urban integration of public service resources (Chen et al., 2022). Especially in the boundary area between cities, most residents will easily ignore the administrative boundaries of the city, e.g., trans-regional work, residence, studying, and medical treatment. The research results can reflect the intensity and direction of population migration in a certain period through the Baidu migration view and the information on ranking and percentage of in-migration and migration-out city (Feng et al., 2019). According to the official definition of the spring festival travel rush in China, the spring festival period is from 10 January to 18 February 2020, with a total of 40 days. The data in this paper are selected according to this time node. This paper only studies two cities, Guangzhou and Qingyuan. So, we conduct the statistical analysis only on the top five cities that move into Guangzhou and Qingyuan every day, and on the top five cities that move out of Guangzhou and Qingyuan. This can be used to reflect the inter-city migration of people between Guangzhou and Qingyuan.
4 Results analysis
4.1 Economic urban integration
4.1.1 Night light data: High light value in the southeast and low light value in the northwest
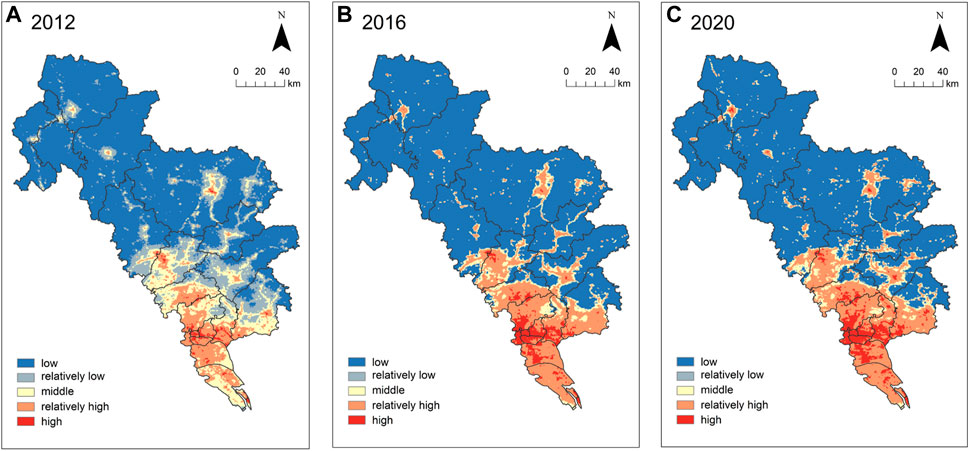
After processing, the DN value range of the study area in 2012 was 0–180.41, the DN value range in 2016 was 0–269.92, and the DN value range in 2020 was 0–329.19, reflecting that the night light value of Guangzhou-Qingyuan from 2012 to 2020 was generally increasing. The added value of the night light value from 2012 to 2016 was about 90, and the added value of the night light value from 2016 to 2020 was about 60. The former changed greatly. As shown in Figure 4, the distribution of night light values also has obvious changes. 1) On the whole, the lights are mainly distributed in the southeast, and the northwest area has almost low light values. 2) The light values in Guangzhou are mainly concentrated in the South and contiguous, while the distribution of light value in Qingyuan is relatively scattered, mainly concentrated in the center of each city, county, and district. 3) The change from 2012 to 2016 is the most obvious, the area of high light value has expanded, mainly in the main urban area of Guangzhou and the center of Qingyuan. Most of the lower light value areas have become medium or high ones, forming a polarization phenomenon of low and high light value areas. 4) From 2016 to 2020, the high light value area continues to expand outward based on the previous one. Some cities, counties, and district centers in Qingyuan also have high light value areas and more scattered light value areas. In Guangzhou, except for Huadu district, Conghua district, and a small number of areas in Zengcheng district, the rest have high light values or above. 5) In the boundary area of Guangzhou-Qingyuan, namely, Qingcheng district and Fogang county in Qingyuan, Huadu district and Conghua district in Guangzhou city, the light value changes from low to high, and the coverage of light expands to some extent, showing a tendency of interconnection.
The reason for the uneven distribution of light values is that the terrain of Qingyuan is high in the northwest and low in the southeast. The average altitude of the mountains in the “Three Lian and One Yang” (Lianzhou, Liannan, Lianshan, Yangshan) areas is 1,000 m, and the rest are located in river valleys with lower terrain. Therefore, the northwest of Qingyuan has less population gathering, less economic activities, and slower economic development, resulting in almost low light value in the entire northwest area, while the southeast of Qingyuan is relatively low, and it is the seat of the city, there are relatively more population and economic gathering activities, and the night light value is high. Guangzhou’s terrain is high in the north and low in the south. The main urban area is also in the south and has been a commercial center since ancient times. Therefore, there are many economic activities in the South, the population is concentrated and the urban development level is high.
From 2012 to 2020, the urban development level of Guangzhou-Qingyuan has been continuously improved, more foreigners have been attracted, the population density has increased, the infrastructure construction has been continuously improved, and the night light value has also continued to increase. The reason for the high light value in the boundary area of Guangzhou and Qingyuan is that with the development of the counterpart assistance work in Guangzhou-Qingyuan, the implementation of the integration of Guangzhou-Qingyuan and the drive of the Guangzhou metropolitan area, the economic cooperation and exchanges have been continuously strengthened, and the infrastructure has been improved, which has made it normal for people to work and live across the administrative boundary.
4.1.2 Commodity market: The growth trend of the commodity urban integration index is prominent
The results are shown in Figure 5. Generally speaking, with the increase of years, the commodity urban integration index of Guangzhou-Qingyuan shows an increasing trend, indicating that the difference in the residential consumption level in Guangzhou and Qingyuan and the degree of market segmentation are gradually narrowing. Besides, to a certain extent, it reflects the rapid economic development of Qingyuan and the continuous improvement of the daily residential consumption level. At the same time, the level of the urban integration of commodity markets from 2017 to 2020 has two stages. The first stage is from 2017 to 2018, the commodity market urban integration index of Guangzhou-Qingyuan is relatively low and the growth is slow, reflecting the relatively slow development speed of commodity market urban integration in this period. The second stage is from 2019 to 2020. The commodity market urban integration index of Guangzhou-Qingyuan is relatively high, and reaches the highest value of 5.07 in 2020, reflecting that the commodity market urban integration level has further improved during this period. With the deepening of the “Guangzhou-Qingyuan Integration” strategy and the further implementation of counterpart assistance work, the economic exchanges between the two cities have been strengthened, and the level of urban integration of the commodity market will continue to improve.
4.2 Industrial urban integration: The similarity coefficient of Guangzhou-Qingyuan’s industrial structure is relatively high, with apparent stages
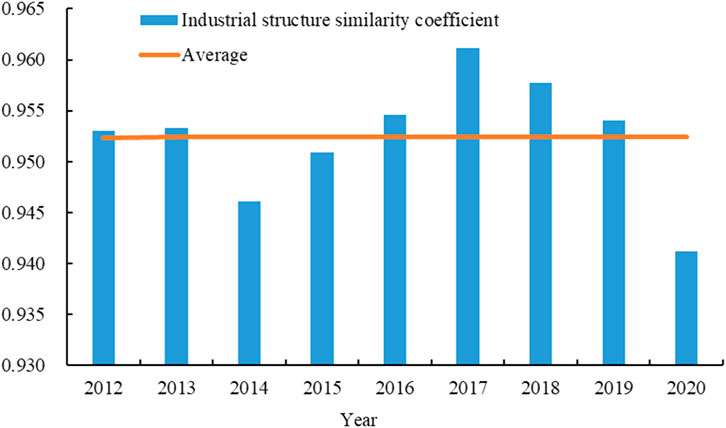
As shown in Figure 6: The similarity coefficient of industrial structure between Guangzhou and Qingyuan from 2012 to 2020 is between 0.94 and 0.96, with an average value of 0.9524, indicating that the similarity of industrial structure is high. But from 2017, it decreases, indicating that the industries of Guangzhou and Qingyuan appear to be differentiated and have a tendency to be misaligned. Industrial structure similarity coefficients of the two cities have the characteristics of temporal changes, which are mainly divided into two stages. The first stage is: From 2012 to 2017, the industrial structure similarity coefficient increased in general except in 2014. Specifically, although the industrial structure similarity coefficient was relatively small compared with the previous year, and the changes were not large, they were generally positive numbers, indicating that the industrial structure of Guangzhou and Qingyuan has converged and developed during this period. The second stage is as follows. The similarity coefficient of the industrial structure from 2017 to 2020 has been decreasing, which has been negative compared with that of the previous year, and has directly decreased by 0.01 in 2020, and decreased by 0.0118 in 2020 compared with that of 2012. In general, the industrial structure of Guangzhou-Qingyuan has a phenomenon of divergent development.
As shown in Figure 7: In terms of the added value of the three major industries, the primary and secondary industries in Guangzhou are developing steadily on the whole, while the tertiary industry has made progress in its steady development. The three industries in Qingyuan have maintained steady growth. However, relatively speaking, Guangzhou’s economy has developed rapidly, of which the total added value of the three major industries is much higher than that of Qingyuan. The modern service industry, strategic emerging industries, and advanced manufacturing industries are the leading industries. The secondary and tertiary industries have maintained good momentum. Although the output value of the tertiary industry in Qingyuan became the largest industry in 2013, the traditional manufacturing industry is still the pillar industry today.

FIGURE 7. The added value of the three major industries in Guangzhou (A) and Qingyuan (B) from 2012 to 2020.
From a macro perspective, the industrial structure of Guangzhou and Qingyuan is highly integrated, and the tertiary industry accounts for the largest proportion of the three industries. Further observation shows that the leading industries between Guangzhou and Qingyuan are different. The “desirable” industrial isomorphism with agglomeration effect as the main character is conducive to the development and competitiveness of regional competitive industries, while the “non-desirable” industrial isomorphism with competition as the main character will lead to the result that the industry is simple and repetitive at a low level, the products are highly similar, and the production capacity is superimposed form vicious competition (Xu et al., 2014), which is not conducive to regional and economic development. Guangzhou-Qingyuan belongs to the “desirable” industrial isomorphism. At first, Guangzhou provided industrial counterpart assistance to Qingyuan, and now the win-win cooperation between the two cities has been achieved, and the industrial cooperation and co-construction models of “Guangzhou Headquarters + Qingyuan Base,” “Guangzhou R&D + Qingyuan Manufacturing,” “Guangzhou Incubation + Qingyuan Industrialization,” etc. have been actively explored. The effect of industrial agglomeration has become increasingly prominent, the cooperation between the two places has been continuously strengthened, and the level of industrial integration between the two cities has steadily improved.
4.3 Transportation integration
4.3.1 Road network density: The grade changes are not noticeable, but the road network is constantly improving
It can be seen from Figure 8 that from 2014 to 2020 in Qingyuan, the road density level did not change significantly, most of which were low-density areas, and only the Qingcheng district was better, with the relatively low-density area. In Guangzhou, the changes are more obvious. Generally speaking, with Yuexiu district as the center point, the further out you go, the lower the road network density level. Conghua district changed from a low-density area to a relatively low-density area, and Huadu district changes from a low-density area to a medium-density area. Baiyun district and Panyu district changed from medium-density areas to high-density areas, and Liwan district, Tianhe district, and Haizhu district changed from relatively high-density areas to high-density areas.
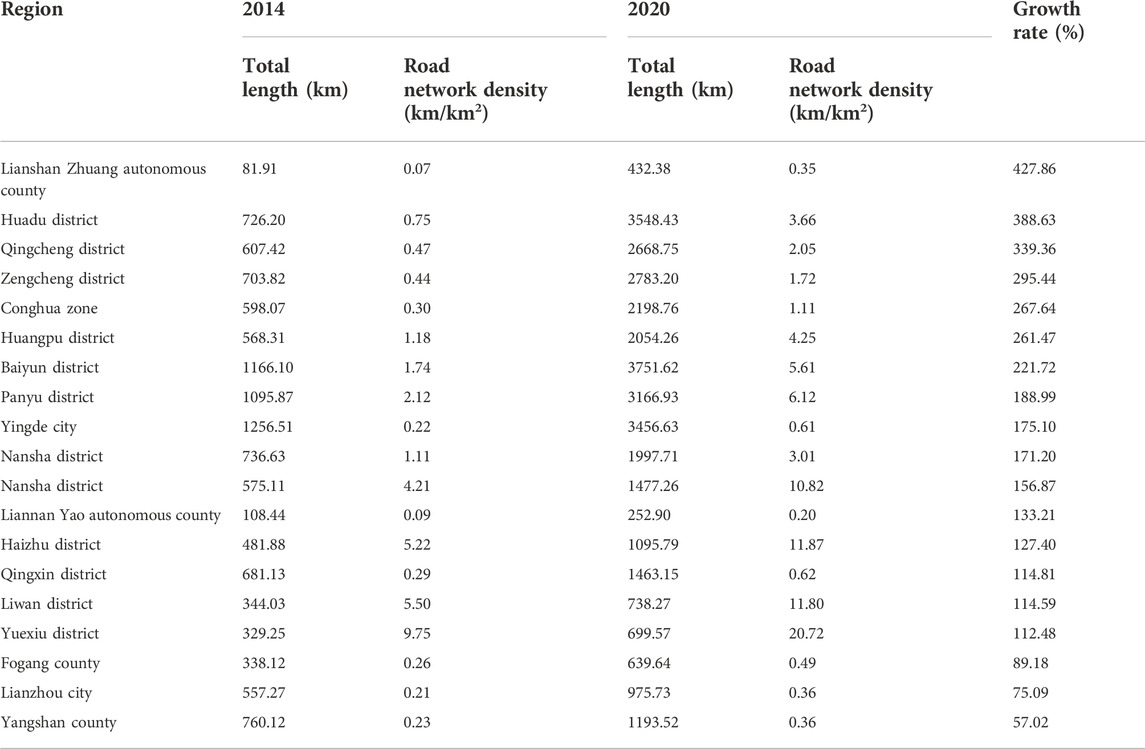
From 2014 to 2020, the number of Guangzhou-Qingyuan roads increased, and the road density also increased. However, the change in road density grade in Qingyuan is not obvious on the visualization map. Table 5 shows that on the whole, the road network density in Guangzhou-Qingyuan from 2014 to 2020 shows positive growth, and the road network is constantly improving. The growth rate of road network density in Lianshan Zhuang Autonomous County is as high as 427.86%, increasing from 81.91 km to 432.38 km. The main reason is that the geomorphological features of “nine mountains with half water and half farmland” brings difficulty to road development. However, with the rapid economic development and the rise of tertiary industry tourism, transportation accessibility is also greatly improved. The total length of the road network has also increased significantly. The growth rates of both Huadu district and Qingcheng district exceed 300%, and Huadu district increased from 726 km to 3,548 km, and Qingcheng district increased from 607 km to 2,668 km. These two districts are the boundary areas of Guangzhou and Qingyuan, indicating that economic growth, population density increase, and the continuous improvement of the transportation network make communication between Guangzhou and Qingyuan more convenient in various aspects such as economic cooperation, etc. The growth rate of other districts in Guangzhou is generally higher than that of the districts (counties) in Qingyuan, which indicates that the internal transportation network of Guangzhou is more perfect, and Qingyuan relatively lags.
4.3.2 Transportation accessibility: The overall structure presents a circle-layer structure, but the internal transportation accessibility is improved
The results are shown in Figure 9, in 2014 and 2020, the accessibility of various points in Guangzhou-Qingyuan to the Guangzhou city center has improved significantly. The transportation accessibility in 2014 showed an obvious circle layer structure and with the increase in distance, the time cost required increased. Although the transport accessibility in 2020 also showed a circle layer structure, the boundary area of the circle layer was more fluctuating and had obvious road orientation, and the time cost required was more accurate. From 2014 to 2020, the half-hour circle layer is relatively stable, with obvious changes as follows: In 2014, the 1-h circle in Guangzhou only covered the inner cities of Guangzhou, and for Qingcheng district and Fogang county, which are closest to Guangzhou, 1.5–2.5 h were needed to reach the center of Guangzhou, and the time cost of Lianzhou, Lianshan, and Liannan in Qingyuan reached more than 4 h. In 2020, the 1-h circle of Guangzhou city extended to the south of Qingcheng district, Qingyuan, and it took 1.5 h for the entire urban area of Qingcheng district in Qingyuan and most areas of Fogang county to reach the center of Guangzhou, and the time cost of most areas in Lianzhou, Lianshan, and Liannan in Qingyuan had been shortened from the original time cost of more than 4 h to 3–4 h.
4.4 Urban integration of public services: Frequent exchanges of social and economic activities and strong functional correlation
As shown in Figure 10, the top five cities for moving into Guangzhou are Qingyuan, Foshan, Dongguan, Zhanjiang, and Maoming. The top five cities for moving out of Guangzhou are Qingyuan, Foshan, Dongguan, Shenzhen, and Huizhou. The top five cities for moving into Qingyuan are Guangzhou, Foshan, Dongguan, Shaoguan, and Yongzhou, respectively. The top five cities for moving out of Qingyuan are Guangzhou, Foshan, Shaoguan, Dongguan, and Shenzhen. Whether moving into Guangzhou or Qingyuan or moving out of Guangzhou and Qingyuan, Guangzhou and Qingyuan are ranked first or tied for first place. Among them, on 11 January 2020 (the 17th day of the 12th lunar month), the first place to move into Qingyuan was Guangzhou, with a proportion of 46.56%. On the same day, the first place for moving out of Qingyuan was still Guangzhou, with a proportion of 37.55%. It reflects the large daily passenger flow in Qingyuan and Guangzhou during the Spring Festival, the two-way flow of population between cities and the high migration intensity, and the frequent exchanges of regional social and economic activities. This further shows the certain functional correlation between the two cities. In addition, at the end of the year, the phenomenon of increased migration intensity indicates that more people in Guangzhou and Qingyuan are employed and studied across regions.
According to the statistics of the cities, most of them are neighboring cities of Guangzhou or Qingyuan, which means that the geographical proximity is conducive to strengthening the two-way flow of population between inter-city. Among the cities that move into Guangzhou, Maoming and Zhanjiang which are far away from Guangzhou are also included, indicating that Guangzhou’s economic strength is strong, and social welfare undertakings such as medical care, education, employment, and infrastructure have developed well. Compared with Guangzhou, Qingyuan is less developed and the radiation capacity is weaker, but among the top five cities, Guangzhou and Qingyuan have the closest two-way population flow. The reason is that Qingyuan is the “back garden” of Guangzhou and the “Guangzhou-Qingyuan Integration” strategy has been supported by the provincial government and the state. As the integration is constantly deepening, various public service facilities for medical and healthcare, social welfare, education, inter-city travel, etc. have been continuously improved, and about 2,00,000 to 3,00,000 citizens live a life, reside, study and travel between Guangzhou and Qingyuan, and more than 1,00,000 people flow between the two cities every day. However, the urban integration of public services in Guangzhou-Qingyuan does not only cover living and working. Urban integration also has many problems to be solved. For example, the restriction of the household registration location when going to school, the difficulty in reimbursement for medical treatment, the complicated tax procedures, and few inter-city public transportation shifts, etc., which affects all aspects of Guangzhou-Qingyuan residents, and is not conducive to the urban integration of Guangzhou-Qingyuan.
5 Discussion
As a new phenomenon arising from the special urbanization process in China, urban integration is the breaking down of regional boundaries in terms of traffic access, facility sharing, industrial development, environmental protection, and citizen’s life between adjacent cities to achieve complementary advantages and improve regional collaborative development capabilities. In the region oriented by the goal of urban integration, administrative barriers should be gradually broken down in the process of urban development to form a trend of urban integration development and holistic progress in the whole region. It is necessary to rely on the dimensions of economic space connection, industrial structure, infrastructure, and public services to achieve inter-city collaboration, functional complementarity, and coordinated development. However, in the process of coordinated development, how can cities find their positions, develop in different ways, and integrate? How to make the “siphonic effect” and “trickle-down effect” of core cities form a benign ecological network system to achieve the goal of coordinated and symbiotic development of the metropolitan area, these issues will become the “pain points” and “difficulties” for the development of urban agglomerations in the Guang-Qing metropolitan area in the future. This paper mainly adopts multi-source data to explore the urban integration of Guang-Qing from four dimensions of economy, industry, transportation, and public services. Urban integration does not only cover these four dimensions, it also includes the urban integration of ecological environment and governance, information sharing, policy and system interoperability, etc., which is a comprehensive and multi-faceted process. Thus, this paper fails to cover more dimensions when analyzing the urban integration characteristics of Guangzhou-Qingyuan. Due to the difficulty of obtaining the relevant data, the complexity of processing, and the irregularity, some years are missing or changed in the research time of this paper from 2012 to 2020, resulting in discontinuity of data, and no in-depth exploration of transportation and public services integration research. With the national focus on the urban integration of the metropolitan area, the Guangzhou metropolitan area has developed rapidly, and the cooperation planning has become more detailed. The research on the urban integration issues of Guang-Qing and the development measures will be carried out from a more comprehensive and specific dimension, which will also become one of the future issues the urban integration research in the metropolitan area.
6 Conclusion and recommendations
6.1 Conclusion
Based on the studies of metropolitan areas and co-location by foreign scholars and combined with the current situation of Guangzhou-Qingyuan development, the process, spatial characteristics, and problems of Guangzhou metropolitan integration were analyzed from four dimensions of economy, industry, transportation, and public services by using NPP-VIIRS night lighting data, socio-economic data, OSM data, and population migration data. The conclusion are mainly summarized as follows.
Driven by the synergistic development of the Guangzhou metropolitan area, the economic cooperation and exchange between Guangzhou-Qingyuan have been strengthened. The lighting value of the Guangzhou-Qingyuan junction is also increasing. At the same time, the Guangzhou-Qingyuan Commodity Cohabitation Index shows a growing trend, and the difference in consumption level and market segmentation between Guangzhou and Qingyuan City is gradually narrowing, which reflects that the economic exchange between Guangzhou and Qingyuan becomes closer and the level of commodity market cohabitation will be improved continuously.
From 2012 to 2020, the similarity coefficient of the industrial structure between Guangzhou and Qingyuan is 0.94–0.96, but the industrial structure of the Guangzhou-Qingyuan region is developing from convergence to divergence, and the collaboration ability is strengthening. The leading industries of Guangzhou and Qingyuan are not the same, and the industrial demands can be well misaligned through industrial transfer and industrial assistance. From passive assistance to active co-construction, obvious results can be obtained, and Guangzhou and Qingyuan have gradually realized coordinated industrial development.
The Guangzhou and Qingyuan traffic show an obvious trend of integration, and the road network is developing fast. However, the travel time between the two cities is still long, and the accessibility of the two cities takes 1.5 h, which is not conducive to the connection between the two cities. The number of roads in Guangzhou is relatively dense, and the seven districts in the center can realize the “half-hour commuting circle.” However, the road density in Qingyuan is sparse, road development is difficult due to the topography, and the road network system is not perfect.
Due to the close historical foundation and social and cultural ties, as well as the differences in economic development, consumption level, and ecological environment between Guangzhou and Qingyuan, the inter-city movement of people is frequent, which has enhanced the level of public service integration between the two cities, but public service facilities such as education and medical care need to be improved.
6.2 Recommendations
The steady development of leading industries and promotion of industrial synergy: Optimize the development of the industrial layout of Guangzhou and Qingyuan, form a perfect industrial chain, form a regional industrial division of labor and cooperation pattern with comparable levels and complementary advantages, promote industrial co-location, and create industrial clusters with high development level and strong competitiveness in Guangzhou metropolitan area.
Improve the transportation network system and shorten the cost of travel time: A perfect transportation network system is the basis for the interconnection of capital flow, industrial flow, technology flow, and information flow between the two regions. Focus on building a clear, reasonable, and effective comprehensive transportation network, strengthening the connection between the urban areas of the two cities while promoting the integrated development of urban and rural areas in the peripheral areas, ensuring the efficient and rapid development of industries, and further expanding the coverage of the “30/60-min living circle” of Qingyuan City in the Guangzhou metropolitan area.
Promote the reasonable gathering of the population and strengthen the common construction of public services: focus on education, medical care, employment, and social security to ensure the protection of clothing, food, housing, and transportation for cross-city residents. In particular, the Guangzhou-Qingyuan joint area is more likely to form a densely populated area. The joint area should be included as part of the planning of public service facilities in Guangzhou, to develop the point first and then push it out with the surface, strengthen the common construction and sharing of public service facilities between the two places, and promote the integration of the Guangzhou metropolitan area.
Data availability statement
The original contributions presented in the study are included in the article/supplementary material, further inquiries can be directed to the corresponding author.
Author contributions
BT and ZH contributed to the topic selection, development of the framework and writing of the manuscript, and figures and the literature review. ZH contributed to the data analysis, drawings, the tables and the figures. All authors contributed to the article and approved the submitted version.
Funding
This research was funded by project of the 14th five-year plan for the development of Philosophy and Social Sciences in Guangzhou in 2021 (Grant No. 2021GZYB22); Project of Special Innovation Classes for Regular Universities in Guangdong Province (Grant No. 2020WTSCX136); College students’ innovative entrepreneurial training program (Grant No. 202213902008); Human Geography and Urban-Rural Planning, the Construction of Guangdong First-class Undergraduate Program (Grant No. F22MJ04JY); Guangzhou Xinhua University’s Educational Reform Project (Grant No. 2022J002).
Conflict of interest
The authors declare that the research was conducted in the absence of any commercial or financial relationships that could be construed as a potential conflict of interest.
Publisher’s note
All claims expressed in this article are solely those of the authors and do not necessarily represent those of their affiliated organizations, or those of the publisher, the editors and the reviewers. Any product that may be evaluated in this article, or claim that may be made by its manufacturer, is not guaranteed or endorsed by the publisher.
References
Ali Talib, D. M. N., Hashmi, S. H., Aamir, M., and Khan, M. A. (2022). Testing non-linear effect of urbanization on environmental degradation: Cross-country evidence. Front. Environ. Sci. 10, 1361. doi:10.3389/fenvs.2022.971394
Beaverstock, J. V., Smith, R. G., and Taylor, P. J. (1999). A roster of world cities. Cities 16 (16), 445–458. doi:10.1016/s0264-2751(99)00042-6
Cai, Y. (2021). Based on multi-source data, research on the process of urban integration and its influencing factors in the Jinan metropolitan area. Jinan, China: Shandong Normal University.
Chen, J. (2018). Is a unified management organization beneficial to curbing urban sprawl in metropolitan areas? —based on the comparative research of the yangtze river delta metropolitan area and the pearl river delta metropolitan area. Shanghai Econ. Res. 358 (7), 54–64. doi:10.19626/j.cnki.cn31-1163/f.2018.07.006
Chen, Y., Zheng, Z., Wu, Z., and Qian, Q. (2019). Review and prospect of night light remote sensing data applications. Prog. Geogr. 38 (2), 205–223. doi:10.18306/dlkxjz.2019.02.005
Chen, Z., Wang, J., and Li, Y. (2022). Intercity connections by expressway in metropolitan areas: Passenger vs. cargo flow. J. Transp. Geogr. 2022 (98), 103272. doi:10.1016/J.JTRANGEO.2021.103272
Clarke, N. (2009). What sense are “spaces of neoliberalism”? The new localism, the new politics of scale and town twinning. Polit. Geogr. 28 (8), 496–507. doi:10.1016/j.polgeo.2009.12.001
Du, G., and Zhou, M. (2021). Isomorphism measures regional economy and industry under the background of economic integration. J. Commer. Econ. (13), 153–155. doi:10.3969/j.issn.1002-5863.2021.13.039
Duan, D., and Liu, L. (2012). Research on the spatial development model of urban integration. Planners 28 (5), 91–94. doi:10.3969/j.issn.1006-0022.2012.05.018
Ehlers, N. (2001). The utopia of the binational city. GeoJournal 54 (54), 21–32. doi:10.1023/a:1021132413677
Fan, H., Hashmi, S. H., Habib, Y., and Ali, M. (2020). How do urbanization and urban agglomeration affect CO2 emissions in south asia? Testing non-linearity puzzle with dynamic STIRPAT model. Chn. J. Urb. Environ. Stud. 8 (01), 2050003. doi:10.1142/s2345748120500037
Fang, C. (2020). Supporting the high-quality development of Chinese urban agglomerations with metropolitan circles as the tripod. Zhangjiang Technol. Rev. (6), 30–33.
Feng, Z., Zhang, Y., Wei, Y., Zhao, Z., Pang, R., and Wang, S. (2019). The spatiotemporal pattern and dynamic mechanism of population flow during the Spring Festival in Changchun City based on Baidu migration data. Econ. Geogr. 39 (5), 101–109. doi:10.15957/j.cnki.jjdl.2019.05.012
Francisco, R., Pedro, P., Mauricio, C., and Grimaldi, D. (2021). A new methodology to support smartness at the district level of metropolitan areas in emerging economies: The case of Santiago de Chile. Sustain. Cities Soc. 67 (3), 102713. doi:10.1016/J.SCS.2021.102713
Fu, J., Geng, D., and Yang, D. (2020). Review the development of the urban integration in China's five major metropolitan areas and research countermeasures. Reg. Econ. Rev. (6), 101–110. doi:10.14017/j.cnki.2095-5766.2020.0114
Geng, H., Jiao, H., and Ye, L. (2022). Progress and prospects of metropolitan area integration research. Hum. Geogr. 37 (4), 1–9+86. doi:10.13959/j.issn.1003-2398.2022.04.001
Hashmi, S. H., Fan, H., Habib, Y., and Riaz, A. (2021). Non-linear relationship between urbanization paths and CO2 emissions: A case of south, south-east and east asian economies. Urban Clim. 37, 100814. doi:10.1016/j.uclim.2021.100814
Jean, G. (1957). Megalopolis or the urbanization of the northeastern seaboard. Econ. Geogr. 33 (3), 189–200. doi:10.2307/142307
Li, F., Zhong, J., Xie, S., and Li, X. (2016a). Evolution of the spatial distribution of population in the urban integration area of Guangfo. Trop. Geogr. 36 (4), 600–609. doi:10.13284/j.cnki.rddl.002866
Li, H., Wu, Y., and Wu, R. (2016b). Research on the governance of the urban integration: Taking Guang-fo area as an example. Hum. Geogr. 31 (5), 1–6. doi:10.13959/j.issn.1003-2398.2016.05.001
Li, L., Pan, C., Shuai, L., and Li, M. (2022). Ecological efficiency of urban industrial land in metropolitan areas: Evidence from China. Land 1 (11), 104. doi:10.3390/LAND11010104
Li, X., Xiao, R., Liao, Y., and Wei, Z. (2010). Discussion on the problems and planning countermeasures of Guangfo regional development under the urban integration. Urban Dev. Stud. 17 (12), 77–83. doi:10.3969/j.issn.1006-3862.2010.12.014
Liu, H., Shen, Y., Meng, D., and Xue, J. (2013). Research the concentration and spatial structure of Beijing-Tianjin-Hebei urban network based on transportation accessibility. Econ. Geogr. 33 (8), 37–45. doi:10.15957/j.cnki.jjdl.2013.08.008
Liu, P. (2017). Industrial isomorphism and industrial selection: A theoretical review. J. Technol. Econ. 36 (10), 92–99. doi:10.3969/j.issn.1002-980X.2017.10.012
Ma, X., and Dou, P. (2018). The development process and comparative study of urban agglomeration urban integration in China. Reg. Econ. Rev. (5), 105–115. doi:10.14017/j.cnki.2095-5766.2018.0108
Peng, Z., and Qu, N. (2011). Research on the development of urban integration in our country and the countermeasures of regional coordination planning. Mod. Urban Res. 26 (6), 20–24. doi:10.3969/j.issn.1009-6000.2011.06.004
Ramasamy, B., and Cremer, R, D. (1998). Cities, commerce, and culture: The economic role of international sister-city relationships between New Zealand and asia. J. Asia Pac. Econ. 3 (3), 446–461. doi:10.1080/13547869808724662
Sang, Q., Zhang, P., Luo, Y., and Gao, X. (2009). Research on the generation mechanism and countermeasures of the urban integration of Shen - Fu. Hum. Geogr. 24 (3), 32–36. doi:10.3969/j.issn.1003-2398.2009.03.007
Shen, L., Chen, S., and Wang, X. (2021). From the flow space perspective, the division and characteristics of the same-city area's development stages. Geogr. Res. 40 (9), 2558–2571. doi:10.11821/dlyj020200966
Song, S. (2021). Research on the countermeasures for developing urban integration in the Hefei metropolitan area. J. Party Coll. CPC Hefei Munic. Comm. 20 (4), 13–16. doi:10.3969/j.issn.1674-5000.2021.04.005
Sun, J., and Li, H. (2017). China's regional economic evolution trajectory and its overall trend. Reform (7), 18–29.
Sun, J., and Song, Z. (2021). Theoretical and practical exploration of metropolitan area construction under the background of dual circulation. J. Sun Yat-Sen Univ. Soc. Sci. Ed. 61 (03), 179–188. doi:10.13471/j.cnki.jsysusse.2021.03.019
Takanori, S., Kazuya, K., and Tetsuro, H. (2016). Logistics facility distribution in Tokyo Metropolitan area: Experiences and policy lessons. Transp. Res. Procedia 12 (12), 263–277. doi:10.1016/j.trpro.2016.02.064
Turok, I., and Bailey, N. (2004). Twin Track Cities?Competitiveness and cohesion in glasgow and edinburgh. Prog. Plan. 62 (3), 135–204. doi:10.1016/j.progress.2004.04.001
Wang, C., Wang, W., Zhang, M., and Cheng, J. (2014). Accessibility evaluation and evolution mechanism of China's road network. Acta Geogr. Sin. 69 (10), 1496–1509. doi:10.11821/dlxb201410009
Wang, P., and Zhang, X. (2016). The development of foreign urban agglomerations and its enlightenment to our country. Foreign Soc. Sci. (4), 115–122.
Wei, S., Chen, Y., and Geng, J. (2010). Isomorphism of Fujian and Taiwan industries based on similarity coefficient and R/S analysis method. Geogr. Res. 29 (3), 491–499. doi:10.11821/yj2010030012
Wu, R. (2014). Research on coordination mechanism from the perspective of networked governance——taking the urban integration of guangfo as an example. Urban Dev. Stud. 21 (1), 108–113. doi:10.3969/j.issn.1006-3862.2014.01.017
Xie, J., and Liu, L. (2009). Analysis of social functions of the urban integration and the perspective of social planning. J. Guangzhou Univ. Soc. Sci. Ed. 8 (8), 24–28+85. doi:10.3969/j.issn.1671-394X.2009.08.006
Xing, M. (2007). Some thoughts on the urbanization of Shen-Fu. Urban Plan. (10), 52–56. doi:10.3321/j.issn:1002-1329.2007.10.010
Xu, T., Wei, S., and Wang, Y. (2014). Discussion on the concept of urban integration and its definition. Soc. Sci. (11), 56–60. doi:10.3969/j.issn.1002-3240.2014.11.013
Yin, L. (2016). Research on the practical evaluation and promotion policy of urban integration: Take Guangzhou-Foshan's urban integration as an example. Urban Insight (3), 53–66. doi:10.3969/j.issn.1674-7178.2016.03.006
Zeng, Q., Deng, J., Zhang, Y., and Pan, F. (2012). Research on urban integration based on new institutional economics. Urban Insight (2), 78–86. doi:10.3969/j.issn.1674-7178.2012.02.011
Zhang, J., Liang, Y., Cui, L., Guan, Y., and Yang, Q. (2021). Analysis of economic agglomeration characteristics of Beijing-Tianjin-Hebei urban agglomeration based on NPP-VIIRS night light data. J. Southwest Univ. Nat. Sci. Ed. 43 (12), 95–104. doi:10.13718/j.cnki.xdzk.2021.12.012
Zhang, W. (2003). Discussion on the concept, characteristics, and planning of the metropolitan area. Urban Plan. (06), 47–50. doi:10.3321/j.issn:1002-1329.2003.06.010
Zhang, X., and Lin, Y. (2019). Metropolitan area construction: Strategic choice for coordinated regional development in the new era. Reform (2), 46–55.
Zhang, X. (2018). Promoting the high-quality development of urban agglomerations through the construction of the metropolitan area. Shanghai Urban Manag. (5), 2–3. doi:10.3969/j.issn.1674-7739.2018.05.001
Zhang, Y., and Xiang, B. (2021). The measurement of urban agglomeration integration level and its economic growth effect research: Empirical evidence from China's top ten urban agglomerations. Macroeconomics (12), 136–148+158. doi:10.16304/j.cnki.11-3952/f.2021.12.010
Keywords: metropolitan area urban integration, multi-source data, multi-dimensional, Guangzhou-Qingyuan, spatial characteristics
Citation: Tang B and Huang Z (2023) Research on the spatial characteristics of urban integration from multi-dimensions: A case study in the Guangzhou-Qingyuan metropolitan area. Front. Earth Sci. 10:1022982. doi: 10.3389/feart.2022.1022982
Received: 19 August 2022; Accepted: 24 November 2022;
Published: 18 January 2023.
Edited by:
Tengfei Long, Aerospace Information Research Institute (CAS), ChinaReviewed by:
Hongchao Fan, Norwegian University of Science and Technology, NorwayShujahat Haider Hashmi, Bahria University, Pakistan
Copyright © 2023 Tang and Huang. This is an open-access article distributed under the terms of the Creative Commons Attribution License (CC BY). The use, distribution or reproduction in other forums is permitted, provided the original author(s) and the copyright owner(s) are credited and that the original publication in this journal is cited, in accordance with accepted academic practice. No use, distribution or reproduction is permitted which does not comply with these terms.
*Correspondence: Bo Tang, dGJhbGxlbjE5NkAxNjMuY29t
 Bo Tang
 Zhangdi Huang