 Hao Liang1,2*
 Ke Zhang1,2
 Zhigang Li1,2Zhen Chen1
 Gege Hui1,2Ping Huang3Qingying Tian4
 Yongjie Tang1,2
 Cong Chen1,2Yipeng Zhang1,2
 Xiaohui He1,2Yonggang Yan1,2Xiangming Dai1,2Zhongyun Li5
 Weitao Wang1,2
 Peizhen Zhang1,2
- 1Guangdong Provincial Key Laboratory of Geodynamics and Geohazards, School of Earth Sciences and Engineering, Sun Yat-sen University, Zhuhai, China
- 2Southern Marine Science and Engineering Guangdong Laboratory, Zhuhai, China
- 3GDZD Institute on Deep-Earth Sciences, Guangzhou, China
- 4Guangdong Provincial Seismological Bureau, Guangzhou, China
- 5School of Tourism and Geography, Shaoguan University, Shaoguan, China
While understanding the long-term slip rate of active normal faults is essential for the comprehensive assessment of seismic activity, it is difficult due to the absence of age control in the erosional bedrock region. The preserved sequence of wave-cut platforms in granite allows exploration of the long-term slip rate in the footwall of some normal faults. We investigated wave-cut platforms in the southern Pearl River Delta (PRD), a coastal delta transected by the seismically active Littoral Fault Zone (LFZ) in the northern South China Sea, to derive slip rates and their impacts on the seismic hazard potential. We mapped a flight of four wave-cut platforms (T1–T4), dated the T2 and T4 platforms by 10Be cosmogenic nuclide dating, and used the absolute age to correlate the un-dated platform to global sea-level highstands. Our results allocate the ages of 128 ka, 197 ka, and 239 ka to the upper three wave-cut platforms and yield temporally various uplift rates ranging from 0.30 to 0.38 mm/a during 239–128 ka to 0.09 mm/a since 128 ka. A decrease in the uplift rate, which coincided with a decreased subsidence rate within the PRD in previous work, implied a weakened differential uplift onshore of the LFZ system. Our findings infer that the transgression event occurred as early as marine isotope stage (MIS) 7 in the PRD, consistent with the view that Pleistocene sedimentation began in MIS 5 or earlier in the PRD.
Introduction
The slip rate at the coastline from the area of distributed normal faulting in the continental margin is commonly used to gain insights into the processes of intraplate deformation (Merritts and Bull, 1989; Monaco et al., 1997; Palyvos et al., 2005). Because the inner edge between a subhorizontal wave-cut platform and a steep coastal cliff represents an approximation of zero height above sea level at the time of platform formation, their current altitudes can be used to correlate with oscillating sea-level highstands and to further quantify the slip rate of faults for long-term seismic hazard analysis (Roberts et al., 2013; Jara-Muñoz et al., 2015; Meschis et al., 2018; Pedoja et al., 2018). However, obtaining precise dating results on erosional or thin depositional wave-cut platforms is challenging and, thus, less studied. Fortunately, cosmogenic nuclide dating provides the exposure age of the wave-cut platforms, and further permits slip rate calculations when the initial and modern altitudes of platforms are determined (Marquardt et al., 2004; Saillard et al., 2011; Rodríguez et al., 2013). This approach accurately evaluates Quaternary tectonic activity in erosional bedrock regions, which helps to quantitatively understand long-term seismic hazard assessment along faults.
The Pearl River Delta (PRD), where major drainages converge into the South China Sea from several estuaries, is one of the largest coastal deltas in China (Figure 1). The bedrock of the PRD is predominately composed of Mesozoic granite and is cut through by a set of conjugate ENE-striking and NNW-striking faults (Huang et al., 1982; Chen et al., 2002; Yao et al., 2008). The ENE-striking Littoral Fault Zone (LFZ) system is a major intraplate extensional zone in the northern South China Sea that could present potentially intense seismic activity (Liu, 1985; Zhao et al., 2004; Cao et al., 2018; Hui et al., 2021; Dai et al., 2022a; Hui et al., 2022; Li et al., 2022) and has caused several strong earthquakes historically [e.g., the 1918 Ms 7.5 Nan’ao earthquake, Xia et al. (2020)]. To elucidate the slip rates of this active normal-fault system, numerous samples from the subsiding hanging wall of the ENE-striking faults where Quaternary deposits were preserved have been dated (Huang et al., 1983, 1985; Chen et al., 1994; Yao et al., 2008). However, few dating results exist from the uplifting footwall due to poor preservation for sediment dating. Thus, understanding the longer-term activity of these normal faults through the Quaternary, which requires robust dating on both fault walls, is lacking. Fortunately, Pleistocene differential uplift is visible in sequences of preserved wave-cut platforms throughout the coast in the PRD. In this study, we present sequential wave-cut platforms in the footwall of a coastal ENE-striking fault in the southern PRD. We dated the granite-composed wave-cut platform according to the 10Be cosmogenic depth profile, calculated the uplift rates, and correlated the un-dated platforms to past eustatic sea-level highstands based on the best-fit predictions. As a result, we identified marine isotope stages (MISs) 5e, 7a, and 7e platforms in the study site. Moreover, we observed temporally varied slip rates before and after approximately 128 ka, which may be relevant to a weakened differential uplift onshore in the LFZ system.
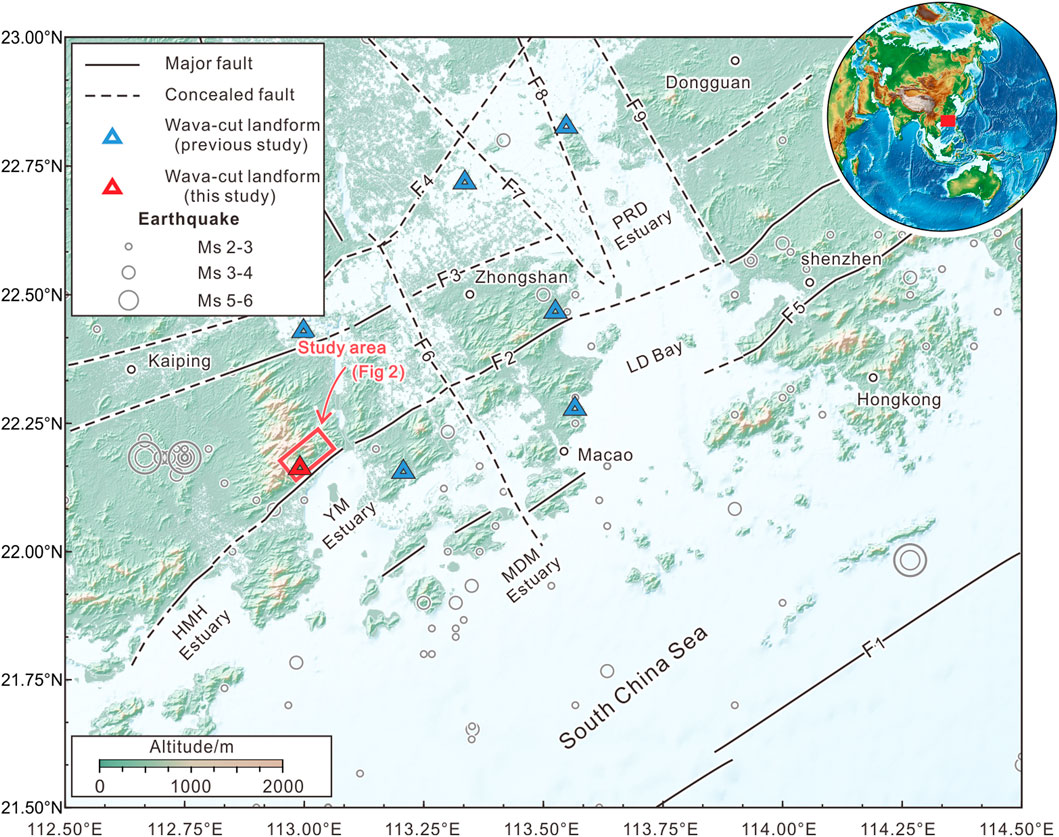
FIGURE 1. Tectonic setting of the northern margin of the South China Sea, southern China. The earthquake locations are constrained to a depth of <30 km between 1976 and 2022 from data from the China Earthquake Network Center and Guangdong Provincial Seismological Bureau. The faults are adapted from Huang et al. (1982), Yu et al. (2016), and Huang et al. (2021). The locations of the wave-cut platforms in previous studies are from Huang et al. (1982), Jiang and Hu (1994), Wang et al. (2011), and Zhao (2017). F1: Littoral Fault Zone; F2: South Wuguishan Fault; F3: North Wuguishan Fault; F4: Xinhui–Shiqiao Fault; F5: Wuhua–Shenzhen Fault; F6: Xijiang Fault; F7: Baini–Shawan Fault; F8: Hualong–Huangge Fault; F9: Nangang–Taiping Fault. The topography is from the Shuttle Radar Topography Mission (SRTM) digital elevation model at 90-m resolution.
Background
Brief genetic process of wave-cut platforms
A new wave-cut platform is created by continuous wave abrasion and consists of two distinct features: a gently seaward dipping erosional platform and a seaward dipping sea cliff (Armijo et al., 1996). The junction of the platform and sea cliff is the inner edge of the platform and often preserves the wave-cut notch. The inner edge of the platform occurs at the shoreline and represents the peak of local sea level at a short time of its formation (<1 ka). Hence, the wave-cut platform can correspond to the fixed dates of highstands (e.g.,128, 197, 239, 290, or 338 ka). Platforms or notches that are formed below the highstand are destroyed or overprinted by wave erosion during subsequent sea-level highstands. With tectonic uplift, the platform rises above sea level and becomes a paleo-horizontal indicator.
Littoral Fault Zone
The LFZ is an ENE-striking intraplate deformation zone along the northern margin of the South China Sea. The entire fault zone extends approximately 1,000 km along the South China coastline with an approximate width of 20 km (Liu, 1985; Zhao et al., 2004; Cao et al., 2018; Hui et al., 2021, 2022). Offshore of the PRD estuary at water depths of 30–50 m, the LFZ (F1) presents right-step dextral features on the horizontal view, and southeast-dipping normal faulting in the vertical view (Liu, 1985; Zhao et al., 2004; Cao et al., 2018; Hui et al., 2021, 2022). Seismic profiles reveal that the LFZ acted as a northern boundary fault of the South China Sea with a width of 6–10 km (Li et al., 2022). The Cenozoic history of the LFZ is complex, containing initial fault activity of low-angle basement decollement, then inherited high-angle SE-dipping normal faulting, and finally strike-slip faulting. The active LFZ had potentially produced 18 large earthquakes (>Ms 6.0), including the Ms 7.0 Nan’ao earthquake in 1600, Ms 7.5 Qionghai earthquake in 1605, and Ms 7.5 Nan’ao earthquake in 1918 (Xia et al., 2020; Dai et al., 2022; Hui et al., 2022). Onshore, the granitic basement of the PRD is transected by three NE- to ENE-striking faults (South Wuguishan Fault, F2; North Wuguishan Fault, F3; and Xinhui–Shiqiao Fault, F4, Figure 1) and several NNW-striking faults (Chen et al., 2002; Yu et al., 2016). The NE- to ENE-striking faults exhibit normal faulting with high dipping angles (Huang et al., 1985; Chen et al., 1994), showing uplifts in their footwalls. The NNW-striking faults bound the river course and segmented the NE- to ENE-striking faults in places, but their activities are less well known. We are interested in the onshore ENE-striking F2 in the southern PRD because it appears to control the opening of estuaries and dominate the differential uplift that can be explored through the mapping and dating of wave-cut platforms.
Sediment dating in the PRD
Following long-term peneplanation since the Oligocene (Huang et al., 1982), sedimentation in the PRD only produced two Quaternary terrestrial-marine units: T1–M1 (Terrestrial–Marine units 1, upper) and T2–M2 (Terrestrial–Marine units 2, lower) that correspond to sea-level fluctuations (Huang et al., 1982; Zong et al., 2009b; Xu et al., 2022). The T1–M1 unit has a consensus age of Holocene (Zong et al., 2009a; Xu et al., 2020), whereas the deposition age of the T2–M2 unit remains controversial. Early works dated the M2 unit to MIS 3 (approximately 32–64 ka) by the 14C approach (Huang et al., 1982; Chen et al., 1994; Wang et al., 2009). However, subsequent studies suggested that contamination with younger carbon and the upper limit of radiocarbon dating (<50 ka) would lead to significant age underestimation (Yim et al., 1990, 2008; Zong et al., 2009b; Yu et al., 2016) and suggested MIS 5 (approximately 82–128 ka) for M2 deposition. The wide disparity in the time results in various interpretations of the tectonic context of the PRD in the Late Quaternary. In the MIS 3 view, M2 formed during the highstand of MIS 3 (approximately −60 m to −80 m) and was tectonically raised to the modern average depths (approximately −15 m to −30 m), for which the dates are obtained from quartz optically stimulated luminescence (OSL) of sandy sediments in the T2 unit (Tang et al., 2011; Wang et al., 2015). In contrast, in the MIS 5 view, M2 formed during the highstand of MIS 5 (approximately −20 m to 5 m) and tectonically subsided to the modern average depth, a view that is supported by feldspar OSL dating (Yim et al., 2008; Zong et al., 2009b; Yu et al., 2016; Xu et al., 2022). One way to address the dipolar age issue is to determine a regional uplift rate and examine whether deposits related to the MIS 3 highstand could rise to the modern depth based on the resultant rate. This challenge motivated us to examine landforms related to highstands in the erosional area. Wave-cut platforms, which occur where uplift outpaces sea-level highstands, commonly document long-term tectonic activity (Armijo et al., 1996; Roberts et al., 2013, 2013; Jara-Muñoz et al., 2015; Meschis et al., 2018; Pedoja et al., 2018; Robertson et al., 2019; Racano et al., 2020) and are ideal for addressing the dipolar age issue. A previous study indicated that at least 67 sites of wave-cut platforms (or notches) are preserved in the PRD (Wang et al., 2011). Because most sites preserved few sediments and lacked age control, previous studies provided only a rough understanding of tectonics (Wang et al., 2011; Zhao, 2017). In our recent investigation, wave-cut platforms preserved in granite were observed along the footwall of the coastal F2 (Figure 1), which is suitable for 10Be cosmogenic exposure dating. We conducted field investigations, digital elevation model (DEM) measurements, and dating to allocate the highstands to wave-cut platforms and then discussed differential uplift in the PRD region.
Methods
Investigation of the wave-cut platforms
Because the inner edges of the wave-cut platforms represent paleo-sea-level highstands, we mapped the platform extent through topographic profiles from a 12.5-m DEM (from Advanced Land Observing Satellite-1, ALOS 12.5-m resolution DEM, https://search.asf.alaska.edu) and field-based measurements. Because of thick vegetation and their relatively small size, it was difficult to recognize the apparent extents of the wave-cut platforms along their strike solely from the DEM data. Therefore, we selected 13 serial topographic profiles perpendicular to the strike of the coast (Figure 2) and recorded the positions and altitudes of the landward up-dip slope breaks as indicators of the inner edges of the wave-cut platforms. Areas with apparent fluvial incisions were skipped to ensure wave-cut-induced geomorphic features. We defined each inner edge of the wave-cut platform based on three or more slope breaks with similar altitudes in the topographic profiles. The DEM-based inner edges were verified through field observations with indicators including slightly seaward-sloping surfaces that were up-dip bounded by abrupt paleocliff-like features or marked wave-cut notches and stacks. Field measurements were recorded using a differential global positioning system (DGPS; vertical error up to 0.1 m) and laser distance measuring equipment (0.1 m resolution within 300 m). The verified inner edges were correlated with DEM elevation to obtain a robust regional cross-section of the uplifted wave-cut platform. Each platform was ordered from low to high and specified with subscripts.
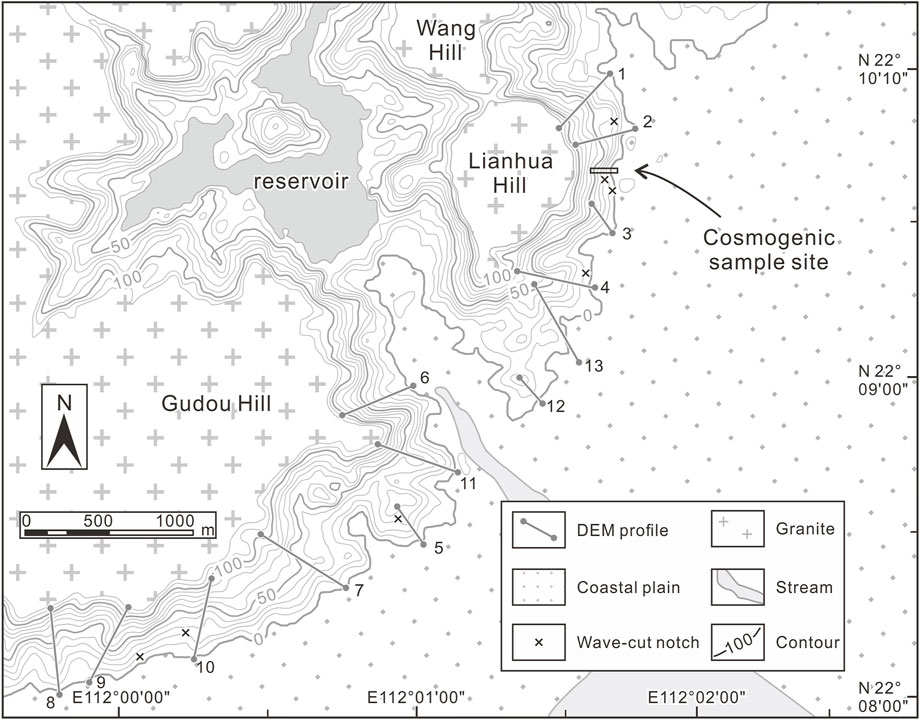
FIGURE 2. Simplified topographic and geological map of the study area. Locations of topographic profiles 1 to 13 and the 10Be cosmogenic sampling site are shown with a 10-m topographic contour spacing interval ranging from 0-m to 120-m at altitude.
Chronological sampling, preparation, and modeling approach
We applied cosmogenic 10Be exposure dating to the granite platform treads to constrain the potential formation ages of the wave-cut platforms. For the surface sample, we collected one sample on a wave-cut platform without apparent weathering. For the depth profile, we collected four samples from a ∼1-m man-made quarried wall downward at intervals of 25–35 cm/site. Because of rainfall and intermittent runoff, part of the platform surface was eroded at the top of the quarried wall. The erosional thickness between the platform extent to the edge of the quarried wall was estimated for correction in the depth profile modeling. Approximately 1,500 g of rock was collected for each sample. The samples were pretreated at the Guangdong Provincial Key Laboratory of Geodynamics and Geohazards and the State Key Laboratory of Environmental Geochemistry, Institute of Geochemistry, Chinese Academy of Sciences, as described by Kohl and Nishiizumi (1992).
The cosmogenic nuclide concentration of surface (Nz(t), atoms/g) exposed at time t (a) at constant production and erosion rates can be expressed as:
where Pn,0, Pm1,0, and Pm2,0 are the surface production rates (atoms/(g*a)) induced by nucleons, negative muons, and fast muons; Λn, Λm1, and Λm2 are the attenuation lengths (g/cm2) of the nucleons and muons (negative and fast), respectively; z is the surface depth (cm); λ is the decay constant; ρ is the density (g/cm3); and r is a constant erosion rate (cm/ka).
For the depth profile samples, the measured 10Be concentration (C, atoms/g) included the in situ-produced (Nz, atoms/g), and the inherited (Cinℎ, atoms/g) concentrations:
where
Te is the effective exposure age (ka), which is the time required to accumulate a concentration Nz at production rate Pz without erosion and radioactive decay (Wang and Oskin, 2021).
In realistic cases, the estimated total eroded thickness (D, cm) from field evidence can be more straightforward than obtaining an erosion rate r. With eroded thickness, the effective exposure age can be rewritten as:
Taking account of Eq. 3, one would expect to use linear regression to obtain the inheritance. To rewrite Eq. 3 into a linear form, the natural logarithm of the Tem over Ten ratio can be expressed by Maclaurin expansion as an approximation (Wang and Oskin, 2021):
Bringing Eq. 4 into Eqs 1, 2 results in the following,
where
In which Eq. 5 satisfies the linear form and linear least squares can be applied. By applying linear least squares inversion with known production rates, eroded thickness, and sample concentrations, the fitted Ten and Cinh can be determined.
To compute the exposure age, inheritance of cosmogenic production, and estimated erosion rate of the depth profile, we applied the Monte Carlo approach described by Wang and Oskin (2021) to find the best-fit results according to the distributions of the predicted iterations. To compute the exposure age of the surface sample, we applied a web-based calculator (https://crep.otelo.univ-lorraine.fr/#/samples) to obtain a reference age, assuming that the erosion rate and inheritance from the depth profile are constant over time. The detailed methods for sample pretreatment and calculation of cosmogenic nuclide concentrations are shown in the Supplementary Material.
Allocating the wave-cut platforms to sea-level highstands
The predicted elevation of the highstands (Ep) can be calculated from the relationship between the highstand age related to the wave-cut platform formation age (T) and the sea-level elevation of the highstand (SL) under a given uplift rate (u):
If the highstand age (T) is independently known, an average uplift rate (u) over the duration (T) is easily obtained by Eq. 6. In a realistic case, a constant uplift rate over time is questionable, which could significantly affect the allocation between Quaternary sea-level highstands and individual wave-cut platforms. We applied the following process to test the uplift-rate scenarios: (a) obtain an initial uplift rate (u0) by correlating the elevation (Em) of a dated wave-cut platform (in an age of T0) with sea-level data, assuming a constant uplift rate through T0; (b) apply u0 to examine whether Ep matches all Em in the study area; (c) if not, iterate a new uplift rate (ui) to find the best fit for the elevations of the older wave-cut platforms (Epi) at Ti (greater than T0), which can be expressed as:
The fit between Ep and Em is evaluated by their absolute difference (ΔE) for a given highstand age (Ti) and uplift rate (ui). The elevations (SL) and ages (Ti) of each highstand are up to 500 ka, from Grant et al. (2014). The calculations are facilitated by the uplift rate (ui) in an interval of 0.01 mm/a. We defined the best-fit uplift rate (ui) of each undated platform by ΔE < 5; lower platforms with fitted uplift rates should correlate with younger highstands and a uniform uplift rate in individual glacial-interglacial cycles.
Uncertainties and errors
The average elevation measurement errors from DEM were ±10 m. The uncertainties in 10Be concentrations, as shown in Table 1, depend on the combined uncertainties by sampling (<5%), propagating the production rate and analytical uncertainty in the laboratory. Sea-level curve uncertainties vary with the data used. The reported uncertainty of the Grant et al. (2014) curve is 12 m.
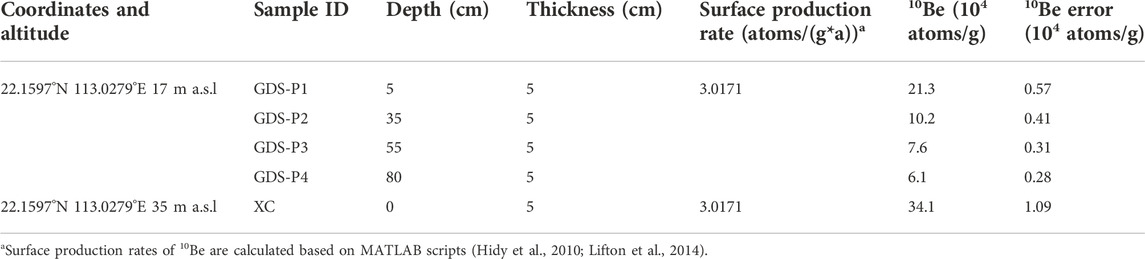
TABLE 1. 10Be sample locations and analysis.
We applied the standard error (SE) described by Robertson et al. (2019) to propagate the uplift value error equation:
where u is the uplift rate, σH is the combined uncertainty for the measured wave-cut platform elevation and sea-level curve, HT is the measured inner-edge elevation of the wave-cut platform, HSL is the predicted sea level of the highstand, and σT is the dating error.
Results
Elevation of the wave-cut platforms
From the 13 DEM-based topographic profiles and approximately 40% field-based verifications excluding areas with thick vegetation or limited access to platforms, we identified the inner edges of the wave-cut platforms in the study area (Figures 3A,B). The cross-plots of DEM-based inner-edge elevations against the field-based inner-edge elevations provided confidence in the verification of the wave-cut platforms (R2 = 0.989; Figure 3C). According to the inner-edge elevations, a flight of four wave-cut platforms was defined in the study area (Figure 3D).
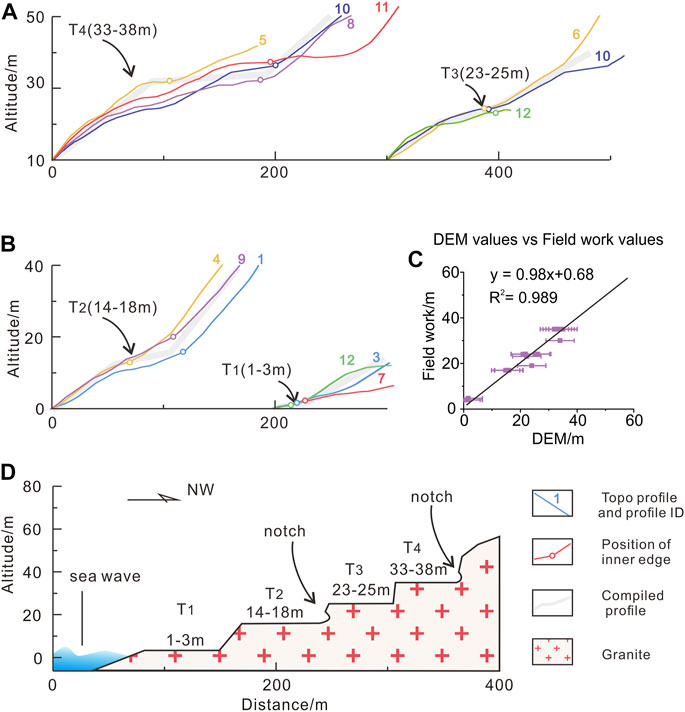
FIGURE 3. Compiled profiles of wave-cut platforms reproduced by digital elevation model (DEM)-based topographic profiles. The elevations of the slope breaks are at altitudes of 33–38 m and 23–25 m in (A), and at 14–18 m and 1–3 m in (B). The profile IDs are labeled. (C) Cross-plots of DEM-based inner-edge elevations against the field-based inner-edge elevations. (D) Cross-section of wave-cut platforms in the study area.
The T4 platform, bounded landward by inner edges reaching an altitude of 33–38 m above sea level (a.s.l.; Figures 3A, 4A), is characterized by remnants of narrow platforms that are carved in Mesozoic granite. Notches can be observed close to the inner edge of the platform, without apparent weathering. We collected one sample (XC) on the wave-cut platform surface (Table 1). Downslope, the T3 platform outcrops with the altitude of the inner edge ranging from 23 to 25 m a.s.l (Figures 3A, 4B). Because of thick vegetation, the narrow T3 platforms are visible only in a few places.
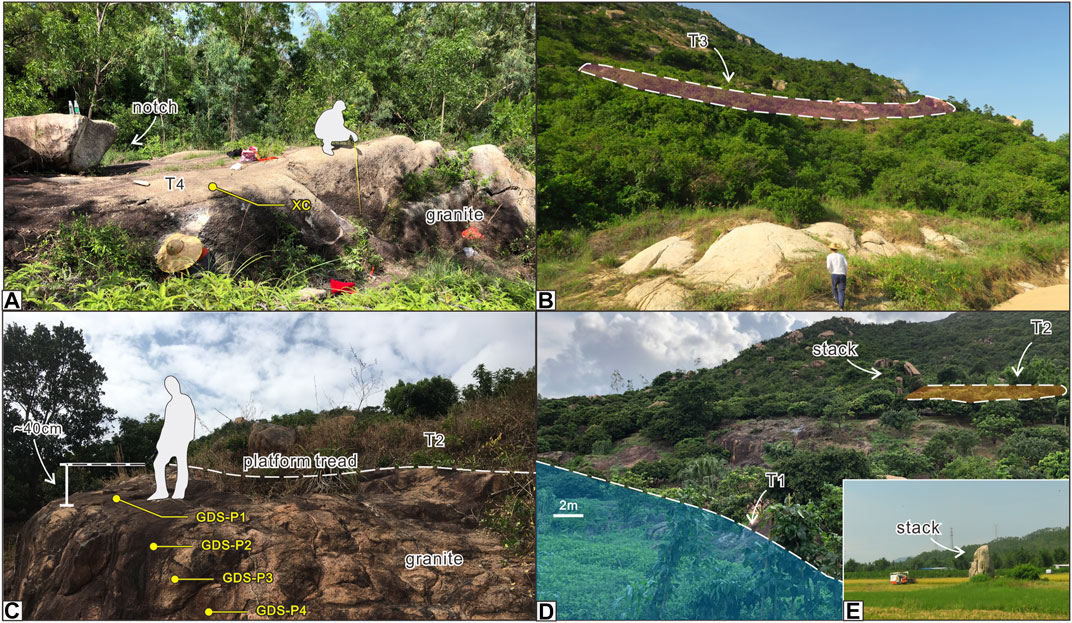
FIGURE 4. (A) View of the T4 platform with a notch close to the inner edge. (B) View of the T3 (red shading) platform. (C) The T2 platform and the locations of 10Be cosmogenic dating depth profile samples; note that approximately 40 cm of bedrock was eroded. (D) View of T2 (yellow shading), and T1 (blue shading) platforms. (E) The sea stack is preserved on the T1 platform close to the coastal plain.
The T2 platform is extensive, with the inner edge ranging from 14 to 18 m a.s.l. (Figure 3B). Because of rainfall and intermittent runoff, approximately 40 cm of bedrock was eroded at the seaward edge of the platform. Quarrying was conducted on the platform to expose a freshly quarried wall for 10Be depth profile dating (Figure 4C). We collected four samples (GDS-P1to GDS-P4) downward the platform tread at 25–35-cm intervals. The T1 platform is the lowest order of the terrace sequence, with an altitude of 1–3 m a.s.l. This platform shows a wide, flat surface with remnant sea stacks and merges with the coastal plain (Figures 3B, 4D,E).
Results of 10Be exposure dating
The measured 10Be concentrations of the one surface sample and four depth profile samples, ranging between 6.15 ± 0.28 × 10⁴ atoms/g and 34.10 ± 1.09 × 10⁴ atoms/g, are listed in Table 1 along with the 1σ errors. We use the eroded-thickness approach to invert the inherited concentration, erosion rate, and exposure age of the depth profile for a uniformly distributed, field-measured 0–40 cm eroded-thickness (Figure 4C).
By applying least-squares linear inversion, the fitted lines of the model data and depth profile curves are shown in Figure 5A,B. The distribution of Te (95% confidence) yields ranged from 66.5 to 119.0 ka, with a peak at 86.0–88.0 ka (Figure 5C). The inheritance was very low, with most modeling results in the range of −9.00 to −1.20 × 10⁴ atoms/g (95% confidence). Although inheritance should be greater than zero, removing negative inheritance would bias the best-fit distribution toward a younger age (Wang and Oskin, 2021). Thus, for samples with very low inheritance, truncating negative inheritance results would shift the realistic age to the extreme older tail of the age distribution. As all predictions are required to estimate the full distribution of the exposure age within errors, those negative values were permitted statistically and subsequently excluded. Excluding the negative results, the possible range of inheritance was 0–0.74 × 10⁴ atoms/g (Figure 5D). The corresponding exposure age and erosion rate of the T2 platform ranged from 101.38 ka to 132.16 ka (Figure 5E, 95% confidence) and 0.36–0.40 cm/ka, respectively (Figure 5F, 95% confidence). The predicted erosional thickness was 45 cm, consistent with the erosional thickness measured in the field (Figure 5G).
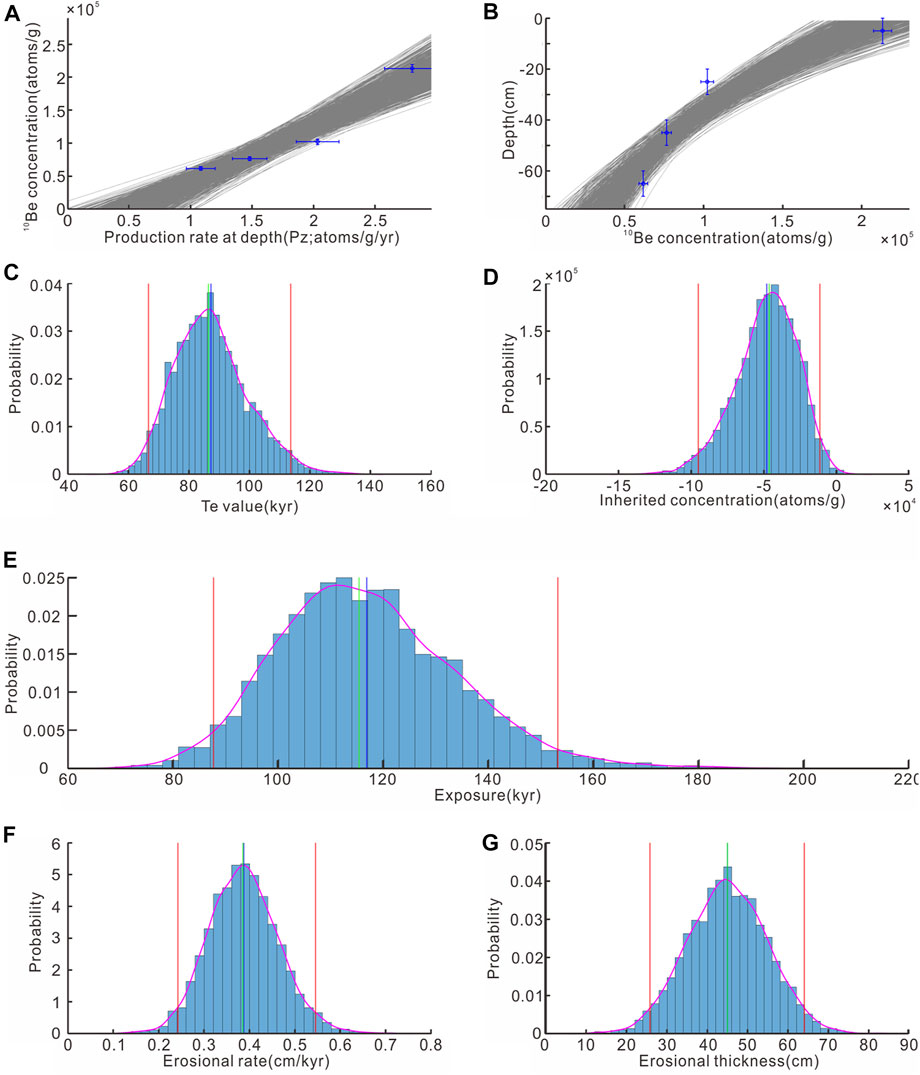
FIGURE 5. Linear regression results for the GDS data set with the eroded-thickness approach after 100,000 iterations. (A) Relationship of sample concentration to production rate at depth. (B) Distribution of the depth profile models with best-fit curves. (C) Distribution of the effective exposure age (Te). (D) Modeling-inherited concentration. (E) Estimated exposure age based on a preset erosional thickness. (F) Distribution of erosion rates. (G) Distribution of predicted erosional thicknesses.
Assuming a constant erosion rate and very low inheritance (0.36–0.40 cm/ka and nearly zero from resultant data of the T2 platform), we obtained an age of 239.87 ± 14.18 ka for the T4 platform based on the 10Be concentration of the surface sample.
Discussion
Allocation of highstand ages for the wave-cut platforms
The estimated exposure age suggests that the T2 platform could be allocated to a highstand at approximately 128 ka, which is equivalent to MIS 5e. Given this age and the elevation of sea level described by Grant et al. (2014), we obtain an initial uplift rate (u0) of 0.09 ± 0.030 mm/a since 128 ka. Although the surface sample of T4 suggests a reference age of approximately 239 ka, which is equivalent to MIS 7e, whether the platform would be overprinted independently in such time requires further examination.
When applying u0 to examine whether the Ep values of the T3 and T4 platforms matched the Em values in the study area, the resultant fit failed to reach the range of ΔE < 5, suggesting that the uplift rate was not constant during the formation of the T3 and T4 platforms. Following the iterations of best fit with a fixed uplift rate since 128 ka (0.09 mm/a) and a given uplift rate ranging from 0 mm/a to 0.5 mm/a with an interval of 0.01 mm/a during 128–500 ka revealed three predicted scenarios that satisfied our defined fit condition: 1) T3 and T4 platforms with highstand ages of 239 ka and 388 ka and uplift rates in the range of 0.22–0.25 mm/a; 2) T3 and T4 platforms with highstand ages of 197 ka and 239 ka and uplift rates in the range of 0.30–0.38 mm/a; and 3) T3 and T4 platforms with highstand ages of 197 ka and 290 ka and uplift rates in the range of 0.39–0.41 mm/a (Figures 6A–C).
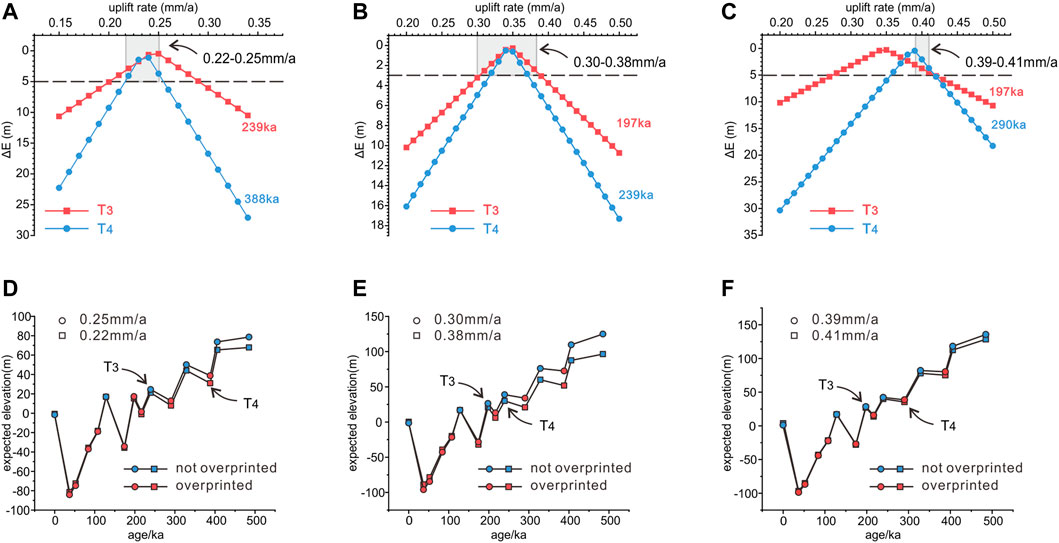
FIGURE 6. Uplift rate scenarios satisfying the defined fit conditions (A–C); the associated elevations of the wave-cut platforms of all highstands >500 ka (D–F) are shown when the 128-ka highstand is tied to 17 m.
We plotted highstand elevations with the fit rates for each scenario to examine whether the predicted wave-cut platform would be overprinted in a subsequent highstand. In the scenario of 0.22–0.25 mm/a, the elevations of the T3 and T4 platforms were 21.1–24.5 m and 30.9–38.7 m. However, the predicted elevations of the platforms for 328 ka (44.0–50.1 m) would overprint the T4 platform (Figure 6D), suggesting that this scenario was unlikely to occur. In the scenario of 0.30–0.38 mm/a, the elevations of the T3 and T4 platforms were 20.7–26.4 m and 30.0–38.9 m and were preserved without significant overprinting (Figure 6E). In the scenario of 0.39–0.41 mm/a, the elevations of the T3 and T4 platforms were 27.1–28.5 m and 35.4–38.7 m. Analogous to the scenario of 0.22–0.25 mm/a, the predicted elevations of the platform relating to 239 ka (40.1–42.3 m) would overprint the T4 platform (Figure 6F), suggesting that this scenario was unlikely to occur. The best-fit uplift rate and results of our examination of highstand overprinting suggested that the T3 and T4 platforms could be allocated to highstands at 197 ka (MIS 7a) and 239 ka (MIS7e), respectively. These results well matched the reference 10Be exposure age of the T4 platform. Considering the errors in field measurements, the uncertainty of the uplift rate would range from 0.017 mm/a to 0.034 mm/a. Overall, the T2, T3, and T4 wave-cut platforms were assigned to 128 ka (MIS 5e), 197 ka (MIS 7a), and 239 ka (MIS 7e), with a decreasing uplift rate ranging from 0.30 ± 0.034 mm/a to 0.38 ± 0.017 mm/a before 128 ka and to 0.09 ± 0.030 mm/a since 128 ka.
Implications
Considering the controversial context of the T2–M2 unit, our preferred allocations of highstand ages for the wave-cut platforms have several implications. First, transgression events likely occurred as early as MIS 7 (190–239 ka) in the southern PRD, as indicated by the allocated highstand age of the highest T4 platform (Figure 7). Recent OSL dating has revealed pre–MIS-5 deposits in the southern PRD, suggesting that Quaternary sedimentation was likely initiated before 128 ka (Xu et al., 2022). If correct, our finding would be consistent with the suggestion that M2 is at least correlated with MIS 5 and perhaps even older. Moreover, the elevation of the predicted wave-cut platforms in MIS 3 were allocated at −78 m to −97 m in our best-fit model. These elevations are much lower than the average depth of M2 in the PRD (approximately −15 m to −30 m), suggesting that is unlikely to preserve MIS 3 wave-cut platforms or sediments in the uplifted wall areas.
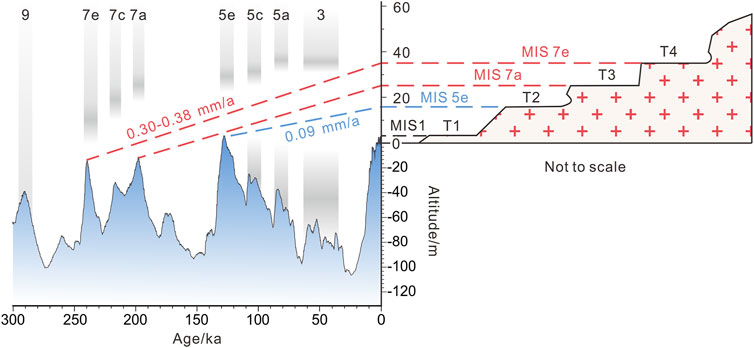
FIGURE 7. Calculated uplift rates from allocations between the altitudes of wave-cut platforms and the ages of sea-level highstands. The sea-level data are from Grant et al. (2014). Light gray bands: marine isotope stages (MISs).
Second, our preferred uplift rates provide significant benchmarks for elucidating the differential uplift in the PRD. Considering M2 as deposits of MIS 5e (Xu et al., 2022), the estimated offset between the top of M2 (approximately −23 m) and the elevation of the T2 wave-cut platform (17 m) is approximately 40 m along F2. Given this offset, the average slip rate along the F2 could reach 0.31 mm/a since 128 ka. As the ENE-striking faults are segmented by the NNW-striking ones, this estimated rate could vary spatially. However, the uplift rate decrease derived from our results coincides with decreasing slip rates in the inland PRD (0.34 mm/a before 128 ka and 0.16 mm/a since 128 ka, Huang et al., 2021), implying that the differential uplift is uniform across the NNW faults. Although the cause for temporally various rates remains unclear, our finding likely implies a weakened differential uplift since 128 ka onshore of the LFZ. Notably, compared to the coastal faults in the Andes or Sicily (ranging from 0.4–0.8 mm/a, Saillard et al., 2011; Meschis et al., 2018), this slip rate is relatively slow. However, this does not mean a lower geohazard risk. As several large earthquakes have occurred around the PRD, the risk defense of geohazards should be explicitly considered in engineering and city construction.
Third, the granitic wave-cut platforms can be used to provide cosmogenic dating ages that correlate with the highstands and, hence, would be an effective way to constrain the uplift rate in the area without fault-related sediments. This may have wider significance because wave-cut platforms suitable for 10Be cosmogenic exposure dating are more common than sites containing corals suitable for U-series dating. The application of the 10Be cosmogenic approach allows many more sites to be dated across a wider region, as granitic wave-cut platforms are widely developed along the coast of southern China. Moreover, this approach provides an independent correlation with sediments in the subsiding wall where the Quaternary sediments were deposited. With clear benchmarks of both uplifting and subsiding walls, a more comprehensive and precise slip rate, and ultimately the tectonic pattern of the PRD could be determined.
Conclusion
(1) The measured uplift wave-cut platforms, constrained by 10Be cosmogenic dating and the best-fit allocation of undated wave-cut platforms, were correlated with sea-level highstands at 128 ka and 239 ka, suggesting uplift rates of 0.30–0.38 mm/a during 239–128 ka and 0.09 mm/a from 128 ka in the footwall of coastal F2.
(2) The observed oldest wave-cut platforms implied a transgression event as early as MIS 7 (239–190 ka) in the southern PRD, implying that Pleistocene deposition likely started at 239 ka, coeval with the recently inferred OSL dating age.
(3) 10Be cosmogenic exposure dating of wave-cut platforms, in combination with sea-level highstand correlation, is an acceptable method to derive the long-term slip rate of the LFZ and its paralleled offshore faults in the granitic coastline in the northern margin of the South China Sea.
Data availability statement
The original contributions presented in the study are included in the article/Supplementary Material. Further inquiries can be directed to the corresponding author.
Author contributions
HL and KZ: study conception, writing—original draft, funding support; KZ, ZGL, ZC, GH, PH, YZ, YY, XD, and ZYL: manuscript editing, results discussion and interpretation; GH, QT, YT, and CC: data processing and methodology, editing; KZ, ZC, WW, and PZ: funding support and review.
Funding
This work was funded by the National Natural Science Foundation of China (Grant nos. 41572178, 41802225, and 42272250), the Guangdong Province Introduced Innovative R&D Team of Geological Processes and Natural Disasters around the South China Sea (Grant no. 2016ZT06N331), the National Key Research and Development Program of China (Grant no. 2017YFC1500101), the Special Fund for Special Project of Geological Hazard Control, Guangdong Province, China (Grant no. 2017201), the Fundamental Research Funds for the Central Universities, Sun Yat-sen University (Grant no. 22qntd2101), and the Scientific Research Startup Funds of Shaoguan University (Grant no. 9900064604), Guangdong Special Fund for National Park Construction (Grant no. 2021GJGY026).
Acknowledgments
We are grateful to the two reviewers for their thorough comments, which considerably improved the manuscript. We are also grateful to Zihao Chen and Dehui Zhang for their assistance in the laboratory and the field.
Conflict of interest
The authors declare that the research was conducted in the absence of any commercial or financial relationships that could be construed as a potential conflict of interest.
Publisher’s note
All claims expressed in this article are solely those of the authors and do not necessarily represent those of their affiliated organizations, or those of the publisher, the editors, and the reviewers. Any product that may be evaluated in this article, or claim that may be made by its manufacturer, is not guaranteed or endorsed by the publisher.
Supplementary material
The Supplementary Material for this article can be found online at: https://www.frontiersin.org/articles/10.3389/feart.2022.1026181/full#supplementary-material
References
Armijo, R., Meyer, B., King, G. C. P., Rigo, A., and Papanastassiou, D. (1996). Quaternary evolution of the corinth rift and its implications for the late cenozoic evolution of the aegean. Geophys. J. Int. 126, 11–53. doi:10.1111/j.1365-246X.1996.tb05264.x
Cao, J., Xia, S., Sun, J., Zhao, F., Wan, K., and Xu, H. (2018). offshore fault geometrics in the Pearl River estuary, southeastern China: Evidence from seismic reflection data. J. Ocean. Univ. China 17, 799–810. doi:10.1007/s11802-018-3499-5
Chen, G., Zhang, K., He, X., Chen, F., and Nian, H. (1994). Paleo-geographic evolution of the Pearl River delta since the late Pleistocene. Quat. Sci., 67–74.
Chen, G., Zhang, K., Li, L., Shao, R., Zhuang, W., and Lin, X. (2002). Development of the Pearl River Delta in SE China and its relations to reactivation of basement faults. J. Geosciences China 14, 17–24.
Dai, X., Li, Z., Sun, C., Li, L., Wang, W., Hui, G., et al. (2022a). 3D structural growth and lateral linkage of the normal fault system: A case study from lufeng sag in the northern South China sea. ACTA Geol. SIN. 96, 1922–1936.
Dai, X., Li, Z., Wang, W., Sun, C., Yan, Y., Hui, G., et al. (2022b). The tectonic deformation characteristics of the Pearl River Mouth Basin and tectonic-sedimentary forward modeling of the Baiyun Sag. Geotect. Metallogenia 46, 517–529.
Grant, K. M., Rohling, E. J., Ramsey, C. B., Cheng, H., Edwards, R. L., Florindo, F., et al. (2014). Sea-level variability over five glacial cycles. Nat. Commun. 5, 5076. doi:10.1038/ncomms6076
Hidy, A. J., Gosse, J. C., Pederson, J. L., Mattern, J. P., and Finkel, R. C. (2010). A geologically constrained Monte Carlo approach to modeling exposure ages from profiles of cosmogenic nuclides: An example from Lees Ferry, Arizona. Geochem. Geophys. Geosyst. 11, Q0AA10. doi:10.1029/2010GC003084
Huang, P., Zhang, K., Yu, Z., Liang, H., Li, Z., Chen, Z., et al. (2021). Reanalysis of the stratigraphic sequence and new understanding of Neotectonic movement of the Pearl River Delta since the late Pleistocene. South China J. Seismol. 41, 10–20.
Huang, Y., Xia, F., and Chen, G. (1983). The formation and evolution of the Pearl River Delta in response to faulting activities. ACTA Oceanol. SIN. 5, 316–327.
Huang, Y., Xia, F., and Chen, J. (1985). The characteristics of the faults in Wugui Mountain area and the formation and development of the fault-block uplifted area. ACTA Sci. Nat. Univ. SUNYATSENI 1, 52–62.
Huang, Z., Li, P., Zhang, Z., Li, K., and Qiao, P. (1982). Zhujiang (Pearl River) delta. Guangzhou, China: General Scientific Press.
Hui, G., Li, S., Guo, L., Wang, P., Liu, B., Wang, G., et al. (2021). A review of geohazards on the northern continental margin of the South China Sea. Earth-Science Rev. 220, 103733. doi:10.1016/j.earscirev.2021.103733
Hui, G., Li, Z., Wang, W., Hu, L., Liang, H., Zhang, Y., et al. (2022). The fault assembly characteristics on the northern South China Sea continental margin and its implications on the South China Sea spreading. Geotect. Metallogenia 46, 501–516.
Jara-Muñoz, J., Melnick, D., Brill, D., and Strecker, M. R. (2015). Segmentation of the 2010 Maule Chile earthquake rupture from a joint analysis of uplifted marine terraces and seismic-cycle deformation patterns. Quat. Sci. Rev. 113, 171–192. doi:10.1016/j.quascirev.2015.01.005
Jiang, J., and Hu, S. (1994). Discover of paleo marine notch in maoer hill, xiaogang town, Xinhui city, China. Trop. Geogr. 4, 304.
Kohl, C. P., and Nishiizumi, K. (1992). Chemical isolation of quartz for measurement of in-situ -produced cosmogenic nuclides. Geochimica Cosmochimica Acta 56, 3583–3587. doi:10.1016/0016-7037(92)90401-4
Li, Z., Zhang, P., Hui, G., Hu, L., Li, G., Zhang, Y., et al. (2022). Current status and prospect of the deep structure exploration of the littoral fault zone in the northern South China Sea. ACTA Sci. Nat. Univ. SUNYATSENI 61, 55–62.
Lifton, N., Sato, T., and Dunai, T. J. (2014). Scaling in situ cosmogenic nuclide production rates using analytical approximations to atmospheric cosmic-ray fluxes. Earth Planet. Sci. Lett. 386, 149–160. doi:10.1016/j.epsl.2013.10.052
Marquardt, C., Lavenu, A., Ortlieb, L., Godoy, E., and Comte, D. (2004). Coastal neotectonics in southern central andes: Uplift and deformation of marine terraces in northern Chile (27°S). Tectonophysics 394, 193–219. doi:10.1016/j.tecto.2004.07.059
Merritts, D., and Bull, W. B. (1989)., 17. CO, 10202. doi:10.1130/0091-7613(1989)017Interpreting Quaternary uplift rates at the Mendocino triple junction, northern California, from uplifted marine terracesGeol
Meschis, M., Roberts, G. P., Robertson, J., and Briant, R. M. (2018). The relationships between regional quaternary uplift, deformation across active normal faults, and historical seismicity in the upper plate of Subduction zones: The Capo D’Orlando fault, NE Sicily. Tectonics 37, 1231–1255. doi:10.1029/2017tc004705
Monaco, C., Tapponnier, P., Tortorici, L., and Gillot, P. Y. (1997). Late Quaternary slip rates on the Acireale-Piedimonte normal faults and tectonic origin of Mt. Etna (Sicily). Earth Planet. Sci. Lett. 147, 125–139. doi:10.1016/S0012-821X(97)00005-8
Palyvos, N., Pantosti, D., De Martini, P. M., Lemeille, F., Sorel, D., and Pavlopoulos, K. (2005). The Aigion–Neos Erineos coastal normal fault system (Western Corinth Gulf Rift, Greece): Geomorphological signature, recent earthquake history, and evolution. J. Geophys. Res. 110. doi:10.1029/2004JB003165
Pedoja, K., Jara-Muñoz, J., De Gelder, G., Robertson, J., Meschis, M., Fernandez-Blanco, D., et al. (2018). Neogene-Quaternary slow coastal uplift of Western Europe through the perspective of sequences of strandlines from the Cotentin Peninsula (Normandy, France). Geomorphology 303, 338–356. doi:10.1016/j.geomorph.2017.11.021
Racano, S., Jara-Muñoz, J., Cosentino, D., and Melnick, D. (2020). Variable quaternary uplift along the southern margin of the central Anatolian plateau inferred from modeling marine terrace sequences. Tectonics 39, e2019TC005921. doi:10.1029/2019tc005921
Roberts, G. P., Meschis, M., Houghton, S., Underwood, C., and Briant, R. M. (2013). The implications of revised Quaternary palaeoshoreline chronologies for the rates of active extension and uplift in the upper plate of subduction zones. Quat. Sci. Rev. 78, 169–187. doi:10.1016/j.quascirev.2013.08.006
Robertson, J., Meschis, M., Roberts, G. P., Ganas, A., and Gheorghiu, D. M. (2019). Temporally constant Quaternary uplift rates and their relationship with extensional upper-plate faults in south Crete (Greece), constrained with 36Cl cosmogenic exposure dating. Tectonics 38, 1189–1222. doi:10.1029/2018tc005410
Rodríguez, M. P., Carretier, S., Charrier, R., Saillard, M., Regard, V., Hérail, G., et al. (2013). Geochronology of pediments and marine terraces in north-central Chile and their implications for Quaternary uplift in the Western Andes. Geomorphology 180–181, 33–46. doi:10.1016/j.geomorph.2012.09.003
Saillard, M., Hall, S. R., Audin, L., Farber, D. L., Regard, V., and Hérail, G. (2011). Andean coastal uplift and active tectonics in southern Peru: 10Be surface exposure dating of differentially uplifted marine terrace sequences (san juan de Marcona, ∼15.4°S). Geomorphology 128, 178–190. doi:10.1016/j.geomorph.2011.01.004
Tang, Y., Chen, G., Peng, Z., and Zhang, K. (2011). Late quaternary tectonics of the Pearl River delta, SE China: Evidence from xilingang. Geodin. Acta 24, 133–139. doi:10.3166/ga.24.133-139
Wang, J., Cao, L., Wang, X., Yang, X., Yang, J., and Su, Z. (2009). Evolution of sedimentary facies and paleoenvironment during the late quaternary in wanqingsha area of the Pearl River delta. Mar. Geol. Quat. Geol. 29, 35–42. doi:10.3724/sp.j.1140.2009.06035
Wang, J., Chen, G., Peng, Z., and Grapes, R. (2015). Loess-like deposits in the Pearl River delta area, southeast China. Aeolian Res. 19, 113–122. doi:10.1016/j.aeolia.2015.09.005
Wang, W., Wu, C., Xu, L., Wei, X., and Huang, S. (2011). Factors affecting the heights of ancient and present wave-cut benches in the Pearl River Delta area. Chin. Sci. Bull. 56, 342–353. doi:10.1360/972010-1035
Wang, Y., and Oskin, M. E. (2021). Combined linear regression and Monte Carlo approach to modelling exposure age depth profiles. Geochronol. Discuss., 1–25.
Xia, S., Zhou, P., Zhao, D., and Cao, J. (2020). Seismogenic structure in the source zone of the 1918 M7.5 NanAo earthquake in the northern South China Sea. Phys. Earth Planet. Interiors 302, 106472. doi:10.1016/j.pepi.2020.106472
Xu, X., Li, H., Tang, L., Lai, Z., Xu, G., Zhang, X., et al. (2020). Chronology of a Holocene core from the Pearl River delta in southern China. Front. Earth Sci. (Lausanne). 8. [Accessed August 22, 2022]. doi:10.3389/feart.2020.00262
Xu, X., Zhong, J., Huang, X., Li, H., Ding, Z., and Lai, Z. (2022). Age comparison by luminescence using quartz and feldspar on core HPQK01 from the Pearl River delta in China. Quat. Geochronol. 71, 101320. doi:10.1016/j.quageo.2022.101320
Yao, Y., Zhan, W. H., and Liu, Z. (2008). Neotectonics of the Pearl River delta and its relationship with the deltaic evolution. South China J. Seismol. 28, 29–40.
Yim, W. W.-S., Hilgers, A., Huang, G., and Radtke, U. (2008). Stratigraphy and optically stimulated luminescence dating of subaerially exposed Quaternary deposits from two shallow bays in Hong Kong, China. Quat. Int. 183, 23–39. doi:10.1016/j.quaint.2007.07.004
Yim, W. W.-S., Ivanovich, M., and Yu, K.-F. (1990). Young age bias of radiocarbon dates in pre-Holocene marine deposits of Hong Kong and implications for Pleistocene stratigraphy. Geo-Marine Lett. 10, 165–172. doi:10.1007/BF02085932
Yu, Z., Zhang, K., Liang, H., and Li, Z. (2016). Late Quaternary tectonic movements in the Pearl River Delta, China, revealed from stratigraphic profiles. Trop. Geogr. 36, 334–342.
Zhao, H. (2017). Discovery and scientific significance of qixinggang relics of ancient coast, Guangzhou. Trop. Geogr. 37, 610–619.
Zhao, M., Qiu, X., Ye, C., Xia, K., Huang, C., Xie, J., et al. (2004). An analysis on deep crustal structure along the onshore-offshore seismic profile Across the binghai (littoral) fault zone in Ne south China sea. Chin. J. Geophys. 47, 954–961. doi:10.1002/cjg2.573
Zong, Y., Huang, G., Switzer, A. D., Yu, F., and Yim, W. W.-S. (2009a). An evolutionary model for the Holocene formation of the Pearl River delta, China. Holocene 19, 129–142. doi:10.1177/0959683608098957
Keywords: coastal uplift, Littoral Fault Zone, wave-cut platform, cosmogenic dating, Pearl River Delta
Citation: Liang H, Zhang K, Li Z, Chen Z, Hui G, Huang P, Tian Q, Tang Y, Chen C, Zhang Y, He X, Yan Y, Dai X, Li Z, Wang W and Zhang P (2023) Temporally varied coastal uplift rates north of the Littoral Fault Zone since the late Quaternary in the northern South China Sea: Insights from the wave-cut platform and cosmogenic exposure dating. Front. Earth Sci. 10:1026181. doi: 10.3389/feart.2022.1026181
Received: 23 August 2022; Accepted: 07 November 2022;
Published: 13 January 2023.
Edited by:
Shiming Wan, Institute of Oceanology (CAS), ChinaReviewed by:
Kai Deng, ETH Zürich, SwitzerlandYongjian Yao, Guangzhou Marine Geological Survey, China
Copyright © 2023 Liang, Zhang, Li, Chen, Hui, Huang, Tian, Tang, Chen, Zhang, He, Yan, Dai, Li, Wang and Zhang. This is an open-access article distributed under the terms of the Creative Commons Attribution License (CC BY). The use, distribution or reproduction in other forums is permitted, provided the original author(s) and the copyright owner(s) are credited and that the original publication in this journal is cited, in accordance with accepted academic practice. No use, distribution or reproduction is permitted which does not comply with these terms.
*Correspondence: Hao Liang, bGlhbmdoMjdAbWFpbDIuc3lzdS5lZHUuY24=