 Eirik Gjerløw1,2*
 Ármann Höskuldsson3
 Stefania Bartolini4
 Sebastien Biass5
 Sophie Mossoux6
 Jennie Gilbert7
 Rolf Birger Pedersen2
 Joan Martí4
- 1Department of Building, Energy and Material Technology, UiT the Arctic University of Norway, Narvik, Norway
- 2Department of Earth Sciences, Centre for Geobiology, University of Bergen, Bergen, Norway
- 3Nordic Volcanological Center, Institute of Earth Sciences, University of Iceland, Reykjavik, Iceland
- 4Group of Volcanology, (SIMGEO-UB) CSIC, Institute of Earth Sciences Jaume Almera, Barcelona, Spain
- 5Earth Observatory of Singapore, Nanyang Technical University, Singapore, Singapore
- 6Department of Geography, Cartography and GIS Research Group - Physical Geography, Vrije Universiteit Brussel, Brussels, Belgium
- 7Lancaster Environment Centre, Lancaster University, Lancaster, United Kingdom
Hazard assessment of remote volcanic islands provides many challenges compared to other volcanoes and volcanic fields. Here we present the first systematic volcanic hazard assessment of Jan Mayen Island, a remote island located in the North-Atlantic Ocean and home to the northernmost active subaerial volcano in the world (Beerenberg Volcano), and we discuss some of the challenges and characteristics of performing a volcanic hazard assessment of a remote volcanic island. Jan Mayen has had at least five eruptions since its discovery at the start of the 17th century. Its Holocene volcanism is mainly characterized by eruptions with styles ranging from Hawaiian to Strombolian, but also by lava domes and Surtseyan eruptions. Based on field data, remote images, topographic data, past data, and computer simulations, our study evaluates the spatial probability of new vents opening, estimates eruption recurrence rates, simulates various eruption scenarios, and produces hazard maps for the different scenarios. This work shows where the hazards of ash fall, and lava flows are more likely to affect the built infrastructure on Jan Mayen Island. This hazard assessment will assist emergency planning and the determination of future land use on the island.
Introduction
Remote volcanic islands provide a challenging environment for conducting volcanic hazard assessment. They are often uninhabited and have a limited historical period, meaning that descriptions of and data from past volcanic activity can be scarce or missing. Using currently visible vents to assess the volcanic susceptibility of monogenetic volcanism is a common procedure, but for volcanic islands coastal erosion and submarine volcanism can affect the accuracy of the procedure. Furthermore, a proportion of remote volcanic islands are glaciated which means that vents may be hidden beneath ice or they may have been destroyed by glacier erosion. Our approach to a volcanic hazard assessment highlights and discusses some of the difficulties of conducting hazard assessments on remote volcanic islands with a limited historical period and datasets of past eruptions, and it can be used as an example for how to conduct a volcanic hazard assessment in such a setting.
The Norwegian island of Jan Mayen, located NE of Iceland in the North-Atlantic Ocean (Figure 1A), hosts the northernmost active subaerial volcano in the world–Beerenberg Volcano, the summit of which is 2,277 m above sea level (European Catalogue of Volcanos). The island is about 53 km long from SW to NE and covers an area of approximately 373 km2. Sør-Jan is the term given to the southern part of the island which is joined to the northern part (Nord-Jan or Beerenberg) via an isthmus (Midt-Jan).
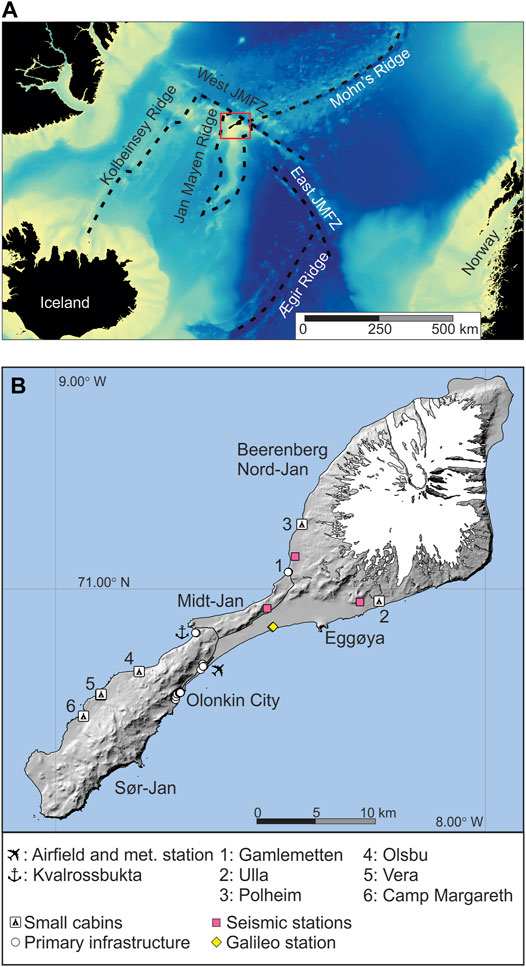
FIGURE 1. (A) Bathymetric map (Jakobsson et al., 2012) showing the location of Iceland, Norway, the Kolbeinsey Ridge, Mohn’s Ridge, Ægir Ridge, Jan Mayen Ridge, and the West- and East-Jan Mayen fracture zones (JMFZ) and Jan Mayen Island (red box). The island is located approximately 600 km NE of Iceland and 950 km W of Norway. (B) Key points of interest on Jan Mayen. The white areas in the map are covered by glaciers or permanent snow.
Dutch whaling companies sent summer expeditions to Jan Mayen from 1,614 until around 1,645 (Barr 2003). When the whaling expeditions ceased there was only intermittent human activity on and around Jan Mayen. During the first International Polar Year in 1882–1883, the Austro-Hungarian navy established a research station on the island and carried out geographic mapping of Jan Mayen. In subsequent years several research expeditions visited Jan Mayen. In 1906, Norwegian trappers began overwinter hunting for arctic foxes, and this resulted in a more established human presence. In 1921, the first permanent meteorological station was installed. Since then, the island has been continuously inhabited. Currently a team of 18 people associated with the Norwegian Meteorological Institute and Norwegian Armed Forces live permanently on Jan Mayen to maintain all infrastructure (i.e., roads, weather observation equipment, houses, and cabins) on the island. During the summer, the number of inhabitants can be significantly higher due to the arrival of scientists, tourists, and maintenance crew.
The infrastructure on Jan Mayen is mainly located along the coastlines of the central parts of the island (Figure 1B). The main infrastructure is in Olonkin City, which has living quarters, workshops, and the necessary infrastructure for day-to-day operations. The meteorological station on Jan Mayen lies 3 km NE of Olonkin City. Next to the meteorological station lies the Jan Mayensfield airfield that has an unpaved, 1.6 km long, runway. Kvalrossbukta, about 5 km N of Olonkin City, is used as a natural harbor for landing light boats and military landing crafts that resupply the island. A cabin and a generator are also present at Kvalrossbukta. Other infrastructure on the island consists of the Galileo and EGNOS equipment (used for global navigation satellite purposes) plus three seismometers; these are remotely operated from Olonkin City. Finally, there are several old cabins that are used for recreational purposes. The largest cabin is located at Gamlemetten, and this could be used for evacuation in the event of an eruption on Sør-Jan (Figure 1B). Gamlemetten is linked to Olonkin City by roads that are open and maintained during the summer months.
The most recent eruptions on Jan Mayen took place in 1970 (Siggerud 1972) and 1985 (Imsland 1986), both on the NE flank of Mt. Beerenberg approximately 40 km from Olonkin City (Figure 1). The 1970 eruption was the larger and produced plumes of steam and ash, reaching altitudes of at least 10 km. At the time, a red volcanic sunset was reported in England (Siggerud 1972). Those working at Olonkin City did not notice the eruption until a few days after it started, when it was spotted by an airplane flying over the island (Siggerud 1972). Prior to 1970, descriptions of eruptions at Jan Mayen were seen as unreliable (Sylvester 1975). However, following the eruptions of 1970 and 1985 these reports were deemed more credible (Sylvester 1975). These eruptions demonstrated that volcanic hazards should be a cause of concern for people and installations on Jan Mayen.
Past work by Sylvester (1975) briefly discussed volcanic hazards on the island. This author suggested that Olonkin City could only be impacted if an eruption broke out in the cliffs above the city or on the lava plateau that the city is built up on. Prior to our study, no attempts have been made to generate hazard maps or conduct a comprehensive analysis of volcanic hazards on the island.
In this paper, we present for the first time a volcanic hazard assessment of Jan Mayen by applying a systematic methodology that includes spatial and temporal analysis and simulation of the hazardous events related to some of the most probable eruptive scenarios (e.g., Martí 2017). In this work we use 1) previously published studies, 2) new data based on fieldwork carried out in 2011 and 2012 and 3) remote imaging. The resulting work leads to 1) a probability density analysis of the distribution of past vents, to identify the most likely location of future ones, and 2) numerical simulations of the various volcanic and associated hazards (tephra fall and lava flow inundation) that may occur during future eruptions. Due to lack of information on major explosive eruptions from Beerenberg, we use data from Hekla volcano to simulate possible future explosive eruptions and tephra fall on the island. The results include volcanic hazard maps for different scenarios from which an exposure-based analysis for the main infrastructure locations on Jan Mayen is conducted. These results further reveal areas on the island that are most likely to be affected by future eruptions, in case one of the explored scenarios occurs. The study is an example on how future hazard assessment of remote volcanic islands can be approached, with the aim of emergency planning and risk mitigation in case of future volcanic eruptions, helping decision making in regard to land use and planning.
Geological Setting
Jan Mayen (Figure 1) is a volcanic island that lies in the Norwegian-Greenland sea at the junction between the Jan Mayen ridge microcontinent, the Jan Mayen fracture zone transform fault and the Mohn’s ridge, a continuation of the Mid-Atlantic ridge divergent plate boundary (Figure 1A). The most striking feature of the island is the glacier-capped volcano Mt. Beerenberg (Figure 1B, Figure 2A). Mt. Beerenberg constitutes the N part of Jan Mayen whereas the central and S parts form an isthmus and a ridge extending 30 km towards the SW from Mt. Beerenberg respectively (Figure 1B). The S and central parts of Jan Mayen reach a maximum altitude of 769 m and consist of the ridge, coastal lava plateaus and beaches. Two possible origins have been suggested for the volcanism on Jan Mayen, namely, the Mohn’s ridge magmatism acting across the Jan Mayen transform fault (Trønnes et al., 1999), or a small mantle plume (Elkins et al., 2016).
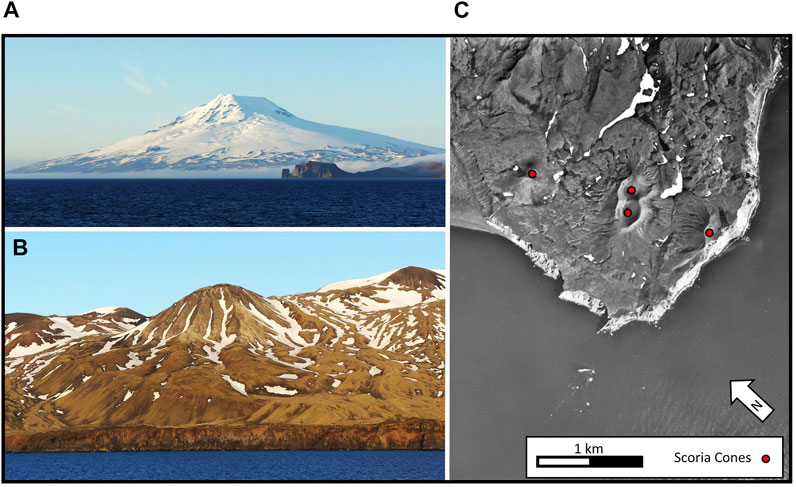
FIGURE 2. (A) The Beerenberg volcano (2,227 m a.s.l.) constitutes the N part of the island. Note the tuff cone in the foreground. (B) Bombellestoppen (606 m a.s.l.), one of the trachytic domes on the S part of Jan Mayen. (C) Aerial photograph of the S tip of Jan Mayen showing four scoria cones (marked with red dots). Section of aerial photo JM75 7183, with permission, © Norsk Polarinstitutt.
Previous paleomagnetic studies show that all exposed rocks on Jan Mayen are normally magnetized. This suggests that all exposed magmatism on the island of Jan Mayen belongs to the Brunhes epoch and is therefore younger than approximately 700 ka (Fitch et al., 1965; Cox 1969; Imsland 1978; Cromwell et al., 2013). Rock samples from Jan Mayen have been dated by the 40Ar/39Ar incremental heating method to give an age range from 460.9 ± 55.8 ka to present day (Cromwell et al., 2013) and agree with the paleomagnetic data.
At least five eruptions have occurred on the island since it was discovered early in the 17th century (Imsland 1978). An eruption is suggested to have taken place on the NE flank of Beerenberg between 1,650 and 1882 based on changes in topographic maps (Imsland 1978). In 1732, a Surtseyan eruption occurred in the sea off the SW flank of Beerenberg and formed the Eggøya tuff cone (Gjerløw et al., 2015) and most of the sandy SE shores of Midt-Jan (Figure 1B). This eruption also covered large parts of the island in a blanket of tephra (approximately 10 cm thick at the location of Olonkin City). In 1818, an eruption was reported in the sea off the S flank of Mt. Beerenberg (Scoresby 1820). The 1970 (Siggerud 1972) and the 1985 (Imsland 1986) eruptions were effusive to mixed style eruptions (where lava makes up between 5 and 95%, and tephra makes up between 5 and 95% of the erupted DRE volume, e.g. Thorarinsson 1981); estimated pyroclastic deposit volume was in excess of 5% of the total DRE volume for the 1970 eruption, and “the volume of tephra was relatively large” (Imsland 1986, page 51) in the 1985 eruption. Both eruptions occurred on the NE flank of Mt. Beerenberg.
Holocene volcanism on Sør-Jan (Figure 1B), represented by the Inndalen Formation, mainly consists of lava flows, coulees and domes, scoria cones, and shallow marine to coastal phreatomagmatic deposits (Figure 2B,C); one littoral cone has also been identified on a coastal lava plateau on Sør-Jan. The Inndalen Formation on Midt-Jan, the isthmus between Nord- and Sør-Jan, is characterized by scoria cones and shallow marine to coastal phreatomagmatic deposits. On Nord-Jan (Figure 1B) the Holocene eruptions were mostly effusive, forming mainly lava flows with some scoria cones, on the flanks of Mt. Beerenberg (Fitch et al., 1965; Imsland 1978). Fumaroles were reported from the central crater of Beerenberg after the eruptions in 1970 and 1985. However, glacial cover and subsequent erosion in the summit regions of Beerenberg make identification of Holocene eruptive products difficult. The composition of the Inndalen formation is mostly in the range of trachybasalt to basalt, but also includes basanite, basaltic trachyandesite, trachyandesite and trachyte (Imsland 1978; Gjerløw et al., 2015). Imsland (1978) estimated that around 5.35 km3 dense rock equivalent (DRE) has been erupted during Holocene times and single eruption sizes are between 0.007 and 0.5 km3 DRE (Siggerud 1972).
Investigations of soil sections (Gjerløw et al., 2015) and sediment cores (Gjerløw et al., 2016), indicated that medium to large explosive volcanic eruptions, such as the eruption that produced the Eggøya tuff cone with a Volcanic Explosivity Index (VEI) of 3-4, are a relatively rare phenomenon on Jan Mayen. Only two sediment horizons containing significant concentrations of juvenile tephra originating from Jan Mayen have been found within the Holocene interval in nearby marine sediment cores (Gjerløw et al., 2016). One of these originated from the 1732 Eggøya eruption whereas the other originated from an unidentified source on Jan Mayen dating back to approximately 10.3 ka BP (Gjerløw et al., 2016). Soil sections on Jan Mayen show locally distributed coarse-grained pyroclasts with morphologies consistent with magmatic fragmentation, and more widely distributed fine-grained pyroclasts with morphologies consistent with hydromagmatic fragmentation (Gjerløw et al., 2015). In the Greenland ice cores, several cryptotephra layers allocated to Jan Mayen have been recorded, dating back to 63 ka BP (Abbot and Davies 2012) and it has been shown that remote cryptotephra layers such as these are associated with explosive sub-Plinian to Plinian eruptions (Plunkett et al., 2020 and reference therein). Marine sediment cores from the N and E of Iceland also record cryptotephra layers from Jan Mayen (e.g., Brendryen et al., 2010; Gjerløw et al., 2016). Most of the tephra identified to be from Jan Mayen is of trachybasalt and basaltic trachyandesite compositions; basalt, tephrite/basanite and trachyandesite are also present but are less common. The presence of tephra so far from the source indicates that explosive basaltic eruptions have occurred on Jan Mayen in the past and that the potential for future explosive basaltic eruptions exists.
Methods and Data Presentation
Volcanic Susceptibility
Analysis of volcanic susceptibility, defined as the spatial probability of a vent opening, conditional to eruption occurrence (Martí and Felpeto 2010), is widely accepted to be the first step when preparing mapping of volcanic hazards in an active volcanic field. In this study, we use the QVAST (QGIS for VolcAnic SuscepTibility) tool developed by Bartolini et al. (2013), an open-source plugin for Quantum GIS, to estimate volcanic susceptibility. QVAST requires the coordinates of the structural elements used for spatial modelling as input. In our study, we use the locations of Holocene mafic vents and trachyte domes as input. These coordinates are included in the Supplementary Material. The spatial distribution of volcanic-structural elements was obtained from fieldwork, maps from Imsland (1978), satellite images and aerial photographs from the Norwegian Polar Institute. QVAST uses the location of volcanic vents and structures, such as domes, faults, and dykes, to calculate a Probability Density Function (PDF) that describes the spatial probability of vent opening. QVAST uses a smoothing parameter, or bandwidth, to define how the probabilities should be spread over the susceptibility map. A small bandwidth will concentrate the probability closer to input coordinates whereas a large bandwidth will spread the probability over a larger area. The QVAST tool provides two different methods for estimating the optimal bandwidth: the Least Square Cross Validation (LSCV) and the Sum of Asymptotic Mean Square Error (SAMSE). Both methods have previously been applied in other volcanic areas (Cappello et al., 2012; Connor et al., 2012; Bartolini et al., 2013, 2014, 2015), and in this study both methods are used. After selecting the bandwidth, a PDF is generated for each considered volcanic structure. When multiple sources are considered, the final PDF for the entire area is obtained by combining them in a non-homogenous Poisson process with different weights assigned to each PDF (Bartolini et al., 2013). Table 1 contains the various input parameters used for the QVAST tool. Through an expert elicitation process (Aspinall 2006; Neri et al., 2008), we decided to assign equal weight to each vent, fissure, and dome location, since most of them do not have accurate formation dates. To give each vent location equal weight, the two input layers, “mafic vents” and “trachyte vents” were given 95.1 and 4.9% weights respectively (based on the number of input co-ordinates in each of the layers) when they were combined into the final PDF.
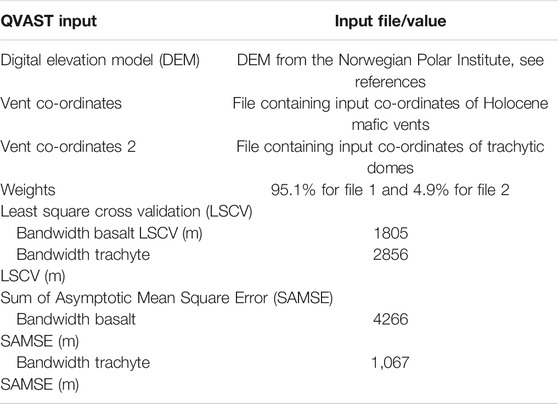
TABLE 1. Input parameters used for the QVAST (QGIS for VolcAnic SuscepTibility) tool.
Recurrence Rate
The temporal recurrence rate of a volcanic system or volcanic field is estimated based on the number of eruptions and time (where the average recurrence rate between eruptions λt is the number of eruptions divided by time) (Connor and Conway 2000). The eruption record of Jan Mayen is incomplete, but the calculations still provide constraints for the minimum recurrence rates. The recurrence rate for the 10,000-year period of the Holocene was calculated using 82 eruptions, based on the currently visible monogenetic vents. The historical time was set to 370 years (because the first historical map was published around 1,650) and the recurrence rate was calculated with five eruptions because at least five eruptions have been documented in this period. In some contexts, the probability of occurrence of different eruptive scenarios can be estimated using a Poisson distribution (e.g., Dzierma and Wehrmann, 2010; Biass and Bonadonna, 2013). It should be noted that the use of a Poisson distribution in such a manner is a simplification and requires that eruptions are strictly independent of each other, can occur only one at a time and that the probability of an event occurring does not depend on the time that has already elapsed since the last event occurred (Biass and Bonadonna 2013). With these considerations in mind, the probability of a volcanic eruption within a selected forecast time window can thus be estimated according to the exponential distribution in the equation below.
Where t is the time window we want to forecast for, and λ is the annual eruption rate calculated for Holocene and historic time. By using this equation, we can calculate the probability of occurrence for a given volcanic eruption scenario on Jan Mayen for a chosen forecast period.
The vents were characterized according to eruptive style as effusive, Strombolian to Vulcanian, Surtseyan and dome forming. Probabilities were calculated based on eruptions during the Holocene and eruptions in historical times extending back to 1,650, and the probability of different eruptive styles was also calculated.
Eruption Scenarios
Previous published work on the volcanism of Jan Mayen (Siggerud 1972; Imsland 1978; Gjerløw et al., 2015) coupled with this study suggests the following likely eruption scenarios: Strombolian to Vulcanian eruptions, effusive lava forming (including lava domes) eruptions, Surtseyan eruptions and sub-Plinian to Plinian eruptions from Beerenberg. Secondary, or littoral, explosions can also occur where lava flows enter the sea. With these eruption styles, we would expect the following volcanic hazards: ash fall (i.e., tephra fall), lava flows, lahars and jökulhlaups, pyroclastic density currents and ballistic projectiles. Ballistic projectiles are not included in this hazard assessment due to the scarcity field of data. Lahars and jökulhlaups are not included since the thickness of the glaciers and the subglacial topography of Beerenberg is unknown, and this leads to great uncertainties in the source parameters and input data for computer simulations. Volcanic islands such as Jan Mayen can also be susceptible to flank collapse and associated hazards, such as tsunamis and lateral blasts (Paris et al., 2017 and references therein). However, the scope of this paper is to focus on the most common volcanic scenarios based on geological observations on the island and in distal tephra records. The whole marine shelf of Jan Mayen has not been mapped in a sufficient detail to recognize offshore volcanic formations or massive gravity currents deposits. Thus, in this hazard assessment we exclude major events like gravity collapse of the flanks of Beerenberg and offshore eruptions as we believe these subjects deserve further study.
Accumulation of Ash Fall on the Ground
TephraProb is a Matlab toolbox used to produce scenario–based probabilistic hazard assessments for tephra accumulation on the ground for Plinian-type and Vulcanian-type eruptions (Biass et al., 2016a). The toolbox is based on the advection diffusion model “Tephra2” (Bonadonna et al., 2005). The model requires the following input parameters: vent location, wind data (direction, altitude, and speed), plume height, eruption mass, total grain size distribution, pumice and lithic density, a distribution of mass in the plume and other parameters such as particle aggregation, eddy constant, diffusion coefficient and fall-time threshold. For a more detailed description of the toolbox, see Biass et al. (2016b). For each scenario, ranges of critical input parameters are identified. TephraProb then runs Tephra2 in a probabilistic way, stochastically sampling eruption and wind conditions at each run of Tephra2. Outputs are scenario-based probabilistic hazard maps that contour the spatial probability of exceeding a fixed threshold of tephra accumulation.
From distal tephra records it is clear that there is potential for explosive eruptions from Mt. Beerenberg. However, we have no eruption source parameters relating directly to these eruptions. We have created two different eruption scenarios for explosive eruptions from Mt Beerenberg and we have chosen to use the 1947 and 2000 eruptions of Hekla (Biass et al., 2014) in Iceland as analogues for explosive Mt. Beerenberg eruptions. The first scenario is a mixed style eruption on the flank of Mt. Beerenberg, such as the 1970 eruption. This scenario represents the larger end of explosive flank eruptions. Descriptions of the 1970 eruption of Jan Mayen (Siggerud 1972) demonstrate similarities to the Hekla 2000 eruption (Höskuldsson et al., 2007); both eruptions started with an explosive phase, with plume heights of at least 11 km (Jan Mayen) and 12 km (Hekla), they were both fissure eruptions and, following the initial explosive phase, produced lava flows (0.5 km3 in the case for Jan Mayen and 0.188 km3 in the case for Hekla). For this scenario, the summit region was chosen as the vent since the volcanic susceptibility in the glaciated regions of Beerenberg is highly uncertain, and since this allows for easier comparison with the second scenario. The second scenario is for an explosive summit eruption. Such eruptions are expected to occur less frequently than flank eruptions (Gjerløw et al., 2016) and have more evolved composition, as seen both in the composition of rocks near the summit and in the steeper slopes close to the summit region (Fitch et al., 1964). The Hekla 1947 eruption was used as an analogue for larger summit eruptions since this represents an eruption with longer repose time, larger volume and more evolved composition than the Hekla 2000 scenario.
Historic volcanism on Jan Mayen (effusive, mixed, and explosive) indicates that the mass ranges for the eruptions ranges between 1.85 × 10¹⁰ to 1.32 × 10¹² kg. Simulations of the Hekla 2000 and 1947 eruption scenarios by Biass et al. (2014) provide good analogues for VEI 2-3 mixed eruptions in case of the Hekla 2000 scenario and VEI 3-4 eruptions in the case of the Hekla 1947 scenario (with masses of 6.9 × 10⁹ kg to 6.9 × 10¹⁰ kg and 6.9 × 10¹⁰ kg to 3.5 × 10¹¹ kg respectively). The plume heights of the Hekla 2000 and Hekla 1947 eruption scenarios (measured to 6–16 km and 16–30 km respectively), when combined with Jan Mayen wind patterns, also allow us to determine the effect of wind directions at different altitudes and during different seasons. Wind conditions for Jan Mayen were obtained from the National Oceanic and Atmospheric Administration, National Centers for Environmental Prediction/National Center for Atmospheric Research (NOAA NCEP/NCAR) reanalysis database (Kalnay et al., 1996) for a 10-year period from 2005 to 2015. This database provides four daily measurements of wind velocity and direction for 17 pressure levels at a resolution of 2.5°latitude x 2.5°longitude.
The Hekla 2000 and 1947 scenarios were run to simulate an eruption with Mt. Beerenberg as the source vent, input parameters are given in Table 2. Wind conditions at Mt. Beerenberg show little seasonality below 15 km altitude (see Supplementary Material), so for the Hekla 2000 scenario we used 1,000 runs (to achieve stable and reproducible results) using all year wind data. From 15 to 20 km altitude there is a change in wind directions and speeds in summer (May to August). During the summer months, the median wind velocity drops from 15 to 20 m/s to <10 m/s, and the median wind direction (the direction the wind is blowing towards) also changes from around 90° to around 270°. Therefore, the Hekla 1947 scenario, with a plume height of up to 30 km, was separated into three parts featuring 1,000 runs each. The first part used wind conditions from all the seasons, the second part used wind conditions for the summer season (May-August) and the third part used the wind conditions for the rest of the year (September-April).
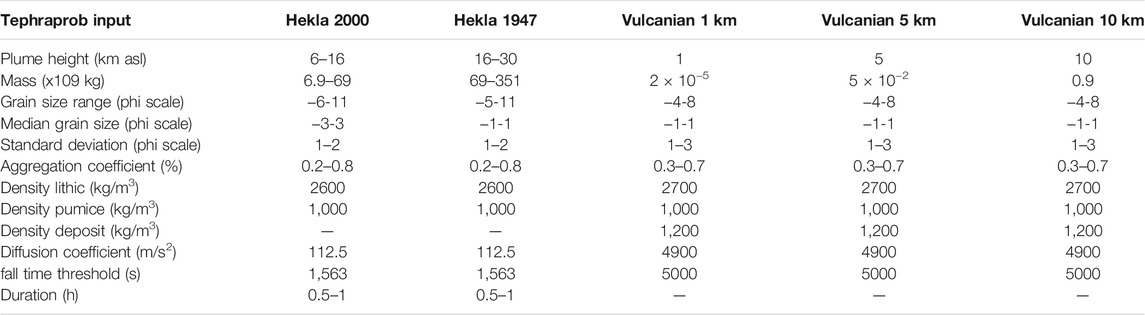
TABLE 2. Input values for the Tephraprob toolbox. The input includes grainsize information (in phi scale), aggregation coefficient (the percentage of grains below four phi/63 micron grain size that aggregate to form larger grains), diffusion coefficient and fall time threshold; see Biass and Bondanna, 2013 for more detail regarding Tephraprob.
On Sør-Jan, Strombolian to Vulcanian tephra producing eruptions are the most frequent style of eruption (Imsland 1978). A soil section from Jan Mayensfield (Figure 3A) shows that at least four eruptions of this type have occurred near the airfield during the Holocene. These tephra layers have thicknesses of 7–13 cm and consist mainly of coarse ash to lapilli. They killed the vegetation that they covered, and most likely originate from vents and fissures around 2–4 km distance away from the soil section. None of these eruptions have been studied in sufficient detail to obtain eruption source parameters, thus the La Fossa volcano, Vulcano, Italy, was used as an analogue for a single Vulcanian eruption on Sør-Jan with eruption source parameters from Biass et al. (2016b) (Table 2). For this scenario, the highest probability cell given by the QVAST analysis was selected as the vent location. This eruption scenario uses three different plume-heights, 1, 5 and 10 km (above sea level), and the simulations were run 1,000 times for each plume height using all year wind data. The Tephra2 simulations for these scenarios yield almost circular distribution and show mostly local distribution of tephra within a few km of the vent. For the 10 km plume, the radius of the zone around the eruptive vent having 50% probability or more of tephra accumulation reaching more than 10 kg/m2 in a violent Strombolian to Vulcanian eruption is 2 km. This distance is similar to the distance from vents seen at the soil section by Jan Mayensfield with similar tephra accumulation. Since the Vulcanian to Strombolian eruptions can occur all over the island it is unfortunately very time consuming and hardware dependent to be able to produce probabilistic maps (with simulations of many different vent locations and then weighing the simulations according to the spatial probability). Because of this we instead made a qualitative map using the spatial probability from the SAMSE map, and then applied a 2 km buffer to each of the hazard levels. This allows visualization of both the spatial probability and the localized and circular tephra dispersal seen both in the simulations and fieldwork.
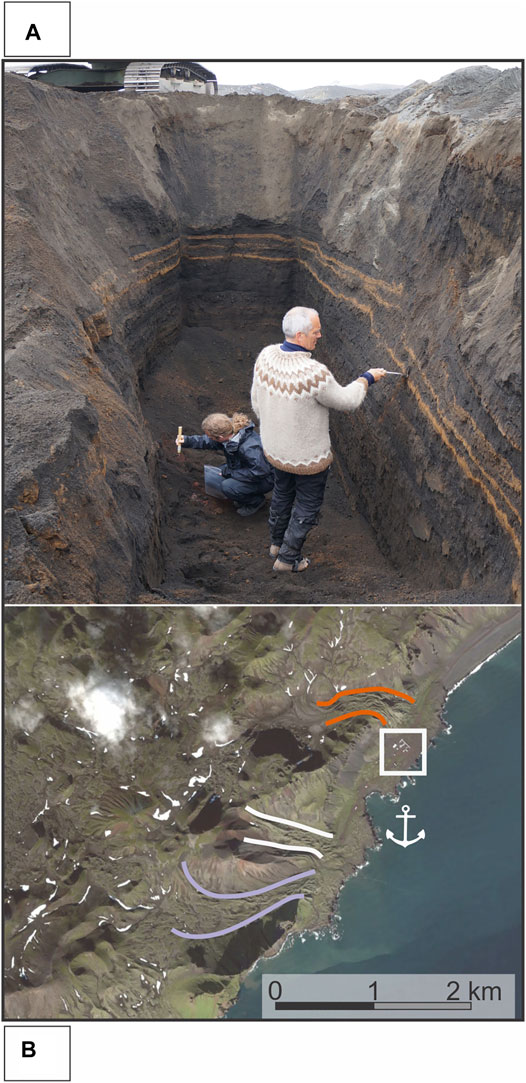
FIGURE 3. (A) Soil section near Jan Mayensfield airfield. The orange-brown layers are vegetation that was buried by tephra. The top of this section is around half a meter of reworked tephra from the Eggøya eruption. (B) Satellite photo (source: Google, DigitalGlobe) of the area surrounding Olonkin City with the main infrastructure (white square). Trolldalen (orange lines), the east side of Borga (white lines) and Borgdalen (purple lines) depict the boundaries of small valleys that serve as natural drainage paths. The anchor shows Båtvika that serves as a landing site for small boats. The valleys have lava flows running through them. These lavas have constructed the coastal plateau that Olonkin City stands on and another plateau S of Båtvika.
Tephra fall maps were compiled for tephra accumulations of 1, 10 and 100 kg/m2, corresponding to ash accumulation thicknesses of 1 mm, 1 cm, and 10 cm respectively. The highest threshold would be expected to seriously disrupt road and air transport, produce loss of visibility, and have implications for health. Equipment with external cooling would require frequent cleaning of intake filters (Wilson et al., 2012; Scaini et al., 2013) and that exposed to ash would experience abrasion and increased wear. The lowest level of ash accumulation would also be expected to cause equipment damage, reduce visibility, and impede air traffic to the island (Guffanti et al., 2010).
Lava Inundation
Q-LavHA (Quantum-Lava Hazard Assessment) is an open-source GIS plugin to simulate lava flow inundation probability from regularly distributed eruptive vents on a Digital Elevation Model (DEM) (Mossoux et al., 2016). For this study, version 2.0 of Q-LavHA was used alongside a DEM from the Norwegian Polar Institute with a spatial resolution of 25 m (Norwegian Polar Institute 2014). Q-LavHA requires a probability density function map (such as those generated by QVAST) to weight the probability of lava flows at a particular vent location. All the input co-ordinates used to generate the PDF maps are shown in Figure 4A. The LSCV susceptibility map (Figure 4B) concentrates the volcanic susceptibility in a smaller area around the volcanic vents than the SAMSE susceptibility map (Figure 4C). We therefore chose to use the SAMSE PDF as input for the lava inundation simulations, because this PDF can compensate for vents destroyed by erosion and hidden by glaciers or younger volcanic units. Before starting, the lava flows in the simulation must be characterized. The height correction factor Hc, which represents the average thickness of the lava flow front, was set at 5 m. The correction factor Hp, representing the maximum thickness of the lava flow, was set to 10 m. These factors allow the simulated lava flows to overcome small topographic obstacles and depressions. The program was set to make it more likely that the simulated lava would follow the steepest downward slope. In order to stop the simulations, a maximum flow length of 3,500 m was selected. Lava flows on Sør-Jan typically reach distances of 2.5–3.5 km before entering the sea, and lava flows from the 1970 eruption on Nord-Jan reached up to 3 km length. Finally, the minimum susceptibility value from the PDF map to simulate vents was set to zero so that all vents were simulated and the distance between all simulated vents was set to 100 m. The model was then run for 1,500 iterations to achieve stable and reproducible results, as recommended by Mossoux et al. (2016). The various input parameters for Q-LavHA are shown in Table 3.
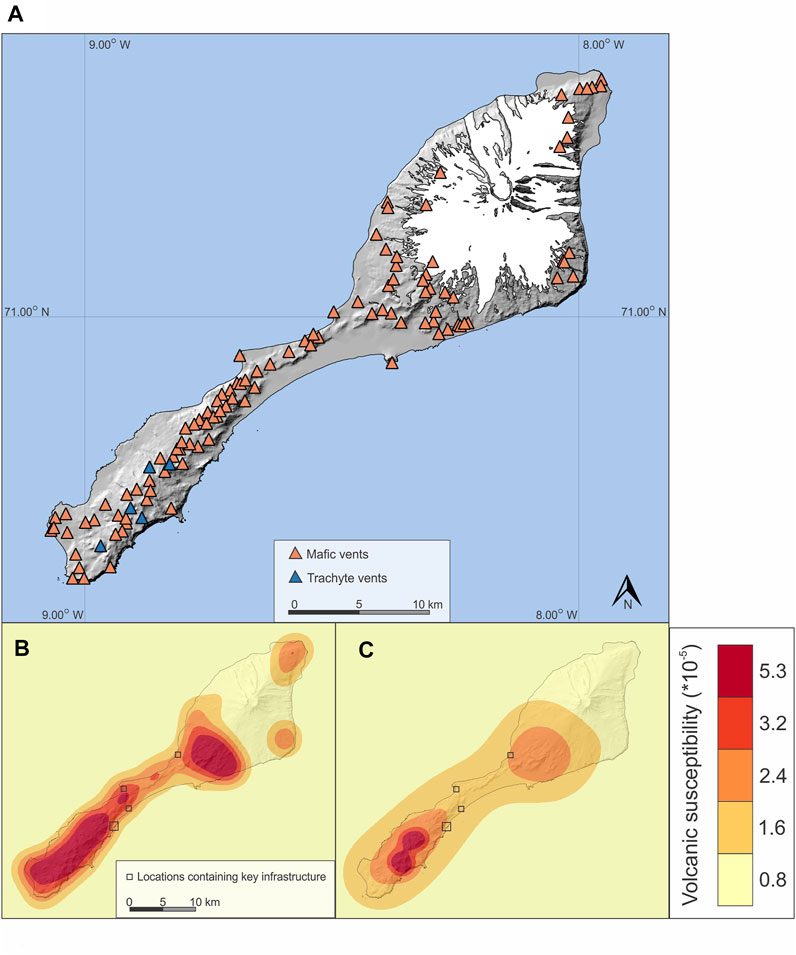
FIGURE 4. (A) Location of trachyte domes and mafic vents used as input for the volcanic susceptibility maps. Spatial probability maps using: (B) a Least Square Cross Validation bandwidth and (C) a Sum of Asymptotic Mean Square Error bandwidth). Small black squares represent four locations (Olonkin City, Jan Mayensfield and meteorological station, Kvalrossbukta, and Gamlemetten) containing key infrastructure. The volcanic susceptibility used as a scale in B and C is the probability, in the case of a volcanic eruption, that a given 25 × 25 cm cell will host an eruption. All the cells are colored based on the assigned threshold values.
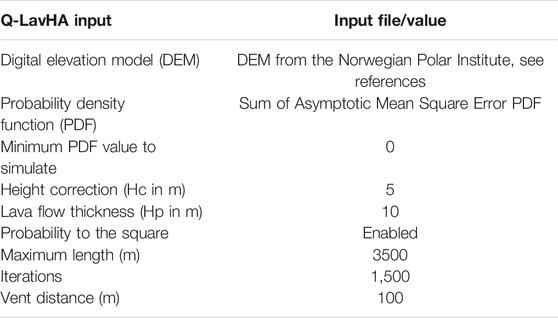
TABLE 3. Input for the Q-LavHA (Quantum-Lava Hazard Assessment) plugin.
Pyroclastic Density Currents From Surtseyan Eruptions
Deposits of previous eruptions have shown that pyroclastic density currents affected areas up to 2 km distance from Surtseyan eruptive vents. This type of eruption could occur all around the shoreline of Jan Mayen. However, the SE and NW flanks of Beerenberg seem less susceptible to such hazards due to a smaller amount of visible recent volcanic vents in these areas. A susceptibility zone for pyroclastic density currents from Surtseyan eruptions was created in QGIS by defining areas within 2 km of the shoreline and below 200 m altitude in order to eliminate areas located above steep sea cliffs.
Volcanic Threat Analysis
To assess whether or not the monitoring of a volcano is sufficient, it is essential to quantify the threat posed by the volcano to its surroundings. Volcanoes with low threat require less monitoring than volcanoes with high threat. We have applied the method of the National Volcano Early Warning System (NVEWS) devised by Ewert et al., 2005 for this purpose. The NVEWS was originally developed for volcanoes in the United States but has, in recent years, been applied to other volcanic areas such as Nisyros (Kinvig et al., 2010), Tenerife (Martí et al., 2012) and Deception Island (Bartolini et al., 2014). The NVEWS requires a systematic assessment of various exposure and hazard factors and multiplies these factors to produce a threat score. The final threat score was used to characterize single volcanoes into one out of five different threat categories ranging from very high to very low. The NVEWS also suggests appropriate monitoring for each of the different threat categories.
Qualitative Volcanic Hazard Map
An integrated qualitative hazard map was produced using the hazard maps created for lava inundation and qualitative Vulcanian to Strombolian tephra hazard. The hazard zones in each of these maps were given values (described in the following paragraph) and these values were summed to produce the final qualitative hazard map. This methodology has been used in other locations and volcanic islands such as Deception Island (Bartolini et al., 2014), El Hierro (Becerril et al., 2014), San Miguel in El Salvador (Jiménez et al., 2020) and La Garrotxa in Spain (Bartolini et al., 2015).
For lava flows, areas were given scores based on the lava flow inundation probability. Areas with probability scores <0.075 × 10−07 were given a score of 1, areas with 0.075–0.15 × 10−07 were given a score of 2, areas with 0.15–0.225 × 10−07 were given a score of 3, areas with 0.225–0.3 × 10−07 were given a score of four and areas above 0.3 × 10−07 were given a score of 5. For qualitative Vulcanian to Strombolian tephra hazard, the hazard levels were given scores from one to 5 (1 for lowest, 5 for highest). Four different hazard levels are used in the integrated qualitative hazard map: three or less, 4–5, 5–6 and 7 and more.
Results
Volcanic Susceptibility
The volcanic susceptibility maps produced by QVAST (Figure 4), using vent locations as input (Figure 4A), represent areas with a range of probabilities of hosting a new vent. Pixels with a high probability value have a high chance of hosting the next eruptive vent and vice versa. Two spatial probability maps were produced, one using LSCV (Figure 4B) and one using SAMSE (Figure 4C) bandwidth calculations. The maps show a high probability of vent openings on Sør-Jan due to the presence of many vents along the volcanic ridge. On Mt. Beerenberg, probabilities have only been calculated on the lower elevations where volcanic vents are visible. Current glacier cover masks possible existing Holocene vents. Furthermore, the Mt. Beerenberg summit crater is not included in these calculations since we do not have any accurate estimates of how often it has erupted during the Holocene.
Recurrence Rate
The recurrence rate of eruptions on Jan Mayen during the Holocene is calculated to be between 7.5 × 10⁻³ and 8.5 × 10⁻³ volcanic events per year, and the average repose time is between 133 and 117 years. With a 370-year historical period and five eruptions, we calculate 1.35 × 10⁻² volcanic events per year and an average repose time of 73 years.
Eruption Scenarios
The Holocene eruptions on Jan Mayen can be divided into two main groups based on composition - mafic (alkali-basaltic) and trachytes. The mafic eruptions occurred all over Jan Mayen and produced lava flows, scoria cones and tuff cones (Figure 2A,C, Figure 4A). Based on the currently visible vents, between two and seven eruptions have been Surtseyan and have produced tuff cones. Approximately 20 have produced only scoria cones whereas around 50 have produced lava flows with varying amounts of spatter and scoria. From the 75 to 85 eruptions that have been estimated to have occurred during the Holocene, seven produced trachyte domes (Figure 2C and Figure 4A) and these domes have been observed on only Sør-Jan. For an estimated 75–85 Holocene eruptions based only on counting the currently visible vents, the average eruption volume is 0.06–0.07 km3 DRE. Of the Holocene eruptions, approximately 61% are classified as mainly effusive, approximately 24% are classified as Strombolian to Vulcanian, approximately 8% are classified as dome forming and approximately 6% are classified as Surtseyan (Table 4). During the historical period of Jan Mayen, from 1,650 up to the present day, there have been at least five eruptions, one of which was mostly effusive but also had significant explosive phases, and it is thus characterized as having a mixed style of eruption. In the historical period 60% of the eruptions are classified as effusive, 20% as Surtseyan, and 20% as mixed eruptions (Table 4).
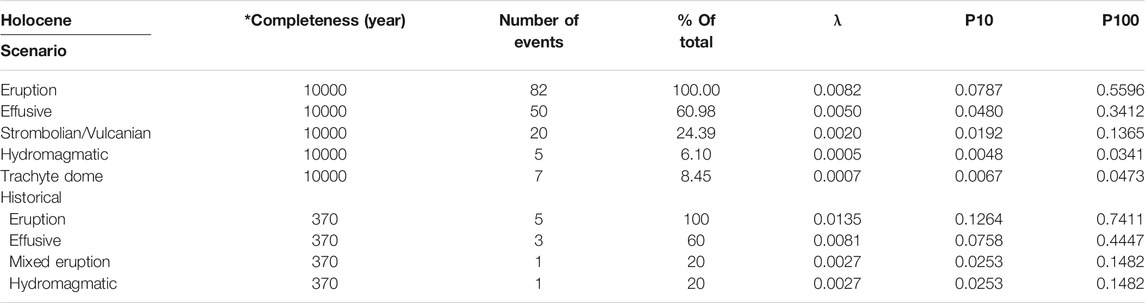
TABLE 4. The probability (in %) of occurrence of eruptions with given eruption scenarios for the next 10 and 100 years (P10 and P100, respectively), based on Holocene and historical volcanism. * The non-historical records are most likely not complete and the number of events, λ, P10 and P100 therefore represent minimum values.
Accumulation of Ash Fall on the Ground
Results from TephraProb calculations are presented in Figure 5 using eruption parameters from the Hekla 2000 and 1947 eruptions in case of an eruption from Mt. Beerenberg (Biass et al., 2014) and Vulcanian eruptions with 5 and 10 km plume heights. The 1 km plume simulations for Vulcanian eruptions did not produce tephra fall exceeding the chosen thresholds and are therefore excluded from the maps. Figure 5A,B show the results from calculations using all year wind data, whereas Figure 5C,D use wind data from May-August and September-April respectively. A comparison of the probability isolines in Figure 5C,D shows that a summer eruption gives more circular isolines versus oval isolines for the rest of the year. The seasonality shows that a Mt. Beerenberg eruption occurring in the summer months (May, June, July, and August) is more likely to distribute tephra towards the SW (i.e., in the direction of Olonkin City) than a similar eruption occurring during the rest of the year. The likelihood of ash fall exceeding 10 kg/m2 is shown in Figure 5 A-E, whereas the likelihood of exceeding ash fall of 1 kg/m2 is shown in Figure 5F. The qualitative hazard from tephra fall from Strombolian to Vulcanian eruptions based on a circular distribution and the spatial probabilities is shown in Figure 5G. In Table 5 results from TephraProb on the probability of airborne volcanic ash exceeding 1 kg/m2, 10 kg/m2 and 100 kg/m2 for the locations of Olonkin City, Jan Mayen airfield, Kvalrossbukta and Gamlemetten are given.
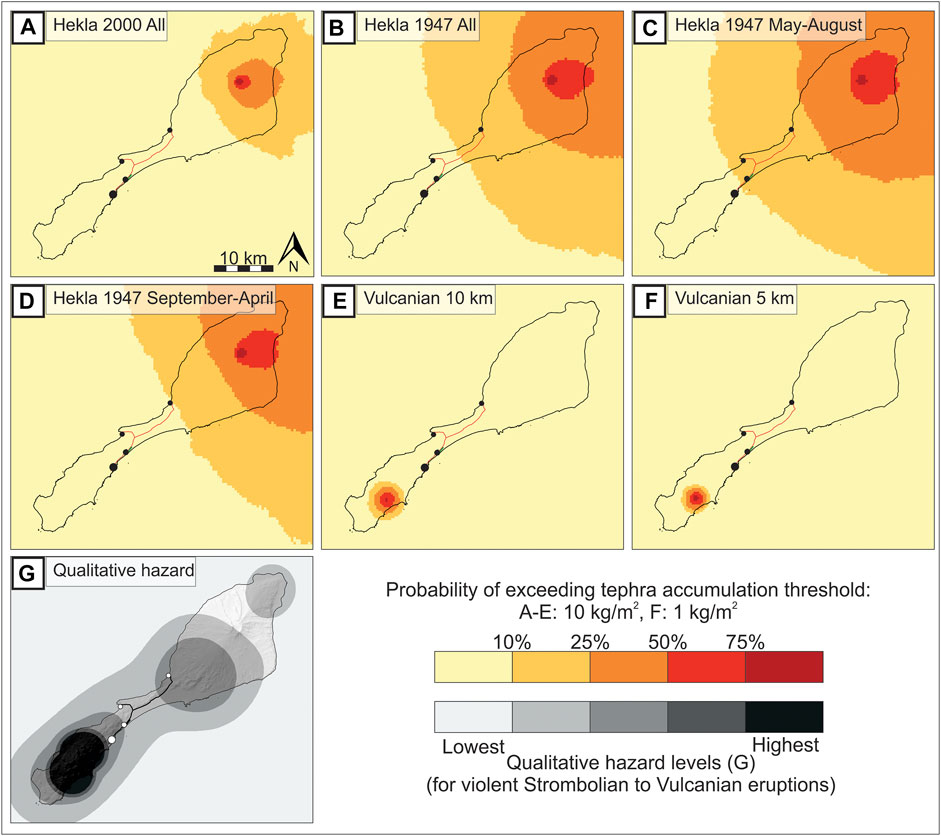
FIGURE 5. The probability of exceeding an accumulation of 10 kg/m2 of tephra fall deposit for the following eruption scenarios from the Beerenberg central crater: (A) Hekla 2000 all seasons, (B) Hekla 1947 all seasons, (C) Hekla 1947 May-August, and (D) Hekla 1947 September-April. (E) and (F) represent Vulcanian eruption scenarios involving a single Vulcanian explosion and a plume height of 10 and 5 km respectively. For (F) the threshold for tephra accumulation was set at 1 kg/m2 because there was no probability of exceeding a 10 kg/m2 threshold. Black dots represent primary infrastructure locations and red lines represent the road network. (G) Represents the qualitative tephra hazard for Vulcanian to Strombolian eruptions. White dots represent primary infrastructure locations and black lines represent the road network.

TABLE 5. The probability of exceeding given mass loads for the different eruptive scenarios at four locations containing key infrastructure on Jan Mayen.
Lava Inundation
The lava flow hazard map produced with Q-LavHA (Figure 6A) shows the relative probability of single cells to be inundated by lava flows. Lava flow inundation is controlled by topography, resulting in an increased probability of lava inundation in natural watersheds due to channeling effects. The map also shows locations near Olonkin City and the airfield with high inundation probability that could serve as entry points for lava flows entering the sea (Figure 6B), that could produce littoral explosions (Mattox and Mangan 1997). The highest probabilities are found along the central ridge in Sør-Jan, where the volcanic susceptibility is highest (Figure 4).
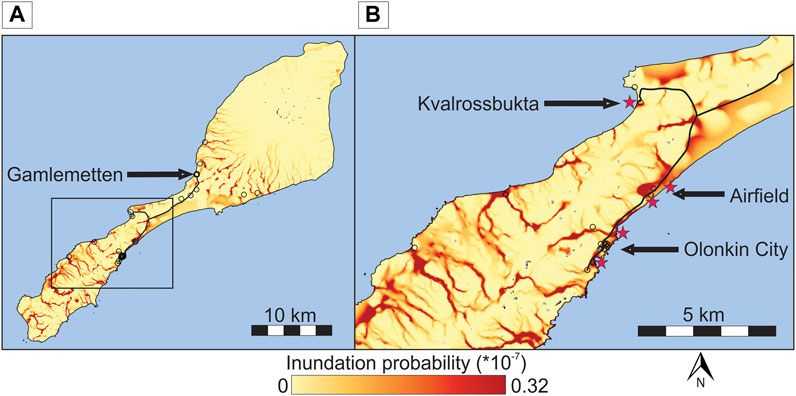
FIGURE 6. Maps showing the probability of lava flow inundation, where pale yellow represents a lower probability of inundation and red represents a higher probability. Locations with infrastructure are represented with black circles, and stars show areas with a relatively high likelihood of lava flows entering the sea. The black box in shows the location of the inset map.
Pyroclastic Density Currents From Surtseyan Eruptions
The entire primary infrastructure on Jan Mayen lies within the susceptibility zone for pyroclastic density currents from Surtseyan eruptions (Figure 7), but Gamlemetten (Figure 1B) is probably the least susceptible of the infrastructure locations since it stands at a height of 40 m above sea level on a plateau with steep cliffs down to the sea.

FIGURE 7. (A and B) Zones within 2 km of the coastline and below 200 m a.s.l. that are most susceptible to pyroclastic density currents from Surtseyan eruptions.
National Volcano Early Warning System
The following section describes the scoring factors used for the NVEWS threat rating and shows the criteria used for determining each of the scores (Table 6); each number in the table corresponds to the same number in the text. For a more detailed description of the scoring system, the reader is referred to Ewert et al., 2005. Lack of data caused uncertainty in some of the parameters, and for these scores we have assigned maximum and minimum scores in an attempt to quantify the uncertainty.
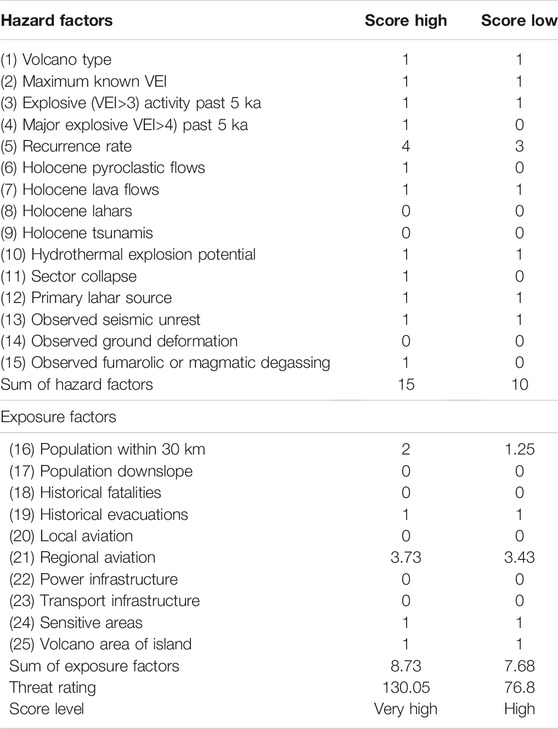
TABLE 6. Jan Mayen National Volcano Early Warning System (NVEWS) scoring factors.
Hazard Factors
Jan Mayen Island comprises volcanic domes, monogenetic fissures and lavas, and the summit region of Beerenberg has a morphology akin to a stratovolcano (1). One Holocene Surtseyan eruption has been reconstructed and has a VEI of 3–4 2) and 3) (Gjerløw et al., 2015). In addition, although no deposits from large explosive eruptions (VEI >4) have been found, the possibility of such eruptions cannot be excluded (4).
The historical period for Jan Mayen starts in the early 17th century, and during this time at least five eruptions have occurred on the island (Gjerløw et al., 2015). During the Holocene, 75–85 eruptions are estimated to have occurred (5). Pyroclastic density currents have been documented from an eruption in 1732 (Gjerløw et al., 2015) (6) and several recent lava flows extend to the current coastline of the island (7). Lahar and tsunami deposits have not been documented during the Holocene (8) and (9). The 1732 eruption was Surtseyan and several tuff cones along the coastline show that this type of eruption has occurred multiple times in the past (10). Sector collapse has not been documented from Jan Mayen, but the shape of the eastern and northern flanks of Beerenberg suggest that sector collapse could have occurred in the past (11). Beerenberg is covered by glaciers that could serve as a source of water for lahars and glacier floods (12) in the event of a subglacial eruption. Since the last eruption in 1985 (Imsland 1986), there have been several earthquakes (13), but no ground deformation has been documented (14), and fumaroles were observed from the summit region of Beerenberg for a few years following the eruption (15).
Exposure Factors
The first exposure factors consider the population on or near the volcano. The first factor is the volcano population index within 30 km of the volcano. The population usually consists of 18 people and can reach as high as 100 when cruise ships stop and allow tourists ashore: the Volcano Population Index ranges from 1.25 to 2 (16). There is no population directly downslope of the glaciers of Beerenberg (17) and no fatalities have been recorded during the eruptions on Jan Mayen (18). When the 1970 eruption was first observed, Olonkin City was evacuated for a short period while the possible threat to the population and infrastructure was evaluated (19). There are no airports for jet-airplanes near Jan Mayen (20), but international flight corridors pass within 200 km of Jan Mayen (21). Power and transport infrastructure on Jan Mayen is of limited scope and only intended for local use (22) and (23). Finally, most of the island is a nature reserve (s4) and Holocene volcanic deposits cover more than 25% of the exposed area of the island (25).
The scores for Beerenberg, and for Jan Mayen as a whole, are the same and the final threat score calculated for the high values was 130, whereas the final threat score for the low values was 77. The low value falls within the high threat rating (64–123, Ewert et al., 2005), whereas the high value falls within the very high threat rating (123–324). These values are compared here with volcanoes in the United States. The high score is similar to Long Valley Caldera, the low score is similar to Mount Cleveland and in between these scores, are volcanoes such as Mount Katmai, Novarupta and Pavlof (Ewert et al., 2005).
Qualitative Volcanic Hazard Map
The qualitative hazard map (Figure 8) based on tephra fall from Strombolian to Vulcanian eruptions and lava flow inundation shows that the highest hazard levels are in the valleys and watersheds on Sør-Jan and on the SW flank of Beerenberg. The highest hazard areas (that score >7) comprise mainly natural drainages and topographic depressions with high scores 5) for lava inundation that also score 3 or higher for Vulcanian to Strombolian tephra hazard. Areas with hazard scores of 6-7 comprise areas with the highest score in Vulcanian to Strombolian tephra hazard, as well as natural drainages and topographic depressions in areas with a score of three for Vulcanian to Strombolian tephra hazard. The areas with hazard scores of four to five comprise mostly areas with a score of three–four in Vulcanian to Strombolian tephra hazard. The lowest hazard areas, with scores of 0–3, generally score lowest in lava inundation and in the two lowest categories for qualitative Vulcanian to Strombolian tephra hazard. Due to the lack of data, and therefore possible underestimation of the hazard from the glaciated regions of Beerenberg, this part of the island is excluded from the qualitative hazard map.
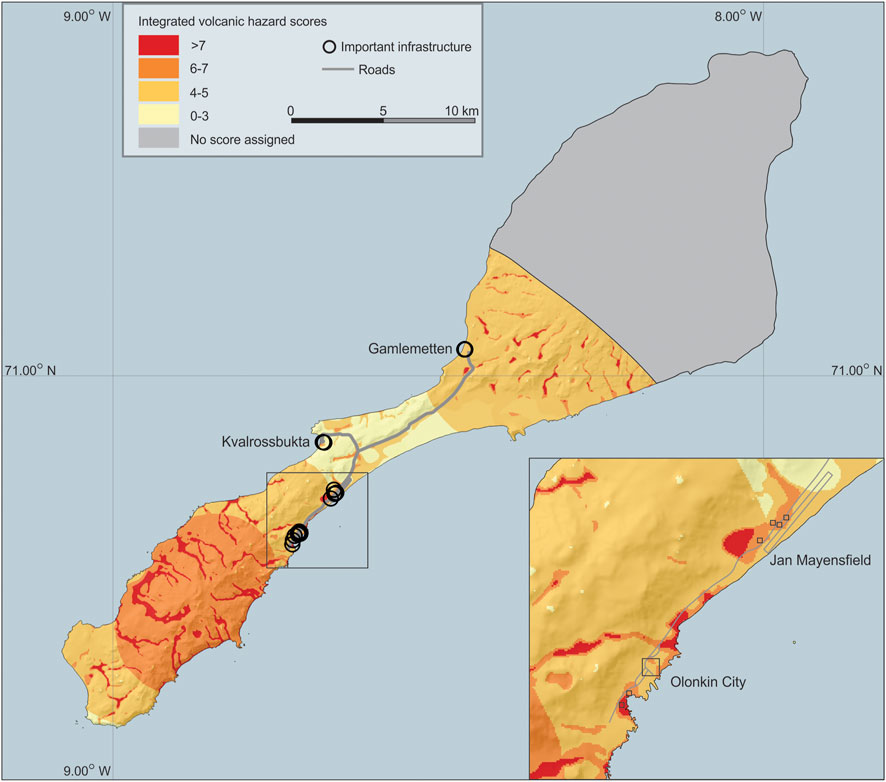
FIGURE 8. Qualitative volcanic hazard map for Jan Mayen (based on tephra fall from Strombolian to Vulcanian eruptions and lava flow inundation). The expanded section of the map shows the airfield (elongated rectangle), Olonkin City (large square) and other buildings (small squares). Scores of >7 are given to areas with high scores in two or more of the other hazard maps. Scores of 5-6 are given to areas with high scores in one hazard and intermediate in one. Scores of four to five are given to areas that have intermediate scores in one hazard. Scores of three or less are given to areas with low scores in both hazards. The grey area is excluded from the scoring due to lack of data in the subglacial parts of Beerenberg.
Areas on Midt-Jan where the roads between Kvalrossbukta, Olonkin City and Gamlemetten run have scores in the two lowest categories (<3 and 4–5). Olonkin City is mainly located in an area with hazard scores of four to five but contains parts with scores of 6-7, and the roads leading from Olonkin City run through areas with hazard scores >7. The meterological station NE of Olonkin City lies in an area with hazard score >7, whereas Jan Mayensfield airfield lies mostly in an area with a hazard score of 4–5. Kvalrossbukta is in an area with hazard score of 0–3 and the plateau where Gamlemetten is located is in an area with a hazard score of four to five.
Discussion
Exposure Based Analysis
Based on past activity on Jan Mayen, the most likely future eruption scenarios are effusive eruptions and Strombolian to Vulcanian explosive eruptions. Surtseyan eruptions producing large amounts of tephra, such as the Eggøya eruption in 1732 (Gjerløw et al., 2015), are less common but have occurred a few times during the Holocene. The trachyte domes on Sør-Jan are interpreted to be of Holocene age (Imsland 1978), and this form of volcanism is less common. Gjerløw et al. (2016) did not find evidence for explosive summit eruptions at Beerenberg. There was fumarolic activity from the summit crater after the 1970 and 1985 eruptions, but the eruptions themselves were fissure eruptions on the flank of the volcano. Although no evidence for Holocene eruptions from the summit vent has been found, the volcano is most likely not extinct. Following the volcanic eruptions of 1970 and 1985, fumarolic activity was seen located on the inner rim of the central crater (Gjerløw et al., 2016), and steam was seen rising from the central crater during the 1970 eruption (Siggerud 1972), indicating some degree of volcanic activity from the central crater of Beerenberg. The frequency of sub-Plinian to Plinian eruptions from the Beerenberg summit is most likely low, but the hazards from such an eruption still need to be considered. An exposure-based analysis of volcanic hazards on Jan Mayen Island shows that the main infrastructure at risk is: Olonkin City, the Jan Mayensfield airfield and meteorological station, the cabin and natural harbor at Kvalrossbukta, the cabins at Gamlemetten, and the road network of the island.
Olonkin City (Figure 1B) is in an area with an intermediate probability of vent opening (Figure 4B,C), but it is also proximal to areas with high probabilities and lies approximately 3 km from one of the areas with highest probability (to the SW). Multiple fissure eruptions have occurred along the center of the ridge, just 1.5 km NE of Olonkin City, during the Holocene and Olonkin City is located on a lava flow from one of these (Figure 4A). If a violent Strombolian to Vulcanian eruption occurred in this area, tephra fall would be expected in Olonkin City (Figure 5). The Hekla 2000 scenario for a Beerenberg explosive eruption (Table 5) gives a 4.7% probability of exceeding a mass load of 1 kg/m2, 0.3% probability of exceeding a mass load of 10 kg/m2 and 0% of exceeding 100 kg/m2. The Hekla 1947 scenarios (all year, summer, and September-April) give 9–20% probability of exceeding a mass load of 1 kg/m2, 3.8–9.3% probability of exceeding a mass load of 10 kg/m2 and 0.0–1.4% probability of exceeding 100 kg/m2. In terms of the possibility of lava inundation, the SW part of Olonkin City is in a low probability area whereas the NE part is in a medium probability area. As seen in Figure 6, Olonkin City has areas with high probability located both on the NE and on the SW sides. The steep cliffs to the NW and shoreline to the SE mean that the Olonkin City is effectively surrounded by areas with high probability of lava inundation. An eruption starting at Trolldalen, located N of Olonkin City, could potentially inundate Olonkin City, and cut off evacuation routes. A lava flow coming from the NE side of Borga (Figure 3B) could cut off on-foot evacuation routes or by boat in Båtvika, directly S of Olonkin City, (Figure 3B). A lava flow in Borgdalen (Figure 3B) would also cut off on-foot evacuation routes but would keep Båtvika and the possibility of evacuation by small boats open. As seen in Figure 6, both Båtvika and the area NE of Olonkin City have domains with high lava flow inundation probabilities, which could serve as points for lava flows entering the sea. Should such a scenario occur, Olonkin City could also be subjected to tephra fall and ballistic projectiles from littoral explosions (e.g., Mattox and Mangan 1997).
The Jan Mayensfield airfield and meteorologic station (Figure 1B) are in an area with an intermediate probability of vent opening (Figure 4B,C). If a violent Strombolian to Vulcanian eruption occurs within a few kilometers of these locations, tephra fall would be expected. The Hekla 2000 scenario for a Beerenberg explosive eruption (Table 5) gives a 5.7% probability of exceeding a mass load of 1 kg/m2, 0.7% probability of exceeding a mass load of 10 kg/m2 and 0% of exceeding 100 kg/m2. The Hekla 1947 scenarios (all year, summer, and September-April) give 11–22.4% probability of exceeding a mass load of 1 kg/m2, 4.4–10.9% probability of exceeding a mass load of 10 kg/m2 and 0.3–1.8% probability of exceeding 100 kg/m2. With respect to the possibility of lava inundation, there are natural drainage paths on the NE and SW sides, and both the meteorological station and the airfield are in high probability areas. These sites are vulnerable if an effusive eruption occurs on the ridge to the NE near these locations (Figure 6). The Jan Mayensfield airfield and meteorologic station are both situated on Holocene lava flows that entered the sea. The lava inundation probability map shows that nearby areas have high inundation probabilities near the sea (Figure 6). Therefore, both locations could also be subjected to tephra fall and ballistic projectiles from littoral explosions if nearby lava flows reach the sea.
Kvalrossbukta (Figure 1B) has an intermediate probability of vent opening (Figure 4B,C) and, should a violent Strombolian to Vulcanian eruption occur within a few kilometers of Kvalrossbukta, tephra fall would be expected. The Hekla 2000 scenario for a Beerenberg explosive eruption (Table 5) gives a 6.0% probability of exceeding a mass load of 1 kg/m2, 0.9% probability of exceeding a mass load of 10 kg/m2 and 0% probability of exceeding 100 kg/m2. The Hekla 1947 scenarios (all year, summer, and September-April) give 11.0–22.5% probability of exceeding a mass load of 1 kg/m2, 4.4–11.2% probability of exceeding a mass load of 10 kg/m2 and 0.3–2.0% probability of exceeding 100 kg/m2; higher probabilities apply for an eruption during the summer months. Kvalrossbukta has a low probability of lava inundation (Figure 6), but towards the center of the bay the probability increases in a small area and reaches a high probability. The cabin in Kvalrossbukta is in an area with intermediate probability.
Gamlemetten (Figure 1B) is located on a plateau with intermediate probability of vent openings (Figure 4B,C). For the Beerenberg explosive scenarios, Gamlemetten has the highest probabilities of experiencing significant tephra fall due to its location on the flank of Beerenberg (Table 5; Figure 5). The Hekla 2000 scenario gives an 11.6% probability of exceeding a mass load of 1 kg/m2, 3.8% probability of exceeding a mass load of 10 kg/m2 and 0.2% probability of exceeding 100 kg/m2. The Hekla 1947 scenarios (all year, summer, and September-April) give 20.1–35.2% probability of exceeding a mass load of 1 kg/m2, 9.8–20.4% probability of exceeding a mass load of 10 kg/m2 and 2.6–8.0% probability of exceeding 100 kg/m2; the probabilities are higher during the summer months. The plateau that Gamlemetten stands on has a low probability of being inundated by lava flows (Figure 6), due to the natural watersheds running on either side of it.
The road network on Jan Mayen is located along the coastal cliffs and crosses the island in two locations (Figure 1B). The spatial probability of vent openings is low to intermediate along the road network (Figure 4B,C). The probabilities for tephra fall vary with distance from Beerenberg; higher probabilities apply closer to Beerenberg for the Hekla 1947 and Hekla 2000 scenarios. For Vulcanian eruptions the probabilities vary with distance from the source (Figure 5). The roads pass through areas with high probability of lava inundation (Figure 6) between Olonkin City, Jan Mayensfield and Kvalrossbukta, and an effusive eruption on the ridge between Kvalrossbukta and Olonkin City could block the road between these points.
The cabins on the S flank of Beerenberg (Figure 1B) are more exposed to tephra fall from the Beerenberg summit eruption scenarios than any other infrastructure (Figure 5); probabilities exist of exceeding the 10 kg/m2 thresholds of more than 25% for the May-August Hekla 1947 scenario. Some of the cabins located on the SW coast of Jan Mayen are in areas with high probabilities of lava inundation (Figure 6).
Qualitative Volcanic Hazard
From the qualitative volcanic hazard map (Figure 8), we find the highest volcanic hazard in the central parts of Sør-Jan where valleys and watersheds are in proximity to the highest concentration of Holocene volcanic vents. Fieldwork revealed several coarse-grained tephra layers, and several lava flows forming coastal plateaus on Sør-Jan. On Midt-Jan, the hazard level is generally low; there are no Holocene lava flows in this area and only a few scoria cones. On the SW flank of Beerenberg, the hazard score is four to five whereas watersheds and valleys have higher scores, but there is higher uncertainty in these hazard scores due to the glacier cover on Beerenberg. In this area, there are several young lava flows, coarse-grained tephra layers and scoria cones.
NVEWS
The minimum and maximum scores assigned to Jan Mayen and Beerenberg in the NVEWS methodology (Table 6) are in the category of a high to very high threat volcano although, if the international flight corridor near Jan Mayen is excluded, the threat rating is moderate for the minimum and high for the maximum score. The scores in Table 6 represent maximum and minimum values. With a more complete knowledge regarding past eruptions and precursors it would be possible to narrow the gap between these scores, and most likely conclude with a moderate score in between the two extreme values. Furthermore, the fact that a remote island with a small population such as Jan Mayen could result in a high to very high threat rating, points to issues with the NVEWS system. The solution to this may be to remove the factor “regional aviation” from the equation. This reduces the maximum and minimum scores to result in a moderate to high threat. This air corridor is quite isolated and it should be possible to re-route the traffic in it to other locations in the case of an eruption providing justification for this approach. According to Ewert et al., 2005 (page 20), high and very high threat volcanoes should be “well monitored in real time”. More specifically, they suggest that the monitoring network should provide the ability to track changes in real-time and to develop, test, and apply models of ongoing and expected activity. For moderate threat volcanoes the “monitoring should provide the ability detect and track pre-eruptive and eruptive changes in real-time, with a basic understanding of what is occurring” (Ewert et al., 2005 page 20), and include a seismic network with at least six stations, continuous deformation measurements with at least six stations as well as regular surveys in addition to monitoring gas and hydrology. The current network on Jan Mayen consists of four seismological stations and a single deformation monitoring point. The recommendations from the NVEWS guidelines show that the volcano monitoring on Jan Mayen is closer to the recommendations for a low threat volcano and not sufficient for a moderate threat volcano.
Hazard Assessment on Remote Volcanic Islands
Hazard assessments on volcanic islands are like other volcanic areas in many aspects, but some special considerations need to be done compared to other locations:
- A major part of conducting hazard assessment is to study the past activity of the volcano or volcanic field (Marti, 2017). This can be difficult in remote islands due to limited historical data (for example Deception Island was discovered in 1820 and Jan Mayen in 1,608). There are often large holes in the historical records due to their remoteness and the records that do exist can often be inaccurate or limited. Furthermore, it can be difficult and even dangerous to conduct fieldwork to study past eruptions; on Jan Mayen the NE flank of Beerenberg is only accessible by boat, and 5 people from the University of London died when their boat capsized due to fall winds in 1961 (Barr 2003). The remoteness also often means that strict safety measures are required, and this can set limitations to what kind of studies can be performed.
- When conducting spatial analysis and volcanic susceptibility these islands have the added consideration of vents obscured by the sea and vents removed by coastal erosion. In addition, volcanic islands in the Arctic and Antarctic can also have glacier cover capable of obscuring vents underneath the ice. Due to these issues volcanic susceptibility maps from volcanic islands should be interpreted with care as they can be inaccurate due to the missing and obscured vents.
- As mentioned in the 2018 update to the NVEWS scores (Ewert et al., 2005), many volcanic islands have high to moderate scores due to aviation. In the update they have shown aviation scores in addition to the total threat scores NVEWS scores. However, when remote volcanic islands such as Jan Mayen (this study) and Deception Island (Bartolini et al., 2014) end up in the high-to very-high threat ratings it can be useful to further separate the scores since they can be inflated due to tourism and aviation. One suggestion could be to also create a local hazard score (where the impact of regional aviation and tourism is removed).
- The use of qualitative volcanic hazard maps is a topic of debate for the scientific community, and some would argue that qualitative maps can be misleading for decision makers in risk assessment (Thompson et al., 2015). However, volcanic islands such as Jan Mayen and Deception Island often have scarce or missing data of past eruptions, and as such it is not possible to produce detailed and precise quantitative maps (Marti, 2017). In these cases, the use of qualitative maps can be appropriate and provide guidance on future land use and planning (e.g., Bartolini et al., 2015; Jiménez et al., 2020).
Recommendations
Our suggestion is to improve the volcano monitoring on Jan Mayen to bring it more in line with the recommendations from the NVEWS. Installing additional monitoring equipment prior to the next eruption could help improve the knowledge of expected precursors. Improving the monitoring would potentially assist with early eruption-detection, give the team on the island time to evacuate and help to issue aviation warnings, especially considering that the high-threat score achieved for Jan Mayen results mostly from the proximity of the island to polar air routes. There are arguments for relocating Olonkin City from its current location to areas less exposed to lava inundation and tephra fall from Strombolian to Vulcanian eruptions (Figure 8). However, most of the low hazard areas have other issues (such as wave erosion, topographic constraints, exposure to extreme wind and the presence of ephemeral lakes and streams) that complicate such a relocation. We therefore recommend that emergency response plans are made for the volcanic hazards most likely to affect Olonkin City, namely lava flows and tephra fall from Strombolian to Vulcanian eruptions.
Caveats
All the probabilities and hazard maps shown in this study are conditional on the occurrence of a specific eruption scenario, which differs among the different hazardous events considered (lava inundation, tephra fallout, etc...). For example, Table 5 shows the probability of exceeding thresholds of tephra accumulation for different eruption scenarios, but the probabilities in this table are conditional upon the assumption that the associated eruption scenario occurs.
Since our source parameters are limited to volume, we use analogues for sub-Plinian or Vulcanian eruptions from Jan Mayen. The proximal deposits show that Strombolian to Vulcanian eruptions do occur and, due to the presence of pre-Holocene Jan Mayen tephra in distal regions, we include sub-Plinian to Plinian eruptions to account for potentially larger eruptions. There is, however, no guarantee that future eruptions on Jan Mayen will fit with the selected scenarios and input parameters; eruptions with different source parameters and vent locations could have different hazard patterns to the simulated ones, thus it is important to run short time hazard analysis once unrest is detected. Future work should also take into considerations the vents susceptibility calculations (and its effect on eruptive styles such as in case of Surtseyan eruptions) with lava and tephra modelling (Becerril, 2009, 2017; Selva et al., 2010; Bartolini et al., 2015; Thompson et al., 2015; Sandri et al., 2016).
This study focuses on the spatial probability of vent openings, lava flows and tephra fall on Jan Mayen, but the selected eruption scenarios can also generate additional hazards such as ballistic projectiles, pyroclastic density currents, lahars and volcanic gases. The spatial maps could underestimate the probability of vent openings on Nord-Jan due to glacier cover and all around the island along the coastlines due to erosion, and thus overestimate the probability of vent opening along the ridge on Sør-Jan. Because of this, we chose to use the SAMSE probability map for modeling the lava inundation probability (Figure 4C); this spreads the probability over a larger area than the LSCV map, and should give more accurate spatial probabilities on Sør-Jan. However, this approach also results in decreased probabilities of vent openings on the SW and NE flanks of Beerenberg and decreases the probability of lava flow inundation in the Q-LavHA simulations in these areas.
The number of vents used in calculating the recurrence rates for the Holocene represents the number of vents that are visible at the surface at the present. However, there is no guarantee that this represents the true number of Holocene eruptions as older vents might have been eroded or have been obscured by glaciers or newer eruptions. And as we have mentioned above, the submarine shelf of Jan Mayen has not been mapped in sufficient details to draw any conclusion on number of vents offshore.
On Beerenberg, the DEM represents the glacier surface. However, since studies have shown that lava flows with access to a snow/ice boundary and its substrate tend to flow along this contact (e.g., Edwards et al., 2015; Oddsson et al., 2016), simulated lava flows from the glaciated parts of Beerenberg must be carefully interpreted since this fact is not integrated in the present version of Q-LavHA.
Conclusion
We present a volcanic hazard assessment of Jan Mayen Island. The most likely hazards to occur on the island, based on past activity, are tephra fall and lava flows. The qualitative hazard and probability maps show that both hazards could affect Olonkin City and the rest of the infrastructure on Jan Mayen if an eruption occurred in their vicinity. We recommend that volcano monitoring on Jan Mayen is enhanced. Explosive eruptions from the Beerenberg summit vent are low frequency events and give low probabilities of significant ash-fall on Sør-Jan. However, it should be kept in mind that that such events can quickly become cross border hazard with special attention of the aviation industry (Titos et al., 2021). The results of this study are useful for hazard assessment and risk mitigation, planning of evacuation routes for different eruption scenarios, and designation of future land use on the island. The results should be interpreted with care because 1) they depend on an incomplete catalogue of historical and Holocene eruptions, 2) some scenarios are based on analogues with other volcanoes and 3) the qualitative map is based on hazard scores that are conditional to different scenarios. This study exemplifies a hazard assessment approach for remote volcanic islands.
Data Availability Statement
The original contributions presented in the study are included in the article/Supplementary Material, further inquiries can be directed to the corresponding author.
Author Contributions
ÁH, RP and EG, are responsible for the project idea behind this article. EG, SBa, SBi and SM prepared the input data and ran the computer models. EG drafted the manuscript and designed figures. EG, ÁH, SBa, SBi, SM, JG, RP and JM contributed with writing, feedback and suggestions to the article and approved the submitted manuscript.
Funding
This study was part of EG’s Ph.D. project and was financed by the Centre for Geobiology at the University of Bergen and the Nordic Volcanological Center at the University of Iceland. This paper has been written while the lead author has been employed at UiT the Arctic University of Norway. This study has also been part of the VeTools and EVE projects (EC ECHO Grants SI2.695524 and 826292).
Conflict of Interest
The authors declare that the research was conducted in the absence of any commercial or financial relationships that could be construed as a potential conflict of interest.
The reviewer LS declared a past collaboration with one of the authors SM to the handling Editor.
Publisher’s Note
All claims expressed in this article are solely those of the authors and do not necessarily represent those of their affiliated organizations, or those of the publisher, the editors and the reviewers. Any product that may be evaluated in this article, or claim that may be made by its manufacturer, is not guaranteed or endorsed by the publisher.
Acknowledgments
We want to acknowledge the Jan Mayen personnel for their hospitality and assistance during fieldwork, and the Norwegian Polar Institute for supplying aerial photos and map data. We thank Antonio Paonita and Valerio Acocella for the editorial handling and the three reviewers for comments that helped us improve the quality of this article.
Supplementary Material
The Supplementary Material for this article can be found online at: https://www.frontiersin.org/articles/10.3389/feart.2022.730734/full#supplementary-material
References
Abbot, P. M., and Davies, S. M. (2012). Volcanism and the Greenland Ice-Cores: the Tephra Record. Earth. Sci. Rev. 115, 179–193. doi:10.1016/j.earscirev.2012.09.001
Aspinall, W. P. (2006). “Structured Elicitation of Expert Judgment for Probabilistic hazard and Risk Assessment in Volcanic Eruptions,” in Statistics in Volcanology. Special Publication of IAVCEI 1. Editors H. M. Mader, S. G. Coles, C. B. Connor, and L. J. Connor (Geological Society of London, UK.
Barr, S. (2003). Jan Mayen Norges Utpost I Vest, Øyas Historie Gjennom 1500 År. Schibsted Forlag. Oslo, Norway.
Bartolini, S., Bolós, X., Martí, J., Pedra, E. R., and Planagumà, L. (2015). Hazard Assessment at the Quaternary La Garrotxa Volcanic Field (NE Iberia). Nat. Hazards 78, 1349–1367. doi:10.1007/s11069-015-1774-y
Bartolini, S., Cappello, A., Martí, J., and Del Negro, C. (2013). QVAST: a New Quantum GIS Plugin for Estimating Volcanic Susceptibility. Nat. Hazards Earth Syst. Sci. 13, 3031–3042. doi:10.5194/nhess-13-3031-2013
Bartolini, S., Geyer, A., Martí, J., Pedrazzi, D., and Aguirre-Díaz, G. (2014). Volcanic hazard on Deception Island (South Shetland Islands, Antarctica). J. Volcanology Geothermal Res. 285, 150–168. doi:10.1016/j.jvolgeores.2014.08.009
Becerril, L. (2009). Volcanic hazard Approach and Their Effects on Coastal Areas in Canary Islands. Master Thesis book.ISBN: 978-84-694-0895-7
Becerril, L., Bartolini, S., Sobradelo, R., Martí, J., Morales, J. M., and Galindo, I. (2014). Long-term Volcanic hazard Assessment on El Hierro (Canary Islands). Nat. Hazards Earth Syst. Sci. 14, 1853–1870. doi:10.5194/nhess-14-1853-2014
Becerril, L., Martí, J., Bartolini, S., and Geyer, A. (2017). Assessing Qualitative Long-Term Volcanic Hazards at Lanzarote Island (Canary Islands). Nat. Hazards Earth Syst. Sci. 17, 1145–1157. doi:10.5194/nhess-17-1145-2017
Biass, S., and Bonadonna, C. (2013). A Fast GIS-Based Risk Assessment for Tephra Fallout: the Example of Cotopaxi Volcano, Ecuador. Nat. Hazards 65, 477–495. doi:10.1007/s11069-012-0378-z
Biass, S., Bonadonna, C., Connor, L., and Connor, C. (2016a). TephraProb: a Matlab Package for Probabilistic hazard Assessment of Tephra Fallout. J. Appl. Volcanol 5, 10. doi:10.1186/s13617-016-0050-5
Biass, S., Bonadonna, C., di Traglia, D., Pistolesi, M., Rosi, M., and Lastuzzi, P. (2016b). Probabilistic Evaluation of the Physical Impact of Future Tephra Fallout Events for the Island of Vulcano. Italy. Bull. Vulcanol 78, 37. doi:10.1007/ss0445-016-1028-1
Biass, S., Scaini, C., Bonadonna, C., Folch, A., Smith, K., and Höskuldsson, A. (2014). A Multi-Scale Risk Assessment for Tephra Fallout and Airborne Concentration from Multiple Icelandic Volcanoes - Part 1: Hazard Assessment. Nat. Hazards Earth Syst. Sci. 14, 2265–2287. doi:10.5194/nhess-14-2265-2014
Bonadonna, C., Connor, C., Houghton, B. F., Connor, L., Byrne, M., Laing, A., et al. (2005). Probabilistic Modeling of Tephra Dispersal: Hazard Assessment of a Multiphase Rhyolitic Eruption at Tarawera, New Zealand. J. Geophys. Res. 110. doi:10.1029/2003JB002896
Brendryen, J., Haflidason, H., and Sejrup, H. P. (2010). Norwegian Sea Tephrostratigraphy of marine Isotope Stages 4 and 5: Prospects and Problems for Tephrochronology in the North Atlantic Region. Quat. Sci. Rev. 29, 847–864. doi:10.1016/j.quascirev.2009.12.004
Cappello, A., Neri, M., Acocella, V., Gallo, G., Vicari, A., and Del Negro, C. (2012). Spatial Vent Opening Probability Map of Etna Volcano (Sicily, Italy). Bull. Volcanol 74, 2083–2094. doi:10.1007/s00445-012-0647-4
Connor, C. B., and Conway, F. M. (2000). “Basaltic Volcanic fields,” in Encyclopedia of Volcanoes. Editors H. Sigurdsson, B. F. Houghton, S. R. McNutt, H. Rymer, and J. Stix (Academic Press), 330–343.
Connor, L. J., Connor, C. B., Meliksetian, K., and Savov, I. (2012). Probabilistic Approach to Modeling Lava Flow Inundation: a Lava Flow hazard Assessment for a Nuclear Facility in Armenia. J. Appl. Volcanol 1, 1–19. doi:10.1186/2191-5040-1-3
Cromwell, G., Tauxe, L., Staudigel, H., Constable, C. G., Koppers, A. A. P., and Pedersen, R.-B. (2013). In Search of Long-Term Hemispheric Asymmetry in the Geomagnetic Field: Results from High Northern Latitudes. Geochem. Geophys. Geosyst. 14, 3234–3249. doi:10.1002/ggge.20174
Dzierma, Y., and Wehrmann, H. (2010). Eruption Time Series Statistically Examined: Probabilities of Future Eruptions at Villarrica and Llaima Volcanoes, Southern Volcanic Zone, Chile. J. Volcanology Geothermal Res. 193, 82–92. doi:10.1016/j.jvolgeores.2010.03.009
Edwards, B. R., Belousov, A., Belousova, M., and Melnikov, D. (2015). Observations on Lava, Snowpack and Their Interactions during the 2012-13 Tolbachik Eruption, Klyuchevskoy Group, Kamchatka, Russia. J. Volcanology Geothermal Res. 307, 107–119. doi:10.1016/j.jvolgeores.2015.08.010
Elkins, L. J., Hamelin, C., Blichert-Toft, J., Scott, S. R., Sims, K. W. W., Yeo, I. A., et al. (2016). North Atlantic Hotspot-ridge Interaction Near Jan Mayen Island. Geochem. Persp. Let. 2, 55–67. doi:10.7185/geochemlet.1606
Ewert, J. W., Guffanti, M., and Murray, T. L. (2005). An Assessment of Volcanic Threat and Monitoring Capabilities in the United States: Framework for a National Volcanic Early Warning System, NVEWS. US Geol. Sur. Open-file Rep. 1164, 1–62. doi:10.3133/ofr20051164
Fitch, F. J., Nairn, A. E. M., and Talbot, C. J. (1965). Paleomagnetic Studies on Rocks from North Jan Mayen. Nor. Polarinst. Aarb 1963, 49–60.
Fitch, F. J. (1964). The Development of the Beerenberg Volcano, Jan Mayen. Proc. Geologists' Assoc. 75, 133–IN9. doi:10.1016/s0016-7878(64)80002-x
Gjerløw, E., Haflidason, H., and Pedersen, R. B. (2016). Holocene Explosive Volcanism of the Jan Mayen (Island), Volcanic Province, North-Atlantic. J. Volcanol. Geotherm. Res. 321, 31–44. doi:10.1016/j.jvolgeores.2016.04.025
Gjerløw, E., Höskuldsson, A., and Pedersen, R. B. (2015). The 1732 Surtseyan Eruption of Eggøya, Jan Mayen, North-Atlantic: Deposits, Distribution, Chemistry and Chronology. Bull. Volcanol 77, 14. doi:10.1007/s00445-014-0895-6
Guffanti, M., Casadevall, T. J., and Wunderman, R. (2010). Encounters of Aircraft with Volcanic Ash Clouds: A Compilation of Known Incidents, 1953-2009, ver. 1.0, 12 p. US Geol. Surv. Data Ser. 545. (plus 4 appendixes including the compilation database). doi:10.3133/ds545
Höskuldsson, A., Óskarsson, N., Pedersen, R., Grönvold, K., Vogfjörd, K., and Ólafsdóttir, R. (2007). The Millennium Eruption of Hekla in February 2000. Bull. Volcanol. 70 (2), 169–182. doi:10.1007/s00445-007-0128-3
Imsland, P. (1978). The Geology of the Volcanic Island Jan Mayen, Arctic Ocean. Nordic Volcanol. Inst. Res. Rep. 78, 13.
Imsland, P. (1986). The Volcanic Eruption on Jan Mayen, January 1985: Interaction between a Volcanic Island and a Fracture Zone. J. Volcanology Geothermal Res. 28, 45–53. doi:10.1016/0377-0273(86)90004-1
Jakobsson, M., Mayer, L., Coakley, B., Dowdeswell, J. A., Forbes, S., Fridman, B., et al. (2012). The International Bathymetric Chart of the Arctic Ocean (IBCAO) Version 3.0. Geophys. Res. Lett. doi:10.1029/2012GL052219
Jiménez, D., Becerril, L., Bartolini, S., Escobar, D., and Martí, J. (2020). Making a Qualitative Volcanic-Hazards Map by Combining Simulated Scenarios: An Example for San Miguel Volcano (El Salvador). J. Volcanol. Geotherm. Res. 395, 106837. doi:10.1016/j.jvolgeores.2020.106837
Kalnay, E., Kanamitsu, M., Kistler, R., Collins, W., Deaven, D., Gandin, L., et al. (1996). The NCEP/NCAR 40-year Reanalysis Project. Bull. Amer. Meteorol. Soc. 77 (3), 437–471. doi:10.1175/1520-0477(1996)077<0437:tnyrp>2.0.co;2
Kinvig, H. S., Winson, A., and Gottsmann, J. (2010). Analysis of Volcanic Threat from Nisyros Island, Greece, with Implications for Aviation and Population Exposure. Nat. Hazards Earth Syst. Sci. 10, 1101–1113. doi:10.5194/nhess-10-1101-2010
Martí, J. (2017). Assessing Volcanic Hazard: A Review. Oxford Handbooks Online. Available at: http://www.oxfordhandbooks.com/view/10.1093/oxfordhb/9780190676889.001.0001/oxfordhb-9780190676889-e-32.
Martí, J., and Felpeto, A. (2010). Methodology for the Computation of Volcanic Susceptibility. J. Volcanology Geothermal Res. 195, 69–77. doi:10.1016/j.jvolgeores.2010.06.008
Martí, J., Sobradelo, R., Felpeto, A., and García, O. (2012). Eruptive Scenarios of Phonolitic Volcanism at Teide-Pico Viejo Volcanic Complex (Tenerife, Canary Islands). Bull. Volcanol 74, 767–782. doi:10.1007/s00445-011-0569-6
Mattox, T. N., and Mangan, M. T. (1997). Littoral Hydrovolcanic Explosions: a Case Study of Lava–Seawater Interaction at Kilauea Volcano. J. Volcanol. Geotherm. Res. 75, 1–17. doi:10.1016/s0377-0273(96)00048-0
Mossoux, S., Saey, M., Bartolini, S., Poppe, S., Canters, F., and Kervyn, M. (2016). Q-LAVHA: a Flexible GIS Plugin to Simulate Lava Flows. Comput. Geosciences 97, 98–109. doi:10.1016/j.cageo.2016.09.003
Neri, A., Aspinall, W. P., Cioni, R., Bertagnini, A., Baxter, P. J., Zuccaro, G., et al. (2008). Developing an Event Tree for Probabilistic hazard and Risk Assessment at Vesuvius. J. Volcanology Geothermal Res. 178, 397–415. doi:10.1016/j.jvolgeores.2008.05.014
Norwegian Polar Institute (2014). Terrengmodell Jan Mayen (J0 Terrengmodell) [Data Set]. Norwegian Polar Inst. doi:10.21334/npolar.2014.e2b2417e
Oddsson, B., Gudmundsson, M. T., Edwards, B. R., Thordarson, T., Magnússon, E., and Sigurðsson, G. (2016). Subglacial Lava Propagation, Ice Melting and Heat Transfer during Emplacement of an Intermediate Lava Flow in the 2010 Eyjafjallajökull Eruption. Bull. Volcanol 78, 48. doi:10.1007/s00445-016-1041-4
Paris, R., Coello Bravo, J. J., Bravo, J. J. C., González, M. E. M., Kelfoun, K., and Nauret, F. (2017). Explosive Eruption, Flank Collapse and Megatsunami at Tenerife Ca. 170 Ka. Nat. Commun. 8, 15246. doi:10.1038/ncomms15246
Plunkett, G., Sigl, M., Pilcher, J. R., McConnell, J. R., Chellman, N., Steffensen, J. P., et al. (2020). Smoking Guns and Volcanic Ash: the Importance of Sparse Tephras in Greenland Ice Cores. Polar Res. 39, 3511. doi:10.33265/polar.v39.3511
Sandri, L., Costa, A., Jacopo, S., Tonini, R., Macedonio, G., Folch, A., et al. (2016). Beyond Eruptive Scenarios: Assessing Tephra Fallout hazard from Neapolitan Volcanoes. Sci. Rep. 6, 24271. doi:10.1038/srep24271
Scaini, C., Biass, S., Galderisi, A., Bonadonna, C., Folch, A., Smith, K., et al. (2014). A Multi-Scale Risk Assessment for Tephra Fallout and Airborne Concentration from Multiple Icelandic Volcanoes - Part 2: Vulnerability and Impact. Nat. Hazards Earth Syst. Sci. 14, 2289–2312. doi:10.5194/nhess-14-2289-2014
Scoresby, W. (1820). An Account of the Arctic Regions, with a History and Description of the Northern Whale-Fishery. Edinburgh: A Constable & Co.
Selva, J., Costa, A., Marzocchi, W., and Sandri, L. (2010). Multiple Hazards and Paths to Eruptions: BET_VH: Exploring the Influence of Natural Uncertainties on Long-Term hazard from Tephra Fallout at Campi Flegrei (Italy). Bull. Volcanol. 72. doi:10.1007/s00445-010-0358-7
Sylvester, A. G. (1975). History and Surveillance of Volcanic Activity on. Jan Mayen Isl. Bull. Volcanol 39, 1–23. doi:10.1007/bf02597834
Thompson, M. A., Lindsay, J. M., and Gaillard, J. (2015). The Influence of Probabilistic Volcanic hazard Map Properties on hazard Communication. J. Appl. Volcanol. 4 (1). doi:10.1186/s13617-015-0023-0
Thorarinsson, S. (1981). Náttúra Íslands. 2nd ed., 81–119. Almenna bókafélagid, Reykjavík.Jardeldasvædi Á Núnatíma (Volcanic Areas of the Holocene)
Titos, M., Martínez Montesinos, B., Barsotti, S., Sandri, L., Folch, A., Mingari, L., et al. (2021). Assessing Potential Impact of Explosive Volcanic Eruptions from Jan Mayen Island (Norway) on Aviation in the North Atlantic, doi:10.5194/nhess-2021-264
Trønnes, R. G., Planke, S., Sundvoll, B., and Imsland, P. (1999). Recent Volcanic Rocks from Jan Mayen: Low-Degree Melt Fractions of Enriched Northeast Atlantic Mantle. J. Geophys. Res. 104, 7153–7716. doi:10.1029/1999jb900007
Keywords: volcanic hazard, eruptive scenarios, geohazard, hazard models, hazard assesment, volcano
Citation: Gjerløw E, Höskuldsson Á, Bartolini S, Biass S, Mossoux S, Gilbert J, Pedersen RB and Martí J (2022) The Volcanic Hazards of Jan Mayen Island (North-Atlantic). Front. Earth Sci. 10:730734. doi: 10.3389/feart.2022.730734
Received: 25 June 2021; Accepted: 15 February 2022;
Published: 04 March 2022.
Edited by:
Valerio Acocella, Roma Tre University, ItalyReviewed by:
Paul William Taylor, Independent researcher, East Maitland, AustraliaLaura Sandri, National Institute of Geophysics and Volcanology, Italy
Jocelyn McPhie, University of Tasmania, Australia
Copyright © 2022 Gjerløw, Höskuldsson, Bartolini, Biass, Mossoux, Gilbert, Pedersen and Martí. This is an open-access article distributed under the terms of the Creative Commons Attribution License (CC BY). The use, distribution or reproduction in other forums is permitted, provided the original author(s) and the copyright owner(s) are credited and that the original publication in this journal is cited, in accordance with accepted academic practice. No use, distribution or reproduction is permitted which does not comply with these terms.
*Correspondence: Eirik Gjerløw, RWlyaWsuR2plcmxvd0B1aXQubm8=