 Marco Maffione
 Emilio Herrero-Bervera
- 1School of Geography, Earth, and Environmental Sciences, University of Birmingham, Birmingham, United Kingdom
- 2Magnetic Materials and Paleomagnetic and Petrofabrics Laboratory, Hawaii Institute of Geophysics and Planetology, University of Hawaii at Manoa, Honolulu, HI, United States
The Corinth basin (Greece) is a young continental rift that recorded cyclic basin paleoenvironment variations (i.e., marine to lacustrine) caused by glacio-eustatic sea level fluctuations during its initial connection to the global oceans. The Corinth syn-rift sequence offers therefore a unique opportunity to determine the timing and modality of connection of young rifts to the global oceans, and investigate how sediment supply change during this extremely dynamic stage of their evolution. Here we use magnetostratigraphic and relative paleointensity (RPI) constraints from 885 discrete samples from International Ocean Discovery Program (IODP) Hole M0079A to generate an unprecedented high-resolution (∼15kyr) age model for the youngest part of the Corinth’s offshore syn-rift sequence. Our RPI-calibrated age model spans the last ∼850 kyr and reveals that initial connection of the Corinth basin to the Mediterranean Sea occurred at ∼530 ky, more recently than previously thought and after a short-lived marine incursion at ∼740 kyr. Accumulation rates calculated from our age model indicate two significant changes in sediment supply at 530 (from 74 to 156 cm/kyr on average) and 70 ka (from 156 to 258 cm/kyr on average), interpreted as due to increased local fault activity in the southern margin of the Corinth basin. Sedimentation rates also display a short-term variation indicating a lower sediment supply (98 cm/kyr on average) during interglacial periods and a higher input (156 cm/kyr on average) during glacial periods. We conclude that long-term variations of sediment supply in young rifts connecting to the global oceans are predominantly controlled by local tectonics (i.e., new depocenters formation), while short-term variations may be driven by global climate (i.e., increased erosion aided by fewer vegetation during glacial periods). Grain size of the Corinth syn-rift sequence shows a weak correlation with glacial cycles too (i.e., coarser sediments during interglacials), but we suggest this to be controlled by the hydrodynamics of the basin (i.e., stronger bottom currents when the basin was connected to the Mediterranean Sea during interglacial periods).
Introduction
The sedimentary archive of young rift basins may hold the key to understand the role of tectonics and climate during the early stage of rift evolution when the basin first connects to the global oceans. However, the scarcity of continuous, intact, and accessible syn-rift sequences has so far limited our understanding of rifting processes and the stratigraphic signature of young rifts. How and over which time interval do young rift basins connect to global ocean circulation? How does climate affect basin paleoenvironment during initial rifting? How do sedimentation rates and grain size change and why? These are only few of the questions that have been addressed so far (e.g., McNeill et al., 2019a; Pechlivanidou et al., 2019; Cullen et al., 2021), but that still require further investigation.
From October to December 2017 International Ocean Discovery Program (IODP) Expedition 381 drilled the uppermost (∼800 m) part of the offshore syn-rift sedimentary sequence of the Corinth rift basin at four holes from the central and eastern part of the Gulf of Corinth (McNeill et al., 2019b) (Figure 1), providing a unique continuous and intact sedimentary archive to study the evolution of this young rift basin in high detail. The study of these cores, presented by (McNeill et al. 2019a; 2019b) revealed that the initial connection of the Corinth basin to the global oceans was preceded by several marine incursions controlled by eustatic sea level fluctuation during glacial-interglacial cycles. This caused a cyclic shift in basin paleoenvironment from marine to lacustrine, which in turn affected sediment supply (i.e., higher sedimentation rates during lacustrine/lowstand periods, and lower sedimentation rates during marine/highstand periods), and lithology (McNeill et al. 2019a; 2019b). Higher sediment supply during glacials has also been documented from the onshore syn-rift sequence at the southern margin of the Corinth basin by Cullen et al. (2021). It is worth noting, however, that the response of landscape and basin to climate change (i.e., glacials to interglacials) may have been controlled by the local interaction and feedbacks between tectonics, drainage physiography, and the rate and nature of land vegetation variability (e.g., Pechlivanidou et al., 2018; Cullen et al., 2021).
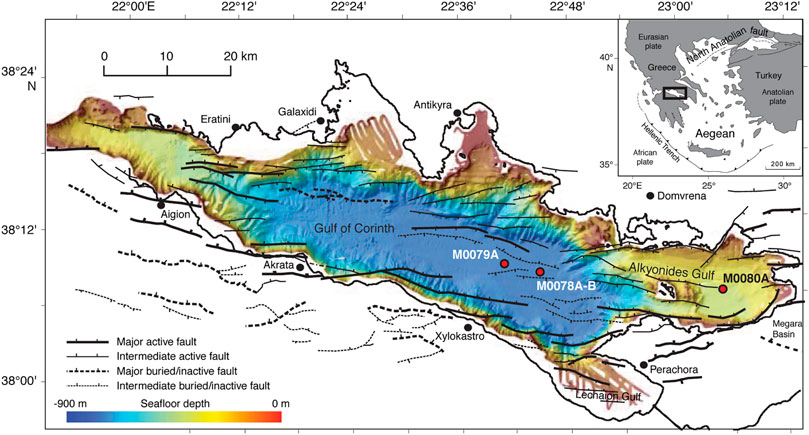
FIGURE 1. Bathymetric and tectonic map of the Gulf of Corinth showing the location of the holes (red dots) drilled by IODP Expedition 381.
Dating this unique syn-rift sequence can therefore reveal the age and duration of the marine incursions during the initial connection of the Corinth basin to the Mediterranean Sea, and determine at a higher resolution how sediment supply (i.e., sedimentation rates) changed across marine and lacustrine intervals. A preliminary age model was proposed by McNeill et al. (2019a) by linking the observed paleoenvironment transitions in the cored sediments to the sea level curve of Spratt and Lisiecki (2016). However, besides its relatively low resolution (∼70 kyr), this preliminary age model does not constrain the lower part of the recovered sequence below 534 mbsf, where only one preliminary magnetostratigraphic datum is available (McNeill et al. 2019a; 2019b).
In this study we have carried out an extensive paleomagnetic, rock magnetic, and relative paleointensity (RPI) study of the uppermost syn-rift sedimentary sequence recovered offshore by IODP Expedition 381 to refine the preliminary data by McNeill et al. (2019a) and generate an unprecedented high-resolution (∼15 kyr) age model for the uppermost offshore sequence of the Corinth basin. Our new ages and magnetic results are then used to accurately date the initial connection of the Corinth basin to the global oceans, and establish at a higher resolution how sediment supply and magnetic grain size vary across glacial-interglacial cycles.
Geological Setting
The Corinth rift is an active E-W-striking basin produced by tectonic extension at the southern margin of the European plate started in the Oligocene–Miocene as a consequence of a southward retreat of the Hellenic trench (e.g., van Hinsbergen et al., 2020). Since the late Pliocene–early Pleistocene, N–S extension at a rate of 10–15 mm/yr localized in southern Greece along a ∼100 km long by ∼40 km wide area corresponding to the current Corinth rift (e.g., Briole et al., 2000; Bernard et al., 2006; Ford et al., 2013; Gawthorpe et al., 2018). Corinth rifting begun at ∼5 Ma, and developed through three distinct phases that have been identified by combining onshore and offshore stratigraphy. The initial Pliocene phase (5–3 Ma) was characterized by widespread extension and continental sedimentation varying from alluvial fans in the west to lakes in the east (Ford et al., 2007, 2013; Gawthorpe et al., 2017; Hemelsdaël et al., 2017). Between 3.0 and 1.8 Ma deformation migrated to the north and localized along north- and south-dipping normal faults, which created multiple deeper depocenters operating a different times (Bell et al., 2009; Ford et al., 2013, 2017; Nixon et al., 2016). During the most recent tectonic phase started around 0.6 Ma, deformation migrated further north and localized along growing and coalescing north-dipping faults at the current southern margin of the Gulf of Corinth, inducing regional southward tilt of the basin and creating a single, wider depocenter in the central part of the gulf (Bell et al., 2009; Taylor et al., 2011; Nixon et al., 2016). During this phase, basin paleoenvironment evolved from terrestrial to lacustrine to alternating lacustrine-marine when the basin was sufficiently deep to allow first marine ingression during highstand/interglacial periods McNeill et al. (2019a), McNeill et al. (2019b). Connection of the Corinth basin to the east Mediterranean occurred through the Corinth Isthmus when sea level was higher than the structural barrier represented by the Rion sill, currently located at −60 m depth.
IODP Hole M0079A
The focus of this study is Hole M0079A (38°9′30.243″N, 22°41′43.316″E), which is located in the central Gulf of Corinth (Figure 1) at a water depth of 857.1 m. This hole penetrated down to 704.90 m below sea floor (mbsf), and yielded 163 cores for a total length of 610.8 m of recovered sediments (McNeill et al., 2019b). Advanced piston coring (APC) was used down to 149.10 mbsf, and was subsequently replaced by Fugro Extended Marine Core Barrel (FXMCB) rotary coring down to the bottom of the hole. The intensity and types of drilling-induced deformation (i.e., biscuiting, arching, and shear fractures) vary downhole, with shear fracturing and biscuiting being the prominent deformation below ∼300 mbsf. Bedding is horizontal to sub-horizontal, with dips increasing slightly downhole (McNeill et al., 2019b).
Based on a combination of the component facies associations (FA), paleontology, seismic facies, and physical properties, the recovered sequence at Hole M0079A was divided into an upper unit (Unit 1; 0–677.23 mbsf) characterized by an alternation of homogeneous and thinly bedded sediments, approximately corresponding to Seismic Unit 2, and a lower unit (Unit 2; 677.23–704.90 mbsf) consisting of a weakly laminated to homogeneous, highly bioturbated mud nearly devoid of marine and terrestrial microfossils, and corresponding to Seismic Unit 1 McNeill et al. (2019a). Nixon et al. (2016) tentatively dated the base of Seismic Unit 2 to ∼0.6 Ma.
Micropaleontological assemblages (i.e., calcareous nannofossils, foraminifera, and diatoms) allowed the identification of 16 subunits within Unit 1 represented by alternating marine (even numbers) and lacustrine, or isolated/semi-isolated (odd numbers) intervals (McNeill et al., 2019b). Marine subunits consist of bioturbated homogeneous to poorly bedded muds with predominant marine microfossils; isolated/semi-isolated subunits show no or sparse bioturbation, a marked lamination, sparse organic-rich levels, and predominant nonmarine or mixed species (McNeill et al., 2019b). The alternation of marine and isolated subunits in lithostratigraphic Unit 1 has been interpreted as due to a punctuated connection of the Corinth rift basin to the Mediterranean during glacio-eustatic sea level fluctuations (McNeill et al., 2019b).
Sampling and Methods
During the onshore science party conducted in Bremen in February 2018 we sampled 885 oriented cubic specimens from the working half sections of Hole M0079A. Cubic samples were collected with standard 8 cm3 plastic cubes at a variable spacing of 30–80 cm. Samples were stored in refrigerated rooms initially at the MARUM core repository of Bremen, and subsequently at the University of Hawaii at Manoa. The low-field (300 A/m) magnetic susceptibility (k) was measured using an AGICO KLY2 kappabridge (at MARUM) and an AGICO MFK1-FA kappabridge (at the University of Hawaii) and imposing a nominal volume of 8 cm3. An average susceptibility for the empty plastic cube was calculated by measuring 10 cubes (-8.1 × 10⁻⁶ SI) and then subtracting this value from the bulk susceptibility of the samples to calculate net susceptibility values.
To analyze the magnetic mineralogy of the studied samples we measured the thermal dependence of the magnetic susceptibility during heating-cooling cycles on eight representative samples spaced downhole by ∼100 m, and imparted a stepwise isothermal remanent magnetization (IRM) on nine representative samples from various marine and isolated sub-units of Hole M0079A. The thermomagnetic experiments were conducted in air from room temperature to 700°C using an MFK1-FA Kappabridge coupled with a CS4 apparatus. IRM was imparted with an ASC IM-30 impulse magnetizer in 20–30 magnetizing steps from 5 to 1,000 mT. The IRM acquisition curves were then analyzed using Max Unmix software (Maxbauer et al., 2016) to separate the different coercivity fractions (Kruiver et al., 2001; Heslop et al., 2002).
The natural remanent magnetization (NRM) of all cubic samples was measured and then stepwise demagnetized with a pass-through DC-SQUID 755 cryogenic magnetometer (University of Bremen) using 13 alternating field (AF) steps from 5 to 100 mT. Characteristic remanent magnetization (ChRM) directions were isolated using a standard principal component analysis (Kirschvink, 1980) with PuffinPlot software (Lurcock and Wilson, 2012). A total of 541 samples were then imparted an anhysteretic remanent magnetization (ARM) through a 50 μT DC field and 70 mT AF with a 3-axis tumbling Schoendstedt apparatus, and then measured with the 2G cryogenic magnetometer. Subsequently an IRM to 1 T was imparted on the same set of samples using an ASC IM-10 impulse magnetizer, and then measured with an AGICO JR5 spinner magnetometer (University of Hawaii) due to the high intensity of the magnetization, which was typically beyond the sensitivity of the cryogenic. A lower number of specimens were subjected to ARM and IRM measurements (541 out of 885) because 344 samples were lost during shipping; for the lost samples we only have the NRM and susceptibility measured during the sampling party in Bremen.
To test for the occurrence of greigite in the studied samples, which is critical to assess the quality of the relative paleointensity record used in this study, we employed the method by Fu et al. (2008) on 536 discrete samples using the demagnetization data. Greigite (Fe3S4) is an authigenic meta-stable ferromagnetic iron-sulfide mineral commonly found in association with magnetite in organic-rich muds deposited in high-accumulation environments and anoxic basins (e.g., Roberts, 1995; Sagnotti and Winkler, 1999). The method devised by Fu et al. (2008) relies on the tendency of greigite-bearing sediments to acquire a gyroremanent magnetization (GRM; Stephenson, 1980) during AF demagnetization. This method uses the initial NRM intensity (II), the final remanence intensity at the highest AF demagnetization step (FI), and the minimum remanence intensity across all the AF steps (MI). A greigite concentration proxy is defined as ΔGRM/ΔNRM, which is calculated as follows:
Results
In the next section we show the main results from the magnetic mineralogy experiments (thermomagnetic curves, IRM coercivity unmixing, and greigite concentration), magnetic grain size analyses (ARM/k, ARM/IRM, median destructive field), and paleomagnetic and relative paleointensity analyses.
Magnetic Mineralogy
All thermomagnetic experiments (Supplementary Figure S1) show irreversible paths, with susceptibility values of the cooling trends higher than the heating ones. This indicates the formation of new magnetite upon heating under oxidizing conditions (in fact no argon was used for the experiments). We interpreted the peak in magnetic susceptibility between ∼370 and ∼580°C from the heating path as due to newly formed magnetite resulting from the breakdown of pyrite (e.g., Passier et al., 2001). Beyond ∼580°C (i.e., the Curie temperature of pure magnetite; Dunlop and Özdemir, 2001) susceptibility progressively decreases at a slower rate up to 700°C without showing any sharp variation. All heating curves show a gentle, hyperbolic decrease in susceptibility from room temperature to approximately 350°C (i.e., Curie-Weiss Law; Tarling and Hrouda, 1993) due to the contribution of the paramagnetic fraction.
Using the graphical method of Petrovský and Kapička (2006), we identified consistent Curie temperatures of 580–600°C in all eight samples, indicating the occurrence of nearly pure magnetite, and 500–510°C in one sample (381-M0079A-137R-CC) indicating the occurrence of titanomagnetite. Sample 381-M0079A-115R-CC also shows a drop in susceptibility between ∼280 and ∼400°C, which may be related to the breakdown of greigite (Roberts, 1995).
We observed no systematic variation in the Curie temperatures between marine (odd numbers) and isolated/semi-isolated (even numbers) subunits, suggesting a relatively homogeneous magnetic mineralogy throughout Hole M0079A.
IRM acquisitions in nine representative samples (three from marine and six from lacustrine intervals) show that saturation is reached between 250 and 350 mT (Supplementary Figure S2), consistent with the occurrence of a soft (i.e., low coercivity) fraction, likely represented by (titano)magnetite. The coercivity unmixing analysis, which gave statistically meaningful results only at six samples, shows the existence of a single coercivity fraction characterized by coercivity distributions of 1.62–1.94 mT (Supplementary Figure S3), consistent with low-to high-coercivity magnetofossils, and/or high-coercivity detrital magnetite (Egli, 2004).
The downhole variation of ΔGRM/ΔNRM ratio at Hole M0079A calculated using the method by Fu et al. (2008) ranges between 0 (no greigite) and 31.75 (Figure 2A). We set ΔGRM/ΔNRM = 0.3 as a threshold above which greigite concentration becomes appreciable. Based on this threshold, we visually identified five broad intervals within Hole M0079A at 1.5–2.0, 25–45, 90–150, 440–520, 550–600, and 660–702 mbsf (Figure 2A) where greigite may be present in significant concentration. The boundaries of these five intervals are not sharp and should only be taken as a first-order indication of the broader intervals where greigite is more abundant. In fact, several ΔGRM/ΔNRM spikes outside these five intervals indicate that authigenic growth of greigite also occurs at several other discrete, thinner intervals throughout the sequence. The deepest interval (forming the lower part of subunit 1–16 and the entire Unit 2) shows ΔGRM/ΔNRM values abundantly above 0.5, suggesting a high concentration of greigite.
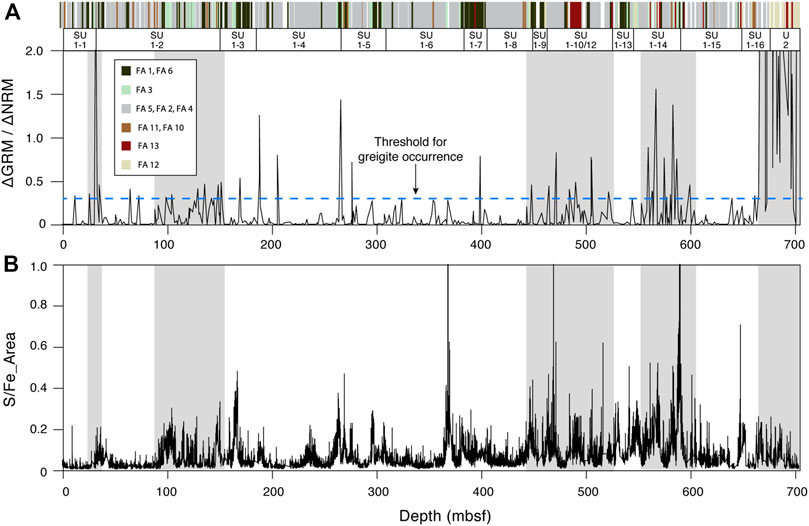
FIGURE 2. Greigite concentration proxies. (A) ΔGRM/ΔNRM ratio calculated using approach by Fu et al. (2008). The vertical axis has been expanded to appreciate smaller variations in greigite concentration (data falling outside the plot have values up to 31.75). Colored log above the plot is the distribution of the facies associations (FA) identified at Hole M0079A (see McNeill et al., 2019b for FA keys). Subunit (SU) and unit (U) name according to McNeill et al., 2019b are indicated, where odd numbers are the marine/interglacial intervals, and even number are the isolated/glacial intervals. Gray shaded areas are the intervals showing higher concentration of greigite (i.e., ΔGRM/ΔNRM >0.3); (B) Sulfur/Iron ratio (S/Fe) based on XRF data from Hole M0079A (McNeill et al., 2019b).
To test the reliability of the ΔGRM/ΔNRM dataset as proxy for greigite concentration we also plotted the S/Fe ratio using the publicly available XRF data acquired during shipboard operations (IODP Expedition 381 Scientists, 2020) (Figure 2B). Higher values of the S/Fe ratio, indicating higher concentration of sulfur and hence possibly of greigite, are observed in correspondence of all five intervals with high ΔGRM/ΔNRM values, including other minor peaks outside these broad intervals. These five greigite-bearing intervals do not seem to correspond to specific facies associations (FA; see Figure 2A) or paleoenvironmental conditions (i.e., isolated vs marine periods), implying that the authigenic growth of greigite was not controlled by the original mineralogical assemblage, nor by climate-driven changes in basin paleoenvironment, but perhaps by more localized chemical processes. It is worth noting that while our analyses confirmed the occurrence of greigite at Hole M0079A, precise concentrations of this mineral could not be determined.
Magnetic Grain Size
One of the quality criteria for RPI studies is that grain size of the magnetic carriers should be relatively uniform and in the 1–15 μm range (King et al., 1983). A qualitative assessment of the grain size of the ferromagnetic fraction is commonly obtained from magnetic parameters that are grain size dependent, such as k, ARM, and IRM (e.g., Banerjee et al., 1981). Because these parameters are also concentration dependent, a broadly used magnetic grain size proxy is provided by their ratio (ARM/k and ARM/IRM). The ARM/k and ARM/IRM scattergrams from Hole M0079A (Figures 3A,B) describe broad linear trends indicating a fairly consistent grain size of the ferromagnetic fraction (e.g., Channell et al., 1997). Sixteen outliers were identified within these two datasets (green dots) and removed from further analysis. More in detail, the ARM/IRM plot (Figure 3B) shows that while the isolated/semi-isolated intervals show a better-defined linear distribution (i.e., r2 = 0.54) consistent with a smaller variability in magnetic grain size, the marine intervals show a less-defined linear distribution (i.e., r2 = 0.41) indicating a slightly broader range of magnetic grain sizes. This is supported by the ARM/k plot (Figure 3A) where the data from the marine and isolated/semi-isolated intervals form two distinct linear trends with slightly different slopes.
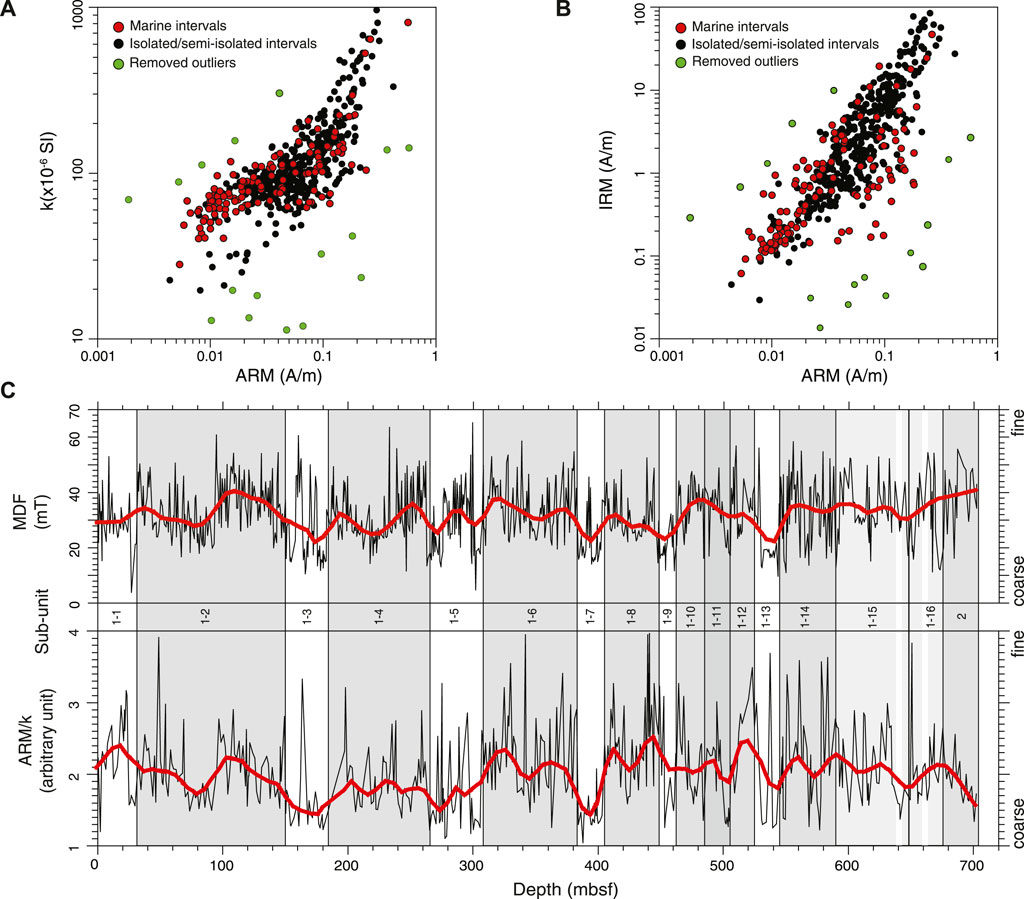
FIGURE 3. (A) Anhysteretic remanent magnetization (ARM) versus magnetic susceptibility (k); (B) ARM versus isothermal remanent magnetization (IRM); (C) downhole variation of the medium destructive field (MDF) (upper plot) and ARM/k ratio (lower plot). High (low) peaks correspond to fine (coarse) magnetic grains. Original MDF and ARM/k data points connected by lines in both plots are interpolated by a weighted average with 5% smoothing factor (thick lines). White and gray shaded areas correspond to marine/interglacial and isolated/glacial intervals, respectively. Light gray shaded area for subunit 1–15 and 1–16 indicate indeterminate paleoenvironment.
As additional magnetic grain size proxy we used the median destructive field (MDF), which is the value of the peak AF necessary to reduce the magnetic remanence to half of its initial value. A mean MDF value of 31.6 mT (st. dev. = 10.7 mT) is compatible with the occurrence of pseudo-single-domain (PSD) to stable single-domain (SSD) magnetite (e.g., Dunlop and Özdemir, 2001; Maffione et al., 2014), which is broadly within the 1–15 μm range indicated by King et al. (1983). The downhole fluctuation of the MDF nicely mimics that of the ARM/k ratio (see Figure 3C), hence altogether providing a robust magnetic grain size proxy for Hole M0079A.
In summary, the magnetic grain size proxies from Hole M0079A indicate that: 1) despite small fluctuations, grain size of the magnetic fraction is rather homogenous throughout this hole and within the acceptable range for reliable RPI data; and 2) marine intervals seem to be dominated by slightly coarser ferromagnetic grains than the isolated/semi-isolated intervals. While the magnetic granulometry does not necessarily reflect the overall grain size of the sediment, which is mainly composed of non-magnetic minerals, it can still provide a first-order approximation of its variability (rather than the absolute values).
Paleomagnetic Directions and Magnetostratigraphy
The magnetic remanence of the studied samples was successfully removed with AF demagnetization method (Supplementary Figure S4), indicating the occurrence of a low-coercivity (soft) fraction like (titano)magnetite, as also confirmed by the rock magnetic experiments. About 10% of the analyzed samples showed the acquisition of a GRM at AF above 50–60 mT (Supplementary Figure S5), confirming the occurrence of greigite in addition to (titano)magnetite. The predominantly linear shape of the remanence decay during AF demagnetization (Supplementary Figure S4) is consistent with the presence of SSD to PSD grains, as also indicated by the MDF values.
ChRM components, with maximum angular deviation (MAD) values generally below 5° were isolated between approximately 20 and 60 mT, with secondary viscous components removed at 15–20 mT (Supplementary Figure S5). Only eight samples out of 885 did not show a stable or interpretable remanence. Stereographic projections of the NRM and ChRM directions (Supplementary Figure S6) show a random distribution of the declinations, explained by the absence of azimuthal control on the recovered IODP cores, but well-clustered inclinations ranging approximately between 40° and 70°. The few steeper directions are likely caused by a partial or complete drilling overprint (typically vertical), and are notably fewer in the ChRM plot, confirming that the drilling overprint was removed at 15–20 mT in most samples.
A calculated mean ChRM inclination of 59.9° based on the maximum likelihood method for inclination-only data by Arason and Levi (2010) is consistent, within error, with the expected inclination at the sampling site (i.e., 57.5°), suggesting that the direction of the geomagnetic field has been reliably recorded at this site.
The downhole distribution of the ChRM inclinations at Hole M0079A (Figure 4) shows an uppermost interval (0–666.54 mbsf) characterized by mainly positive inclinations (i.e., normal polarity). Between 666.54 mbsf and the bottom of the hole inclinations are predominantly negative (i.e., reverse polarity), with several samples showing a positive inclination. Within the upper normal polarity magnetozone, six samples carry a reverse polarity and additional six samples show anomalously low (positive) inclinations below 30° (Figure 4). Three of these 12 samples (at 112.55, 200.77, and 595.13 mbsf) are from intervals characterized by pervasive drilling mud injections and drilling-induced deformation, and were therefore discarded from further analysis.
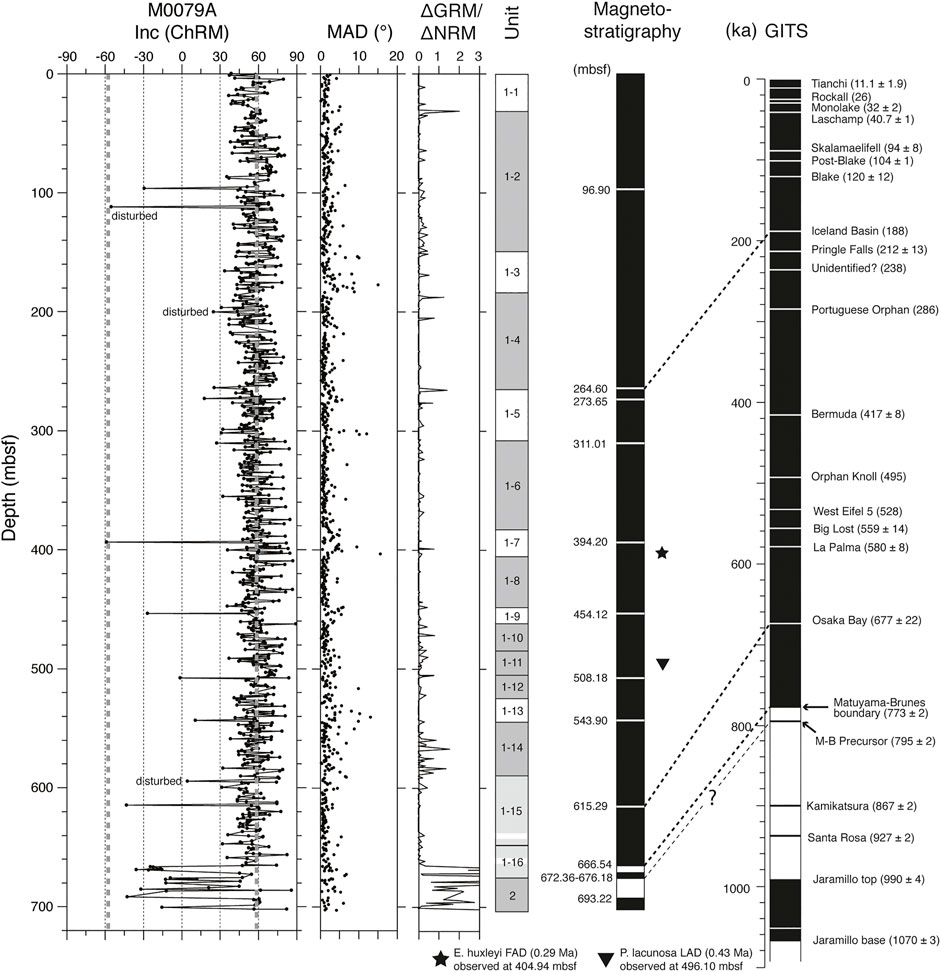
FIGURE 4. From left to right: ChRM inclinations; maximum angular deviation (MAD) values (Kirschvink, 1980); ΔGRM/ΔNRM values as greigite concentration proxy (Fu et al., 2008); unit and subunit distribution according to McNeill et al. 2019b; magnetostratigraphy of Hole M0079A; and the geomagnetic instability time scale (GITS; Singer, 2014). Excursions in the GITS are from Channell et al. (2020), with ages in ka in brackets. Gray thick dotted lines in the ChRM inclination plot are the expected inclinations for both normal and reverse polarity at the sampling locality (i.e., 57.5°). Grey shaded areas in the unit log are the isolated/semi-isolated glacial intervals. Light grey intervals (SU 1–15 and 1–16) are undefined (likely isolated) intervals. FAD = first appearance datum. LAD = last appearance datum. Correlations (thin dotted lines) between the magnetostratigraphy of Hole M0079A and the GITS are shown.
Relative Paleointensity
Sedimentary rocks have been frequently used to reconstruct the variation of the geomagnetic field intensity in the geological past through measurement of their relative paleointensity (RPI) (e.g., Tauxe, 1993; Valet and Meynadier, 1993; Tauxe et al., 1995; Guyodo and Valet, 1999; Laj et al., 2000; Stoner et al., 2002; Channell et al., 2009). RPI proxies are commonly obtained by normalizing the NRM by concentration-dependent magnetic parameters, such as volume magnetic susceptibility (k), ARM, and IRM. These normalizers activate the same grain fraction that carries the NRM and thereby compensate for changes in concentration of these grains.
ARM, IRM, and k at Hole M0079A vary downhole by two to three orders of magnitude without showing a systematic trend (Figure 5A). The downhole variation of these magnetic parameters reflect a change in concentration of the ferromagnetic minerals that is within a permissible range that satisfies one of the reliability criteria for RPI studies (King et al., 1983; Tauxe, 1993). The k, NRM, ARM, and IRM values (Figure 5B) are broadly within the typical ranges of marine clay-rich sediments (e.g., Channell et al., 1997, 2016), and their overall straight trend suggests a relatively homogeneous magnetic mineralogy at Hole M0079A. Greigite does not seem to affect these four magnetic parameters either, as we did not observe any systematic change in correspondence of the five greigite-bearing intervals (Figure 2, Figure 5A). So, we conclude that greigite, where present, only occurs in very small concentration, not affecting the magnetic record of these sediments.
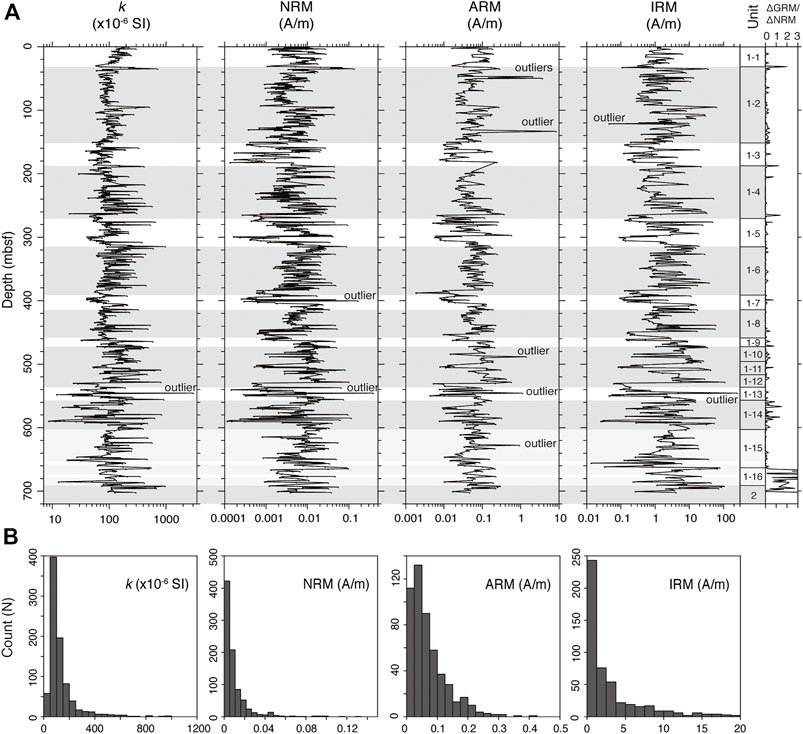
FIGURE 5. (A) Downhole variation of (from left to right) magnetic susceptibility (k), NRM, AIR, and IRM. Values are in logarithmic scale to better appreciate the fluctuation of the four parameters. Outliers showing anomalously high values are indicated. Lithostratigraphic column is shown on the right, together with the ΔGRM/ΔNRM values indicating the concentration of greigite. White and gray shaded areas correspond to marine and isolated intervals, respectively. (B) Frequency distribution of the four magnetic parameters in (a). Note that the tails of the ARM and IRM plots have been cut for visual reasons.
Eleven outliers were identified visually across the four plots in Figure 5A and discarded from further analysis. The origin for these outliers might be related to alteration, oxidation, instrumental or human error during measurements, or the occurrence of large multidomain magnetite grains, which makes these samples unsuitable for RPI studies. Additionally, we removed 16 outliers identified from the ARM/IRM and ARM/k plots of Figure 3, as samples potentially carrying anomalous magnetic grain size not suitable for paleointensity analysis (i.e., too fine or too large). After removing these 25 samples, we plotted the three RPI proxies (NRM/k, NRM/ARM, and NRM/IRM) versus depth (Supplementary Figure S7). To improve the signal-to-noise ratio, and remove the effect of other unidentified outliers carried by anomalous magnetic mineralogy or grain size, we calculated a 3-point centered moving average from each dataset and plotted it as a smoothed curve over the original data.
All the three RPI proxies are broadly comparable, although the NRM/k and NRM/ARM datasets are the two that show the best match (Figure 6), with the NRM/IRM curve showing several discrepancies from the other two ratios. Between them we chose the NRM/k as our representative RPI for Hole M0079A due to its higher resolution (848 samples against the 541 from the NRM/ARM dataset). To exclude the potential contribution of the largest multidomain grains to the paleointensity signal, we computed a new RPI (which we used for further analysis) using the NRM after demagnetization at 25 mT normalized by the magnetic susceptibility (i.e., NRM25/k). Because the secondary (viscous) component was typically removed at 15–20 mT (Supplementary Figure S3) a remanence intensity after 25 mT demagnetization should not carry the contribution of the largest MD grains.
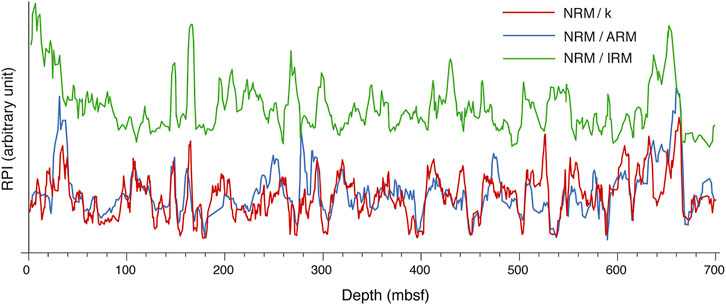
FIGURE 6. Comparison between the three RPI proxies (NRM/k, NRM/ARM, NRM/IRM) plotted versus depth.
Discussion
In this section we discuss our results from Hole M0079A by first assessing the quality of our RPI dataset, then presenting the interpreted magnetostratigraphy and the resulting age model based on this and the RPI data, and then interpreting the sedimentation rates and magnetic grain size. Finally we briefly discuss the magnetic excursions identified at Hole M0079A.
RPI Quality Assessment
IRM coercivity unmixing and demagnetization results show that SSD to PSD (titano) magnetite are the main magnetic carriers at Hole M0079A. Secondary authigenic greigite is also present in small concentrations at five discrete intervals throughout Hole M0079A (Figure 2), but this does not affect significantly the reliability of the magnetic record. So, we can consider satisfied the first RPI quality criteria requiring a consistent magnetic carrier (King et al., 1983; Tauxe, 1993). Grain size of the magnetic fraction is relatively constant throughout the studied sequence, with minor fluctuations across marine (coarser) and isolate/semi-isolated (finer) intervals, but with average size probably within the 1–15 μm limit required by the second RPI quality criteria (King et al., 1983; Tauxe, 1993). Finally, the relative concentration of the magnetic carriers is fairly homogenous throughout Hole M0079A, and this satisfies the third RPI quality criteria.
To test for the potential effect of greigite occurrence and grain size variability on the calculated RPI proxies, we performed a correlation test using PAST software (Hammer et al., 2001) between each of the RPI proxies (NRM/k, NRM/ARM, and NRM/IRM) and the grain size proxy (ARM/k), as well as between the NRM/k RPI proxy and the greigite concentration proxy (GRM/NRM). The results of our analysis (Supplementary Figure S8) shows extremely low correlations, confirming that both greigite occurrence and grain size variability do not affect the calculated RPI at Hole M0079A. We therefore conclude that our analysis provided a reliable RPI record for Hole M0079A.
Magnetostratigraphy of Site M0079A
Our proposed magnetostratigraphy for Hole M0079A (Figure 4) contains a major polarity transition at 666.54 mbsf, which we interpreted as the Matuyama-Brunhes boundary (MBB) occurring at 773 ka (e.g., Singer, 2014; Channell et al., 2020). This interpretation is consistent with (yet not confirmed by) the calcareous nannofossil assemblage, which shows the first appearance datum (FAD) of Emiliana huxlei (290 ka) at 404.94 mbsf, and the last appearance datum (LAD) of Pseudoemiliana lacunosa (430 ka) at 496.10 mbsf (Figure 4; McNeill et al., 2019b).
Although predominantly negative, the inclinations below 666.54 mbsf are quite variable (Figure 4), pointing out to a complex Matuyama-Brunhes transition characterized by the existence of multiple rapid polarity swings, a feature that has been documented by several authors (e.g., Oda et al., 2000; Channell et al., 2004; Lund et al., 2006; Yang et al., 2010; Channell, 2017). This is a further proof that this polarity transition is the true MBB. Specifically, the inclination pattern observed below 666.54 mbsf strongly resembles that associated with the Matuyama-Brunhes precursor (Hartl and Tauxe, 1996) occurring at 794 ka (Channell et al., 2010; Valet et al., 2014; Channell, 2017). However, this signal occurs just at the bottom of the hole, and further data from deeper intervals of the sequence should be necessary to confirm the existence of the Matuyama-Brunhes precursor.
As additional proof for the reliability of the MBB at 666.54 mbsf, we exclude any potential effect of the authigenic growth of greigite: while the reverse polarities below 666.54 mbsf cannot be produced by a more recent (i.e., within the Brunhes Chron) chemical remagnetization, as they would otherwise be normal, we also found no evidence for remagnetization of the normal polarity interval just above 666.54 mbsf, where greigite is actually absent (Figure 3).
Besides this specific interval, the occurrence of greigite in other parts of the hole does not seem to affect the ChRM directions, which in fact do not show any particular variation in correspondence of the identified greigite-bearing intervals (Figure 4). Hence, we conclude that the occurrence of greigite at Hole M0079A is in such small quantity that it does not affect the direction of the remanence.
A High-Resolution RPI-Based Age Model for the Offshore Corinth Syn-rift Sequence
An age model for Hole M0079A was initially generated by McNeill et al. (2019a) by tying the subunit boundaries within Unit 1 (i.e., marine to isolated/semi-isolated intervals) to the sea level curve of Spratt and Lisiecki (2016), and assuming a constant 60 m depth of the Rion sill in the Isthmus of Corinth. This preliminary sea-level-calibrated (SLC) age model extends down to 545 mbsf (subunit 1–13), where the first clear marine interval was identified. We combined the 11 age-depth points from the SLC age model with the additional tie point from our magnetostratigraphy (i.e., 666.54 mbsf = 0.773 Ma) to produce a new preliminary SLC age model for Hole M0079A (Supplementary Table S1). We then recalculated the ages of our samples using the new SLC age model, and plotted the RPI data from Hole M0079A versus this updated ages (Figure 7). By doing so, we were able to compare more easily our RPI signal from Hole M0079A to the PISO-1500 RPI by Channell et al. (2009), and identify matching peaks. For our correlation we visually searched for matching peaks within each subunit, as we assumed the SLC age model to be a sufficiently good approximation of the age of the sediments. Another main criterion for our correlation was to keep sedimentation rate constant within each subunit, where we expect the sedimentary conditions to stay relatively uniform. Finally, we only matched peaks that could clearly be correlated across the two curves, such as those showing extremely high of low paleointensity.
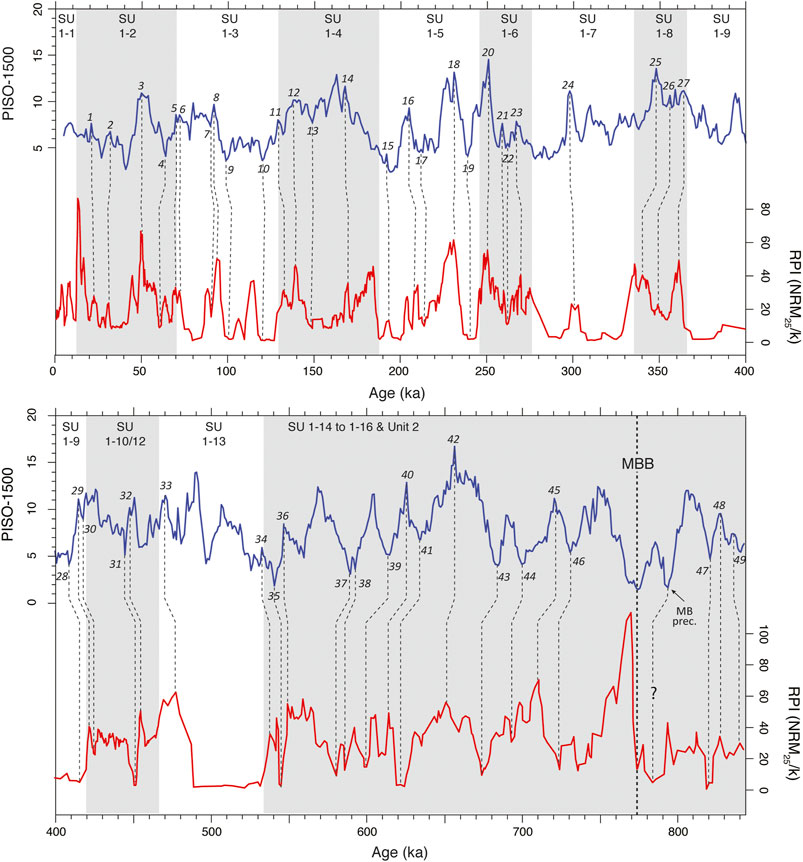
FIGURE 7. RPI (NRM25/k) for Hole M0079A (red line) compared to the PISO-1500 relative paleointensity curve (blue line) by Channell et al. (2009). Numbers next to the PISO-1500 curve (1–49) indicate the peaks that have been correlated. MBB = Matuyama-Brunhes boundary; MB prec. = Matuyama-Brunhes precursor; White and gray shaded areas are the marine and isolated intervals, respectively. The distribution of the units and subunits is indicated at the top of each plot. The age of the RPI data is based on the sea level-calibrated age model of McNeill et al., 2019a. Subunits 1–14, 1–15, 1–16, and Unit 2 are combined in this plot, as the relative boundaries were not used for the age definition of this interval.
By comparing our RPI curve from Hole M0079A with the PISO-1500 we identified 49 matching peaks (Figure 7; Supplementary Table S2). The Matuyama-Brunhes transition at 773 ka nicely occurs at a paleointensity minimum in our RPI record, and is consistent with a coeval paleointensity low in the PISO-1500 RPI. Some mismatches between the RPI at Hole M0079A and the PISO-1500 RPI, including the paleointensity peak immediately above the MBB (Figure 7), may be related to either local variations of the geomagnetic field intensity, or anomalous variation of the sedimentation rate in specific intervals of Hole M0079A.
A final RPI-calibrated age model was then generated based on 50 age-depth tie points (Figure 8; Supplementary Table S2). Such a high-resolution age model can be instrumental to date critical geological events recorded at Hole M0079A. For instance, the boundary between Unit 1 and Unit 2 (677.23 mbsf), which is thought to mark critical tectonic and paleoenvironmental changes in the Corinth rift basin (Nixon et al., 2016; McNeill et al., 2019a), can now be dated to 0.79 Ma, which is nearly 200 ka older than previously thought (Nixon et al., 2016). More importantly, results from IODP Expedition 381 have shown that the first clear marine assemblage at Hole M0079A occurs in subunit 1–13 (McNeill et al., 2019a). Using our RPI-calibrated age model, we can now date the base of subunit 1–13 and therefore, for the first time the initial connection of the Corinth basin to global ocean circulation to 0.53 Ma. A thin interval at the base of subunit 1–15 containing marine assemblages has been interpreted as the possible product of earliest short-lived marine incursion in the Corinth basin (McNeill et al., 2019a). We can now date this early marine ingression to 0.74 Ma, which is nearly 200 kyr before the connection of the Corinth basin to the Mediterranean Sea.
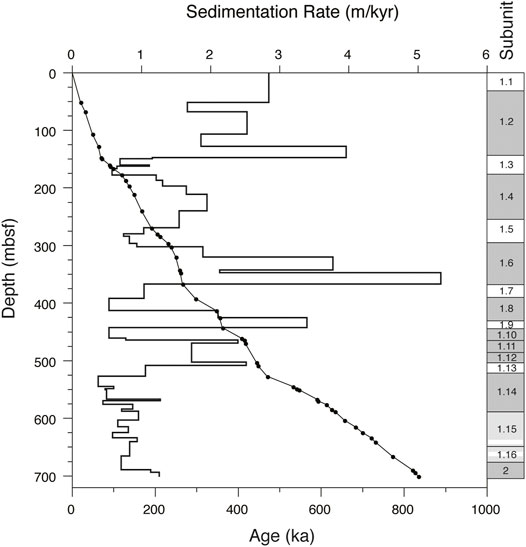
FIGURE 8. Combined plot showing the RPI-calibrated age model (black dots connected by a line) for Hole M0079A and the calculated sedimentation rates (continuous black line). Lithostratigraphic units are shown on the right.
Sedimentation Rates of the Corinth Syn-rift Sequence and Paleoenvironmental Implications
Precise dating of the Corinth syn-rift sequence offers a unique opportunity to determine how sediment supply changed across the cyclic transitions from marine to lake environments during the initial connection of the rift basin to the global oceans. We calculated sedimentation rates at Hole M0079A (Figure 8; Supplementary Table S2) using our RPI-calibrated age model, and then corrected these values to account for the compaction of the sediments following the approach used by McNeill et al. (2019a). Decompaction analysis was performed by first applying a second-order polynomial best fit on the porosity values obtained from the moisture and density measurements on discrete samples (Supplementary Table S3). We rejected data yielding residuals higher than 1.5, and then fit a 35th-order polynomial to the remaining points. The polynomial porosity function was then used to calculate the decompacted thickness (TD) at a given depth interval using the equation:
where Ti is the measured thickness of a given interval, ϕi is the porosity obtained from the porosity function, and
The compaction-corrected sedimentation rates at Hole M0079A vary by one order of magnitude, from ∼0.5 to ∼5 m/kyr (Figure 8; Supplementary Table S2). As previously observed by McNeill et al. (2019a), we identified a systematic downhole fluctuation, with generally higher sedimentation rates in isolated/glacial intervals, and lower sedimentation rates in marine/interglacial intervals. Higher sediment supply during glacials (and lower during interglacials) is a feature observed in both the offshore (McNeill et al., 2019b; this study) and onshore (Cullen et al., 2021) parts of the Corinth syn-rift sequence, but also elsewhere at the Ohrid and Baikal lakes (Watanabe et al., 2009; Baumgarten et al., 2015). It has been demonstrated that sediment supply in active rifts or lakes can be controlled by the interplay and mutual feedback of global (e.g., glaciations, tectonics) and local (e.g., fault activity, land vegetation cover, rain intensity, drainage physiography) factors (e.g., Pechlivanidou et al., 2018, 2019; Cullen et al., 2021). Nevertheless, the most likely and simple explanation for the increased sediment productivity during glacial periods in the Corinth basin is the reduction of land vegetation cover and consequent enhancement of superficial erosion and sediment productivity.
Another feature of the sedimentation rates at Hole M0079A is the occurrence of two sharp increases observed at the bases of subunits 1–13 (from 74 to 156 cm/kyr) and subunit 1–2 (from 156 to 258 cm/kyr) (Figure 8; Supplementary Table S2). According to McNeill et al. (2019a), subunit 1–13 is the first true marine interval of Hole M0079A marking initial marine ingression in the Corinth rift basin. An increase in sedimentation rate since the connection of the Corinth basin to the Mediterranean Sea may be explained for the marine intervals by a larger volume of sediments carried by the Mediterranean Sea, but cannot explain the higher sedimentation rates in the isolated intervals deposited afterwards. A more likely explanation is that the increase of sediment supply at ∼530 ka (i.e., the base of subunit 1–13) had a tectonic control. As shown by Pechlivanidou et al. (2019), long-term variations in time and space of sediment supply in the Corinth basin was controlled by the activity of basin-bounding faults. According to their model, extension along faults bounding the southern edge of the basin caused uplift and tilt of the footwall, inducing a migration of the source area of the sediments from the southern (footwall) to the northern (hanging wall) side of the basin. Following this model, we propose that at ∼530 ka site M0079 begun to form the locus of a new depocenter as a consequence of the increased tectonic activity along the faults in the southern edge of the central Corinth basin. Our hypothesis is supported by Nixon et al. (2016), who show that the faults in the southern edge of the basin started to become more active around 620 ka, creating a larger and deeper depocenter in the central Corinth basin.
The second, more recent increase in sediment supply is observed at 70 ka (i.e., base of subunit 1–2; Figure 8; Supplementary Table S2), and may again be explained by a further increase in local tectonic activity at the southern edge of the Corinth basin. The threefold higher sedimentation rates in the last marine interval compared to the older marine intervals may instead be explained by anthropogenic forest clearance as agriculture developed in that area during the Holocene, as previously suggested by various authors (McNeill et al., 2019a; Cullen et al., 2021).
Magnetic Grain Size Variation Across Glacials/Interglacials
Our magnetic grain size calculations indicate that there is a weak, yet systematic correlation between magnetic granulometry and paleoenvironment, with coarser magnetic particles in the interglacial/marine subunits, and finer in the glacial/isolated intervals (Figure 3). While the grain size of the magnetic fraction does not necessarily mirror the physical grain size of the non-magnetic fraction, we assume that the variation of the magnetic grain size provides a reasonable first-order approximation of how the average grain size of the Corinth sediments vary downhole. The occurrence of finer sediments in glacial intervals seems counterintuitive, as enhanced erosion and a closer location of sourcing river mouths relative to Hole M0079A during low-standing sea level periods should result in coarser sediments. However, a similar correlation has previously been documented from other lakes or enclosed basin around the world, where glacial intervals show a systematic finer grain size (Meyers et al., 1993; Asikainen et al., 2007; Francke et al., 2013; Yao et al., 2014).
The causes for this grain size variability across glacial cycles may be multiple, including river transport capability (e.g., Meyers et al., 1993; Joussain et al., 2016), or the strength of bottom currents (Gröger et al., 2003). We don’t have enough evidence to constrain a precise driving mechanism for the grain size variation observed in the studied rocks of the Corinth basin; yet, we speculate that this might be related to the intensity of bottom currents: during highstand/interglacial periods the Corinth basin was connected to the Mediterranean Sea, and bottom currents may have been stronger and therefore able to transport coarser sediments to Site M0079; during lowstand/glacial periods the Corinth basin was a lake with reduced (or even absent) bottom currents which were able to transport only the finest particles to the center of the basin. Additional and more accurate analyses will be needed to confirm this hypothesis.
Magnetic Excursions
As a subsidiary part of this study, which is not strictly relevant to the age model and its implications presented so far, we would like to discuss the nature of the anomalous remanence directions observed within the Brunhes Chron (Figure 4), and test whether these represent magnetic excursions.
Magnetic excursions are short-lived variations of the geomagnetic field identified in the geological archive by aberrant remanence directions outside the typical range of secular variation, and paleointensity minima (e.g., Channell et al., 2020). Due to the high frequency of magnetic excursions and the delay in recording a detrital remanent magnetization (DRM) by sediments, the directional variability of excursions in deep-sea core sediments is not always observed (e.g., Channell et al., 2020). This mainly depends on the sedimentation rates, where rates below 10 cm/kyr tend to smooth out the directional variability of the excursions.
Because sedimentation rates at Hole M0079A are significantly above 10 cm/kyr (Figure 8), we expect potential magnetic excursions here to show both paleointensity minima and directional variability of the remanence. The upper normal polarity magnetozone (0–666.54 mbsf), which we interpreted as the Brunhes Chron, contains nine single samples showing either a reverse polarity, or an anomalously low inclination compared with the expected value at the site latitude (Figure 4). To test whether these nine samples represent magnetic excursions we checked both their age and paleointensity against the known excursions from the Brunhes Chron (Singer, 2014; Channell et al., 2020; Liu et al., 2020). To this aim we plotted the nine potential excursions on our RPI for Hole M0079A with the ages recalibrated against the PISO-1500 (Supplementary Figure S9).
Six out of the nine samples with anomalous inclinations display paleointensity minima (Supplementary Figure S9), with the remaining three samples (96.90, 311.01, and 508.12 mbsf) showing an intermediate to high paleointensity not compatible with a magnetic excursion. When the calculated ages of the remaining six anomalous samples are compared against the known excursions within the Brunhes (Singer, 2014; Channell et al., 2020; Liu et al., 2020), only two of these (264.60 and 615.29 mbsf) match exactly the age of the Iceland Basin (188 ka; Channell, 2014) and Osaka Bay (677 ± 22 ka; Michalk et al., 2013) excursions. We conclude that only these two excursions have been reliably recorded at Hole M0079A (Figure 4 and Supplementary Figure S9). The Iceland Basin and Osaka Bay excursions have been documented to have a reverse polarity (Channell, 2014; Michalk et al., 2013), but at Hole M0079A only the Osaka Bay excursion yields a reverse polarity, while the inferred Iceland Basin excursion shows an anomalously low positive inclination (Figure 4).
The remaining four samples showing directional variability and a paleointensity minimum (273.65, 394.20 and 454.12, and 543.90 mbsf; Figure 4) do not seem to correspond to any of the known excursions (Supplementary Figure S9). We did not consider the age constraints from the Iceland Basin and Osaka Bay excursions for our age model at Hole M0079A, as they would have not increased its resolution. We rather consider the occurrence of these two excursions as a further confirmation of the good quality of our RPI analysis and related age model.
Conclusion
We carried out a paleomagnetic, rock magnetic, and relative paleointensity (RPI) study of the off-shore Corinth syn-rift sequence recovered at IODP Hole M0079A in the central Gulf of Corinth. Primary remanence carried by mainly SSD to PSD (titano)magnetite provided a reliable magnetostratigraphy of Hole M0079A showing the Matuyama-Brunhes boundary (773 ka) at 666.54 mbsf, and the Iceland Basin (188 ka) and Osaka Bay (677 ± 22 ka) excursions at 264.60 and 615.29 mbsf, respectively. Correlation between our RPI for Hole M0079A and the reference PISO-1500 RPI curve enabled us to generate a high-resolution (∼15 kyr) RPI-calibrated age model for Hole M0079A. Our new age model reveals that initial connection of the Corinth rift to the global oceans occurred at 530 ka after a short-lived marine incursion at 740 ka. Since then, the Corinth rift was repeatedly connected to and disconnected from the Mediterranean Sea during glacio-eustatic sea level fluctuations relative to the structural barrier represented by the Rion sill. Our results indicate that during this phase, finer and more abundant sediments were supplied to the Corinth basin during glacial periods when it was disconnected from the Mediterranean; during interglacials, when the basin was connected to global ocean circulation, sedimentation rate was lower but the grain size coarser. We interpret the short-term variability in sedimentation rate to have a climatic control (e.g., sparser vegetation during colder glacial periods may have enhanced erosion and therefore sediment supply), while the variability in grain size may have been related to the intensity of bottom currents in the rift basin (i.e., stronger currents when the basin was connected to the Mediterranean Sea during interglacials may have been able to transport coarser grains over longer distance). We also observed a long-term variability of the sedimentation rates, indicating sediment supply increasing significantly at two distinct times at 530 (from 74 to 156 cm/ky) and 70 (from 156 to 258 cm/kyr) ka. We propose that these two increases in sediment supply are the result of a new depocenter forming and then deepening in the central Corinth basin as a consequence of an increased activity of the faults in the southern edge of the basin. The increase in sediment productivity during the latest marine interval is instead likely linked to deforestation and agriculture by first human settlements in this area during the Holocene.
Data Availability Statement
The original data to produce the magnetostratigraphy, the RPI, and all other plots are provided at https://doi.org/10.6084/m9.figshare.16821937.v1.
Author Contributions
MM was responsible for conceptualization, data curation, data analysis, and writing of the paper. EH-B was responsible for conceptualization, laboratory analysis, and review of the paper.
Funding
MM acknowledges funding from NERC Moratorium Award n. NE/R013942/1 and Marie Sklodovska-Curie Individual Fellowship n. 894395. EH-B was supported by SOEST-HIGP of the University of Hawaii at Manoa as well an USAC-IODP grant.
Conflict of Interest
The authors declare that the research was conducted in the absence of any commercial or financial relationships that could be construed as a potential conflict of interest.
Publisher’s Note
All claims expressed in this article are solely those of the authors and do not necessarily represent those of their affiliated organizations, or those of the publisher, the editors and the reviewers. Any product that may be evaluated in this article, or claim that may be made by its manufacturer, is not guaranteed or endorsed by the publisher.
Acknowledgments
We thank all involved with the successful completion of IODP Expedition 381, including ECORD Science Operator staff, ship and drilling crew of the D/V Fugro Synergy, and the co-chief scientists Lisa McNeill and Donna Schillington. We are also grateful to Thomas Frederichs and Liane Brük for their support during paleomagnetic analyses in Bremen, and Ursula Röhl, Holger Kuhlmann, and Alex Wülbers for their guidance during the sampling. MM acknowledges funding from NERC Moratorium Award n. NE/R013942/1 and Marie Sklodovska-Curie Individual Fellowship n. 894395. EHB was supported by SOEST-HIGP of the University of Hawaii at Manoa as well an USAC-IODP grant. We thank the Editor J. C. Larrasoaña, and reviewers P. Calvín and L. Iovane for their critical and useful review of the original manuscript.
Supplementary Material
The Supplementary Material for this article can be found online at: https://www.frontiersin.org/articles/10.3389/feart.2022.813958/full#supplementary-material
References
Arason, P., and Levi, S. (2010). Maximum Likelihood Solution for Inclination-Only Data in Paleomagnetism. Geophys. J. Int. 182, 753–771. doi:10.1111/j.1365-246x.2010.04671.x
Asikainen, C. A., Francus, P., and Brigham-Grette, J. (2007). Sedimentology, clay Mineralogy and Grain-Size as Indicators of 65 Ka of Climate Change from El’gygytgyn Crater Lake, Northeastern Siberia. J. Paleolimnology 37 (1), 105–122.
Banerjee, S. K., King, J., and Marvin, J. (1981). A Rapid Method for Magnetic Granulometry with Applications to Environmental Studies. Geophys. Res. Lett. 8, 333–336. doi:10.1029/gl008i004p00333
Baumgarten, H., Wonik, T., Tanner, D. C., Francke, A., Wagner, B., Zanchetta, G., et al. (2015). Age-depth Model of the Past 630 Kyr for Lake Ohrid (FYROM/Albania) Based on Cyclostratigraphic Analysis of Downhole Gamma ray Data. Biogeosciences 12 (24), 7453–7465. doi:10.5194/bg-12-7453-2015
Bell, R. E., McNeill, L. C., Bull, J. M., Henstock, T. J., Collier, R. E. L., and Leeder, M. R. (2009). Fault Architecture, basin Structure and Evolution of the Gulf of Corinth Rift, central Greece. Basin Res. 21, 824–855. doi:10.1111/j.1365-2117.2009.00401.x
Bernard, P., Lyon-Caen, H., Briole, P., Deschamps, A., Boudin, F., Makropoulos, K., et al. (2006). Seismicity, Deformation and Seismic hazard in the Western Rift of Corinth: New Insights from the Corinth Rift Laboratory (CRL). Tectonophysics 426, 7–30. doi:10.1016/j.tecto.2006.02.012
Briole, P., Rigo, A., Lyon-Caen, H., Ruegg, J. C., Papazissi, K., Mitsakaki, C., et al. (2000). Active Deformation of the Corinth Rift, Greece: Results from Repeated Global Positioning System Surveys between 1990 and 1995. J. Geophys. Res. 105, 25605–25625. doi:10.1029/2000jb900148
Channell, J. E. T. (2017). Complexity in Matuyama-Brunhes Polarity Transitions from North Atlantic IODP/ODP Deep-Sea Sites. Earth Planet. Sci. Lett. 467, 43–56. doi:10.1016/j.epsl.2017.03.019
Channell, J. E. T., Curtis, J. H., and Flower, B. P. (2004). The Matuyama-Brunhes Boundary Interval (500-900 Ka) in North Atlantic Drift Sediments. Geophys. J. Int. 158, 489–505. doi:10.1111/j.1365-246x.2004.02329.x
Channell, J. E. T., Hodell, D. A., and Curtis, J. H. (2016). Relative Paleointensity (RPI) and Oxygen Isotope Stratigraphy at IODP Site U1308: North Atlantic RPI Stack for 1.2-2.2 Ma (NARPI-2200) and Age of the Olduvai Subchron. Quat. Sci. Rev. 131, 1–19. doi:10.1016/j.quascirev.2015.10.011
Channell, J. E. T., Hodell, D. A., and Lehman, B. (1997). Relative Geomagnetic Paleointensity and δ18O at ODP Site 983 (Gardar Drift, North Atlantic) since 350 Ka. Earth Planet. Sci. Lett. 153, 103–118. doi:10.1016/s0012-821x(97)00164-7
Channell, J. E. T., Hodell, D. A., Singer, B. S., and Xuan, C. (2010). Reconciling Astrochronological and40Ar/39Ar Ages for the Matuyama-Brunhes Boundary and Late Matuyama Chron. Geochem. Geophys. Geosyst. 11, a–n. doi:10.1029/2010GC003203
Channell, J. E. T., Singer, B. S., and Jicha, B. R. (2020). Timing of Quaternary Geomagnetic Reversals and Excursions in Volcanic and Sedimentary Archives. Quat. Sci. Rev. 228, 106114. doi:10.1016/j.quascirev.2019.106114
Channell, J. E. T. (2014). The Iceland Basin Excursion: Age, Duration, and Excursion Field Geometry. Geochem. Geophys. Geosyst. 15, 4920–4935. doi:10.1002/2014gc005564
Channell, J. E. T., Xuan, C., and Hodell, D. A. (2009). Stacking Paleointensity and Oxygen Isotope Data for the Last 1.5 Myr (PISO-1500). Earth Planet. Sci. Lett. 283, 14–23. doi:10.1016/j.epsl.2009.03.012
Cullen, T. M., Collier, R. E. L., Hodgson, D. M., Gawthorpe, R., Kouli, K., Maffione, M., et al. (2021). Deep-Water Syn-rift Stratigraphy as Archives of Early-Mid Pleistocene Palaeoenvironmental Signals and Controls on Sediment Delivery. Front. Earth Sci. 9, 715304. doi:10.3389/feart.2021.715304
Dunlop, D. J., and Özdemir, Ö. (2001). Rock Magnetism: Fundamentals and Frontiers (No. 3). Cambridge University Press, 573.
Egli, R. (2004). Characterization of Individual Rock Magnetic Components by Analysis of Remanence Curves, 1. Unmixing Natural Sediments. Studia geophysica et geodaetica 48 (2), 391–446. doi:10.1023/b:sgeg.0000020839.45304.6d
Ford, M., Hemelsdaël, R., Mancini, M., and Palyvos, N. (2017). Rift Migration and Lateral Propagation: Evolution of normal Faults and Sediment-Routing Systems of the Western Corinth Rift (Greece). Geol. Soc. Lond. Spec. Publications 439 (1), 131–168. doi:10.1144/sp439.15
Ford, M., Le Carlier de Veslud, C., and Bourgeois, O. (2007). Kinematic and Geometric Analysis of Fault-Related Folds in a Rift Setting: The Dannemarie basin, Upper Rhine Graben, France. J. Struct. Geology. 29, 1811–1830. doi:10.1016/j.jsg.2007.08.001
Ford, M., Rohais, S., Williams, E. A., Bourlange, S., Jousselin, D., Backert, N., et al. (2013). Tectono-sedimentary Evolution of the Western Corinth Rift (Central Greece). Basin Res. 25, 3–25. doi:10.1111/j.1365-2117.2012.00550.x
Francke, A., Wennrich, V., Sauerbrey, M., Juschus, O., Melles, M., and Brigham-Grette, J. (2013). Multivariate Statistic and Time Series Analyses of Grain-Size Data in Quaternary Sediments of Lake El'gygytgyn, NE Russia. Clim. Past 9 (6), 2459–2470. doi:10.5194/cp-9-2459-2013
Fu, Y., von Dobeneck, T., Franke, C., Heslop, D., and Kasten, S. (2008). Rock Magnetic Identification and Geochemical Process Models of Greigite Formation in Quaternary marine Sediments from the Gulf of Mexico (IODP Hole U1319A). Earth Planet. Sci. Lett. 275, 233–245. doi:10.1016/j.epsl.2008.07.034
Gawthorpe, R. L., Andrews, J. E., Collier, R. E. L., Ford, M., Henstra, G. A., Kranis, H., et al. (2017). Building up or Out? Disparate Sequence Architectures along an Active Rift Margin-Corinth Rift, Greece. Geology 45, 1111–1114. doi:10.1130/g39660.1
Gawthorpe, R. L., Leeder, M. R., Kranis, H., Skourtsos, E., Andrews, J. E., Henstra, G. A., et al. (2018). Tectono-sedimentary Evolution of the Plio-Pleistocene Corinth Rift, Greece. Basin Res. 30 (3), 448–479. doi:10.1111/bre.12260
Gröger, M., Henrich, R., and Bickert, T. (2003). Glacial–interglacial Variability in Lower North Atlantic Deep Water: Inference from silt Grain-Size Analysis and Carbonate Preservation in the Western Equatorial Atlantic. Mar. Geology. 201 (4), 321–332.
Guyodo, Y., and Valet, J.-P. (1999). Global Changes in Intensity of the Earth's Magnetic Field during the Past 800 Kyr. Nature 399, 249–252. doi:10.1038/20420
Hammer, Ø., Harper, D. A., and Ryan, P. D. (2001). PAST: Paleontological Statistics Software Package for Education and Data Analysis. Palaeontol. electronica 4 (1), 9.
Hartl, P., and Tauxe, L. (1996). A Precursor to the Matuyama/Brunhes Transition-Field Instability as Recorded in Pelagic Sediments. Earth Planet. Sci. Lett. 138, 121–135. doi:10.1016/0012-821x(95)00231-z
Hemelsdaël, R., Ford, M., Malartre, F., and Gawthorpe, R. (2017). Interaction of an Antecedent Fluvial System with Early normal Fault Growth: Implications for Syn-Rift Stratigraphy, Western Corinth Rift (Greece). Sedimentology 64, 1957–1997.
Heslop, D., Dekkers, M. J., Kruiver, P. P., and van Oorschot, I. H. M. (2002). Analysis of Isothermal Remanent Magnetization Acquisition Curves Using the Expectation-Maximization Algorithm. Geophys. J. Int. 148 (1), 58–64. doi:10.1046/j.0956-540x.2001.01558.x
IODP Expedition 381 Scientists (2020). X-Ray Fluorescence (XRF) Scanning Results (10kV Run) of IODP Hole 381-M0079A. PANGAEA. doi:10.1594/PANGAEA.914489
Joussain, R., Colin, C., Liu, Z., Meynadier, L., Fournier, L., Fauquembergue, K., et al. (2016). Climatic Control of Sediment Transport from the Himalayas to the Proximal NE Bengal Fan during the Last Glacial-Interglacial Cycle. Quat. Sci. Rev. 148, 1–16. doi:10.1016/j.quascirev.2016.06.016
King, J. W., Banerjee, S. K., and Marvin, J. (1983). A New Rock-Magnetic Approach to Selecting Sediments for Geomagnetic Paleointensity Studies: Application to Paleointensity for the Last 4000 Years. J. Geophys. Res. 88, 5911–5921. doi:10.1029/jb088ib07p05911
Kirschvink, J. L. (1980). The Least-Squares Line and Plane and the Analysis of Palaeomagnetic Data. Geophys. J. Int. 62, 699–718. doi:10.1111/j.1365-246x.1980.tb02601.x
Kruiver, P. P., Dekkers, M. J., and Heslop, D. (2001). Quantification of Magnetic Coercivity Components by the Analysis of Acquisition Curves of Isothermal Remanent Magnetisation. Earth Planet. Sci. Lett. 189 (3), 269–276. doi:10.1016/s0012-821x(01)00367-3
La j, C., Kissel, C., Mazaud, A., Channell, J. E. T., and Beer, J. (2000). North Atlantic Palaeointensity Stack since 75ka (NAPIS-75) and the Duration of the Laschamp Event. Philos. Trans. R. Soc. Lond. Ser. A: Math. Phys. Eng. Sci. 358, 1009–1025. doi:10.1098/rsta.2000.0571
Liu, J., Nowaczyk, N. R., Panovska, S., Korte, M., and Arz, H. W. (2020). The Norwegian‐Greenland Sea, the Laschamps, and the Mono Lake Excursions Recorded in a Black Sea Sedimentary Sequence Spanning from 68.9 to 14.5 Ka. JGR Solid Earth 125. doi:10.1029/2019JB019225
Lund, S., Stoner, J. S., Channell, J. E. T., and Acton, G. (2006). A Summary of Brunhes Paleomagnetic Field Variability Recorded in Ocean Drilling Program Cores. Phys. Earth Planet. Interiors 156, 194–204. doi:10.1016/j.pepi.2005.10.009
Lurcock, P. C., and Wilson, G. S. (2012). PuffinPlot: A Versatile, User-Friendly Program for Paleomagnetic Analysis. Geochem. Geophys. Geosyst. 13, a–n. doi:10.1029/2012GC004098
Maffione, M., Morris, A., Plümper, O., and Van Hinsbergen, D. J. J. (2014). Magnetic Properties of Variably Serpentinized Peridotites and Their Implication for the Evolution of Oceanic Core Complexes. Geochem. Geophys. Geosyst. 15 (4), 923–944. doi:10.1002/2013gc004993
Maxbauer, D. P., Feinberg, J. M., and Fox, D. L. (2016). MAX UnMix: A Web Application for Unmixing Magnetic Coercivity Distributions. Comput. Geosciences 95, 140–145. doi:10.1016/j.cageo.2016.07.009
McNeill, L. C., Shillington, D. J., Carter, G. D. O., Everest, J. D., Gawthorpe, R. L., Miller, C., et al. (2019a). High-resolution Record Reveals Climate-Driven Environmental and Sedimentary Changes in an Active Rift. Sci. Rep. 9, 3116. doi:10.1038/s41598-019-40022-w
McNeill, L. C., Shillington, D. J., and Carter, G. D. O. (2019b). “Expedition 381 Participants, . Corinth Active Rift Development,” in Proceedings of the International Ocean Discovery Program (College Station, TX: International Ocean Discovery Program), 381. org/10.14379/iodp.proc.381.2019.
Meyers, P. A., Takemura, K., and Horie, S. (1993). Reinterpretation of Late Quaternary Sediment Chronology of Lake Biwa, Japan, from Correlation with marine Glacial-Interglacial Cycles. Quat. Res. 39 (2), 154–162. doi:10.1006/qres.1993.1019
Nixon, C. W., McNeill, L. C., Bull, J. M., Bell, R. E., Gawthorpe, R. L., Henstock, T. J., et al. (2016). Rapid Spatiotemporal Variations in Rift Structure during Development of the Corinth Rift, central Greece. Tectonics 35, 1225–1248. doi:10.1002/2015tc004026
Oda, H., Shibuya, H., and Hsu, V. (2000). Palaeomagnetic Records of the Brunhes/Matuyama Polarity Transition from ODP Leg 124 (Celebes and Sulu Seas). Geophys. J. Int. 142, 319–338. doi:10.1046/j.1365-246x.2000.00130.x
Passier, H. F., De Lange, G. J., and Dekkers, M. J. (2001). Magnetic Properties and Geochemistry of the Active Oxidation Front and the Youngest Sapropel in the Eastern Mediterranean Sea. Geophys. J. Int. 145, 604–614. doi:10.1046/j.0956-540x.2001.01394.x
Pechlivanidou, S., Cowie, P. A., Duclaux, G., Nixon, C. W., Gawthorpe, R. L., and Salles, T. (2019). Tipping the Balance: Shifts in Sediment Production in an Active Rift Setting. Geology 47 (3), 259–262. doi:10.1130/g45589.1
Pechlivanidou, S., Cowie, P. A., Hannisdal, B., Whittaker, A. C., Gawthorpe, R. L., Pennos, C., et al. (2018). Source-to-sink Analysis in an Active Extensional Setting: Holocene Erosion and Deposition in the Sperchios Rift, central Greece. Basin Res. 30 (3), 522–543. doi:10.1111/bre.12263
Petrovský, E., and Kapička, A. (2006). On Determination of the Curie point from Thermomagnetic Curves. J. Geophys. Res. 111 (B12), a–n. doi:10.1029/2006JB004507
Roberts, A. P. (1995). Magnetic Properties of Sedimentary Greigite (Fe3S4). Earth Planet. Sci. Lett. 134, 227–236. doi:10.1016/0012-821x(95)00131-u
Sachpazi, M., Clément, C., Laigle, M., Hirn, A., and Roussos, N. (2003). Rift Structure, Evolution, and Earthquakes in the Gulf of Corinth, from Reflection Seismic Images. Earth Planet. Sci. Lett. 216, 243–257. doi:10.1016/s0012-821x(03)00503-x
Sagnotti, L., and Winkler, A. (1999). Rock Magnetism and Palaeomagnetism of Greigite-Bearing Mudstones in the Italian peninsula. Earth Planet. Sci. Lett. 165, 67–80. doi:10.1016/s0012-821x(98)00248-9
Singer, B. S. (2014). A Quaternary Geomagnetic Instability Time Scale. Quat. Geochronol. 21, 29–52. doi:10.1016/j.quageo.2013.10.003
Spratt, R. M., and Lisiecki, L. E. (2016). A Late Pleistocene Sea Level Stack. Clim. Past 12, 1079–1092. doi:10.5194/cp-12-1079-2016
Stephenson, A. (1980). A Gyroremanent Magnetisation in Anisotropic Magnetic Material. Nature 284, 49–51. doi:10.1038/284049a0
Stoner, J. S., Laj, C., Channell, J. E. T., and Kissel, C. (2002). South Atlantic and North Atlantic Geomagnetic Paleointensity Stacks (0-80ka): Implications for Inter-hemispheric Correlation. Quat. Sci. Rev. 21, 1141–1151. doi:10.1016/s0277-3791(01)00136-6
Tarling, D., and Hrouda, F. (1993). Magnetic Anisotropy of Rocks. Springer Science & Business Media, 217.
Tauxe, L., Pick, T., and Kok, Y. S. (1995). Relative Paleointensity in Sediments: A Pseudo-thellier Approach. Geophys. Res. Lett. 22, 2885–2888. doi:10.1029/95gl03166
Tauxe, L. (1993). Sedimentary Records of Relative Paleointensity of the Geomagnetic Field: Theory and Practice. Rev. Geophys. 31, 319–354. doi:10.1029/93rg01771
Taylor, B., Weiss, J. R., Goodliffe, A. M., Sachpazi, M., Laigle, M., and Hirn, A. (2011). The Structures, Stratigraphy and Evolution of the Gulf of Corinth Rift, Greece. Geophys. J. Int. 185, 1189–1219. doi:10.1111/j.1365-246x.2011.05014.x
Valet, J.-P., Bassinot, F., Bouilloux, A., Bourlès, D., Nomade, S., Guillou, V., et al. (2014). Geomagnetic, Cosmogenic and Climatic Changes across the Last Geomagnetic Reversal from Equatorial Indian Ocean Sediments. Earth Planet. Sci. Lett. 397, 67–79. doi:10.1016/j.epsl.2014.03.053
Valet, J.-P., and Meynadier, L. (1993). Geomagnetic Field Intensity and Reversals during the Past Four Million Years. Nature 366, 234–238. doi:10.1038/366234a0
van Hinsbergen, D. J. J., Torsvik, T. H., Schmid, S. M., Maţenco, L. C., Maffione, M., Vissers, R. L. M., et al. (2020). Orogenic Architecture of the Mediterranean Region and Kinematic Reconstruction of its Tectonic Evolution since the Triassic. Gondwana Res. 81, 79–229. doi:10.1016/j.gr.2019.07.009
Warnock, A. C., Kodama, K. P., and Zeitler, P. K. (2000). Using Thermochronometry and Low-Temperature Demagnetization to Accurately Date Precambrian Paleomagnetic Poles. J. Geophys. Res. 105, 19435–19453. doi:10.1029/2000jb900114
Watanabe, T., Nakamura, T., Nara, F. W., Kakegawa, T., Horiuchi, K., Senda, R., et al. (2009). High-time Resolution AMS 14C Data Sets for Lake Baikal and Lake Hovsgol Sediment Cores: Changes in Radiocarbon Age and Sedimentation Rates during the Transition from the Last Glacial to the Holocene. Quat. Int. 205 (1-2), 12–20. doi:10.1016/j.quaint.2009.02.002
Yang, T., Hyodo, M., Yang, Z., Li, H., and Maeda, M. (2010). Multiple Rapid Polarity Swings during the Matuyama-Brunhes Transition from Two High-Resolution Loess-Paleosol Records. J. Geophys. Res. 115. doi:10.1029/2009JB006301
Yao, Z., Shi, X., Liu, Q., Liu, Y., Larrasoaña, J. C., Liu, J., et al. (2014). Paleomagnetic and Astronomical Dating of Sediment Core BH08 from the Bohai Sea, China: Implications for Glacial-Interglacial Sedimentation. Palaeogeogr. Palaeoclimatol. Palaeoecol. 393, 90–101. doi:10.1016/j.palaeo.2013.11.012
Keywords: Corinth rift, International Ocean Discovery Program, paleomagnetism, magnetostratigraphy, relative paleointensity (RPI), age model
Citation: Maffione M and Herrero-Bervera E (2022) A Relative Paleointensity (RPI)-Calibrated Age Model for the Corinth Syn-rift Sequence at IODP Hole M0079A (Gulf of Corinth, Greece). Front. Earth Sci. 10:813958. doi: 10.3389/feart.2022.813958
Received: 12 November 2021; Accepted: 03 March 2022;
Published: 28 March 2022.
Edited by:
Juan Cruz Larrasoaña, Instituto Geológico y Minero de España (IGME), SpainReviewed by:
Luigi Jovane, University of São Paulo, BrazilPablo Calvín, Instituto Geológico y Minero de España (IGME), Spain
Copyright © 2022 Maffione and Herrero-Bervera. This is an open-access article distributed under the terms of the Creative Commons Attribution License (CC BY). The use, distribution or reproduction in other forums is permitted, provided the original author(s) and the copyright owner(s) are credited and that the original publication in this journal is cited, in accordance with accepted academic practice. No use, distribution or reproduction is permitted which does not comply with these terms.
*Correspondence: Marco Maffione, bS5tYWZmaW9uZUBiaGFtLmFjLnVr