 Jinzi Liu*
 Xinyu Liu
- School of Mathematics and Statistics, Northeast Petroleum University, Daqing, China
Machine learning methods have become the leading research algorithm enjoying popularity for reservoir engineering evaluation. In this paper, one machine learning method is selected and optimized for the recognition and classification of inter-well nonlinear permeability configurations between injection and production wells in the low permeability reservoir. The above configurations are divided into four classes, i.e., homogeneous, linear increment, convexity increasing (logarithmic function), and convex downward increasing (exponential function). According to four kinds of nonlinear permeability distributions in low permeability reservoirs and the increased effect of threshold pressure gradient, the productivity formula is established. Then the decision tree, neural networks (NN) and support vector machines (SVM) are utilized for training dynamic data under the influence of the training model, i.e., the configuration in low-permeability reservoirs. The data set is formed with dynamic production data under different configuration permeability, well spacing, thickness, pressure, and production. The recognition and classification of the permeability configuration are performed using different machine learning models. The results show that compared with NN and decision tree, SVM presents better performance in the accuracy of verification, true positive rate (TPR), false-negative rate (FNR) and receiver operating characteristic (ROC). Moreover, SVM verification results are placed on the brink of the training methods. This paper provides new insights and methods for the recognition and classification of inter-well nonlinear permeability configuration in low permeability reservoirs. Additionally, the research method can also apply to solve similar theoretical problems in other unconventional reservoirs.
1 Introduction
Reservoir heterogeneity has been the main research hotspot in the area of low permeability reservoirs. They are identified in numerous heterogeneity studies in terms of typical characteristics and effective exploitation (Feng, 1986; Hao et al., 2006; Hu, 2009; Wang et al., 2013; Dou et al., 2014). Low permeability reservoirs show obvious heterogeneity, narrow throat, and poor mobility, significantly distinct from medium and high permeability reservoirs. Its fluid law also shows inconformity compared to Darcy’s law. Previous research results rely on core experiments to establish empirical formulas. Among them, the threshold pressure gradient is regarded as a constant to establish an empirical formula by the experimental regression method (Deng and Liu, 2003; Han et al., 2004; Li et al., 2004; Li et al., 2008; Zhu and Liu, 2010). Existing research explores the heterogeneity characteristics however, the impact of permeability configuration distribution and threshold pressure gradient on the productivity calculation in low permeability reservoirs is still unclear.
Machine learning has become a widespread method of intelligent recognition and classification (LiuSong and Zhu, 2011; Yu et al., 2012). Numerous reports detail the use of machine learning methods for productivity prediction, connectivity evaluation, and flow characteristics analysis (Wei et al., 2017; Wang et al., 2019; Song et al., 2020; Xu et al., 2020). Normally, there are three excellent algorithms for the classifications and recognition of machine learning, i.e., decision tree, neural networks (NN) and support vector machines (SVM), by which numerous works have been conducted. The decision tree learning algorithm is one process of recursively selecting optimal features and dividing training data according to features so that each sub-data set can be optimally classified. For the data with the inconsistent number of typical samples, the information gain is biased towards those features with more values, which are easy to overfit (Li, 2009; Ahmadi and Chen, 2019; Du et al., 2020; Liu, 2020; Liu and Liu, 2021). Neural network algorithm simulates the biological neural network and is a kind of pattern matching algorithm usually used to solve classification and regression problems. The Transect Network has multiple hidden layers and can deal with non-separable linear problems. However, it needs various parameters and has no applicable method for parameter selection, easily falling into local optimum (Kurt et al., 2008; Zhong et al., 2010; Raeesi et al., 2012; Mu et al., 2016; Han and Zheng, 2020). With nonlinear mapping as the basic theory, SVM uses the inner product kernel function to replace nonlinear mapping with higher dimensional space. The SVM learning problem can be determined by a convex optimization problem, so the global minimum of the objective function can be found using known efficient algorithms. However, other classification methods (such as the rule-based classifier and NN) adopt one greedy learning strategy to search hypothesis space, which can only obtain locally optimal solutions. This is the fundamental fact that allows far-reaching generalization of the support vector machine using the method of kernels (Al-Anazi and Gates, 2010; Gholami et al., 2012; Hatampour and Razmi, 2013; Rostami and Manshad, 2014; Anifowose et al., 2015; Chang and Liu, 2015; Swietlicka et al., 2017; Zhang and She, 2017; Serfidan et al., 2020; Zhou et al., 2021). The comparison and optimization of classification calculation are carried out from the consequences of the training set and test set. Moreover, it can also be extended to solve analogous theoretical problems in other unconventional reservoirs (Cortes and Vapnik, 1995; Anifowose et al., 2014; Nwachukwu et al., 2018; Yu et al., 2020). For example, classification of lithofacies, prediction of permeability and porosity, identification of water saturation using well logging data in reservoirs, and so on (Zhang et al., 2018; Wood, 2019; Zhang et al., 2020a; Tian et al., 2020; Sun et al., 2021; Zhang et al., 2021). The machine learning method is more and more being widely used in reservoir engineering (Gholami et al., 2014; Wang et al., 2014; Li et al., 2020; Silva et al., 2020).
Advantages are obvious when machine learning methods are used to recognize and classify heterogeneous permeability configurations in low permeability reservoirs. In contrast, it is challenging to judge inter-well permeability distribution by traditional methods. It has obvious theoretical significance to establish classification algorithm of dynamic basic data by machine learning method.
In this paper, a machine learning method is selected and optimized to classify inter-well nonlinear permeability configurations in low permeability reservoirs. The specific research steps are shown as follows in Figure 1.:
1) Four types of inter-well nonlinear permeability configurations are summarized between injection and production wells: homogeneous, linear increment, convexity increasing (logarithmic function) and convex downward increasing (exponential function); four nonlinear types as output classification data.
2) In accordance with four kinds of nonlinear permeability distributions in low permeability reservoirs and the increased effect of threshold pressure gradient, the productivity formula is established. Inter-well parameters included spacing, thickness, permeability, pressure, and production as input data.
3) Contrast to SVM, NN and decision trees are utilized to classify different permeability configurations.
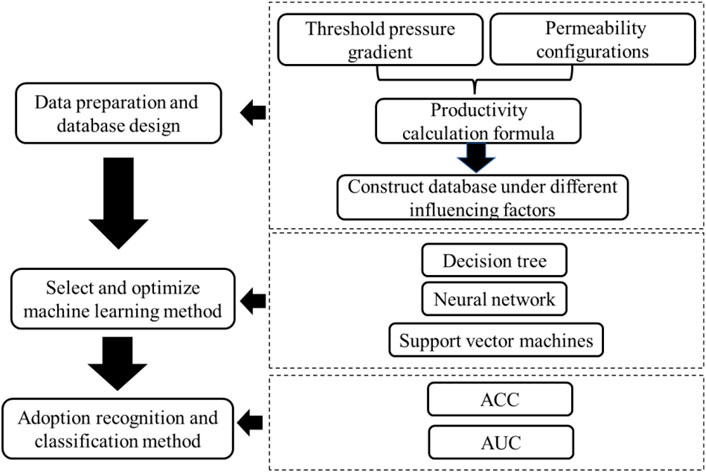
FIGURE 1. The specific research steps.
The results of this paper will provide guiding significance and application prospects for oilfield development. In addition to classification and prediction, machine learning algorithm can also be used for numerical calculation of fluid mechanics equation in reservoirs (Zhang et al., 2020b). Machine learning algorithms plays an important role in geophysics and reservoir engineering (Sun and Zhang, 2020).
2 Methodology
2.1 Decision Trees
As a basic classification method based on features, a decision tree is frequently used with a tree structure. The learning process usually includes three steps: feature selection, decision tree generation, and decision tree pruning, and the number of features is m, as shown in Figure 2. It can be viewed as sets of if-then rules or conditional probability distribution defined in feature space and class space. Its principal advantages are readability and high speed. In prediction, extra data are classified by the decision tree model, which is set up by minimizing the loss function using training data. Particularly in high-dimensional spaces, data can more easily be separated linearly and simplicity of classifiers, such as naive Bayes and linear SVMs. It could lead to better generalization than other classifiers. To solve over fitting training samples and low generalization ability, this paper chooses Bayesian as a pruning algorithm to improve the accuracy.
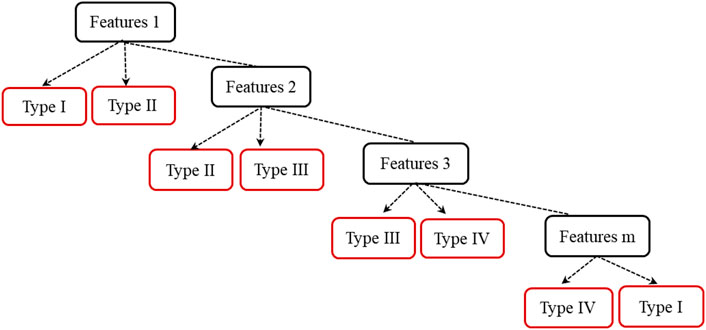
FIGURE 2. The tree structure of the decision tree.
2.2 Neural Networks
The NN structure consists of an input layer, hidden layer, and output layer, as shown in Figure 3. The calculation process is mainly divided into forward and backward propagations. Forward propagation means to use the weights and thresholds in the NN to calculate the desired output variable based on the input data, while backward propagation is the process to update the weights and thresholds continuously according to the error of output variables to ensure a constant true output result. Common activation functions of NN are sigmoid, tanh and ReLU function. In NN training, increasing the number of hidden layers can reduce the error of the network and improve the accuracy, but it also increases complications and training time, or even the tendency of “over fitting”. Therefore, this paper gives priority to the three-layer network through increasing the number of nodes as n and selecting the activation function to improve the accuracy.
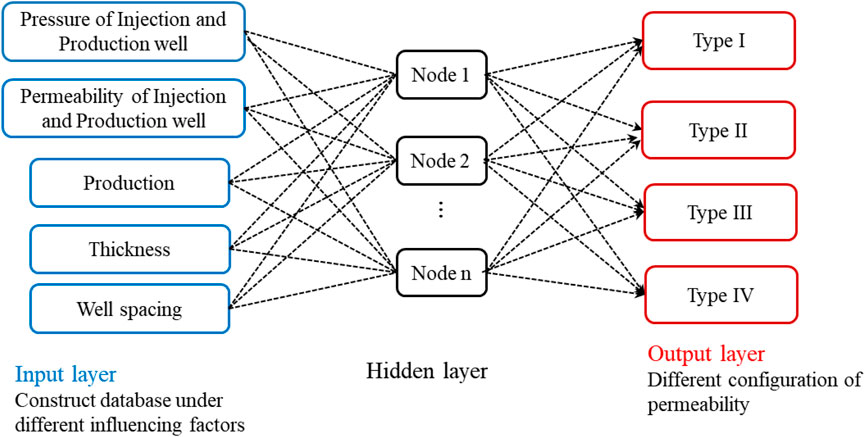
FIGURE 3. The structure of the neural network.
2.3 Support Vector Machines
SVM is a binary classification model. Its rudimentary model is one linear classifier defined in feature space with the largest interval. SVM can be seen as a single hidden layer of the NN (multiple hidden layers). SVM uses a single hidden layer to perform fitting and is added kernel function, which can fit nonlinear problems (NN is fitted by a multi-layer activation function). The SVM typically uses a “kernel function” to project the sample points to high dimension space to ensure separability, as shown in Figure 4. Generic kernel functions include linear, polynomial, Gaussian, and sigmoid/logistic functions. In this paper, the choice of kernel function depends on the accuracy, the number of kernel functions as N. By replacing the proper objective functions, better selection of the kernel parameters can be achieved. The kernel functions are selected to optimize the parameters, and thus, are significantly a nonlinear classifier. The learning strategy of SVM is interval maximization which can be formalized as a process to solve convex quadratic programming.
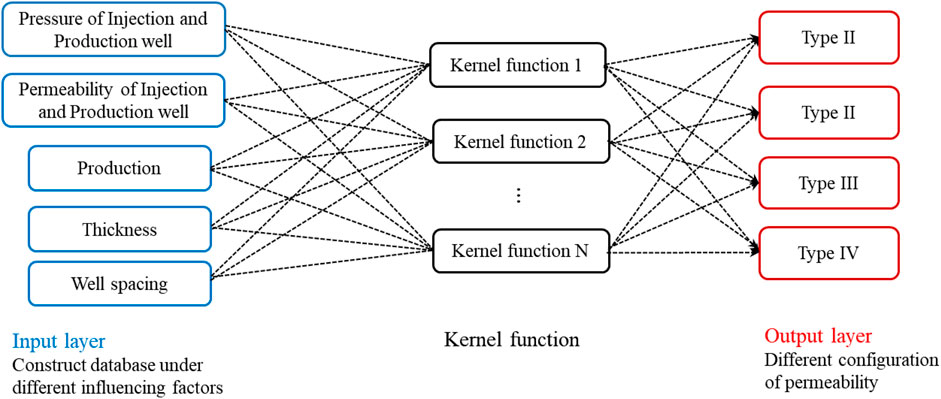
FIGURE 4. The structure of support vector machines.
2.4 Model Evaluation
The number of observations, true positive rate (TPR), false-negative rate (FNR), and false-positive rate (FPR) are utilized to verify the classification results. The formulas are as follows:
where TP denotes true positive, TN means true negative, FP refers to false positives, and FN is false negative. ACC is used to describe and verify the accuracy of classification, as shown in Eq. 4.
ROC (receiver operating characteristic) curve is utilized to show the TPR and FPR as a metric to evaluate classification quality. The ROC curve closer to the top left corner represents better accuracy. The AUC number is defined as the area enclosed by the ROC curve and coordinate axes. The closer it is to 1.0, the higher authenticity it will be.
3 Procedure
3.1 Inter-well Nonlinear Permeability Configuration
For the permeability distribution graph of reservoir numerical simulation, the permeability heterogeneity configuration between injection-production wells has obvious heterogeneity characteristics, as shown in Figure 5.
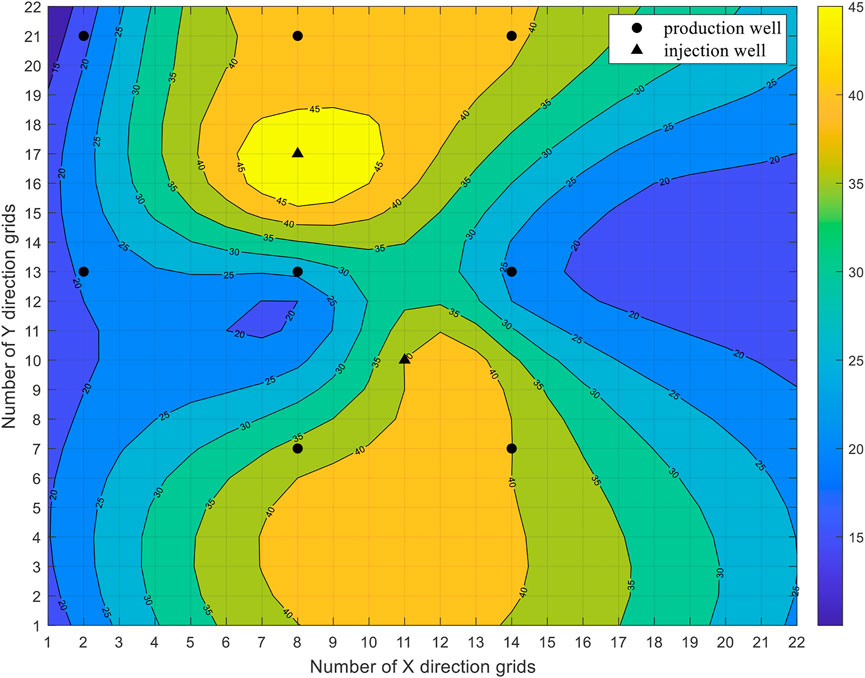
FIGURE 5. Permeability distributing graph of reservoir numerical simulation.
In Figure 6, the heterogeneous configuration of permeability distribution between wells can be streamlined into the following three heterogeneous mathematical models. Therefore, there are four types of permeability distribution configurations between wells, with homogeneous as type I, linear increment as type II, convexity increasing (logarithmic function) as type III, and convex downward increasing (exponential function) as type IV. The four types have unique configurations and mathematical function forms, as shown in Table 1.

FIGURE 6. Permeability three heterogeneous distributing graph. (A) Linear increment, (B) Convexity increasing (logarithmic function) and (C) Convex downward increasing (exponential function).
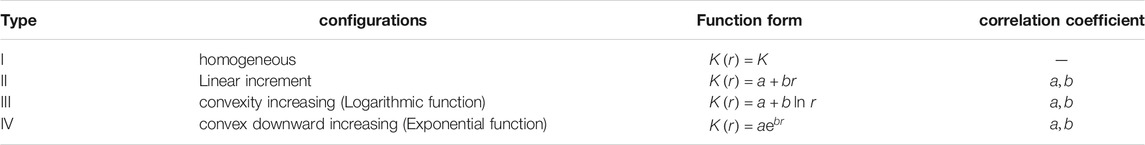
TABLE 1. Function form of different permeability configurations.
3.2 Single-phase Productivity Models
3.2.1 Threshold Pressure Gradient Calculation
The function form of threshold pressure gradient and permeability is obtained by the regression of experimental data in the low-permeability reservoir. The mathematical expression is as follows:
where
3.2.2 Production Formula
Type I: homogeneous.
When permeability
as
Where
Where
Type II: linear increment.
Substituting into Eq. 5; Eq. 8 can be obtained as follows.
Type III: logarithmic function.
Substituting
Where Г represents the Gamma function.
Type IV: Exponential function.
Substituting into Eq. 4; Eq. 7 can be achieved as follows.
Where Ei represents exponential integral function.
In conclusion, based on altered permeability configurations and threshold pressure gradient function, the single-phase productivity calculation formula is established relevant to the low-permeability homogeneous reservoir, representing universal significance. Where, as b = 0 and a = K, it is the production formula in low-permeability homogeneous reservoir. As λ = 0, b = 0, and a = K, it is the production formula in homogeneous reservoir.
4 Procedure
4.1 Dataset Collection
In this study, basic parameters of the low permeability reservoir are introduced. The porosity value is 0.25. Nonlinear permeability configuration is four classes. The permeability values of injection and production wells of the eight intervals are (1–10), (5–15), (10–20), (15–25), (20–30), (25–35), (30–40), and (35–45). Homogeneous permeability is 5, 7.5, 15, 20, 25, 30, 35, and 40. The viscosity is 5.8. The wellbore radius of the production well is 0.1 m. The production differential pressure is 10 and 15 MPa. The well spacing is 7m, 150m, and 200 m. The reservoir thicknesses are 0.4m, 0.8m, 1.2m, 1.6m, and 2 m, respectively. Initial water saturation is 0.25. Irreducible water saturation is 0.78. Therefore, the basic data set includes 960 samples. The sets adopt 5-fold cross validation, as shown in Table 2.
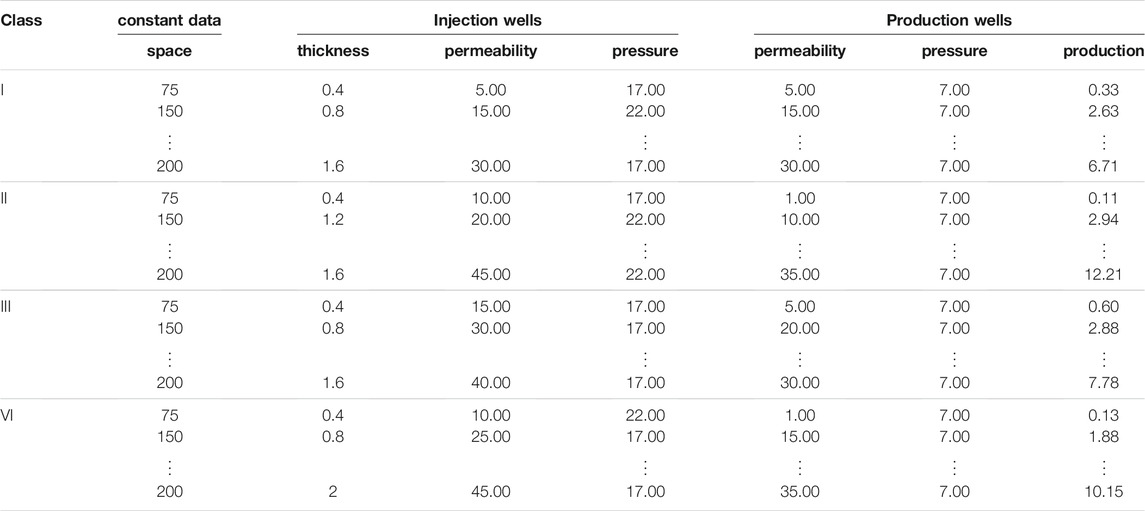
TABLE 2. Basic data sets of different permeability configurations (part).
4.2 Optimization of Algorithm Parameters
Figure 7 shows the parameter optimization process of different algorithms. The best point and minimum error hyperparameters of the decision tree exceed 0.5. The best point and minimum error hyperparameters of NN are close to
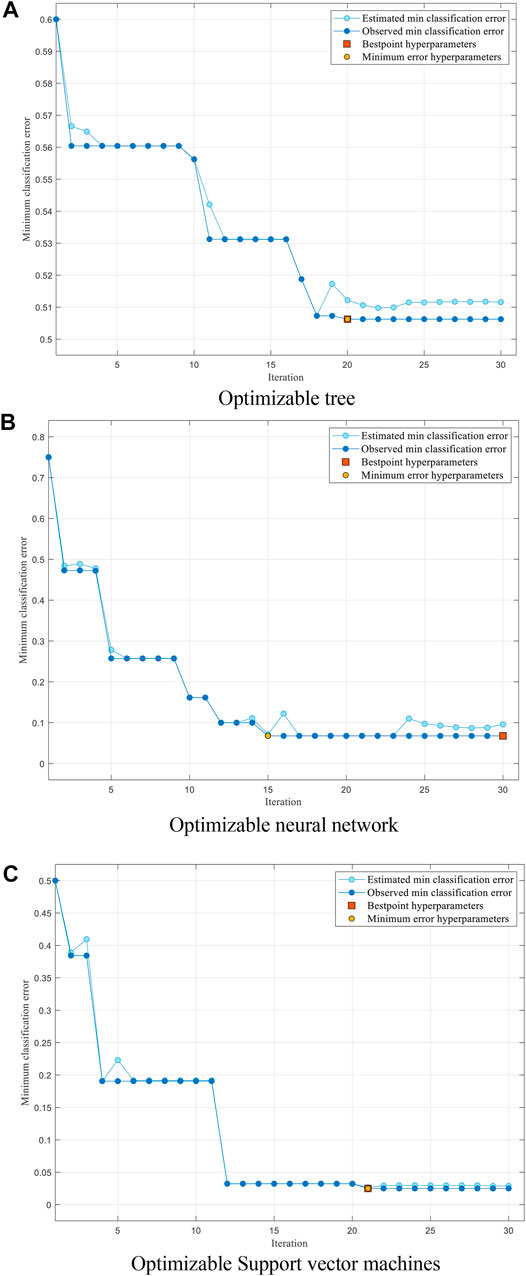
FIGURE 7. Parameter optimization process graph. (A) Optimizable tree, (B) Optimizable neural network and (C) Optimizable Support vector machines.
4.2.1 Decision Tree
The optimal Bayesian classification is based on the decision tree algorithm. Iterations is 30.
4.2.2 Neural Network
Optimizable NN hyperparameters are as follows: there are three fully connected layers with the first, second, and third layer sizes being 22, 23, and 44, respectively; the activation function is Tanh; the regularization strength (Lambda) is Data and is standardized; the iteration limit is.
4.2.3 Support Vector Machines
Optimizable hyperparameters of SVM are as follows: the kernel function is cubic; the box constraint level is
5 Results and Discussion
5.1 Model Calibration
As shown in Figure 8, TPR-FNR and PPV-FDR graphs of discrete algorithm results can be observed. As for Type I, three algorithms are all 100%. As for Type II, three algorithms are 38.3%, 75%, and 96.7%, respectively. As for Type III, three algorithms are 32.5%, 100%, and 98.3%, respectively. As for type IV, three algorithms are 26.7%, 79.2%, and 95.0%, respectively. From the overall evaluation, SVM shows the optimum performance algorithm.
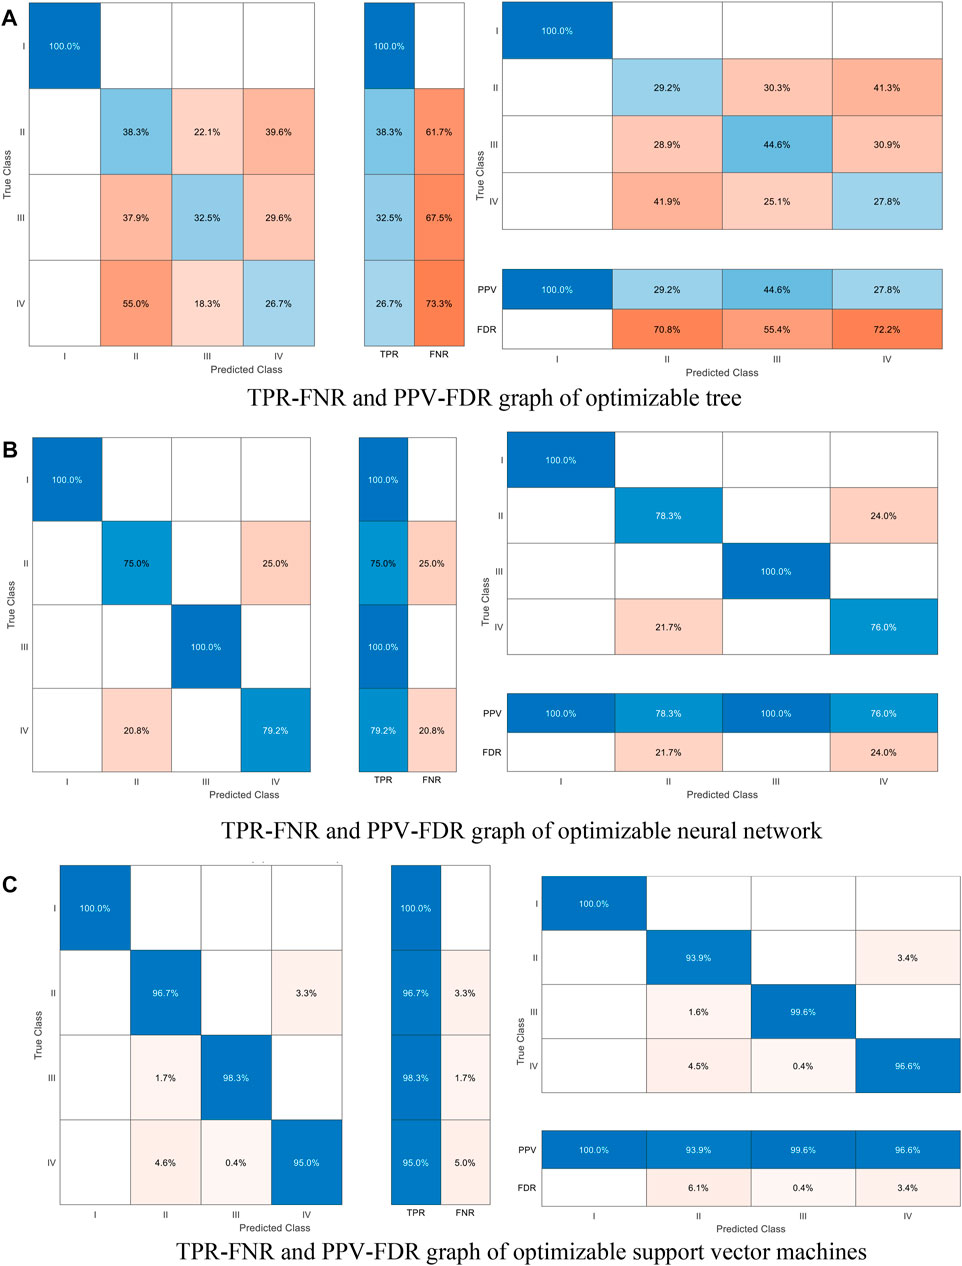
FIGURE 8. TPR-FNR and PPV-FDR graphs of different algorithm results. (A) TPR-FNR and PPV-FDR graph of optimizable tree, (B) TPR-FNR and PPV-FDR graph of optimizable neural network and (C) TPR-FNR and PPV-FDR graph of optimizable support vector machines.
5.2 Model Verification and Comparison
Table 3 and Figure 9 shows the ACC and AUC of different algorithm results. The AUCs of the three algorithms are all 100%, showing that all classification algorithms are appropriate. The ACCs of the three algorithms are 49.4%, 88.5%, and 97.5%, respectively. This explains why SVM has the highest recognition accuracy of 97.5%.

TABLE 3. Comparison of different algorithm result.
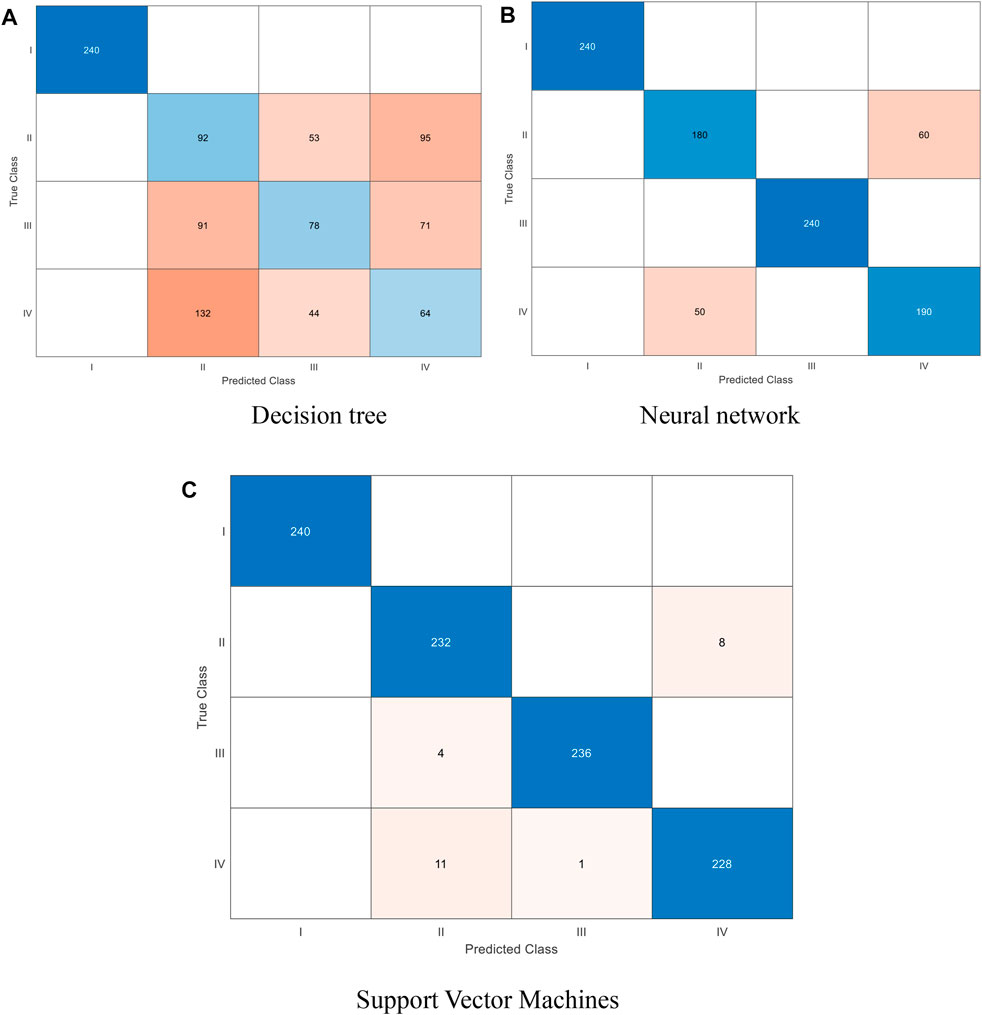
FIGURE 9. True class and predicted class comparison diagram. (A) Decision tree, (B) Neural network and (C) Support Vector Machines.
6 Conclusion
This paper selects and determines one machine learning method to recognize and classify the nonlinear permeability configuration between injection and production wells in the low-permeability reservoir. The following conclusions can be obtained:
1) This paper abstracts and simplifies four classes of inter-well nonlinear permeability configurations between injection and production wells, i.e., homogeneous, linear increment, convexity increasing (logarithmic function), and convex downward increasing (exponential function).
2) In accordance with the four kinds of nonlinear permeability distributions in low permeability reservoirs and the increased effect of threshold pressure gradient, the productivity formula is established.
3) SVM, NN, and decision tree are used to train the dynamic data with the influence of nonlinear permeability configuration in low permeability reservoirs as the training model. The data set is trained with dynamic production data under different configuration permeability, well spacing, thickness, pressure, and production. The results show that compared with NN and Tree, SVM represents the optimum performance in the accuracy of verification, TPR, FNR and ROC. The TPR is 100%, 96.7%, 98.3%, and 95.0%. ROC is 1.0. The accuracy is 97.5%.
Data Availability Statement
The original contributions presented in the study are included in the article/Supplementary Material, further inquiries can be directed to the corresponding author.
Author Contributions
JL contributed to conception and design of the study. XL organized the database. JL performed the statistical analysis. XL wrote the first draft of the manuscript. JL wrote sections of the manuscript. All authors contributed to manuscript revision, read, and approved the submitted version.
Funding
This work was supported by the State Key Program of National Natural Science Foundation of China (Grant No. 51834005), and the Guiding Innovation Fund Project of Northeast Petroleum University (Grant No. 2020YDL-01; Grant No. 2020YDL-06).
Conflict of Interest
The authors declare that the research was conducted in the absence of any commercial or financial relationships that could be construed as a potential conflict of interest.
Publisher’s Note
All claims expressed in this article are solely those of the authors and do not necessarily represent those of their affiliated organizations, or those of the publisher, the editors and the reviewers. Any product that may be evaluated in this article, or claim that may be made by its manufacturer, is not guaranteed or endorsed by the publisher.
References
Ahmadi, M. A., and Chen, Z. (2019). Comparison of Machine Learning Methods for Estimating Permeability and Porosity of Oil Reservoirs via Petro-Physical Logs. Petroleum 5, 14. doi:10.1016/j.petlm.2018.06.002
Al-Anazi, A., and Gates, I. D. (2010). A Support Vector Machine Algorithm to Classify Lithofacies and Model Permeability in Heterogeneous Reservoirs. Eng. Geology. 114, 267–277. doi:10.1016/j.enggeo.2010.05.005
Anifowose, F., Adeniye, S., and Abdulraheem, A. (2014). Recent Advances in the Application of Computational Intelligence Techniques in Oil and Gas Reservoir Characterisation: a Comparative Study. J. Exp. Theor. Artif. Intelligence 26, 551–570. doi:10.1080/0952813x.2014.924577
Anifowose, F., Labadin, J., and Abdulraheem, A. (2015). Improving the Prediction of Petroleum Reservoir Characterization with a Stacked Generalization Ensemble Model of Support Vector Machines. Appl. Soft Comput. 26, 483–496. doi:10.1016/j.asoc.2014.10.017
Chang, C. L., and Liu, H. C. (2015). Applying the Back-Propagation Neural Network Model and Fuzzy Classification to Evaluate the Trophic Status of a Reservoir System. Environ. Monit. Assess. 187, 567. doi:10.1007/s10661-015-4513-7
Cortes, C., and Vapnik, V. (1995). Support-Vector Networks. Mach Learn. 20, 273–297. doi:10.1007/bf00994018
Deng, Y. E., and Liu, C. Q. (2003). Mathematical Model of Two-phase Fluid Nonlinear Flow in Low-Permeability Porous media with Applications. Appl. Math. Mech. 24, 1184–1193.doi:10.1007/BF02438107
Dou, H. G., Ma, S. Y., and Zou, C. Y. (2014). Threshold Pressure Gradient of Fluid Flow through Multi-Porous media in Low and Extra-low Permeability Reservoirs. Sci. China: Earth Sci. 44, 1751–1760. doi:10.1007/s11430-014-4933-1
Du, S., Wang, R., Wei, C., Wang, Y., Zhou, Y., Wang, J., et al. (2020). The Connectivity Evaluation Among Wells in Reservoir Utilizing Machine Learning Methods. IEEE Access 8, 47209–47219. doi:10.1109/access.2020.2976910
Feng, W. G. (1986). Research Status and prospect of Non-darcy Low-Speed Flow. Pet. Exploration Dev. 13, 76–80.
Gholami, R., Moradzadeh, A., Maleki, S., Amiri, S., and Hanachi, J. (2014). Applications of Artificial Intelligence Methods in Prediction of Permeability in Hydrocarbon Reservoirs. J. Pet. Sci. Eng. 122, 643–656. doi:10.1016/j.petrol.2014.09.007
Gholami, R., Shahraki, A. R., and Paghaleh, M. J. (2012). Prediction of Hydrocarbon Reservoirs Permeability Using Support Vector Machine. Math. Probl. Eng., 2012 139. doi:10.1155/2012/670723
Han, H. B., Chen, L. S., and Zhang, M. L. (2004). Physical Simulation and Numerical Simulation of Ultra-low Permeability Reservoir in Consideration of Starting Pressure Gradient. J. China Univ. Pet. Edition Nat. Sci. 28, 49–53.doi:10.1088/0256-307X/27/7/074702
Han, Y. P., and Zheng, X. L. (2020). “Ensembling Learning Based Melanoma Classification Using Gradient Boosting Decision Trees. AIPR 2020,” in 3rd International Conference on Artificial Intelligence and Pattern Recognition, June 2020 (New York, NY, United States: Association for Computing Machinery), 104–109.
Hao, F., Cheng, L. S., and Li, X. L. (2006). Study on Threshold Pressure Gradient in Ultra-low Permeability Reservoir. J. Southwest Pet. Univ. Sci. Tech. Edition 28, 29–32. doi:10.3863/j.issn.1674-5086.2006.06.008
Hatampour, A., and Razmi, R. (2013). Improving Performance of a Neural Network Model by Artificial Ant Colony Optimization for Predicting Permeability of Petroleum Reservoir Rocks. Middle East J. Scientific Res. 13, 1217.doi:10.5829/idosi.mejsr.2013.13.9.927
Hu, W. R. (2009). The Present and Future of Low Permeability Oil and Gas in China. Eng. Sci. 11, 30.doi:10.1016/S1876-3804(18)30072-7
Kurt, I., Ture, M., and Kurum, A. T. (2008). Comparing Performances of Logistic Regression, Classification and Regression Tree, and Neural Networks for Predicting Coronary Artery Disease. Expert Syst. Appl. 34, 366–374. doi:10.1016/j.eswa.2006.09.004
Li, J., Zhong, P.-a., Yang, M., Zhu, F., Chen, J., Liu, W., et al. (2020). Intelligent Identification of Effective Reservoirs Based on the Random forest Classification Model. J. Hydrol. 591, 125324. doi:10.1016/j.jhydrol.2020.125324
Li, S.-q., Cheng, L.-s., Li, X.-s., and Hao, F. (2008). Nonlinear Seepage Flow of Ultralow Permeability Reservoirs. Pet. Exploration Dev. 35, 606–612. doi:10.1016/s1876-3804(09)60092-6
Li, X. (2009). Application of an Enhanced Decision-Tree Learning Approach for Prediction of Petroleum Production. Eng. Appl. Artif. Intelligence 23, 138.doi:10.1016/j.engappai.2009.06.003
Li, Z. X., Han, H. B., and Cheng, L. S. (2004). A New Solution and Application of Starting Pressure Gradient in Ultra-low Permeability Reservoir. Pet. Exploration Dev. 31, 107–111. doi:10.3321/j.issn:1000-0747.2004.03.029
Liu, J.-J., and Liu, J.-C. (2021). An Intelligent Approach for Reservoir Quality Evaluation in Tight sandstone Reservoir Using Gradient Boosting Decision Tree Algorithm - A Case Study of the Yanchang Formation, Mid-eastern Ordos Basin, China. Mar. Pet. Geology. 126, 104939. doi:10.1016/j.marpetgeo.2021.104939
Liu, J. (2020). Potential for Evaluation of Interwell Connectivity under the Effect of Intraformational Bed in Reservoirs Utilizing Machine Learning Methods. Geofluids 2020, 1–10. doi:10.1155/2020/1651549
LiuSong, J. Z. H. Q., and Zhu, W. Y. (2011). Effective Drive Theory of Nonlinear Extra-low Permeability Reservoir Thickness Calculation Method Is Discussed. J. Daqing Pet. Inst. 35, 68–72. doi:10.3969/j.issn.2095-4107.2011.01.014
Mu, L. W., Zhang, M. L., and Yan, X. (2016). Application of BP Neural Network in Identification of Water Flooded Layer in Low Porosity and Permeability Reservoirs. Contemp. Chem. Industry 45, 1586–1588.doi:10.1007/s12517-021-06671-w
Nwachukwu, A., Jeong, H., Pyrcz, M., and Lake, L. W. (2018). Fast Evaluation of Well Placements in Heterogeneous Reservoir Models Using Machine Learning. J. Pet. Sci. Eng. 163, 463–475. doi:10.1016/j.petrol.2018.01.019
Raeesi, M., Moradzadeh, A., Doulati Ardejani, F., and Rahimi, M. (2012). Classification and Identification of Hydrocarbon Reservoir Lithofacies and Their Heterogeneity Using Seismic Attributes, Logs Data and Artificial Neural Networks. J. Pet. Sci. Eng. 82-83, 151–165. doi:10.1016/j.petrol.2012.01.012
Rostami, H., and Manshad, A. K. (2014). A New Support Vector Machine and Artificial Neural Networks for Prediction of Stuck Pipe in Drilling of Oil Fields. J. Energ. Resour. Tech. 136, 86–91. doi:10.1115/1.4026917
Serfidan, A. C., Uzman, F., and Tuerkay, M. (2020). Optimal Estimation of Physical Properties of the Products of an Atmospheric Distillation Column Using Support Vector Regression. Comput. Chem. Eng. 134, 1–12. doi:10.1016/j.compchemeng.2019.106711
Silva, A. A., Tavares, M. W., and Carrasquilla, A. (2020). Petrofacies Classification Using Machine Learning Algorithms. Geophysics 85, 1–71. doi:10.1190/geo2019-0439.1
Song, H., Xu, J., Fang, J., Cao, Z., Yang, L., and Li, T. (2020). Potential for Mine Water Disposal in Coal Seam Goaf: Investigation of Storage Coefficients in the Shendong Mining Area. J. Clean. Prod. 244, 118646. doi:10.1016/j.jclepro.2019.118646
Sun, J., Zhang, R., Chen, M., Chen, B., Wang, X., Li, Q., et al. (2021). Identification of Porosity and Permeability while Drilling Based on Machine Learning. Arab J. Sci. Eng. 46, 7031–7045. doi:10.1007/s13369-021-05432-x
Sun, S. Y., and Zhang, T. (2020). Reservoir Simulations: Machine Learning and Modeling. Chennai, India: Gulf Professional Publishing.
Swietlicka, I., Sujak, A., and Muszynski, S. (2017). The Application of Artificial Neural Networks to the Problem of Reservoir Classification and Land Use Determination on the Basis of Water Sediment Composition. Ecol. Indicators 72, 759–765.doi:10.1016/j.ecolind.2016.09.012
Tian, J., Qi, C., Sun, Y., Yaseen, Z. M., and Pham, B. T. (2020). Permeability Prediction of Porous media Using a Combination of Computational Fluid Dynamics and Hybrid Machine Learning Methods. Eng. Comput. 37, 3455–3471. doi:10.1007/s00366-020-01012-z
Wang, G., Carr, T. R., Ju, Y., and Li, C. (2014). Identifying Organic-Rich Marcellus Shale Lithofacies by Support Vector Machine Classifier in the Appalachian basin. Comput. Geosciences 64, 52–60. doi:10.1016/j.cageo.2013.12.002
Wang, J., Song, H., Rasouli, V., and Killough, J. (2019). An Integrated Approach for Gas-Water Relative Permeability Determination in Nanoscale Porous media. J. Pet. Sci. Eng. 173, 237–245. doi:10.1016/j.petrol.2018.10.017
Wang, X. D., Hao, M. Q., and Han, Y. X. (2013). Implication of the Threshold Pressure Gradient and its Application. Acta Petrolei Sinica 34, 188–191. doi:10.1021/acsami.6b10094
Wei, C., Song, H., Li, Y., Zhang, Q., Song, B., and Wang, J. (2017). Production Characteristics with Different Superimposed Modes Using Variogram: A Case Study of a Super-giant Carbonate Reservoir in the Middle East. Energies 10, 250. doi:10.3390/en10020250
Wood, D. A. (2019). Predicting Porosity, Permeability and Water Saturation Applying an Optimized Nearest-Neighbour, Machine-Learning and Data-Mining Network of Well-Log Data. J. Pet. Sci. Eng. 184, 106587.doi:10.1016/j.petrol.2019.106587
Xu, Q., Liu, L., and Feng, J. C. (2020). A Comparative Investigation on the Effect of Different Nanofluids on the thermal Performance of Two-phase Closed Thermosiphon. Int. J. Heat Mass Transfer 149, 119–189. doi:10.1016/j.ijheatmasstransfer.2019.119189
Yu, G., Xu, F., Cui, Y., Li, X., Kang, C., Lu, C., et al. (2020). A New Method of Predicting the Saturation Pressure of Oil Reservoir and its Application. Int. J. Hydrogen Energ. 45, 30244–30253. doi:10.1016/j.ijhydene.2020.08.042
Yu, R. Z., Bian, Y. N., and Zhou, S. (2012). Nonlinear Flow Numerical Simulation of Low-Permeability Reservoir. J. Cent. South Univ. 19, 8. doi:10.1007/s11771-012-1235-7
Zhang, F. Z., and She, T. W. (2017). Feature of Chromatogram Based on BP Neural Network in Evaluation of Water Flooded Layer. Comp. Digital Eng. 45, 1629–1631. doi:10.3969/j.issn.1672-9722.2017.08.036
Zhang, G., Wang, Z., Li, H., Sun, Y., Zhang, Q., and Chen, W. (2018). Permeability Prediction of Isolated Channel Sands Using Machine Learning. J. Appl. Geophys. 159, 605–615. doi:10.1016/j.jappgeo.2018.09.011
Zhang, T., Li, Y., Li, Y. T., and Sun, S. Y. (2020). A self-adaptive deep learning algorithm for accelerating multi-component flash calculation. Comp. Meth. Appl. Mech. Eng. 369, 1–19. doi:10.1016/j.cma.2020.113207
Zhang, Y., Hu, J., and Zhang, Q. (2020). Application of Locality Preserving Projection-Based Unsupervised Learning in Predicting the Oil Production for Low-Permeability Reservoirs. SPE J. 26, 1302–1313. doi:10.2118/201231-pa
Zhang, Z., Zhang, H., Li, J., and Cai, Z. (2021). Permeability and Porosity Prediction Using Logging Data in a Heterogeneous Dolomite Reservoir: an Integrated Approach. J. Nat. Gas Sci. Eng. 86, 103743. doi:10.1016/j.jngse.2020.103743
Zhong, Y. H., Li, R., and Zhang, Z. Y. (2010). Dynamic Recognition Method for Water-Flooded Layer with Discrete Process Neural Network Based on the Principal Component Analysis. Well Logging Tech. 34, 432–443. doi:10.1016/j.apor.2010.09.005
Zhou, X. Q., Zhang, Z. S., and Zhang, C. M. (2021). Bi-LSTM Deep Neural Network Reservoir Classification Model Based on the Innovative Input of Logging Curve Response Sequences. IEEE Access 9, 99. doi:10.1109/ACCESS.2021.3053289
Keywords: classification, permeability configuration, low permeability reservoirs, machine learning methods, recognition
Citation: Liu J and Liu X (2022) Recognition and Classification for Inter-well Nonlinear Permeability Configuration in Low Permeability Reservoirs Utilizing Machine Learning Methods. Front. Earth Sci. 10:849407. doi: 10.3389/feart.2022.849407
Received: 06 January 2022; Accepted: 02 February 2022;
Published: 15 March 2022.
Edited by:
Kai Zhang, China University of Petroleum, ChinaReviewed by:
Hongqing Song, University of Science and Technology Beijing, ChinaTao Zhang, King Abdullah University of Science and Technology, Saudi Arabia
Copyright © 2022 Liu and Liu. This is an open-access article distributed under the terms of the Creative Commons Attribution License (CC BY). The use, distribution or reproduction in other forums is permitted, provided the original author(s) and the copyright owner(s) are credited and that the original publication in this journal is cited, in accordance with accepted academic practice. No use, distribution or reproduction is permitted which does not comply with these terms.
*Correspondence: Jinzi Liu, amluemkxOTgxMTIxNkAxMjYuY29t