 Liam S. Taylor
 Duncan J. Quincey
 Mark W. Smith
 Emily R. Potter1
 Catriona L. Fyffe
- 1School of Geography and Water@leeds, University of Leeds, Leeds, United Kingdom
- 2Centre for Polar Observation and Modelling, University of Leeds, Leeds, United Kingdom
- 3Instituto de Investigación, Universidad y Región, Universidad Nacional de San Antonio Abad del Cusco, Cusco, Peru
- 4Department of Geography and Environmental Sciences, Northumbria University, Newcastle Upon Tyne, United Kingdom
Around 70% of the world’s tropical glaciers are located in Peru, and they are melting rapidly in response to climate change. The glaciers of the data-sparse Southern Peruvian Andes, comprising the Cordilleras Vilcanota, Vilcabamba, and Urubamba, are a primary water source for thousands of people living in the rural foothills, and support people throughout the wider Cusco region. Here, we calculate geodetic mass balance for the Cordillera Vilcanota (−0.48 ± 0.07 m w.e. yr−1) using the ASTER satellite archive and derive a total loss of 3.18 ± 0.44 Gt ice between 2000 and 2020. Glacierised area has shrunk rapidly since the 1970s (losses of 54, 56, and 64% for the Cordilleras Vilcanota, Vilcabamba, and Urubamba respectively) as a consequence of changing climatic patterns, with low-lying glaciers receding the most across all regions. We calculate a rise in the median elevation of glaciers ranging from 15.9 m per decade over the Quelccaya ice cap in the Cordillera Vilcanota, to 32.8 m per decade in the Cordillera Vilcabamba, over the period 1975 to 2020. This change implies an increased hazard potential as the mountain regions become destabilised, and will lead to increasing pressure on fresh water supply as meltwater streamflow decreases and river discharge becomes increasingly, and irreversibly, variable.
Introduction
Tropical glaciers are highly sensitive to climatic changes and those in Peru, where the vast majority (∼70%) are located, have been rapidly receding for several decades (Chevallier et al., 2011; Salzmann et al., 2013; Schauwecker et al., 2014; Zemp et al., 2019). Consequently, as mountain slopes become destabilised, there has been increased threat from natural hazards, an observed growth in the number and area of glacial lakes, and changes to primary water supply (Drenkhan et al., 2019; Brügger et al., 2021; Thompson et al., 2021; Veettil and Kamp, 2021). Glacier recession is unlikely to be reversed as reductions in precipitation and increases in temperature are projected until at least 2100 (Kronenberg et al., 2016). Studies of future river discharge are unanimous in predicting a reduction in longer-term water supply, particularly during the dry season when glacier melt provides a critical buffer against drought (Vuille et al., 2008).
Compared to other mountain glacier regions around the world, there is a notable dearth of region-wide estimates of mass balance change for those located in Peru (Vuille et al., 2018). Previous studies have focussed on quantifying rates of glacier recession using satellite-based measurements of both area and volume change. At a continental-scale, Dussaillant et al. (2019) assessed mass balance across the Andes, noting that the glaciers of the tropical Andes (−0.42 ± 0.24 m w.e. yr−1) were losing mass at a steady rate between 2000 and 2018. At a national scale, Seehaus et al. (2019) presented areal losses of 28.6% from 2000 to 2016 and a Peru-wide mass balance of −0.457 ± 0.064 m w.e. yr−1. In contrast to Dussaillant et al. (2019), Seehaus et al. (2019) found a recent (2013–2016) increase in the rate of mass loss. The National Inventory of Glaciers in Peru quantified a 48% decline of glacial area from 2,041.85 km2 in 1962 to 1,058.37 km2 as of 2021 (ANA, 2021).
Regional studies of glacier recession in Peru disproportionately focus on the largest region; the Cordillera Blanca. Here, glacier loss has accelerated since the 1970s with consequent increases in their terminus elevations (Racoviteanu et al., 2008), following 20th century retreat from their Little Ice Age maximum extent (Georges, 2004) with a brief glacial advance interruption in the 1920s (Kaser, 1999). Glaciers in the Cordillera Blanca extend to lower elevations than the second-largest region, the Cordillera Vilcanota, owing to a lower annual freezing line altitude (Sagredo and Lowell, 2012; Schauwecker et al., 2017). Nevertheless, the Cordillera Vilcanota follows similar trends to the Cordillera Blanca, having lost 30% of its glacierised area and 45% of its volume from 1985 to 2006 (Salzmann et al., 2013). The National Inventory of Glaciers shows a decline of 48% of glacierised area in the Cordillera Vilcanota from 1962 to 2017 (INAIGEM, 2017; ANA, 2021). Measurements of mass balance on individual glaciers show that topography is a key control on ice loss; glaciers with a maximum elevation below 5400 m above sea level (m a.s.l.) are estimated to be losing mass at a rate (−1.2 m w.e. yr−1) double that of glaciers with an elevation above 5400 m a.s.l. (−0.6 m w.e. yr−1) (Rabatel et al., 2013a).
The controls of glacier recession in the Peruvian Andes appear to be numerous, and are often interlinked. Overall, lower lying and smaller glaciers have been observed to be in rapid retreat (Rabatel et al., 2013a), although there is variability related to aspect, and therefore radiation receipt (Veettil et al., 2018). The surface energy balance of Peruvian glaciers is primarily controlled by precipitation, which impacts albedo and therefore radiation receipt over low-lying glacial termini (Vuille et al., 2008; Fyffe et al., 2021), particularly in the outer tropics (Kaser, 2001). Air temperature controls this precipitation phase, such that warming temperatures increase the proportion of a glacier receiving rainfall rather than snowfall, which subsequently also impacts their albedo and radiation receipt. The pattern is more complex when looking at specific regions of Peruvian glaciers. Some studies have made different links between discrete climatic variables and rates of glacier recession—for example, changes in temperature appear to be most important for glaciers in the Cordillera Huaytapallana (López-Moreno et al., 2014), while precipitation is a more important driver in the Cordillera Blanca (Fyffe et al., 2021). Over longer timescales, specific humidity may also play a key role in mass loss in other areas (Vuille et al., 2008; Salzmann et al., 2013). For tropical glaciers more broadly, Kaser (1999) suggests both air temperature and humidity play a role in causing recent (post-1980s) retreat. There is also some indication that the interannual variability of the El Niño Southern Oscillation (ENSO) impacts glacier mass change in the Peruvian Andes, with heavy snowfall during La Niña phases and stronger ablation during El Niño, though these linkages are weaker (Vuille et al., 2008; Drenkhan et al., 2018).
Given contemporary rates of recession, there is growing concern that many glacierised areas across Peru could be ice-free by the end of the century (Drenkhan et al., 2018). However, robust measurements of glacier change are still sparse, and future projections are highly uncertain owing to the complexity of climatic and topographic factors driving change between regions (Schauwecker et al., 2017; Hock et al., 2019). The small size of tropical glaciers, and the fact that they are located in steep terrain, presents challenges for satellite-based observations as well as in-situ monitoring, meaning gaps in mass balance and ice area loss data persist for some regions, such as the Southern Peruvian Andes (Berthier et al., 2006; Prinz et al., 2018; Taylor et al., 2021). There remains a need for accurate, detailed and comprehensive studies that combine multiple datasets together to fully assess the dynamics of glaciers at high spatial and temporal resolution, the outputs from which can be invaluable for stakeholders and planners working to mitigate ongoing changes in runoff in these locations and guide climate change adaptation (Bury et al., 2011; Carey et al., 2012). A growing archive of satellite observations, along with the increasing availability of cloud-based and high-performance computing, provides an opportunity to fill some of those gaps.
Here, we use the 20-year ASTER (Advanced Spaceborne Thermal Emission and Reflection radiometer) satellite image archive as the basis for our analysis of glacier change in the Peruvian Andes. Previous studies have already defined a framework for producing regional (Dussaillant et al., 2018), continental (Brun et al., 2017; Dussaillant et al., 2019), and global (Hugonnet et al., 2021) measurements of glacier change using these data. Such datasets provide valuable insight into mountain glacier dynamics, their contribution to sea-level rise, and acceleration of melt, but they inevitably focus on the big picture of broad area changes. However, the usefulness of these large-scale datasets has seldom been examined in monitoring small mountain glaciers, particularly at their relatively coarse (100 m+) resolution. The overall aim of this research is, therefore, to provide detailed measurements of glacier area and volume change for the Cordilleras Vilcanota, Vilcabamba, and Urubamba, using the ASTER and Landsat satellite image archives, dating back to the 1970s. We generate high-resolution (30 m) products of elevation change using the ASTER archive to assess the quality of the global Hugonnet et al. (2021) dataset in measuring mass balance over small mountain glaciers. We explore the key processes driving ice loss across these regions, and discuss likely future changes to these glaciers under various climate scenarios, all of which result in a rise in equilibrium line altitude (ELA) and thus continued, unabated mass loss.
Study Area
The Cordilleras Vilcanota (246.8 km2 glacierised area in 2020; from this study), Vilcabamba (100.4 km2), and Urubamba (24.2 km2) represent a combined glacierised area of 371.4 km2. These regions are relatively understudied in comparison to the Cordillera Blanca (which is larger than all three together); yet, they represent a water source for hundreds of thousands of people in the wider Cusco region, many of which are located in the city of Cusco (population 470,000) (Drenkhan et al., 2018; Martínez et al., 2020). Recent glacial lake outburst floods at Salkantaycocha in 2020 (Vilca et al., 2021) and Riticocha in 2010 (Drenkhan et al., 2019) provide stark reminders of the threat that climatic changes pose in this region.
The Cordillera Vilcanota comprises a central mountain range (ranging from ∼4,600 m a.s.l. to the peak of 6,384 m a.s.l at Ausangate) arcing above Sibinacocha (Figure 1)—a large (∼28 km2) lake, which began being used for hydroelectricity generation in 1996. The Quelccaya ice cap (ranging from ∼5,200 to 5,743 m a.s.l) dominates the east of the Cordillera Vilcanota with a maximum ice thickness of 150–170 m (Salzmann et al., 2013). Until recently, Quelccaya was the largest tropical ice cap on Earth, replaced by the Coropuna Ice Cap in the South of Peru (not analysed in this study) (Kochtitzky et al., 2018). In the immediate vicinity of the glaciers of the Cordillera Vilcanota are small indigenous farming communities made up of a few thousand individuals. The largest, the Phinaya community, has witnessed glacier fluctuations for centuries, and is therefore well aware of the causes and consequences of glacier recession and the likely impact it will have on their futures (Orlove, 2009). Recession of glaciers in the Cordillera Vilcanota has previously been documented by Salzmann et al. (2013), but extending only as far back as 2009 for ice area and 2006 for ice volume change, and not benefiting from the availability of more recent and more robust methods of calculating mass balance. The National Inventory of Glaciers provides ice area change from the Cordillera Vilcanota to 2017 (246 km2) and Cordilleras Vilcabamba and Urubamba to 2016 (96 and 18 km2 respectively) (INAIGEM, 2017; ANA, 2021). Detailed assessments of mass balance have been limited to individual glaciers based on field monitoring campaigns (Molina et al., 2015).
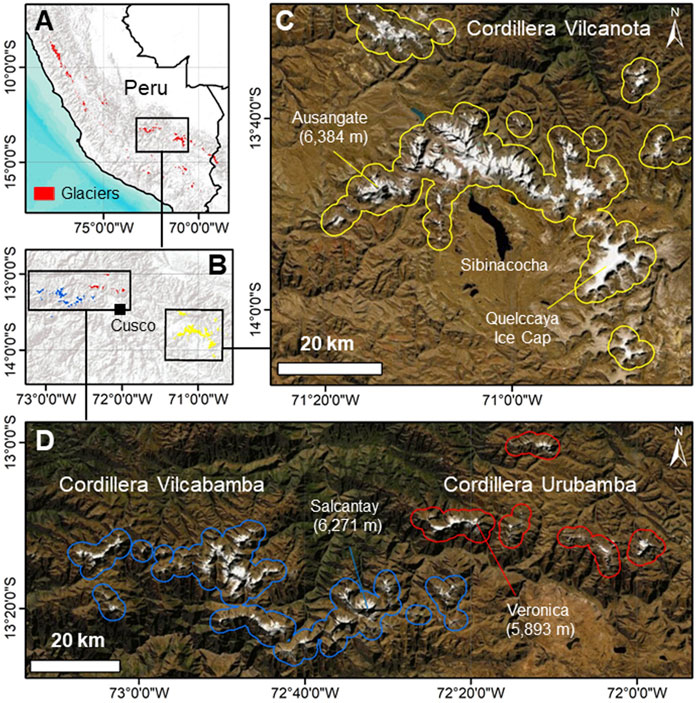
FIGURE 1. Location of the Southern Peruvian Cordilleras within (A) Peru and (B) the Cusco region. (C) The Cordillera Vilcanota outlined in yellow (with a 2 km buffer around glacierised areas), and (D) The Cordilleras Vilcabamba (blue) and Urubamba (red). Satellite imagery from DigitalGlobe. Glacier outlines from RGI Consortium (2017) (A) and this study (B–D).
The Cordilleras Vilcabamba and Urubamba are smaller in size, and together comprise around half the glacierised area of the Cordillera Vilcanota. They are located to the west and north-west of Cusco and stretch for around 100 km east-west, ranging from ∼4,600 m a.s.l to peaks of 6,271 m a.s.l at Salcantay in the Vilcabamba and 5,893 m a.s.l at Veronica in the Urubamba. Glaciers in this region have deep spiritual connotations as mountain deities to indigenous communities (Drenkhan et al., 2018). In addition, their demise impacts directly on the agriculture-based economy, which relies on glacial meltwater as a source of irrigation. Measurements of glacier change in this region are extremely limited, restricted to individual watersheds (Drenkhan et al., 2018) or specific glaciers (Veettil et al., 2018).
Data and Methods
Available Datasets
Satellite image archives are increasingly vast, as well as open-access, and computational advances have led to methodological frameworks that allow for robust analyses of glacier change that we employ here in the Cordilleras Vilcanota, Vilcabamba and Urubamba. The Landsat archive provides a record of ice area change almost continuously from 1972 to the present day, interrupted only by periods of heavy cloud and snow and short discontinuities in satellite operation. The small size of some glaciers in this region presents a challenge to delineating ice areas, but for decadal rates of change the measured rates of recession frequently exceed any uncertainties in the data.
Deriving volumetric changes from these stereoscopic sensors relies on there being sufficient contrast over snow and ice-covered surfaces for feature matching to be successful. Reconnaissance images (e.g. Corona KH-4; Bolch et al., 2008) acquired over the high-elevation accumulation areas of the Cordilleras Vilcanota, Vilcabamba, and Urubamba are largely featureless however, meaning surface elevations cannot be extracted. For this reason, we focussed our mass balance estimations on the ASTER archive, which provides a continuous record from 2000 to the present day of stereoscopic scenes across the world. ASTER acquires images every 16 days through a 14-band nadir sensor and a single band backward looking sensor to acquire stereo images. These data are collected at 15 and 30 m resolution to produce 30 m-resolution digital elevation models (DEMs). Cloud and snow also interfere with the production of digital elevation models, but the huge data redundancy afforded by the archive means this issue is relatively easy to overcome.
Area Change Between 1975 and 2020
Orthorectified Landsat-2 scenes (Level L1TP, 60 m spatial resolution; Supplementary Table S1) were used to manually delineate glacier outlines for the 1970s, conducted in ArcMap. All Landsat-2 scenes were acquired between the 25th June—31st July 1975 to minimise the influence of snow cover. All other glacier outlines were produced from 30 m imagery from the full-archive Landsat-5 Tier 1 Top of Atmosphere (1984–2012) and Landsat-8 Tier 1 Top of Atmosphere (2013–2020) datasets using a Normalised Difference Snow/Water Index (NDSI, NDWI) in Google Earth Engine. A cloud-free composite was produced for each year by extracting the median pixel value from the driest months (July 1st to September 30th) to minimise snow and cloud cover. Due to heavy cloud in these regions, there are some years within the time series with no usable imagery. The resulting images were split into their respective boundaries from the Randolph Glacier Inventory 6.0 (RGI) dataset (RGI Consortium, 2017) and manually extended outwards using the ASTER GDEM. On inspection, a small number of RGI outlines in these regions seemed highly improbable, and so we manually delineated flowlines where it was clear the RGI database was merging multiple glaciers together. All shapefiles were clipped to remove polygons smaller than 0.01 km2 in area and manually inspected to ensure no ice-free area was being incorrectly classified.
When determining glacier area, we calculated a conservative estimate of uncertainty for Landsat-2 scenes by assuming all glacier periphery pixels were misclassified, and calculated the total area of these periphery pixels, representing an error of 11%. Studies which have calculated uncertainty in a similar way produce comparable estimates of uncertainty (e.g. 11% for Kochtitzky et al., 2018). Rocky outcrops between glaciers and nunataks were particularly problematic to determine whether they were glacierised or snow-covered. Glacier boundaries from 1984 onwards were calculated via an automated method. Where this method is applied over predominantly clean-ice, associated error is 2–5% (Paul et al., 2013), and so we use a conservative estimate of 5% as the uncertainty value for glacier area delineated in this way, as the Southern Peruvian Andes are mostly clean-ice. We acknowledge that this method excludes any small debris cover patches that exist, but this is consistent with other studies who also exclude these areas due to their scarcity in this region (Salzmann et al., 2013).
Volume Change Between 2000 and 2020
To calculate glacier volume change, we extracted all L1A ASTER tiles collected over these regions in the 20-year timespan from 1st January 2000 to 31st December 2020. We derived 631 DEMs using the AMES Stereo Pipeline with a 7 pixel correlation kernel, using a 12 m TanDEM-X tile seed. To ensure accurate co-registration, they were corrected for planimetric and altimetric shifts against the TanDEM-X tile with a third-order polynomial transformation in stable, off-ice areas using the method of Nuth and Kääb (2011). Using a higher resolution DEM (12 m) compared to Hugonnet et al. (2021) (90 m) for co-registration should result in more accurate elevation models. DEMs that passed this correction phase were uploaded to Google Earth Engine using geeup (Roy, 2021), and clipped to elevations between 2000 and 6500 m a.s.l. (the approximate range of elevation within these Cordilleras) to exclude grossly erroneous pixels. A single value per pixel per year was extracted from all DEM tiles by collecting the median value (excluding values above and below the median ±100 m). Using these single values per year, a linear fit through the surface elevation was then calculated over three time periods: 2000–2010; 2010–2020; and 2000–2020 to represent elevation change per year during these intervals. Hugonnet et al. (2021) produce elevation change at 5-year intervals, but the associated error is often far larger than in the decadal intervals, and so we consider only the 10-year products to be usable. More detailed methodology including the parameters used at each stage is given in Supplementary Datasheet S2.
For the conversion of elevation change to mass change, there are three key sources of uncertainty:
1) Error in glacier area
2) Error in the calculated elevation change
3) Error in ice density calculations
We followed the method presented by Brun et al. (2017) to calculate overall uncertainty for mass balance calculations. We calculate uncertainty for the region-wide mass loss and use this fraction to attribute uncertainty in mass balance. Uncertainty in volume change is calculated using the standard deviation of elevation change on stable ground
Calculation of Geodetic Mass Balance and Median Glacier Elevation
Geodetic mass balance was calculated by taking into account the elevation change per pixel, pixel size (30 m), and ice density of 850 ± 60 kg m3 (Huss, 2013). Calculation of surface mass balance, which would include estimates of glacier flow from modelled ice thickness and velocity (Miles et al., 2021), was not possible in this region owing to lack of available flow data. This precluded a robust estimate of the glacier ELA using our surface elevation data alone. Therefore, in the absence of any in-situ data, we investigated previously published methods to quantify ELA change through time. These included quantifying changes to the freezing-line altitude (e.g. Schauwecker et al., 2017; Yarleque et al., 2018), the end of summer snowline altitude (Condom et al., 2007; Rabatel et al., 2013b), and the use of the median glacier elevation as an ELA proxy (e.g. Braithwaite and Raper, 2009; King et al., 2017). We adopted this final approach in the absence of higher spatial resolution climate data or reliable cloud-free satellite data to quantify snowlines, though we acknowledge this is likely to underestimate actual ELAs as the glaciers are out of balance with the climate. We calculated median glacier elevation for every glacier, and herein summarise an area-weighted average region-wide median glacier elevation for the Cordilleras Vilcabamba and Urubamba, and separate the Cordillera Vilcanota into five sub-regions reflecting the differing altitudes and topographies of each (Supplementary Figure S3).
Topography and Climate Data
To identify the most significant controls on ice loss in each region, we correlated the variables of change (volume and area loss) against topographic and climate data. Topographic data (aspect, elevation, slope) were derived from the ASTER GDEM and averaged over the shapefiles of each glacier. Climate data were created using the Weather Research and Forecasting (WRF) model and bias-corrected against daily precipitation and maximum and minimum daily temperature data in the region, from 1980 to 2018. Frost days were calculated as the number of days in the year where the minimum daily temperature fell below 0°C. For full details of the WRF model setup and bias-correction, see (Fyffe et al., 2021).
Climate data were correlated to glacier area change from 1984 (the first year of overlap between the Landsat record and climate dataset) to 2018 (the end of the climate dataset) for every glacier individually. These coefficients were then transformed to z-values using Fisher’s Z to ensure a normal distribution of data. A mean was taken of these Fisher’s Z values, which was subsequently back-transformed to achieve an overall region-wide correlation coefficient between ice area and climatic variables. Significance for these values was calculated using the Harmonic mean p-value, weighted to the size of the glacier, as a robust measure of significance in large datasets (Wilson, 2019). These steps ensure each glacier is statistically analysed against only the climate data that are of most relevance to that particular glacier.
Results and Discussion
Ice Area Change (1975–2020)
Overall, glacierised area of the Southern Peruvian Andes shrunk from 833.6 ± 91.7 km2 in 1975 to 312.6 ± 15.6 km2 in 2020 (Figure 2). This loss has predominantly occurred at low elevations (Figure 3). The Cordillera Vilcanota shrunk from a regional total of 540.6 ± 59.4 km2 in 1975 to 246.8 ± 12.3 km2 in 2020. This represents a loss of 54.3% of the glacier ice that was present in 1975 over a 45-year time period. 82 of the 257 glaciers present in 1975 had been lost by 2020 (or shrunk smaller than 0.01 km2 in size). There has been consistent and steady recession of ice across the region in this time. The Quelccaya ice cap, which is included within the area for the Cordillera Vilcanota, shrunk from 57.4 ± 5.4 km2 in 1975 to 41.6 ± 2.1 km2 in 2020, representing a loss (27.5%) that is below the regional average (Figure 2). There has, in contrast to the region-wide Cordillera Vilcanota, been an observable slowdown of ice area loss in recent years.
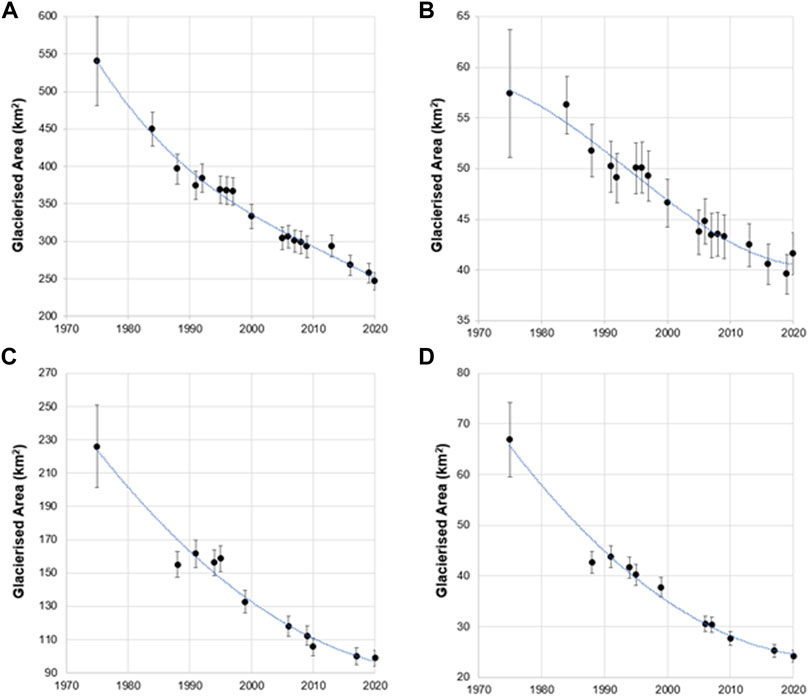
FIGURE 2. Glacierised Area of (A) Cordillera Vilcanota, (B) Quelccaya ice cap, (C) Cordillera Vilcabamba, and (D) Cordillera Urubamba. Note the varying y-axis scales. Blue line represents second-order polynomial fit.
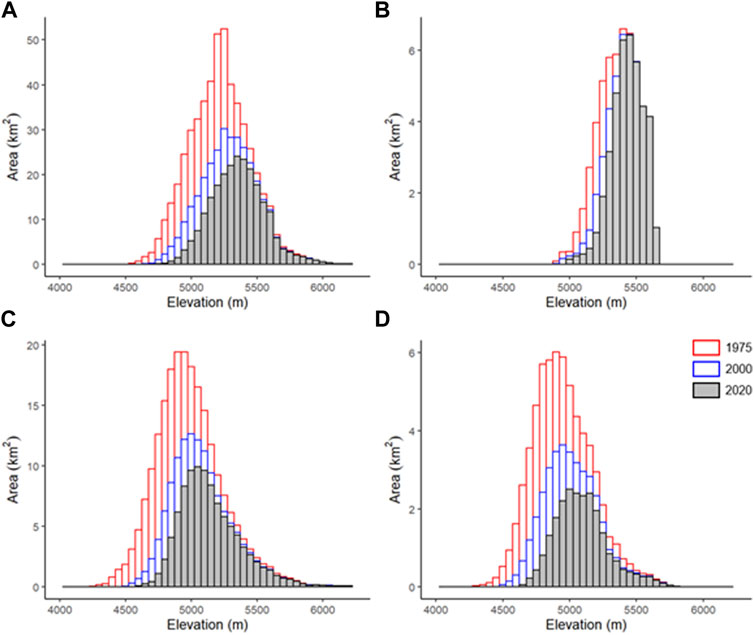
FIGURE 3. Evolving glacier hypsometry (1975, 2000, and 2020) in 50 m elevation bins for the (A) Cordillera Vilcanota, (B) Quelccaya ice cap, (C) Cordillera Vilcabamba, (D) Cordillera Urubamba. Note varying y-axis in each graph.
The Cordillera Vilcabamba shrunk from 226.1 ± 24.9 km2 in 1975 to 98.9 ± 4.9 km2 in 2020, a loss of 56% of glacierised area. 25 of the 169 glaciers present in 1975 had been lost by 2020. The Cordillera Urubamba shrunk from a glacierised area of 66.9 ± 7.4 km2 in 1975 to 24.2 ± 1.2 km2 in 2020; a loss of 64%. This represents the largest relative decline in glacierised area of the regions as this is the lowest-lying of the three Cordilleras. Of the 39 glaciers in the Cordillera Urubamba in 1975, seven had been lost by 2020.
These area changes, which predominantly affect lower-lying zones, have driven the glaciers to higher elevations over the 45-year study period (Figure 3). It is notable that in all three Cordilleras, glacier ice has all but disappeared from elevations below 4,700 m a.s.l. but is largely preserved above elevations of 5,500 m a.s.l. In each case, the hypsometry is skewed towards lower elevations. In contrast, the hypsometry of Quelccaya is skewed towards higher elevations, and consequently the bins with greatest area have been largely preserved. For Quelccaya, there is no observed change in glacier area above 5,550 m a.s.l. from 1975 to 2020.
Across the Cordillera Vilcanota, there is a moderate correlation between mean annual air temperature (which has risen by ∼0.2°C per decade from 1980 to 2020) and rate of ice area change (R = -0.514, p < 0.01), and maximum annual temperature and ice area loss (R = -0.576, p < 0.01) (Figure 3; Table 1). There is no statistically significant link (at p < 0.01) between ice area change and precipitation, but there is a corresponding correlation between the number of frost days in the year and ice area loss. The key topographic control on rate of ice area change is maximum elevation (R = −0.394, p < 0.01), with a second-order control of slope (R = −0.269, p < 0.01). There is no significant (p < 0.01) co-linearity between maximum elevation and slope. The prevalence of cloud or snow-covered scenes in our record limits our ability to analyse the role that ENSO plays in affecting glacier area change (shown in Figure 2).
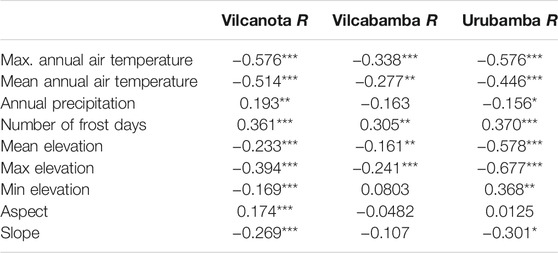
TABLE 1. Correlation coefficients for drivers of ice area change. Full table and graphs are given in the Supplementary Table S7 and Supplementary Figure S8. Significance (p) denoted as * = p < 0.1, ** = p < 0.05, *** = p < 0.01.
Over the Cordilleras Vilcabamba and Urubamba, there is also a moderate correlation between maximum annual temperature and rate of ice area change (R = −0.338, p < 0.01 and R = −0.576, p < 0.01 respectively). There is no statistically significant link between ice area change and precipitation. Similar to the Cordillera Vilcanota, the primary topographic control on ice area change in the Cordilleras Vilcabamba and Urubamba is maximum elevation (R = −0.241, p < 0.01; R = −0.677, p < 0.01 respectively) though this driver is much weaker in the Cordillera Vilcabamba. Slope is not a statistically significant control in the Cordillera Vilcabamba, but is in the Cordillera Urubamba (R = −0.301, p < 0.01), though there is co-linearity between elevation and slope in the Urubamba (R = 0.515, p < 0.01).
Ice Volume and Mass Balance (2000–2020)
Between 2000 and 2020, the Cordillera Vilcanota shrunk at a rate of −0.159 ± 0.022 Gt yr−1 (−0.48 ± 0.07 m w.e. yr−1). There was no significant change in the mass balance between the two sub-decadal periods; from −0.49 ± 0.17 m w.e. yr−1 between 2000–2010 to −0.44 ± 0.16 m w.e. yr−1 between 2010–2020 (Figure 4). Owing to the cloudiness of ASTER data, smaller glaciers, and steeper slopes over the Cordilleras Vilcabamba and Urubamba, the uncertainty in our mass balance calculation was much larger than it was for the Vilcanota. Between 2000 and 2020, the Cordillera Vilcabamba shrunk at a rate of −0.405 ± 0.451 m w.e. yr−1, while the Cordillera Urubamba shrunk at a rate of −0.559 ± 1.575 m w.e. yr−1. We present these figures here for completeness, but do not analyse them further given the extent to which the uncertainty exceeds any signal in the data. Thinning of debris-covered ice, which is not included in the glacier area polygons but only makes up a minimal percentage of ice in the region, can be observed in the surface elevation change (e.g. Figures 4B,C).
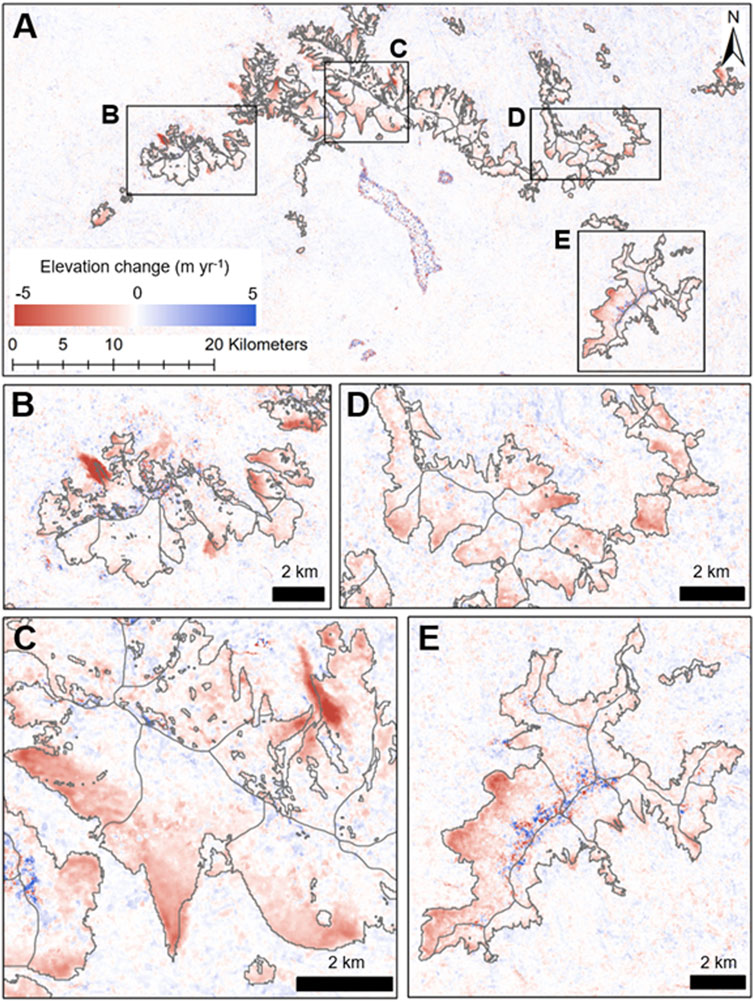
FIGURE 4. Elevation change from 2000 to 2020 over the central range of the Cordillera Vilcanota. (A) Overview of elevation change in the Cordillera Vilcanota. The large pixelated body in the centre of the figure is Laguna Sibinacocha. (B) Nevado Ausangate. (C) Chumpe Glacier. (D) Cluster of lower-lying Eastern glaciers. (E) Quelccaya ice cap. Glacier outlines from the year 2000 are in light grey. Large surface elevation changes in off-ice areas most notably in (B,C) are from debris-covered ice.
There is a moderate correlation between volume change over the full 20-year period and elevation (R = 0.38, p < 0.001), suggesting that low-lying areas are thinning, as well as receding, the most. There is a slight, but significant, correlation between volume change and slope (R = 0.16, p < 0.001) and aspect (R = −0.04, p < 0.001). This is particularly noticeable over the Nevado Ausangate cluster of glaciers, where South-facing glaciers are largely shadowed from solar radiation, while North-facing glaciers are experiencing large thinning (Figure 4B).
The median elevation (which we use as a proxy for ELA) of the Cordilleras Vilcabamba and Urubamba rose at the fastest rates across the full 1975–2020 time series (3.28 m yr−1 and 3.27 m yr−1 respectively), from 4,966 m a.s.l. to 5,110 m a.s.l. for the Cordillera Vilcabamba and 4,930 m a.s.l. to 5,077 m a.s.l. for the Cordillera Urubamba (Figure 5). However, the rate of change between the regions through time varies. The median elevation of the Cordillera Urubamba is accelerating upwards (from 2.88 m yr−1 for 2000–2010 to 4.59 m yr−1 for 2010–2020), while the rate of change in the Cordillera Vilcabamba is decelerating (from 3.69 m yr−1 for 2000–2010 to 3.06 m yr−1 for 2010–2020) (Supplementary Figure S5).
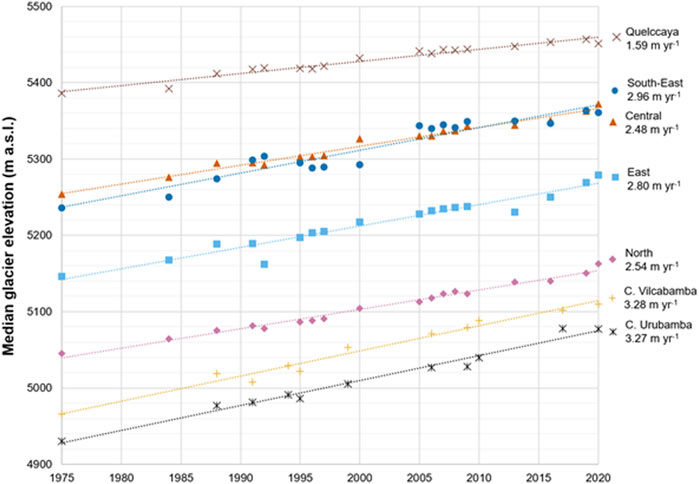
FIGURE 5. Change in median glacier elevation between 1975 and 2020 over the Southern Peruvian Andes. The North, East, Central, South-East, and Quelccaya categories are sub-regions of the Cordillera Vilcanota (Supplementary Figure S3). Dotted lines represent linear regressions.
The rate of median elevation change over the Cordillera Vilcanota is lower in all sub-regions than the Cordilleras Vilcabamba and Urubamba. The northernmost region of the Cordillera Vilcanota (Nevado Qolquepunco) has the lowest median elevation of the region (at 5,163 m a.s.l. in 2020; compared to 5,451 m a.s.l. at Quelccaya), but the rate of change has remained steady in recent decades. Quelccaya exhibits the lowest rate of median elevation change of all the regions at 1.59 m yr−1 from 1975 to 2020, likely due to its high elevation and flat topography. This rate of change has decelerated to 1.06 m yr−1 between 2010 and 2020. The key driver for the rate of median elevation change across the Cordillera Vilcanota is temperature; there is a significant correlation between maximum annual temperature and median elevation (R = 0.603, p < 0.001). The role of precipitation and frost in driving median elevation was not significant at p < 0.01.
Discussion
Comparison to Previous Works
Published estimates of glacier area in these regions are scarce, and many studies limit their efforts to studying specific watersheds within the wider region (e.g. Veettil and de Souza, 2017; Drenkhan et al., 2018). Furthermore, definitions of the boundaries of the Cordilleras are not fixed, with differing assessments of how many smaller periphery glaciers are included in calculations of the glacierised area of the region (Hanshaw and Bookhagen, 2014). Nevertheless, being cognisant of the slight variability in study areas, our estimations of ice recession fit well with the trend presented by other publications (Figure 6). To our knowledge, only the National Inventory of Glaciers presents information on glacier area change in the Cordilleras Vilcabamba and Urubamba. Our results for the area of the Cordillera Vilcabamba in 2017 (100.07 ± 5.00 km2) are comparable to the INAIGEM data (95.54 km2), but are slightly higher for the Cordillera Urubamba (25.27 ± 1.26 km2 to the INAIGEM’s 24.92 km2). Note there is a discrepancy between the INAIGEM published estimate for the Cordillera Urubamba of 17.89 km2 and their dataset of 24.92 km2, likely due to the way boundaries are drawn between Cordilleras (INAIGEM, 2017; ANA, 2021).
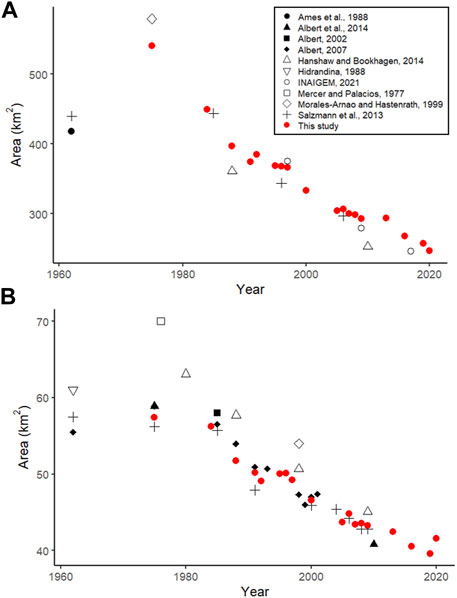
FIGURE 6. Ice area change comparison to published studies over (A) The Cordillera Vilcanota and (B) The Quelccaya ice cap.
There have been no comparable estimates of mass balance over the Cordillera Vilcanota specifically; however, the global ASTER dataset of glacier change (Hugonnet et al., 2021) provides reasonable context for our findings. The primary difference between the two datasets is their spatial resolution: the current study reports data at 30 m spatial resolution, while Hugonnet et al. (2021) is downsampled to 100 m resolution. Our mass balance estimate over the 20-year time period (−0.477 ± 0.067 m w.e. yr−1) is nearly identical to using their dataset (−0.479 ± 0.048 m w.e. yr−1). We attribute our slightly higher level of uncertainty to our finer spatial resolution which introduces some small artefacts into our dataset. However, the trade-off is that we are able to observe much more closely the changes of individual glaciers (an example comparison is shown over Chumpe glacier, in the Cordillera Vilcanota in Figure 7). The problem of very large uncertainty of mass balance change over the Cordilleras Vilcabamba and Urubamba was not unique to our dataset as Hugonnet et al. (2021) had large data gaps over this region, rendering their data unusable. Our high errors were due to cloud rather than steep terrain. Over the Cordilleras Vilcabamba and Urubamba, we produced far fewer DEMs per pixel (∼20 DEMs over the 20-year time period) in comparison to the Cordillera Vilcanota (∼75 DEMs per pixel).
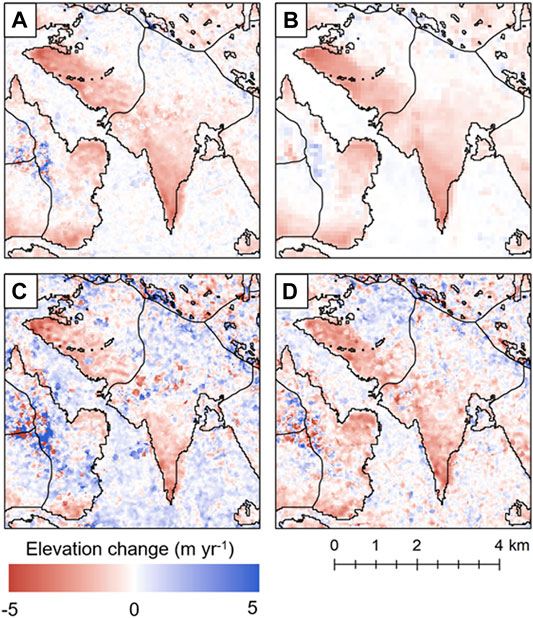
FIGURE 7. Comparison of datasets over Chumpe Glacier, Cordillera Vilcanota. (A) 2000 to 2020 change in elevation generated by this study, (B) Comparison to Hugonnet et al. (2021) and their 100 m resolution product over the same 20-year time period, (C) 2000–2010 change in elevation generated by this study, (D) 2010–2020 change in elevation. Black outlines represent the glacier area in 2000 produced by this study.
Our 2020 median glacier elevation estimate of 5,357 m a.s.l. for the central sub-region of the Cordillera Vilcanota is comparable to the 5,399 m a.s.l. (2016 figure) calculated by Drenkhan et al. (2018), with the difference attributed to different spatial areas covered (their study includes only glaciers in the Vilcanota-Urubamba-Vilcabamba basin). Our 1975–2020 rate of median elevation increase over the Quelccaya ice cap (15.9 m per decade) is comparable to the 1980–2017 estimate of 16.3 m per decade over the Quelccaya ice cap estimated by Yarleque et al. (2018). Our 1975–2020 rate of median elevation increase over the Central region of the Cordillera Vilcanota (24.8 m per decade) is slightly higher than the 22.8 m per decade between 1988 and 2010 estimated by Hanshaw and Bookhagen (2014). Our changes in the rate of median glacier elevation change show high variability across regions and decadal intervals (Supplementary Figure S6). This is not inconsistent with the interannual variability of measured ELA change over glaciers in the Cordillera Blanca (Kaser and Georges, 1997; Condom et al., 2007) and Cordillera Ampato (Veettil et al., 2016) which have been attributed to fluctuations in air humidity and the role of ENSO respectively. The interannual variation we exhibit in the Cordillera Vilcanota correlated to maximum air temperature, though this warrants further investigation given the high variability between sub-regions.
Ice area retreat is prolific across all areas of the Southern Peruvian Cordilleras. In the Cordillera Vilcanota, 82 of 257 glaciers (which represented 11.2% of the 1975 glacierised area) disappeared completely over the study period–most notably a cluster of glaciers to the south-east of the Quelccaya ice cap (Figure 8). However, deglaciation is occurring at differing rates between regions. Between 1988 and 2020, the Cordillera Vilcabamba lost 34% of its glacial area, compared to 45% for the Cordillera Vilcanota between 1984 and 2020. This is likely due to the differing morphology of glaciers between the regions–glaciers in the Vilcabamba are generally smaller and at lower elevations (Drenkhan et al., 2018) in comparison to the Vilcanota, which means less relative area is exposed to rapid melt. A differing climate setting between the regions is also likely to affect area change: the Cordilleras Vilcabamba and Urubamba are generally wetter than the Vilcanota (Kaser, 2001; Fyffe et al., 2021) though, unlike Fyffe et al. (2021), we did not observe precipitation to be a statistically significant driver of ice area change. This is likely due to the temporal resolution of our dataset; we examined annual precipitation and often with gaps between years in the dataset. Fyffe et al. (2021) studied the influence of precipitation at daily to weekly timescales, and found high variability in melt due to these precipitation dynamics. Further work is needed at a higher temporal resolution to better understand the role precipitation plays in regulating ice area change over long time scales.
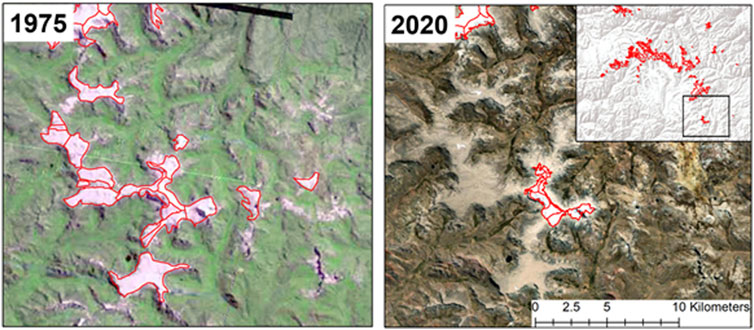
FIGURE 8. A small cluster of glaciers in the Cordillera Vilcanota to the south-east of the Quelccaya ice cap almost completely melting in the 45-year time span of this series. 1975 background image is from Landsat-2, 2020 image is from DigitalGlobe.
Glacier thinning has been consistent throughout the two decadal intervals studied. It is difficult to make an authentic comparison of our mass balance rate (−0.477 ± 0.067 m w.e. yr−1) to other estimates as differing proportions of the regions are studied. Using thickness-volume scaling, Salzmann et al. (2013) calculated an approximate thinning of −0.39 m a−1 from 1985–2006 (Seehaus et al., 2019), which would suggest that thinning has accelerated in recent decades when compared to our estimate of −0.563 m a−1 from 2000–2020. Limited field-based point measurements of mass balance over individual glaciers of the Cordillera Vilcanota have largely focussed on understanding the role micro-topography plays on the spatial differentiation of mass balance; ranging from −4 to 1.4 m w.e. yr−1 across the surface of Suyuparina glacier in the Cordillera Vilcanota in 2013 (Molina et al., 2015). While we do not have exact location information on their stakes, our results for the 2010–2020 time interval show ranges of −4.79 to 2.28 m w.e. yr−1 over the same glacier. Our estimates of mass balance are slightly larger than the −0.42 ± 0.24 m w.e. yr−1 calculated by Dussaillant et al. (2019), which suggests this region is also thinning faster than their Andes-wide average. A Peru-wide calculation of glacier thinning from 2000–2016 was estimated to be −0.359 ± 0.068 m a−1 (Seehaus et al., 2019), which suggests that thinning in the Cordillera Vilcanota is generally faster than the Peru-wide average.
Future Perspectives
In this study, we did not explicitly consider the change in glacial lakes across these regions and how this affects glacier loss. Previous studies (e.g. Drenkhan et al., 2018; Wood et al., 2021), have shown glacial lake expansion across each of these Cordilleras in line with climatic changes. The role of glacial lakes may be important in evaluating future change for tropical mountain glaciers, as lakes have been shown to accelerate ice recession when in direct contact (King et al., 2019). As more lakes develop in overdeepenings left by glacial recession (Colonia et al., 2017), this opens up the opportunity for accelerated ice loss. Similarly, in areas where glacial lakes do currently exist and ice is currently in contact with these lakes (such as the Western face of the Quelccaya ice cap), there may be a slow-down in areal recession in future decades as ice retreats up-slope and out of these lakes. This is particularly important in the Cordillera Vilcanota where 117 new large (>10,000 m2) lakes are projected to develop by 2050; the greatest of any Peruvian Cordillera (Guardamino et al., 2019), which is likely to accelerate glacier recession.
Future projections of glacier change in the Andes are stark. Even under a low emissions pathway, Schauwecker et al. (2017) suggest a rise in the freezing line of the Cordillera Vilcanota of 230 ± 190 m by 2100, which would lead to greater committed ice loss. The close relationship between temperature and ELA, projected 2.5–4.5°C warming over these glaciers by 2100 (Yarleque et al., 2018; Fyffe et al., 2021; Veettil and de Souza, 2017), and presence of low-lying glacier tongues across the regions suggest there will be significant melt of the Southern Peruvian Andes this century. Studies projecting future increase in ELA over the Vilcanota and Quelccaya (Schauwecker et al., 2017; Yarleque et al., 2018) also suggest this rate is likely to rise sharply in the coming decades. Low-lying regions within the Cordillera Vilcanota (South-East and North; Supplementary Figure S3) will likely experience the most glacier loss in the near future. Predictions of remaining glacial ice in 2100 for the Cordillera Vilcanota range from a pessimistic 13 km2 to an optimistic 155 km2 (5.4–63.0% of 2020 ice extent) (Schauwecker et al., 2017).
For people living in close proximity to this glacial ice, this represents a major loss of a freshwater resource. Following the approach of Drenkhan et al. (2018), we can contextualise this by noting that in our 2000–2020 study of volume change, the loss of 3.44 km3 of water from the Cordillera Vilcanota represents ∼84 years of water supply for the city of Cusco. Up to 33% of the population of Cusco rely on glacial meltwater during dry seasons (3% annually) (Martínez et al., 2020). Future ice melt is also unlikely to be even. Key glaciers supplying the Laguna Sibinacocha would lose over 90% of their glacierised area by 2100 (Drenkhan et al., 2018), while the Quelccaya ice cap would likely be below the ELA by mid-century (Yarleque et al., 2018). The low-lying Cordillera Urubamba is particularly at threat of severe ablation over the coming decades owing to the high rate of ELA change, posing an imminent risk of loss of water for irrigation, hydropower, and a drinking source in dry seasons (Chevallier et al., 2011). Ice melt is also unlikely to be even in time. While few studies have examined these specific Cordilleras for the timing of “peak water” (a maximum river discharge from the glacial melt contribution), indications from other Cordilleras of Peru show that peak water is likely to pass in the near-future (Drenkhan et al., 2014; Mark et al., 2017; Huss and Hock, 2018; Drenkhan et al., 2019).
An immediate concern is also the increased risk of outburst flood events and hazards to communities downstream of these destabilising glaciers (Vilca et al., 2021). Urgent adaptation measures, such as alternative agricultural practices (e.g. sustainable irrigation systems) and glacial lake outburst flood monitoring systems, are needed across the Southern Peruvian Andes to minimise the impact of this loss on communities (Veettil and Kamp, 2019). This must be integrated with a social perspective to recognise the cultural and spiritual loss marked by the recession of these glaciers, and connection of indigenous communities to the ice (Motschmann et al., 2020).
The drivers of ice loss across all three regions are largely due to warming maximum air temperatures (which correlated with ice area loss and ELA changes in all regions) and topographic controls, most notably, elevation. This is as expected; freezing levels are rising in line with temperature rises and low-lying glacier tongues, many of which are low-gradient and thus susceptible to even minor temperature shifts, are now exposed to melt processes (Thompson et al., 2011). However, we did not have the data available to explore all the predicted key climatic drivers of ice loss, such as atmospheric humidity and radiation (Kaser, 1999; Vuille et al., 2008). Furthermore, the role of ENSO as a driver of tropical glacier mass loss is becoming realised over individual glaciers across the Andes (Maussion et al., 2015; Veettil et al., 2016), but we could not explore this phenomenon within the available datasets. This signal is thought to be lesser over the Cordilleras Vilcanota, Vilcabamba, and Urubamba as they receive moisture from the Amazon during La Niña; thereby dampening the ENSO signal (Perry et al., 2014). This highlights the need to complement remote sensing observations with in-situ data to bridge such gaps.
The optical imagery from Landsat and ASTER used in this study provides useful insights into the dynamics of changes to mountain glaciers, and the long archives of both have been particularly beneficial to generate these results. However, their limitation is highlighted by the lower numbers of usable images we were able to acquire over the Cordilleras Vilcabamba and Urubamba and steep terrain. Mass balance estimates over the Peruvian Andes are few and can be improved using satellite data (Vuille et al., 2018), but the level of uncertainty driven by lack of usable DEM data from ASTER images remains too high. We have demonstrated in this study that the 100 m resolution Hugonnet et al. (2021) dataset provides comparable estimates of mass balance over small mountain glaciers as a higher resolution 30 m product. Radar satellites are able to penetrate cloud, which overcomes the primary limitation, but are challenged by steep topography, which often limits their usefulness to glaciers far larger than those in the Southern Peruvian Andes (Lee et al., 2013). Furthermore, with the steady decay of ASTER as the Terra satellite drifts further out of orbit, and with no current plans for an alternative non-commercially operated stereo satellite, there is an urgent need to find alternative sources to derive regional-level and multi-temporal digital elevation data.
Conclusion
In this study, we used the Landsat and ASTER archives to quantify glacier area and mass balance change across the Peruvian Cordilleras Vilcanota, Vilcabamba, and Urubamba–three regions typically understudied in the Andes. We identify a decline in both ice area and mass balance across the Southern Peruvian Andes which is most closely linked to the elevation of the individual Cordilleras; low-lying glaciers are most at risk of immediate melt, and those are most prevalent in the Cordillera Vilcanota. Over the period from 1975 to 2020, glaciers in the Southern Peruvian Andes have receded by ∼512 km2 and are now at less than half their original size. These glaciers are also rapidly thinning; losing 3.18 ± 0.44 Gt ice from 2000–2020. As the climate continues to warm though, the ELA will shift further upwards, which will consequently expose large flat glaciers (including the Quelccaya ice cap) to net ablation. Optical imagery, and stereo imagery, can provide useful insights into the dynamics of small mountain glaciers, but the heavy presence of cloud and snow in long archives still limit the usability of these data and future research needs to validate and extend these data with in-situ measurements. These data provide a closer insight into interdecadal patterns of glacier change in these data sparse regions, and can be used to help inform policymaking to manage the future threat of glacial hazards and ensure water security across the Cusco region.
Data Availability Statement
The original contributions presented in the study are publicly available. This data can be found here: https://doi.org/10.5285/d4dedc2d-1f7f-45c8-8b04-41b8b099cef9.
Author Contributions
LT co-designed the study, conducted data analysis, and wrote the manuscript. DQ and MS co-designed the study, supervised the data analysis, and contributed to writing the manuscript. EP conducted climate data analysis, and contributed to writing the manuscript. JC and CF contributed expertise on Peruvian glacier dynamics for data analysis and wrote the manuscript.
Funding
This research was funded by a NERC Doctoral Training Partnership studentship to LST (NE/L002574/1) and a NERC Newton Fund grant led by DJQ (PEGASUS; NE/S013318/1).
Conflict of Interest
The authors declare that the research was conducted in the absence of any commercial or financial relationships that could be construed as a potential conflict of interest.
Publisher’s Note
All claims expressed in this article are solely those of the authors and do not necessarily represent those of their affiliated organizations, or those of the publisher, the editors and the reviewers. Any product that may be evaluated in this article, or claim that may be made by its manufacturer, is not guaranteed or endorsed by the publisher.
Acknowledgments
The authors are also grateful to support in the form of data grants from the European Space Agency (ESA) (ID: 49613) and TanDEM-X (ID: DEM_GLAC2721). We are also grateful to Fabian Drenkhan and Bethan Davies for their reviews which substantially improved this manuscript.
Supplementary Material
The Supplementary Material for this article can be found online at: https://www.frontiersin.org/articles/10.3389/feart.2022.863933/full#supplementary-material
References
Berthier, E., Arnaud, Y., Vincent, C., and Rémy, F. (2006). Biases of SRTM in High-Mountain Areas: Implications for the Monitoring of Glacier Volume Changes. Geophys. Res. Lett. 33 (8), L08502. doi:10.1029/2006gl025862
Bolch, T., Buchroithner, M., Pieczonka, T., and Kunert, A. (2008). Planimetric and Volumetric Glacier Changes in the Khumbu Himal, Nepal, since 1962 Using Corona, Landsat TM and ASTER Data. J. Glaciol. 54 (187), 592–600. doi:10.3189/002214308786570782
Braithwaite, R. J., and Raper, S. C. B. (2009). Estimating Equilibrium-Line Altitude (ELA) from Glacier Inventory Data. Ann. Glaciol. 50 (53), 127–132. doi:10.3189/172756410790595930
Brügger, A., Tobias, R., and Monge-Rodríguez, F. S. (2021). Public Perceptions of Climate Change in the Peruvian Andes. Sustainability 13 (5), 2677.
Brun, F., Berthier, E., Wagnon, P., Kääb, A., and Treichler, D. (2017). A Spatially Resolved Estimate of High Mountain Asia Glacier Mass Balances from 2000 to 2016. Nat. Geosci 10 (9), 668–673. doi:10.1038/ngeo2999
Bury, J. T., Mark, B. G., McKenzie, J. M., French, A., Baraer, M., Huh, K. I., et al. (2011). Glacier Recession and Human Vulnerability in the Yanamarey Watershed of the Cordillera Blanca, Peru. Climatic Change 105 (1), 179–206. doi:10.1007/s10584-010-9870-1
Carey, M., Huggel, C., Bury, J., Portocarrero, C., and Haeberli, W. (2012). An Integrated Socio-Environmental Framework for Glacier hazard Management and Climate Change Adaptation: Lessons from Lake 513, Cordillera Blanca, Peru. Climatic Change 112 (3), 733–767. doi:10.1007/s10584-011-0249-8
Chevallier, P., Pouyaud, B., Suarez, W., and Condom, T. (2011). Climate Change Threats to Environment in the Tropical Andes: Glaciers and Water Resources. Reg. Environ. Change 11 (1), 179–187. doi:10.1007/s10113-010-0177-6
Colonia, D., Torres, J., Haeberli, W., Schauwecker, S., Braendle, E., Giraldez, C., et al. (2017). Compiling an Inventory of Glacier-Bed Overdeepenings and Potential New Lakes in De-glaciating Areas of the Peruvian Andes: Approach, First Results, and Perspectives for Adaptation to Climate Change. Water 9 (5), 336. doi:10.3390/w9050336
Condom, T., Coudrain, A., Sicart, J. E., and Théry, S. (2007). Computation of the Space and Time Evolution of Equilibrium-Line Altitudes on Andean Glaciers (10°N–55°S). Glob. Planet. Change 59 (1), 189–202. doi:10.1016/j.gloplacha.2006.11.021
Drenkhan, F., Guardamino, L., Huggel, C., and Frey, H. (2018). Current and Future Glacier and lake Assessment in the Deglaciating Vilcanota-Urubamba basin, Peruvian Andes. Glob. Planet. Change 169, 105–118. doi:10.1016/j.gloplacha.2018.07.005
Drenkhan, F., Huggel, C., Guardamino, L., and Haeberli, W. (2019). Managing Risks and Future Options from New Lakes in the Deglaciating Andes of Peru: The Example of the Vilcanota-Urubamba basin. Sci. Total Environ. 665, 465–483. doi:10.1016/j.scitotenv.2019.02.070
Drenkhan, F., Huggel, C., Salzmann, N., Giráldez, C., Suarez, W., Rohrer, M., et al. (2014). Present and Future Water Resources Supply and Demand in the Central Andes of Peru: A Comprehensive Review with Focus on the Cordillera Vilcanota. Austria: EGU General Assembly, 13194.
Dussaillant, I., Berthier, E., and Brun, F. (2018). Geodetic Mass Balance of the Northern Patagonian Icefield from 2000 to 2012 Using Two Independent Methods. Front. Earth Sci. 6, 8. doi:10.3389/feart.2018.00008
Dussaillant, I., Berthier, E., Brun, F., Masiokas, M., Hugonnet, R., Favier, V., et al. (2019). Two Decades of Glacier Mass Loss along the Andes. Nat. Geosci. 12 (10), 802–808. doi:10.1038/s41561-019-0432-5
Fyffe, C. L., Potter, E., Fugger, S., Orr, A., Fatichi, S., Loarte, E., et al. (2021). The Energy and Mass Balance of Peruvian Glaciers. J. Geophys. Res. Atmospheres 126 (23), e2021JD034911. doi:10.1029/2021jd034911
Georges, C. (2004). 20th-Century Glacier Fluctuations in the Tropical Cordillera Blanca, Perú. Arctic, Antarctic, Alpine Res. 36 (1), 100–107. doi:10.1657/1523-0430(2004)036[0100:tgfitt]2.0.co;2
Guardamino, L., Haeberli, W., Muñoz, R., Drenkhan, F., Tacsi, A., and Cochachin, A. (2019). Proyección de Lagunas Futuras en las Cordilleras Glaciares del Perú [Online]. Lima. Available from https://repositorio.ana.gob.pe/handle/20.500.12543/3597.
Hanshaw, M. N., and Bookhagen, B. (2014). Glacial Areas, lake Areas, and Snow Lines from 1975 to 2012: Status of the Cordillera Vilcanota, Including the Quelccaya Ice Cap, Northern central Andes, Peru. The Cryosphere 8 (2), 359–376. doi:10.5194/tc-8-359-2014
Hock, R., Bliss, A., Marzeion, B., Giesen, R. H., Hirabayashi, Y., Huss, M., et al. (2019). GlacierMIP - A Model Intercomparison of Global-Scale Glacier Mass-Balance Models and Projections. J. Glaciol. 65 (251), 453–467. doi:10.1017/jog.2019.22
Hugonnet, R., McNabb, R., Berthier, E., Menounos, B., Nuth, C., Girod, L., et al. (2021). Accelerated Global Glacier Mass Loss in the Early Twenty-First century. Nature 592 (7856), 726–731. doi:10.1038/s41586-021-03436-z
Huss, M. (2013). Density Assumptions for Converting Geodetic Glacier Volume Change to Mass Change. The Cryosphere 7 (3), 877–887. doi:10.5194/tc-7-877-2013
Huss, M., and Hock, R. (2018). Global-scale Hydrological Response to Future Glacier Mass Loss. Nat. Clim Change 8 (2), 135–140. doi:10.1038/s41558-017-0049-x
INAIGEM (2017). Informe de la Situación de los Glaciares y Ecosistemas de Montaña en el Perú [Online]. Lima: Instituto Nacional de Investigación en Glaciares y Ecosistemas de Montaña. Available from: https://www.inaigem.gob.pe/wp-content/uploads/2019/04/Interiores-Informe-anual-2017.pdf (Accessed March 3, 2022).
Kaser, G. (1999). A Review of the Modern Fluctuations of Tropical Glaciers. Glob. Planet. Change 22 (1), 93–103. doi:10.1016/s0921-8181(99)00028-4
Kaser, G., and Georges, C. (1997). Changes of the Equilibrium-Line Altitude in the Tropical Cordillera Blanca, Peru, 1930-50, and Their Spatial Variations. A. Glaciology. 24, 344–349. doi:10.1017/s0260305500012428
Kaser, G. (2001). Glacier-climate Interaction at Low Latitudes. J. Glaciol. 47 (157), 195–204. doi:10.3189/172756501781832296
King, O., Bhattacharya, A., Bhambri, R., and Bolch, T. (2019). Glacial Lakes Exacerbate Himalayan Glacier Mass Loss. Sci. Rep. 9 (1), 18145. doi:10.1038/s41598-019-53733-x
King, O., Quincey, D. J., Carrivick, J. L., and Rowan, A. V. (2017). Spatial Variability in Mass Loss of Glaciers in the Everest Region, central Himalayas, between 2000 and 2015. The Cryosphere 11 (1), 407–426. doi:10.5194/tc-11-407-2017
Kochtitzky, W. H., Edwards, B. R., Enderlin, E. M., Marino, J., and Marinque, N. (2018). Improved Estimates of Glacier Change Rates at Nevado Coropuna Ice Cap, Peru. J. Glaciol. 64 (244), 175–184. doi:10.1017/jog.2018.2
Kozhikkodan Veettil, B., Bremer, U. F., de Souza, S. F., Maier, É. L. B., and Simões, J. C. (2016). Variations in Annual Snowline and Area of an Ice-Covered Stratovolcano in the Cordillera Ampato, Peru, Using Remote Sensing Data (1986-2014). Geocarto Int. 31 (5), 544–556. doi:10.1080/10106049.2015.1059902
@@@Veettil, B., and de Souza, S. F. (2017). Study of 40-year Glacier Retreat in the Northern Region of the Cordillera Vilcanota, Peru, Using Satellite Images: Preliminary Results. Remote Sensing Lett. 8 (1), 78–85. doi:10.1080/2150704x.2016.1235811
Kronenberg, M., Schauwecker, S., Huggel, C., Salzmann, N., Drenkhan, F., Frey, H., et al. (2016). The Projected Precipitation Reduction over the Central Andes May Severely Affect Peruvian Glaciers and Hydropower Production. Energ. Proced. 97, 270–277. doi:10.1016/j.egypro.2016.10.072
Lee, H., Shum, C. K., Tseng, K.-H., Huang, Z., and Sohn, H.-G. (2013). Elevation Changes of Bering Glacier System, Alaska, from 1992 to 2010, Observed by Satellite Radar Altimetry. Remote Sensing Environ. 132, 40–48. doi:10.1016/j.rse.2013.01.007
López-Moreno, J. I., Fontaneda, S., Bazo, J., Revuelto, J., Azorin-Molina, C., Valero-Garcés, B., et al. (2014). Recent Glacier Retreat and Climate Trends in Cordillera Huaytapallana, Peru. Glob. Planet. Change 112, 1–11.
Mark, B. G., French, A., Baraer, M., Carey, M., Bury, J., Young, K. R., et al. (2017). Glacier Loss and Hydro-Social Risks in the Peruvian Andes. Glob. Planet. Change 159, 61–76. doi:10.1016/j.gloplacha.2017.10.003
Martínez, E., Drenkhan, F., Zogheib, C., Ochoa-Tocachi, B., and Buytaert, W. (2020). Emerging Water Scarcity Risks In Peruvian Glacier-Fed River Basins [Online]. Rochester, NY: Social Science Research Network. Available from: https://papers.ssrn.com/abstract=3696758 (Accessed March 1, 2022).
Maussion, F., Gurgiser, W., Großhauser, M., Kaser, G., and Marzeion, B. (2015). ENSO Influence on Surface Energy and Mass Balance at Shallap Glacier, Cordillera Blanca, Peru. The Cryosphere 9 (4), 1663–1683. doi:10.5194/tc-9-1663-2015
Miles, E., McCarthy, M., Dehecq, A., Kneib, M., Fugger, S., and Pellicciotti, F. (2021). Health and Sustainability of Glaciers in High Mountain Asia. Nat. Commun. 12 (1), 2868. doi:10.1038/s41467-021-23073-4
Molina, E., Schauwecker, S., Huggel, C., Haeberli, W., Cochachin, A., and Condom, T. (2015). Iniciación de un monitoreo del balance de masa en el glaciar Suyuparina, Cordillera Vilcanota. Perú. Clim. Chang. Trop. Andes. 2 (2), 1–14.
Motschmann, A., Huggel, C., Carey, M., Moulton, H., Walker-Crawford, N., and Muñoz, R. (2020). Losses and Damages Connected to Glacier Retreat in the Cordillera Blanca, Peru. Climatic Change 162 (2), 837–858. doi:10.1007/s10584-020-02770-x
Nuth, C., and Kääb, A. (2011). Co-registration and Bias Corrections of Satellite Elevation Data Sets for Quantifying Glacier Thickness Change. The Cryosphere 5 (1), 271–290. doi:10.5194/tc-5-271-2011
Orlove, B. (2009). The Past, the Present And Some Possible Futures Of Adaptation [Online]. Rochester, NY: Social Science Research Network. Available from: https://papers.ssrn.com/abstract=2240439 (Accessed September 27, 2021).
Paul, F., Barrand, N. E., Baumann, S., Berthier, E., Bolch, T., Casey, K., et al. (2013). On the Accuracy of Glacier Outlines Derived from Remote-Sensing Data. Ann. Glaciol. 54 (63), 171–182. doi:10.3189/2013aog63a296
Perry, L. B., Seimon, A., and Kelly, G. M. (2014). Precipitation Delivery in the Tropical High Andes of Southern Peru: New Findings and Paleoclimatic Implications. Int. J. Climatol. 34 (1), 197–215. doi:10.1002/joc.3679
Prinz, R., Heller, A., Ladner, M., Nicholson, L., and Kaser, G. (2018). Mapping the Loss of Mt. Kenya's Glaciers: An Example of the Challenges of Satellite Monitoring of Very Small Glaciers. Geosciences 8 (5), 174. doi:10.3390/geosciences8050174
Rabatel, A., Francou, B., Soruco, A., Gomez, J., Cáceres, B., Ceballos, J. L., et al. (2013a). Current State of Glaciers in the Tropical Andes: a Multi-century Perspective on Glacier Evolution and Climate Change. The Cryosphere 7 (1), 81–102. doi:10.5194/tc-7-81-2013
Rabatel, A., Letréguilly, A., Dedieu, J.-P., and Eckert, N. (2013b). Changes in Glacier Equilibrium-Line Altitude in the Western Alps from 1984 to 2010: Evaluation by Remote Sensing and Modeling of the Morpho-Topographic and Climate Controls. The Cryosphere 7 (5), 1455–1471. doi:10.5194/tc-7-1455-2013
Racoviteanu, A. E., Arnaud, Y., Williams, M. W., and Ordoñez, J. (2008). Decadal Changes in Glacier Parameters in the Cordillera Blanca, Peru, Derived from Remote Sensing. J. Glaciol. 54 (186), 499–510. doi:10.3189/002214308785836922
RGI Consortium (2017). Randolph Glacier Inventory 6.0. Available from: http://www.glims.org/RGI/randolph60.html (Accessed November 24, 2021).
Roy, S. (2021). Samapriya/Geeup: Geeup: Simple CLI for Earth Engine Uploads [Online]. Zenodo. Available from: https://zenodo.org/record/4852799 (Accessed July 12, 2021).
Sagredo, E. A., and Lowell, T. V. (2012). Climatology of Andean Glaciers: A Framework to Understand Glacier Response to Climate Change. Glob. Planet. Change 86-87 (87), 101–109. doi:10.1016/j.gloplacha.2012.02.010
Salzmann, N., Huggel, C., Rohrer, M., Silverio, W., Mark, B. G., Burns, P., et al. (2013). Glacier Changes and Climate Trends Derived from Multiple Sources in the Data Scarce Cordillera Vilcanota Region, Southern Peruvian Andes. The Cryosphere 7 (1), 103–118. doi:10.5194/tc-7-103-2013
Schauwecker, S., Rohrer, M., Acuña, D., Cochachin, A., Dávila, L., Frey, H., et al. (2014). Climate Trends and Glacier Retreat in the Cordillera Blanca, Peru, Revisited. Glob. Planet. Change 119, 85–97. doi:10.1016/j.gloplacha.2014.05.005
Schauwecker, S., Rohrer, M., Huggel, C., Endries, J., Montoya, N., Neukom, R., et al. (2017). The Freezing Level in the Tropical Andes, Peru: An Indicator for Present and Future Glacier Extents. J. Geophys. Res. Atmos. 122 (10), 5172–5189. doi:10.1002/2016jd025943
Seehaus, T., Malz, P., Sommer, C., Lippl, S., Cochachin, A., and Braun, M. (2019). Changes of the Tropical Glaciers throughout Peru between 2000 and 2016 - Mass Balance and Area Fluctuations. The Cryosphere 13 (10), 2537–2556. doi:10.5194/tc-13-2537-2019
Taylor, L. S., Quincey, D. J., Smith, M. W., Baumhoer, C. A., McMillan, M., and Mansell, D. T. (2021). Remote Sensing of the Mountain Cryosphere: Current Capabilities and Future Opportunities for Research. Prog. Phys. Geogr. Earth Environ. 45 (6), 931–964. doi:10.1177/03091333211023690
Thompson, L. G., Davis, M. E., Mosley-Thompson, E., Porter, S. E., Corrales, G. V., Shuman, C. A., et al. (2021). The Impacts of Warming on Rapidly Retreating High-Altitude, Low-Latitude Glaciers and Ice Core-Derived Climate Records. Glob. Planet. Change 203, 103538. doi:10.1016/j.gloplacha.2021.103538
Thompson, L. G., Mosley-Thompson, E., Davis, M. E., and Brecher, H. H. (2011). Tropical Glaciers, Recorders and Indicators of Climate Change, Are Disappearing Globally. Ann. Glaciol. 52 (59), 23–34. doi:10.3189/172756411799096231
Veettil, B. K., Bremer, U. F., de Souza, S. F., Maier, É. L. B., and Simões, J. C. (2016). Influence of ENSO and PDO on Mountain Glaciers in the Outer Tropics: Case Studies in Bolivia. Theor. Appl. Climatology 125 (3), 757–768. doi:10.1007/s00704-015-1545-4
Veettil, B. K., and Kamp, U. (2021). Glacial Lakes in the Andes under a Changing Climate: A Review. J. Earth Sci. 32 (6), 1575–1593. doi:10.1007/s12583-020-1118-z
Veettil, B. K., and Kamp, U. (2019). Global Disappearance of Tropical Mountain Glaciers: Observations, Causes, and Challenges. Geosciences 9 (5), 196. doi:10.3390/geosciences9050196
Veettil, B. K., Wang, S., Simões, J. C., Ruiz Pereira, S. F., and de Souza, S. F. (2018). Regional Climate Forcing and Topographic Influence on Glacier Shrinkage: Eastern Cordilleras of Peru. Int. J. Climatol 38 (2), 979–995. doi:10.1002/joc.5226
Vilca, O., Mergili, M., Emmer, A., Frey, H., and Huggel, C. (2021). The 2020 Glacial lake Outburst Flood Process Chain at Lake Salkantaycocha (Cordillera Vilcabamba, Peru). Landslides 18 (6), 2211–2223. doi:10.1007/s10346-021-01670-0
Vuille, M., Carey, M., Huggel, C., Buytaert, W., Rabatel, A., Jacobsen, D., et al. (2018). Rapid Decline of Snow and Ice in the Tropical Andes - Impacts, Uncertainties and Challenges Ahead. Earth-Science Rev. 176, 195–213. doi:10.1016/j.earscirev.2017.09.019
Vuille, M., Kaser, G., and Juen, I. (2008). Glacier Mass Balance Variability in the Cordillera Blanca, Peru and its Relationship with Climate and the Large-Scale Circulation. Glob. Planet. Change 62 (1), 14–28. doi:10.1016/j.gloplacha.2007.11.003
Wilson, D. J. (2019). The Harmonic Mean P -value for Combining Dependent Tests. Proc. Natl. Acad. Sci. U.S.A. 116 (4), 1195–1200. doi:10.1073/pnas.1814092116
Wood, J. L., Harrison, S., Wilson, R., Emmer, A., Yarleque, C., Glasser, N. F., et al. (2021). Contemporary Glacial Lakes in the Peruvian Andes. Glob. Planet. Change 204, 103574. doi:10.1016/j.gloplacha.2021.103574
Yarleque, C., Vuille, M., Hardy, D. R., Timm, O. E., De la Cruz, J., Ramos, H., et al. (2018). Projections of the Future Disappearance of the Quelccaya Ice Cap in the Central Andes. Sci. Rep. 8 (1), 15564. doi:10.1038/s41598-018-33698-z
Keywords: Cordillera Vilcanota, Cordillera Urubamba, Cordillera Vilcabamba, ASTER, tropical glacier, mountain cryosphere
Citation: Taylor LS, Quincey DJ, Smith MW, Potter ER, Castro J and Fyffe CL (2022) Multi-Decadal Glacier Area and Mass Balance Change in the Southern Peruvian Andes. Front. Earth Sci. 10:863933. doi: 10.3389/feart.2022.863933
Received: 27 January 2022; Accepted: 07 March 2022;
Published: 22 March 2022.
Edited by:
Neil Franklin Glasser, Aberystwyth University, United KingdomReviewed by:
Fabian Drenkhan, Pontifical Catholic University of Peru, PeruBethan Joan Davies, University of London, United Kingdom
Copyright © 2022 Taylor, Quincey, Smith, Potter, Castro and Fyffe. This is an open-access article distributed under the terms of the Creative Commons Attribution License (CC BY). The use, distribution or reproduction in other forums is permitted, provided the original author(s) and the copyright owner(s) are credited and that the original publication in this journal is cited, in accordance with accepted academic practice. No use, distribution or reproduction is permitted which does not comply with these terms.
*Correspondence: Liam S. Taylor, Z3lsc3RAbGVlZHMuYWMudWs=