- 1Chongqing Meteorological Observation, Chongqing, China
- 2Nanjing Joint Institute for Atmospheric Sciences, Nanjing, China
- 3Key Laboratory of Mesoscale Severe Weather/MOE, School of Atmospheric Sciences, Nanjing University, Nanjing, China
- 4State Key Laboratory of Severe Weather and Joint Center for Atmospheric Radar Research of CMA/NJU, Beijing, China
Based on ground-based Doppler radar data with high spatial and temporal resolution, our study focuses on rapid intensification (RI) of a sheared tropical cyclone (TC). The asymmetric inner-core structure and its impact on RI are presented using the Advanced Regional Prediction System-3DVAR. The time evolution of the TC inner-core characteristics shows that Meranti experiences two stages of RI: the asymmetric dominant period and the axisymmetric dominant period. The comparison between the two RI stages shows that the vortex intensified more in the asymmetric stage than the axisymmetric stage. The wavenumber-1 component introduced by the vertical wind shear dominates the asymmetric structure. In the moderate-to-strong shear environment, deep convection occurs mainly in the downshear-left quadrant, generating substantial diabatic heating in the downshear region. Under a suitable inner-core structure configuration, the downshear vortices are entrained cyclonically inward, resulting in RI. It is the interaction between the axisymmetric inner-core structure of the TC and the mesoscale vortex that controls the intensification process, which can be replicated by the nondivergent barotropic model with a similar initial field. This infrequent case provided observation of RI during a strong shear period, which suggests that the inner core structure is vital for TC RI.
Introduction
Rapid intensification (RI) is defined as a maximum sustained surface wind speed increase of 15 m s−1 (30 kt) over a 24-h period (Kaplan and DeMaria 2003). Forecasting tropical cyclone (TC) intensity is one of the most difficult problems in atmospheric science. Although the intensity guidance of TCs has achieved statistically significant improvements in the past few decades, forecasting RI of TCs remains problematic (Brown 2017). The RI of typhoons often causes significant economic losses, which also makes research on RI a popular and challenging topic at present. Houze (2010) noted that the evolution of small-scale structures in typhoon cores is closely related to RI. From the perspective of the influence of the typhoon core structure on strength, previous studies can be divided into those focused on axisymmetric and asymmetric TC structures.
In axisymmetric structures, eyewall contraction and diabatic heating near the radius of maximum wind (RMW) are important manifestations of RI of TCs. According to the literature, depending on the model, Li et al. (2021) indicated that diabatic heating inside the RMW and radial inflow near the RMW increase, leading to a substantial increase in radial absolute vorticity flux near the RMW and thus rapid TC intensification. Nolan and Grasso (2003) and Nolan et al. (2007) found that even if diabatic heating shows a significant asymmetric distribution, its projection in the axisymmetric direction can still determine the strengthening intensity of TC. It is not simply the presence or even the amount of diabatic heating, but the radial location and the symmetry of precipitation that are more important to RI onset (Chen et al., 2018). In recent years, with the continuous improvement and enrichment of radar, satellite, drop sounding, and other observation technologies, the understanding of the TC inner core structure and its influence on intensity change has been constantly improving. In particular, ground-based radar is the only high spatial-temporal resolution remote sensing platform that can continuously observe the three-dimensional structure of offshore TCs. Since the establishment of the WSR-88D radar network in the United States and the CINRAD WSR-98D ground-based radar network in China, many radar observation data of offshore RI of TCs have been collected. Statistical analysis of the best-track data for the North Atlantic between 2000 and 2017 indicates that convective heating associated with deep convective clouds appearing toward the storm center is important for RMW contraction, and sufficient amounts of convective heating are important for intensification (Wu and Ruan 2021). Case studies of hurricanes (e.g., Blackwell 2000; Lee and Bell 2007; Zhao et al., 2008) also revealed the process and related mechanism of axisymmetric RI. In addition to ground-based radar, studies using satellite observations (Lin and Qian 2019) and airborne radar (Black et al., 1996; Rogers et al., 2013) have discussed the structural characteristics of RI of TCs.
The asymmetric structure also has an important influence on the TC strength. Generally, the main factors causing the asymmetric structure include environmental vertical wind shear (VWS), movement, sea and land impact, and vortex Rossby waves. Under a strong VWS, the large value area of wavenumber-1 energy mainly appears in the downshear-left quadrant (Corbosiero and Molinari 2002; 2003). Further studies indicate that the lightning active area in the TC core narrowed if VWS increased (Abarca et al., 2011). When the VWS is small, the effect of the TC movement on the energy distribution of wavenumber-1 becomes significant (Corbosiero and Molinari 2003; Lonfat et al., 2004; Chen et al., 2006). Generally, VWS is the main factor that determines the convection asymmetry in the eyewall, and factors such as movement velocity only adjust the convection distribution (Hence and Houze 2011; 2012). Some studies have shown that moderate to strong shear can contribute to intensification through the occurrence of vigorous deep convection, called convective bursts, inside the RMW on the downshear side (Reasor et al., 2009; Molinari and Vollaro 2010; Nguyen and Molinari 2012; Shimada and Horinouchi 2018). Sitkowski and Barnes (2009) further found that when RI occurred, convection to the left of the downwind quadrant was repeatedly entrained into the vortex center. Such asymmetric junctions have been observed in many rapidly intensifying TC observations (e.g., Corbosiero and Molinari 2003; Chen et al., 2006; Ryglicki et al., 2021) and model literature (e.g., Frank and Ritchie 2001; Xu and Wu 2005; Riemer et al., 2010). The contribution of these strong convective bursts to RI is mainly reflected in two aspects: 1) The adiabatic warming of the upper descending branch is conducive to the formation of the upper warm center. According to the static equation, the upper warm center will more effectively reduce the pressure in the typhoon center, and the gradient force of the lower pressure increases, forcing the inflow strength, facilitating angular momentum convergence to the typhoon center, and accelerating the main circulation (Guimond et al., 2010). 2) The vertical stretching of the vortex tube caused by diabatic heating of the convective position and the subsequent axial symmetry of the horizontal vorticity accelerate the main circulation.
Although previous studies have discussed several asymmetric mechanisms that may lead to RI, such as vortical hot towers (Hendricks et al., 2004; Montgomery et al., 2006; Reasor et al., 2009) and the transition from asymmetric structure to axisymmetric structure (Schubert et al., 1999; Kossin and Schubert 2001; Persing and Montgomery 2003; Cram et al., 2007), these enhancement mechanisms are mainly based on model simulation results or airborne radar data analysis. In the past, due to the lack of observational data, a numerical simulation method was used to discuss the case study of RI of TCs in the coastal areas of China, which lacked high spatial and temporal structure observations and quantitative analysis of RI typhoon inner cores. With the recent deployment of the Chinese next generation Weather Surveillance Radar 1998 Doppler (CINRAD WSR-98D) network and the Taiwan operational radar network, effective assimilation of high-resolution data from these radar systems into numerical weather prediction models for improving landfall of TC structure analysis provides foundational support for the study of mesoscale structural characteristics of the rapidly intensifying TC inner cores in the northwest Pacific Ocean. Meanwhile, the continuous development of Doppler radar wind field inversion technology and numerical models also provides a reliable analysis method for quantitative study of the inner core structure and evolution characteristics of offshore rapidly intensifying TCs. For example, Zhao et al. (2012) used Advanced Regional Prediction System (ARPS)-3DVAR to assimilate multiple radar data, significantly improved the analysis and forecast field of TC Meranti (2010) through cyclic assimilation analysis, and accurately reproduced the RI process of Meranti. The establishment of an observation network and the improvement in model analysis methods are helpful in studying the time evolution of inner core characteristics and the RI mechanism of offshore RI typhoons, and compensates for the shortcomings of research on offshore RI typhoons in China. TC Meranti was mainly located in the Taiwan Strait, and the Ken-Ting radar (RCKT), Chi-Gu radar (RCCG), and Xiamen radar (XMRD) were able to observe its internal structure at a relatively close distance. Observation data with high spatial and temporal resolution can provide 3D wind field inversion by dual Doppler radar in the early RI period, providing vital support for the ARPS-3DVAR cycle assimilation.
In this study, we show the asymmetric inner-core structure and evolution of TC Meranti (2010) during its RI stage based on observational analysis. A nondivergent barotropic model and sensitivity test are used to discuss the effect of the asymmetric structure on the TC RI. The data and analysis methods used are described in the Data and Methods section. The TC Meranti section provides a brief overview of the path and intensity evolution of Meranti (2010). The characteristics of the asymmetric inner-core structure evolution section identifies the inner-core structure of TC Meranti and reasonable underlying mechanism. A possible mechanism of RI introduced by the asymmetric inner-core structure is discussed in the nondivergent barotropic model and sensitivity test section, followed by a summary.
Data and Methods
Data
In this study, radar data from three S-band coastal Doppler radars were used, including one CINRAD WSR-98D radar (XMRD) along the southeast coast of mainland China and two Gematronik 1500S Doppler radars (RCCG & RCKT) on Taiwan Island (Figure 1A). All operated with the same volume coverage pattern 21 (VCP21) scanning mode of the WSR-88D in the United States, which can perform a 6-min volume scan and provide radar reflectivity and radial velocity data with observation ranges of 230 km, and radial resolutions of 1 and 0.25 km, respectively. The data were examined and edited manually using the National Center for Atmospheric Research software “SOLOII” (Oye et al., 1995). Subsequently, radar data were interpolated from polar coordinates to Cartesian coordinates using the bilinear interpolation method.
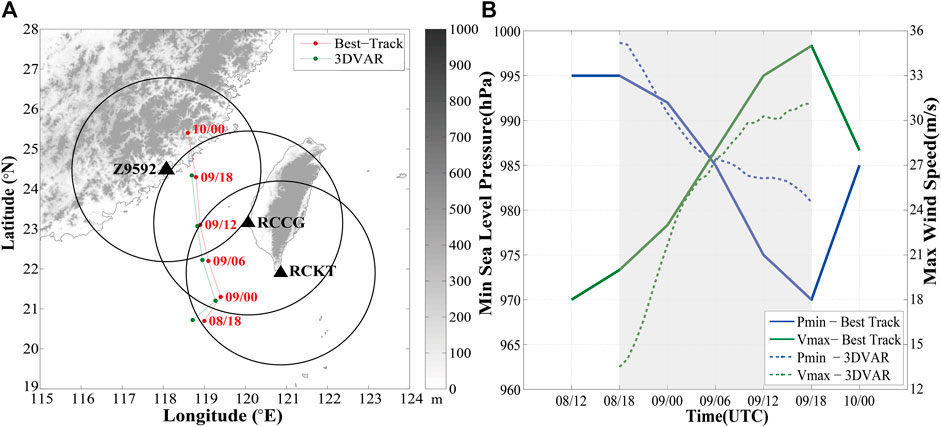
FIGURE 1. Path and intensity information of Meranti. (A) The analysis domain at 3 km horizontal grid spacing, with the CMA best track (red) and APRS-3DVAR locations (green) of Meranti marked at 6 h intervals from 18:00 UTC September 8, to 0:00 UTC 10 September 2010. (B) The intensity evolution of TC Meranti, the green (blue) line represents wind speed (sea level pressure), and the solid lines and dotted lines are based on CMA and ARPS-3DVAR, respectively.
Typhoon center data come from the Typhoon Best Track dataset compiled by the Shanghai Typhoon Research Institute of the China Meteorological Administration (CMA), which can provide historical data such as longitude and latitude of the typhoon center every 6 h. The environmental VWS is based on the National Centers for Environmental Prediction (NCEP) Climate Forecast System Reanalysis (CFSR) data (Saha et al., 2010), which are available at 37 vertical levels from 1,000 hPa to one hPa with a grid spacing of 0.5° latitude × 0.5° longitude at 6-h intervals. The 200–850 hPa VWS is calculated using the averaged azimuthal mean Cartesian wind components between 300 and 800 km radii from TC center. The choice of the area average for environmental VWS is optimal for TCs over South China Sea (Chen et al., 2015). The formula for the environmental average wind after considering the area weight is as follows:
where U and V are the wind field grid data in a large-scale environmental field, A represents the total area, i is the distance coefficient, the bandwidth of each distance ring is 100 km, Ai is the area of the ith distance ring, and n is the value range of the large-scale environment (e.g., when calculating 500 km, i is 5).
Methods
The nonhydrostatic ARPS with full physics was used for the analysis of “real” wind fields with radar data assimilation. A domain of 1830 × 1830 × 25 km was used, consisting of 611 × 611 × 53 grid points with a 3 km horizontal grid spacing and varying vertical resolutions ranging from 50 m at the surface to 770 m at the top of the model. The initial analysis background and lateral boundary conditions (LBCs) were from the NCEP CFSR data. The physics options, e.g., Lin ice microphysics, Goddard longwave and shortwave radiation, a 2-layer soil model, and the turbulent kinetic energy (TKE)-based subgrid-scale turbulence and planetary boundary layer (PBL) parameterizations, were used in this study (Xue et al., 2001). Detailed parameters and configuration of the ARPS can be found in Zhao et al. (2012). The model started at 18:00 UTC on 8 September 2010, and radar data were cyclically assimilated every hour until 18:00 UTC 9 September 2010. The analysis time selected in this study covers the main life stage of TC Meranti from initial generation to near landfall. From 1:00 UTC 9 September 2010, Meranti entered the observation range of the dual Doppler radar, which provided excellent observation data for studying the RI of typhoons with strong asymmetric structures in a sheared environment. Thus, analysis before 1:00 UTC focused on radar echo data, and physical quantities such as velocity and vorticity were used after 1:00 UTC.
A high-resolution quasi-geostrophic barotropic model was used to reveal the interaction between typhoon axisymmetric circulation and asymmetric disturbance. For Meranti, the wind field provided analysis by the ARPS-3DVAR helped to approach a more realistic initial field, thus exploring the main mechanism of asymmetric vorticity entrained and acceleration of the main circulation. The two-dimensional non-divergent quasi-geostrophic vorticity equation on the f-plane is expressed as follows (Luo 2003):
where Ψ represents the geostrophic steam function, J represents the Jacobi operator, and γ is the dissipation coefficient. This formula is similar to that of Kossin and Schubert (2001). Detail of the main parameters of barotropic model are available in Table 1.
Overview of TC Meranti
Meranti formed a tropical depression east of Taiwan on 7 September 2010 and moved southwest immediately afterward. It intensified into a tropical storm by 6:00 UTC on September 8, then turned and moved northward. It underwent RI from 18:00 UTC September 8 to 18:00 UTC September 9, with the maximum surface wind speed increasing from 20 m s−1 to 35 m s−1 when approaching landfall according to the official best-track data from CMA. The TC weakened rapidly after the landfall at 19:30 UTC (Figure 1A). The intensity evolution of Meranti is shown in Figure 1B, where the solid and dotted lines represent the maximum wind speed (green) and minimum sea level pressure (blue) from the CMA optimal path dataset and APRS-3DVAR analysis, respectively. Due to the small scale of the TC and far distance from radar, ARPS-3DVAR analysis begins at 18:00 UTC September 8, and represents an underestimation of 7 m s−1 compared with CMA. After the ARPS-3DVAR analysis, the maximum tangential wind speed approached the CMA best-track data set. After 0:00 UTC, the analysis field was consistent with the CMA results. After 12:00 UTC September 9, the intensity of CMA was 3 m s−1 stronger than that of ARPS-3DVAR. Zhao et al. (2012) indicated that the CMA best-track dataset overestimated typhoon intensity to a certain extent, which may be the reason for the difference between the CMA and the analysis field. Although there are some differences between the CMA and 3DVAR analysis fields, some basic characteristics of evolution over time are shown. The analysis maximum wind speed from APRS-3DVAR increased from 13 m s−1 to 31 m s−1, and the wind speed increased by 18 m s−1 within 24 h (CMA was 15 m s−1), which approximates the definition of Kaplan and DeMaria (2003) on TC RI. The CMA and 3DVAR analysis field also indicated that the strengthening rate of Meranti was not the same throughout the RI period. The wind speed increased from 13 m s−1 (20 m s−1, according to CMA) to 28 m s−1 (same for ARPS-3DVAR and CMA) within 12 h before 6:00 UTC September 9. Later, the strength increased from 28 m s−1 to 32 m s−1 (35 m s−1, according to CMA) at a slower rate than before.
Characteristics of Asymmetric Inner-Core Structure Evolution
RI of Meranti lasted from 18:00 UTC 8 September 2010, to 18:00 UTC 9 September 2010, and the entire RI process was observed by radar (Figure 1A). Figure 2 shows the radar reflectivity factor detected by radar observations at an elevation of 0.5°. At 18:00 UTC September 8, the radar reflectivity factor was crescent, mainly distributed in the southeast semicircle of the TC center, and the echo intensity in the south was obviously weaker than that in the east. Meanwhile, the VWS of 200 hPa–850 hPa was 11.2 m s−1. The strongest echo appeared on the left side of the downwind quadrant. At 21:00 UTC September 8, the echo near the circulation center still showed an obvious asymmetric structure, and the strong echo in the east was further expanded and enhanced. The strong echo moved tangentially counterclockwise, approaching the TC center in the radial direction. The VWS weakened significantly at 0:00 UTC September 9, with a magnitude of 7 m s−1. Meanwhile, the Meranti echo still demonstrated an asymmetric structure, accompanied by a weakening of the radar echo and a movement to the north side of the TC center. At 3:00 UTC, the TC eyewall was obviously axisymmetric compared with before, although the pattern was not completely demonstrated. After 3 h, the rain belt developed southwest of the TC center, and the VWS was reduced to 2.6 m s−1. From 9:00 to 12:00 UTC on September 9, the eyewall of Meranti was basically linked. At 12:00 UTC, VWS was only 1.8 m s−1. At this point, Meranti essentially completed the axial symmetry, and the outer rain band weakened immediately. From 15:00 to 18:00 UTC, the inner-core echo structure generally remained stable and axisymmetric, and its intensity increased slightly.
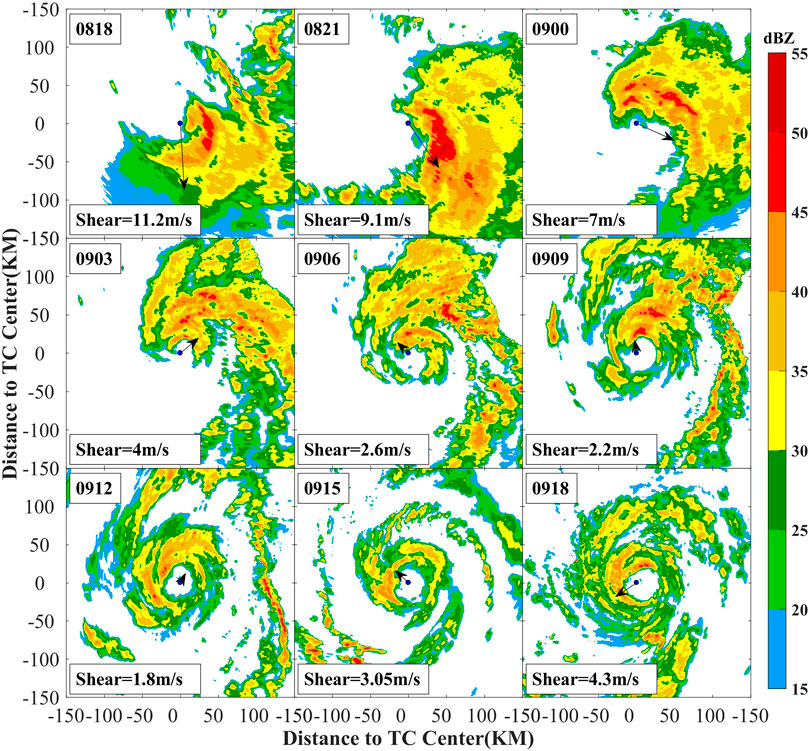
FIGURE 2. Time evolution of radar reflectivity factor observed at 0.5° elevation during the RI period every 3 h. The black point in the center for each figure represents the TC center. Wind shear is superimposed on TC center in form of an arrow and indicated in the lower left corner.
Figure 2 qualitatively demonstrates the characteristics of Meranti’s inner-core structure: strong asymmetry in the early stage and then becoming axisymmetric. To quantitatively describe the difference between the two stages, Figure 3 shows the time evolution characteristics of each wave number energy (Figure 3A) of the echo near the RMW, the area percentage of strong convection in the core area, and VWS (Figure 3B) during the RI period. Here, “near RMW” denotes the radial range within ±10 km of the RMW which is a radius that varies with time. Strong convection is defined as a radar reflectivity factor of ≥40 dBZ at 5 km. To obtain the energy distribution of each wave number for TC Meranti, the echo on the contour plane at a height of 3 km uses Fourier decomposition with the typhoon center as the origin. When calculating the Fourier decomposition, referring to the method of Lonfat et al. (2004), the Fourier series expansion is carried out for the echo along the azimuth for the radar reflectivity factor on each radius of the core area on each distance circle:
where R is the reflectivity factor on the CAPPI plane;
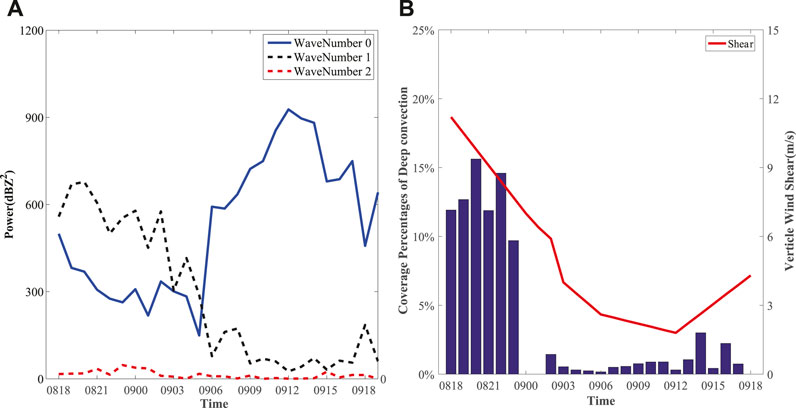
FIGURE 3. Time evolution characteristics of wave number energy (A) of the echo near the maximum wind speed radius, and area percentage of strong convection in the core area overlying with vertical wind shear (B).
To reveal the source of strong asymmetric energy in the early stage of Meranti RI, the wind shear direction and movement direction corresponded to the radar echo at 3 km near the eyewall. Figure 4 indicates that the tendency of the radar echo gradually becomes axisymmetric during the RI period. Before 6:00 UTC, the echo near the eyewall was very strong. Subsequently, it was largely symmetrical. This is the exactly asymmetric stage and axisymmetric stage mentioned in the previous analysis. In the asymmetric stage, Meranti experienced a strong VWS, and the echo showed an obvious wavenumber-1 distribution. Strong convection was located on the left side of the downwind shear and on the right side of the TC movement. The motion effect arises from asymmetric frictional forcing in the boundary layer. Slab boundary layer model showed that the convergence concentrated in the right-front quadrant accompanied by the increase of moving speed (Shapiro, 1983). Corbosiero and Molinari (2002) indicated a strong vertical wind shear influence on convective asymmetries, with downshear to downshear left maxima in the core. Both effects exist only because storm motion is closely coupled to vertical wind shear. Furthermore, the well-documented effect of storm motion on convective asymmetries is largely a reflection of the much stronger vertical shear effect, which means wavenumber-1 is mainly introduced by VWS (Corbosiero and Molinari, 2002; 2003). In the axisymmetric stage, this relationship became insignificant with a decrease in the wind shear. This shows that the abundant asymmetric energy in the early stage of RI was associated with asymmetric convection induced by VWS and movement.
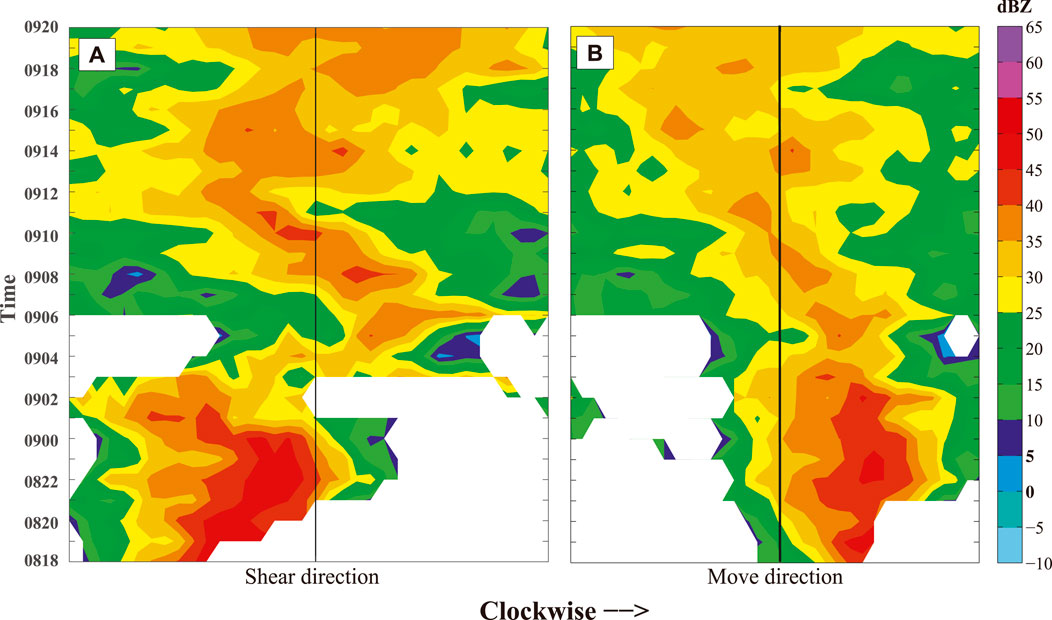
FIGURE 4. Corresponding relationship between location of radar echo near eyewall and wind shear direction (A) or movement direction (B).
As shown in Figure 3, wavenumber-1 dominated the asymmetric stage. The motion of radar echo wavenumber-1 at 3 km from 20:00 to 23:00 UTC is shown in Figure 5. For convenience, the VWS direction is uniformly adjusted to the right, and the arrow length indicates the magnitude of the VWS. The black dot indicates the position of the maximum amplitude of wavenumber-1, with the label of intensity and distance from the TC center. The dotted circle represents the distance to the TC center, marking from 10 to 60 km with an interval of 10 km. It can be seen from the figure that the moderate VWS ensured that the amplitude of the wavenumber-1 component of the reflectivity factor always maintained a high level from 20:00 to 23:00 UTC. At 20:00 UTC, the maximum amplitude of wavenumber-1 appeared 40 km from the TC center in the downshear-left quadrant, with an amplitude of 27 dBZ. After 1 hour, the position of maximum wavenumber-1 amplitude was generally stable, with a small amount of counterclockwise displacement in the tangential direction (relative to the circulation center, the same below). Subsequently, the tangential counterclockwise movement was maintained, and radial centripetal motion was enhanced at 22:00 UTC. Finally, at 23:00 UTC, the maximum amplitude of wavenumber-1 was entrained counterclockwise inward to only 25 km from the TC center. Although the maximum amplitude moved to the upper right quadrant, outside it, the large value area of wavenumber-1 was still located in the downshear-left quadrant, which indicates that moderate VWS continuously promoted new convection and released latent heat to provide energy for asymmetric wavenumber-1. Despite the decrease in VWS from 9.8 m s−1 to 7.7 m s−1, the location of the high-value area of wavenumber-1 energy was locked on the downshear-left quadrant, combined with a slight decrease in strength. In general, the maximum amplitude of wavenumber-1 showed a trend of tangential cyclonic rotation with radial inward motion, which is very similar to the characteristics of tropical storm Gabrielle (2001), in which RI under a strong VWS was observed (Molinari and Vollaro, 2010).
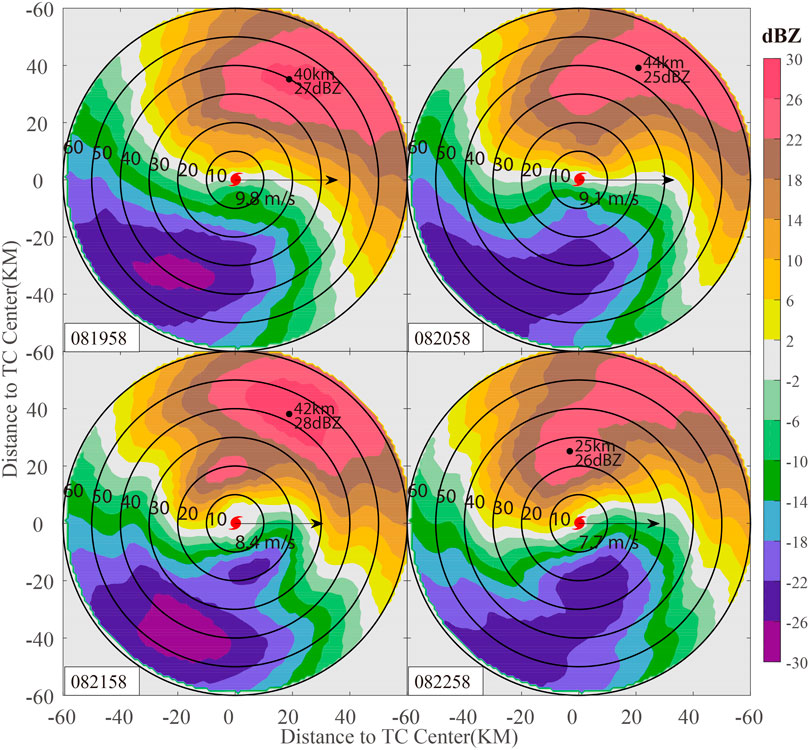
FIGURE 5. Wavenumber-1 component of the radar echo according to Fourier decomposition at 3 km during 20:00 to 23:00 UTC. The VWS direction is uniformly adjusted to the right, and the arrow length indicates the size of the VWS. The black dot indicates the position of the maximum amplitude of wavenumber-1, with the label of intensity and distance from TC center. The dotted circle represents the distance to the TC center, marking from 10 to 60 km at intervals of 10 km.
Because the radar echo movement cannot completely represent the real wind field, the wind field analysis obtained by APRS-3DVAR is also needed to analyze the inner core dynamics and RI mechanism in the asymmetric stage. The core area entered the dual radar observation area after 1:00 UTC on September 9. According to the retrieval wind field, Figure 6 shows the streamline and vorticity field (color scale) at a height of 3 km from 1:00 to 4:00 UTC on September 9. The solid blue point in the figure represents the approximate center of Meranti. At 0:00 UTC September 9, the maximum vorticity appeared on the northeast side of the circulation center, presenting a long elliptical distribution, approximately 30 km away from the TC center, with an intensity of 2.9 × 10⁻³ s−1. After 1 hour, the strongest vorticity moved northwest of the circulation center. At this time, new vorticity values were continuously generated on the northeast side. At 3:00 UTC, the maximum vorticity at the previous moment was absorbed by the base flow, while the vorticity northeast of the TC center was strengthened and appeared at a closer distance to the TC center (approximately 20 km). Finally, the axisymmetric vorticity was completed at 4:00 UTC, which indicated that the maximum vorticity center coincided with the circulation center. Several strong mesoscale vorticities interacted with the TC circulation vorticity and finally merged. The phenomenon of mutual rotation is counterclockwise and cyclonic in the tangential direction. In the radial direction, mesoscale vorticities approached the TC circulation vorticity, and eventually merged in. This motion is consistent with the tangential cyclonic rotation with radial inward motion shown in Figure 5.
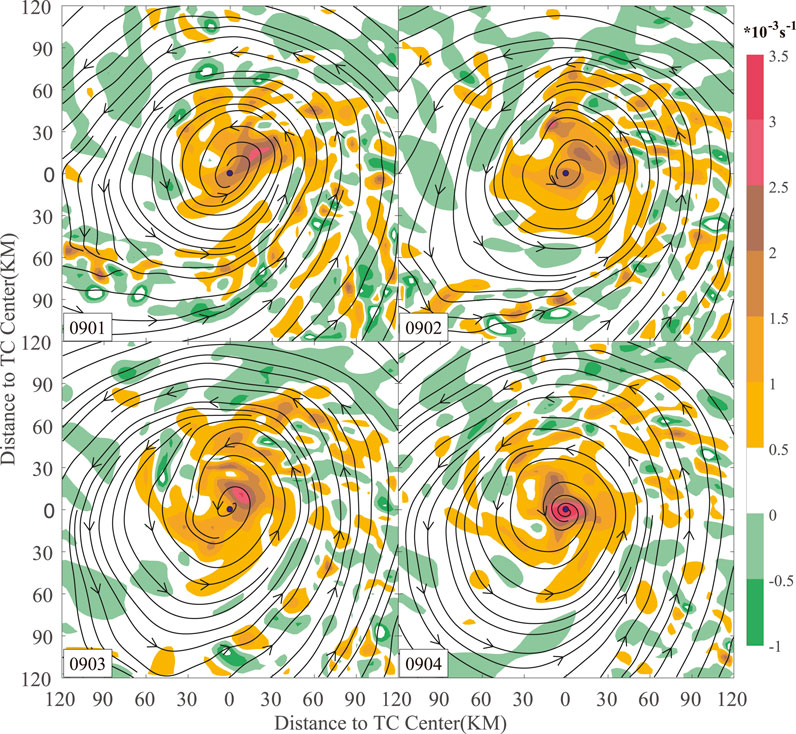
FIGURE 6. Streamlines at 3 km and vorticity field (color scale) of Meranti core region from 1:00 to 4:00 UTC September 9. The solid blue point represents the approximate center of Meranti.
Xu and Wu (2005) used model and vorticity equation diagnostic method to explain the relationship between the asymmetric flow pattern and main circulation intensity. If wavenumber-1 is cyclonic inflow or anticyclonic outflow, the exchange of the asymmetric to symmetric accelerate the main circulation. In order to verify the correctness of the above conclusion in RI of Meranti, a nondivergent barotropic model and sensitivity test are used in the following section.
Nondivergent Barotropic Model and Sensitivity Test
Although boundary layer and moist processes certainly play an essential role in the evolutions of TCs, it is nevertheless meaningful to consider the role of conservative processes in the absence of additional physics. Such additional, and possibly extraneous, physics can obscure fundamental mechanisms, introduce parameterizations, compromise numerical resolution and dynamical accuracy (Kossin and Schubert, 2001). Meranti’s wind field is mainly captured by dual-Doppler radar, which minimum observed altitude is about 3 km according to radar altimetry equation. It is over the height of boundary layer. The lack of reliable data of divergent processes limits the discussion of boundary layer. Thus, a nondivergent barotropic model was used to reveal the interaction between the typhoon axisymmetric vorticity and asymmetric mesoscale vorticity. On the premise that similar results can be roughly simulated, the simpler the model is, the more critical process of RI is grasped. The initial field steam function was composed of the background field steam function
where
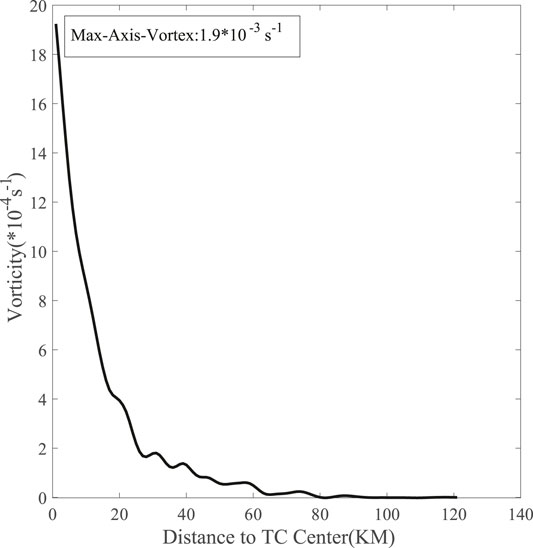
FIGURE 7. Vorticity profile of axisymmetric circulation (wave component 0) at 1:00 UTC 9 September 2010.
The simulation results of the nondivergent barotropic model are shown in Figure 8, where the vorticity field is colored and the black dot in the center represents the TC center at the initial moment (1:00 UTC 9 September 2010). Comparing the simulation results and the ARPS-3DVAR analysis field hourly, it can be found that: 1) The positions of large vorticity values basically correspond. 2) The nondivergent barotropic model can recreate the vorticity enhancement of the TC axisymmetric circulation to a certain extent. 3) The tangential cyclonic rotating and radial approaching processes between the TC vortex and mesoscale vortex can be reproduced distinctly. This means that the dynamic interaction between the TC vortex and mesoscale vortex is a reasonable explanation for their tangential cyclonic rotation with radial inward motion, which is associated with the RI of Meranti. Obviously, the real RI process is more complex than that shown by the simulation results. For example, the mesoscale vorticity gradually weakened after 1:00 UTC, and new vorticity was excited in the downshear-left quadrant, forming a new strong asymmetric structure and interacting with the typhoon vortex again. During this process, the location of the typhoon circulation center and mesoscale vortex kept approaching, which was caused by the interaction of the two vortices.
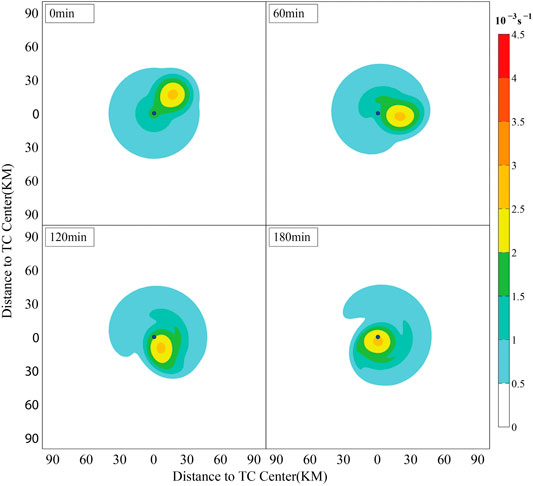
FIGURE 8. Evolution of vorticity produced by nondivergence barotropic model within 3 h (corresponding with 1:00 to 4:00 UTC in Figure 6).
Sensitivity tests were used to further demonstrate the dynamic interaction between the mesoscale vortex and typhoon axisymmetric circulation. The typhoon circulation vorticity in the experiment was consistent with that in the original experiment, and only the intensity and distance of the mesoscale vortex were adjusted. In Figure 9, rows A and B indicate that the distance between the mesoscale vortex and TC center is increased by two or three times that of the original, respectively. As shown in the figure, although the mesoscale vortex is tangential cyclonic rotated with a radial inward motioning to TC center, the strength of the axisymmetric TC vortex does not increase significantly and is manifested as a thready distribution of peripheral vorticity. Rows C and D mainly adjust the strength of the mesoscale vortex. The results show that both of the mesoscale vortexes merge into TC center, combined with the enhancement of axisymmetric vorticity. Stronger mesoscale vortices are associated with a more significant enhancement effect. The sensitivity tests indicate that in the same typhoon circulation, the distance and intensity of the mesoscale vortex play a key role in the occurrence of RI.
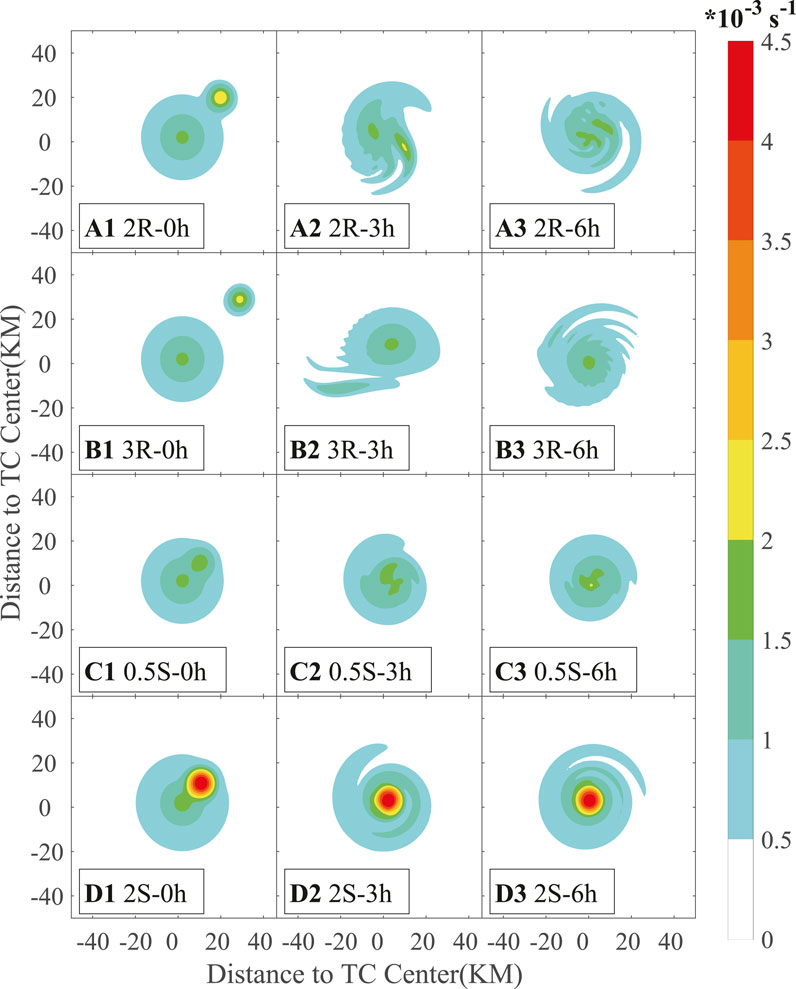
FIGURE 9. Simulation results of nondivergent barotropic model sensitivity tests. The first, second, and third columns represent the integration times of 0, 3, and 6 h, respectively. Rows (A–D) represent the four situations in which the distance doubles, triples, the mesoscale vortex strength is halved, and the mesoscale vortex is doubled in strength, respectively.
A preliminary summary of Meranti’s asymmetric strengthening process is as follows. Although the deviation of the warm core caused by strong VWS is not conducive to TC enhancement, VWS can also provide a favorable environment for the development of convection in the downshear-left quadrant. The emergence of this convection is accompanied by substantial diabatic heating, so that sheared TCs are often rich in abundant energy in the wavenumber-1 structure (similarly, asymmetric vorticity is also strong at this time). The dynamic structure of the TC inner core is one of the key factors affecting the axisymmetrization of the asymmetric energy (vorticity). If there is a suitable initial field (reasonable distance from the TC center and sufficient asymmetric vortex strength), tangential cyclonic rotation with radial inward movement will introduce the energy in wavenumber-1 converted into axisymmetric energy through wave–flow interaction, which is associated with RI in the asymmetric stage.
Summary
Few rapidly intensifying TCs with obvious asymmetric structures are captured in the northwest Pacific Ocean by ground-based radar, which provides high spatial-temporal resolution data. TC Meranti in 2010 provides a good opportunity to reveal the effect of inner-core dynamic structure on RI. Radar echo data indicate that the RI process can be divided into two stages due to the reduction in VWS: an asymmetric dominant stage and an axisymmetric dominant stage, and the vortex intensified more in the asymmetric stage than the axisymmetric stage.
This study focuses on the asymmetric inner-core structure evolution and notes that the asymmetry is dominated by wavenumber-1, which is associated with VWS and TC motion. During the asymmetric stage, strong asymmetric vortices are continuously excited in the downshear-left quadrant, and cyclonic vortices merge into TC center. This phenomenon was confirmed with both the radar echo and vorticity field data retrieved using ARPS-3DVAR. An increase in the wavenumber-0 vorticity indicates an increase in TC intensity. Observations show that the wavenumber-0 vorticity in TC Meranti increased significantly after the axisymmetrization of strong asymmetric vorticity. To explore this mechanism, a nondivergent barotropic model was used, and the process of asymmetric vortex cyclonic inward movement and axisymmetric vorticity enhancement modeled. Sensitivity tests further showed that the intensity and position of the asymmetric vortex are the key factors in determining whether the vorticity of wavenumber-0 is strengthened. Absolutely, besides the influence of asymmetric vortex, Meranti’s RI also involves other mechanisms including internal and external dynamics which can not be ignored.
In this study, an idealization of the retrieved vorticity was used to drive a nondivergent barotropic model. It is shown that the dynamic interaction between asymmetric vorticity and TC axisymmetric vorticity was vital for RI in the early stage of Meranti, which provides a possible explanation for the RI of typhoons with strong asymmetric structures.
Data Availability Statement
Publicly available datasets were analyzed in this study. This data can be found here: http://tcdata.typhoon.org.cn/en/ https://data.ucar.edu/dataset/ncep-climate-forecast-system-reanalysis-cfsr-6-hourly-products-january-1979-to-december-2010.
Author Contributions
KZ designed the research. BL performed data analyses and prepared the figures. BL and MW wrote the manuscript. KZ discussed the results and commented on the manuscript.
Funding
This work was jointly supported by the Technology Innovation and Application Development Key Project of Chongqing (cstc2019jscx-tjsbX0007), the Natural Science Foundation of Chongqing (cstc2021jcyj-msxmX1007), the National Natural Science Foundation of China (41975123), the Chongqing Science and Technology Commission technology innovation and application demonstration project (cstc2019jscx-msxmX0297), and the Innovation team project of Chongqing Meteorological Bureau (ZHCXTD-202003; ZHCXTD-202023).
Conflict of Interest
The authors declare that the research was conducted in the absence of any commercial or financial relationships that could be construed as a potential conflict of interest.
Publisher’s Note
All claims expressed in this article are solely those of the authors and do not necessarily represent those of their affiliated organizations, or those of the publisher, the editors and the reviewers. Any product that may be evaluated in this article, or claim that may be made by its manufacturer, is not guaranteed or endorsed by the publisher.
Acknowledgments
We would like to express our gratitude to CMA Shanghai Typhoon Institute and U.S. NCAR to provide the reanalysis data. Thanks also go to Chen Xiaomin for improving the presentation of our results.
References
Abarca, S. F., Corbosiero, K. L., and Vollaro, D. (2011). The World Wide Lightning Location Network and Convective Activity in Tropical Cyclones. Monthly Weather Rev. 139 (1), 175–191. doi:10.1175/2010MWR3383.1
Black, M. L., Burpee, R. W., and Marks, F. D. (1996). Vertical Motion Characteristics of Tropical Cyclones Determined with Airborne Doppler Radial Velocities. J. Atmos. Sci. 53 (13), 1887–1909. doi:10.1175/1520-0469(1996)053<1887:vmcotc>2.0.co;2
Blackwell, K. G. (2000). The Evolution of Hurricane Danny (1997) at Landfall: Doppler-Observed Eyewall Replacement, Vortex Contraction/Intensification, and Low-Level Wind Maxima. Mon. Wea. Rev. 128 (12), 4002–4016. doi:10.1175/1520-0493(2000)129<4002:teohda>2.0.co;2
Brown, D. (2017). Tropical Cyclone Intensity Forecasting: Still a Challenging Proposition. Natl. Hurricane Cent. Presentation. Available at: https://www.nhc.noaa.gov/outreach/presentations/NHC2017_IntensityChallenges.pdf.
Chen, S. S., Knaff, J. A., and Marks, F. D. (2006). Effects of Vertical Wind Shear and Storm Motion on Tropical Cyclone Rainfall Asymmetries Deduced from TRMM. Monthly Weather Rev. 134 (11), 3190–3208. doi:10.1175/MWR3245.1
Chen, X., Wang, Y., and Zhao, K. (2015). Synoptic Flow Patterns and Large-Scale Characteristics Associated with Rapidly Intensifying Tropical Cyclones in the South China Sea. Monthly Weather Rev. 143 (1), 64–87. doi:10.1175/MWR-D-13-00338.1
Chen, X., Xue, M., and Fang, J. (2018). Rapid Intensification of Typhoon Mujigae (2015) under Different Sea Surface Temperatures: Structural Changes Leading to Rapid Intensification. J. Atmos. Sci. 75 (12), 4313–4335. doi:10.1175/JAS-D-18-0017.1
Corbosiero, K. L., and Molinari, J. (2002). The Effects of Vertical Wind Shear on the Distribution of Convection in Tropical Cyclones. Mon. Wea. Rev. 130 (8), 2110–2123. doi:10.1175/1520-0493(2002)130<2110:teovws>2.0.co;2
Corbosiero, K. L., and Molinari, J. (2003). The Relationship between Storm Motion, Vertical Wind Shear, and Convective Asymmetries in Tropical Cyclones. J. Atmos. Sci. 60 (2), 366–376. doi:10.1175/1520-0469(2003)060<0366:trbsmv>2.0.co;2
Cram, T. A., Persing, J., Montgomery, M. T., and Braun, S. A. (2007). A Lagrangian Trajectory View on Transport and Mixing Processes between the Eye, Eyewall, and Environment Using a High-Resolution Simulation of Hurricane Bonnie (1998). J. Atmos. Sci. 64 (6), 1835–1856. doi:10.1175/JAS3921.1
Frank, W. M., and Ritchie, E. A. (2001). Effects of Vertical Wind Shear on the Intensity and Structure of Numerically Simulated Hurricanes. Mon. Wea. Rev. 129 (9), 2249–2269. doi:10.1175/1520-0493(2001)129<2249:eovwso>2.0.co;2
Guimond, S. R., Heymsfield, G. M., and Turk, F. J. (2010). Multiscale Observations of Hurricane Dennis (2005): The Effects of Hot Towers on Rapid Intensification. J. Atmos. Sci. 67 (3), 633–654. doi:10.1175/2009JAS3119.1
Hence, D. A., and Houze, R. A. (2011). Vertical Structure of Hurricane Eyewalls as Seen by the TRMM Precipitation Radar. J. Atmos. Sci. 68 (8), 1637–1652. doi:10.1175/2011JAS3578.1
Hence, D. A., and Houze, R. A. (2012). Vertical Structure of Tropical Cyclone Rainbands as Seen by the TRMM Precipitation Radar. J. Atmos. Sci. 69 (9), 2644–2661. doi:10.1175/JAS-D-11-0323.1
Hendricks, E. A., Montgomery, M. T., and Davis, C. A. (2004). The Role of “Vortical” Hot Towers in the Formation of Tropical Cyclone Diana (1984). J. Atmos. Sci. 61 (11), 1209–1232. doi:10.1175/1520-0469(2004)061<1209:trovht>2.0.co;2
Houze, R. A. (2010). Clouds in Tropical Cyclones. Monthly Weather Rev. 138 (2), 293–344. doi:10.1175/2009MWR2989.1
Kaplan, J., and DeMaria, M. (2003). Large-Scale Characteristics of Rapidly Intensifying Tropical Cyclones in the North Atlantic Basin. Wea. Forecast. 18 (6), 1093–1108. doi:10.1175/1520-0434(2003)018<1093:lcorit>2.0.co;2
Kossin, J. P., and Schubert, W. H. (2001). Mesovortices, Polygonal Flow Patterns, and Rapid Pressure Falls in Hurricane-Like Vortices. J. Atmos. Sci. 58 (15), 2196–2209. doi:10.1175/1520-0469(2001)058<2196:mpfpar>2.0.co;2
Lee, W.-C., and Bell, M. M. (2007). Rapid Intensification, Eyewall Contraction, and Breakdown of Hurricane Charley (2004) Near Landfall. Geophys. Res. Lett. 34 (2). doi:10.1029/2006GL027889
Li, Y., Wang, Y., Lin, Y., and Wang, X. (2021). Why Does Rapid Contraction of the Radius of Maximum Wind Precede Rapid Intensification in Tropical Cyclones? J. Atmos. Sci. 78 (11), 3441–3453. doi:10.1175/JAS-D-21-0129.1
Lin, J., and Qian, T. (2019). Rapid Intensification of Tropical Cyclones Observed by AMSU Satellites. Geophys. Res. Lett. 46 (12), 7054–7062. doi:10.1029/2019GL083488
Lonfat, M., Marks, F. D., and Chen, S. S. (2004). Precipitation Distribution in Tropical Cyclones Using the Tropical Rainfall Measuring Mission (TRMM) Microwave Imager: A Global Perspective. Mon. Wea. Rev. 132 (7), 1645–1660. doi:10.1175/1520-0493(2004)132<1645:pditcu>2.0.co;2
Luo, Z. (2003). Nonlinear Interaction between Axisymmetric Circulation and Asymmetric Turbulence of Typhoon. Sci. China (Series D) 33, 686–694. (in Chinese).
Molinari, J., and Vollaro, D. (2010). Rapid Intensification of a Sheared Tropical Storm. Monthly Weather Rev. 138 (10), 3869–3885. doi:10.1175/2010MWR3378.1
Montgomery, M. T., Nicholls, M. E., Cram, T. A., and Saunders, A. B. (2006). A Vortical Hot Tower Route to Tropical Cyclogenesis. J. Atmos. Sci. 63 (1), 355–386. doi:10.1175/JAS3604.1
Nguyen, L. T., and Molinari, J. (2012). Rapid Intensification of a Sheared, Fast-Moving Hurricane over the Gulf Stream. Monthly Weather Rev. 140 (10), 3361–3378. doi:10.1175/MWR-D-11-00293.1
Nolan, D. S., and Grasso, L. D. (2003). Nonhydrostatic, Three-Dimensional Perturbations to Balanced, Hurricane-Like Vortices. Part II: Symmetric Response and Nonlinear Simulations. J. Atmos. Sci. 60 (22), 2717–2745. doi:10.1175/1520-0469(2003)060<2717:ntptbh>2.0.co;2
Nolan, D. S., Moon, Y., and Stern, D. P. (2007). Tropical Cyclone Intensification from Asymmetric Convection: Energetics and Efficiency. J. Atmos. Sci. 64 (10), 3377–3405. doi:10.1175/JAS3988.1
Oye, R., Mueller, C., and Smith, S. (1995). “Software for Radar Translation, Visualization, Editing, and Interpolation,” in Preprints, 27th Conf on Radar Meteorology, Vail, CO, Amer. Meteor. Soc., 359–361.
Persing, J., and Montgomery, M. T. (2003). Hurricane Superintensity. J. Atmos. Sci. 60 (19), 2349–2371. doi:10.1175/1520-0469(2003)060<2349:hs>2.0.co;2
Reasor, P. D., Eastin, M. D., and Gamache, J. F. (2009). Rapidly Intensifying Hurricane Guillermo (1997). Part I: Low-Wavenumber Structure and Evolution. Monthly Weather Rev. 137 (2), 603–631. doi:10.1175/2008MWR2487.1
Riemer, M., Montgomery, M. T., and Nicholls, M. E. (2010). A New Paradigm for Intensity Modification of Tropical Cyclones: Thermodynamic Impact of Vertical Wind Shear on the Inflow Layer. Atmos. Chem. Phys. 10 (7), 3163–3188. doi:10.5194/acp-10-3163-2010
Rogers, R., Reasor, P., and Lorsolo, S. (2013). Airborne Doppler Observations of the Inner-Core Structural Differences between Intensifying and Steady-State Tropical Cyclones. Monthly Weather Rev. 141 (9), 2970–2991. doi:10.1175/MWR-D-12-00357.1
Ryglicki, D. R., Velden, C. S., Reasor, P. D., Hodyss, D., and Doyle, J. D. (2021). Observations of Atypical Rapid Intensification Characteristics in Hurricane Dorian (2019). Monthly Weather Rev. 149 (7), 2131–2150. doi:10.1175/MWR-D-20-0413.1
Saha, S., Moorthi, S., Pan, H.-L., Wu, X., Wang, J., Nadiga, S., et al. (2010). The NCEP Climate Forecast System Reanalysis. Bull. Amer. Meteorol. Soc. 91 (8), 1015–1058. doi:10.1175/2010bams3001.1
Schubert, W. H., Montgomery, M. T., Taft, R. K., Guinn, T. A., Fulton, S. R., Kossin, J. P., et al. (1999). Polygonal Eyewalls, Asymmetric Eye Contraction, and Potential Vorticity Mixing in Hurricanes. J. Atmos. Sci. 56 (9), 1197–1223. doi:10.1175/1520-0469(1999)056<1197:peaeca>2.0.co;2
Shapiro, L. J. (1983). The Asymmetric Boundary Layer Flow under a Translating Hurricaneflow under a Translating hurricane. J. Atmos. Sci. 40, 1984–1998. doi:10.1175/1520-0469(1983)040<1984:tablfu>2.0.co;2
Shimada, U., and Horinouchi, T. (2018). Reintensification and Eyewall Formation in Strong Shear: A Case Study of Typhoon Noul (2015). Monthly Weather Rev. 146 (9), 2799–2817. doi:10.1175/MWR-D-18-0035.1
Sitkowski, M., and Barnes, G. M. (2009). Low-Level Thermodynamic, Kinematic, and Reflectivity Fields of Hurricane Guillermo (1997) during Rapid Intensification. Monthly Weather Rev. 137 (2), 645–663. doi:10.1175/2008MWR2531.1
Wu, Q., and Ruan, Z. (2021). Rapid Contraction of the Radius of Maximum Tangential Wind and Rapid Intensification of a Tropical Cyclone. Geophys. Res. Atmos. 126 (3), e2020JD033681. doi:10.1029/2020JD033681
Xu, Y., and Wu, R. (2005). The Numerical Simulation of the Genesis of Tropical Cyclone Bilis (2000): The Evolution and Transformation of Asymmetric Momentum. Chin. J. Atmos. Sci. 29, 79–90. (in Chinese).
Xue, M., Droegemeier, K. K., Wong, V., Shapiro, A., Brewster, K., Carr, F., et al. (2001). The Advanced Regional Prediction System (ARPS) - A Multi-Scale Nonhydrostatic Atmospheric Simulation and Prediction Tool. Part II: Model Physics and Applications. Meteorology Atmos. Phys. 76 (3), 143–165. doi:10.1007/s007030170027
Zhao, K., Lee, W.-C., and Jou, B. J.-D. (2008). Single Doppler Radar Observation of the Concentric Eyewall in Typhoon Saomai, 2006, Near Landfall. Geophys. Res. Lett. 35 (7), a–n. doi:10.1029/2007GL032773
Keywords: rapid intensification, ARPS-3DVAR, vertical wind shear, barotropic model, asymmetric structure
Citation: Liu B, Wang M and Zhao K (2022) Asymmetric Inner-Core Structure and its Impact on Rapid Intensification of a Sheared Tropical Cyclone. Front. Earth Sci. 10:871540. doi: 10.3389/feart.2022.871540
Received: 08 February 2022; Accepted: 04 April 2022;
Published: 26 April 2022.
Edited by:
Yuqing Wang, University of Hawaii at Manoa, United StatesReviewed by:
Eric Hendricks, National Center for Atmospheric Research (UCAR), United StatesGuanghua Chen, Institute of Atmospheric Physics (CAS), China
Copyright © 2022 Liu, Wang and Zhao. This is an open-access article distributed under the terms of the Creative Commons Attribution License (CC BY). The use, distribution or reproduction in other forums is permitted, provided the original author(s) and the copyright owner(s) are credited and that the original publication in this journal is cited, in accordance with accepted academic practice. No use, distribution or reproduction is permitted which does not comply with these terms.
*Correspondence: Bojun Liu, NWlua2xiakAxNjMuY29t
 Bojun Liu
 Mingjun Wang2
 Kun Zhao