 Tuo Shen
 Xiwei Xu
 Yujiang Li1
 Xiaoqiong Lei
- 1National Institute of Natural Hazards, Ministry of Emergency Management of China, Beijing, China
- 2Department of Geophysics, School of Earth and Space Sciences, Peking University, Beijing, China
- 3Schmidt Institute of Physics of the Earth, Russian Academy of Sciences, Moscow, Russia
Strain partitioning and accommodation are fundamental constraints to evaluate tectonic models of orogenic plateaus. The uplift mechanism issue of the eastern Tibetan Plateau has remained a long-term focus since the last century, namely, the steep uplift of the Longmen Shan area. Several tectonic models have been proposed to describe the uplift process of the central Longmen Shan area along the eastern margin of the Tibetan Plateau. Such as upper crustal shortening, mid-crustal channel flow, and whole-crust shearing. However, these models are typically examined through vertical differences. Geophysical, geological, remote sensing and geochemistry observation data indicate that there occur not only vertical differences but also obvious horizontal differences along the Longmen Shan orogenic belt. Based on the finite element method, we employed two-dimensional profiles crossed northern and southern Longmen Shan fault to reconstruct the uplift process of the Longmen Shan orogenic belt. The mechanical properties of the lithosphere south of the Longmen Shan orogenic belt were slightly less favorable than those of the lithosphere north of the Longmen Shan orogenic belt. For the better fitting result in the southern part viscosity of lower crust is less than 1021 Pa∙s and in the northern part viscosity of lower crust is around 1022 Pa∙s. The uplift processes in the upper and lower crust of the Longmen Shan orogenic belt were partially decoupled. The deformation of lithosphere in the northern Longmen Shan orogenic belt is smaller than it in southern Longmen Shan orogenic belt. Due to that the rigid Ruoergai block maybe resists the formation of a weak layer or enters of weak materials to the northern Longmen Shan block, resulting in the observed difference in lithospheric properties between the northern and southern Longmen Shan blocks.
Introduction
Over the past 50–55 million years, from the Indo-Asian continental collision event, the rise of the Himalayan-Tibetan Plateau has doubled the thickness of the Tibetan crust and has resulted in more than 1,400 km of plate convergence (Yin and Harrison, 2000; Ding et al., 2016; Qasim et al., 2018).
The collision between the Indian and Eurasian plates not only caused the uplift of the Tibetan Plateau but also caused eastward motion of the plateau, producing several large-scale intracontinental strike-slip fault systems (Molnar and Tapponnier, 1975; Tapponnier and Molnar, 1977). The tectonic extrusion model (Tapponnier et al., 1982, 2001) provides fundamental constraints of the uplift process of the eastern Tibetan margin (Figure 1A). To date, more than seven tectonic models have been published to explain the deformation and uplift process in the Longmen Shan orogenic belt area of the eastern Tibetan margin: (1) the channel flow model (Royden et al., 1997; Clark and Royden, 2000); (2) brittle upper crustal shortening (Hubbard and Shaw, 2009); (3) simple-shear deformation of the lithosphere (Yin, 2010) or crust (Guo et al., 2013); (4) pure-shear shortening and thickening of the lithosphere (Yin, 2010) with possibly decoupled upper and lower crusts (Feng et al., 2016); (5) indentation of the rigid South China crust into the weak crust of Tibet (Zhang et al., 2004); (6) uplift of Tibet associated with westernward underthrusting of the South China crust (Clark et al., 2005; Jiang and Jin, 2005); and (7) heterogeneous crustal reactivation of pre-existing weak zones (Jia D. et al., 2010; Sun et al., 2018). These models largely do not consider the effects of transverse differences in the deep lithosphere on the deformation and uplift process of the eastern Tibetan margin.
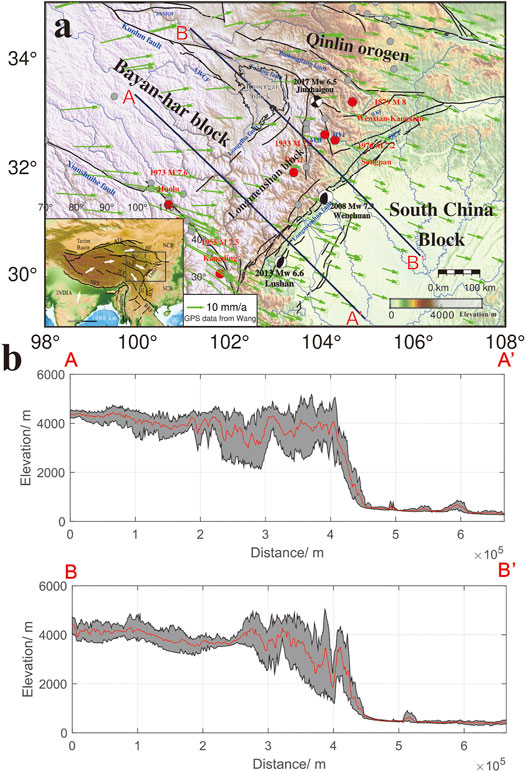
FIGURE 1. (A). Faults and seismicity in the eastern Tibetan Plateau and neighboring regions (the location is indicated by a box in the inset). The focal mechanism solutions indicate the 2008 Mw 7.9 Wenchuan earthquake, 2013 Mw 6.6 Lushan earthquake, and 2017 Mw 6.5 Jiuzhaigou earthquake retrieved from the Global Centroid Moment Tensor (CMT) database (formerly referred to as the Harvard CMT catalog) (http://www.globalcmt.org/CMTsearch.html). The dark gray circle indicates historical events above Mw 7. The red circle indicates events above Mw 7.5 near selected faults from 1840 to 2000 (obtained from the Chinese Earthquake Administration). The green arrow is GNSS data (Wang and Shen, 2020). The dashed box indicates figure area. The area enclosed by the black line delineates the Ruoergai rigid block (Hu et al., 2018). ANMQF: Animaqing fault; AWCF: Awancang fault; HF: Haiyuan fault; HYF: Huya fault; MJF: Minjiang fault; QCF: Qingchuan fault; QLF: Qinling fault, WKF: Wenxian–Kangxian fault. The inset map demonstrated major tectonic features of the Tibetan Plateau. ATF: Altyn Tagh fault, HFT: Himalayan Frontal Thrust, JLF: Jiali fault, NCB: North China Block, RRF: Red River fault, SCB: South China Block, XJF: Xiaojiang fault, XSHF: Xianshuihe fault, I–Qaidam-Qilian Block, II–Bayan Har Block, III - Sichuan–Yunnan block. The white arrow shows the block movement direction. (B). Profiles A-A’cross the southern Longmen Shan fault, and Profiles B-B′ cross the northern Longmen Shan fault. The red line indicates the average elevation. The gray range indicates the highest and lowest elevation ranges.
Recently, Tan suggested different exhumation rates between the northern and southern Longmen Shan orogenic belts (Tan et al., 2019). The maximum exhumation belt exhibited a 15° angle difference from the Longmen Shan thrust belt. Topographic Digital Elevation Model data (DEM data) clearly indicated that the slope differed between the northern and southern Longmen Shan orogenic belts (Figure 1B). Geological data (Li et al., 2012), P- and S-wave results (Lei and Zhao, 2009; Wei et al., 2017; Xin et al., 2018), magnetotelluric data (Maus et al., 2007; Sun et al., 2019), and gravity anomalies (Xu et al., 2016) suggest that the lithosphere of the Longmen Shan orogenic belt is transversely inhomogeneous. Moreover, The recent deep seismic reflection profile (Gao et al., 2014) and deep seismic sounding data (Jia S. et al., 2010) prove that there are relatively strong crystallization basement in upper crust of Ruoergai Basin. The Pn traveltime data suggest that there are high-speed crystallization basement similar to Sichuan Basin and Tarim Basin in the deep part of Ruoergai region. And some series of heat flow data also prove that the Ruoergai Basin has low heat flow value (Hu et al., 2018; An and Shi, 2007). These studies point out that the Ruoergai Basin is a relatively strong and stable block.However whether this rigid block impacts the uplift and deformation of the Longmen Shan orogenic belt in the extrusion process of the Bayan Har block remains to be investigated. As a high-risk area for earthquakes and a hot spot of plateau deformation, research on the effect of deformation and uplift due to transverse differences in the lithosphere in this region remains insufficient.
A large number of numerical simulation-based articles on the uplift and deformation of the Tibetan Plateau and Longmen Shan orogenic belt have been published, suggesting lithospheric rheology, which controls the deformation and gradient of the Longmen Shan uplift (Clark and Royden, 2000; Wang and He, 2012; Sun and Liu, 2018). In this study, we established two two-dimensional viscoelastic-elastoplastic profiles crossing the northern and southern Longmen Shan orogenic belts to rebuild the uplift process of the eastern Tibetan margin. Furthermore, we investigated how rheological transverse variations in the Tibetan Plateau impact lithospheric deformation and uplift of the eastern Tibetan margin. Our results indicated that the mechanical properties of the lithosphere south of the Bayan Har block are slightly less notable than those of the lithosphere north of the Bayan Har block. The uplift processes in the upper and lower crusts of the Longmen Shan orogenic belt were partially decoupled.
Tectonic Background
In the Eocene (50–55 Ma), the Indian continental plate started to collide with the Eurasian continental plate, and this collision event caused the uplift of the Tibetan Plateau with a very high average altitude of 4,000 m and compressional tectonics (Yin and Harrison, 2000; Ding et al., 2016; Qasim et al., 2018). Moreover, within the plateau, certain blocks experienced eastern extrusion and produced several large-scale strike-slip fault systems (Molnar and Tapponnier, 1975; Tapponnier and Molnar, 1977). The tectonic extrusion model (Tapponnier et al., 1982, 2001; Schellart et al., 2019) provides fundamental constraints of the uplift process of the eastern Tibetan margin.
Main Tectonic Blocks
The Bayan Har block in the central easternmost Tibetan Plateau is controlled by major NW-trending strike-slip faults. The eastern, northern, and southern boundaries of the Bayan Har block are the NE-trending Longmen Shan thrust, NWW-trending Kunlun fault, and Xianshuihe fault, respectively (Figure 1). These features are regarded as representing the southeastward extrusion route of crustal material after the Indo-Eurasian collision event. Numerous geologists have suggested that the Bayan Har block is an ancient landmass of the Sichuan block (Xu et al., 1991; Yin and Harrison, 2000). Furthermore, the Bayan Har block might have become isolated from the Sichuan block during the late Paleozoic (Zhang et al., 2004). Later, uplift of the Longmen Shan block separated the Bayan Har block from the Yangtze block.
The Ruoergai Basin is a Cenozoic basin located along the northeastern margin of the Bayan Har block. The Bayan Har block has been subjected to orogenic events related to the development of the plateau since the Cenozoic. Petroleum geologists have investigated the crustal structures of the Ruoergai Basin via seismic profiling to explore prospective oil and gas resources (Jia S. et al., 2010; Gao et al., 2014; Lei et al., 2014).
The Sichuan block occurs in the southeastern part of our study area, which is a stable basin with little seismic or tectonic activity and characterized by a high seismic velocity and low topographic relief (Burchfiel et al., 2008). This rigid Sichuan block played an important role in strain distribution and Cenozoic deformation of the southeastern part of the Tibetan Plateau (Yin, 2010).
Main Active Faults
The Longmen Shan fault forms the eastern boundary of the Tibetan Plateau It is consisted of three main faults: the Guanxian-Jiangyou fault, the Yingxiu-Beichuan fault, and the Wenchuan-Maowen fault (Zhang, 2008; Xu X. et al., 2009). From structural geometry and ages of deformation along-strike segmentation of topography and structures the Longmen Shan belt can be divided into the north Longmen Shan segment and the south Longmen Shan segment. Further, based on field investigations and interpretations of seismic sections, we can divide the Longmen Shan belt into the following two transfer zones and three segments (from northeast to southwest): the northern segment, Anxian transfer zone, central segment, Guanxian transfer zone and southern segment (Jia et al., 2006; Jin et al., 2010). The GPS data have indicated ∼3 mm/a convergence and ∼1 mm/a right-lateral slip along this fault, and the elevation changes from N4000 m to ∼500 m within a distance of ∼50 km. Associated with steep topographic changes are sharp variations in the crustal thickness and seismic velocity in the lithosphere (Burchfiel et al., 2008). Dipping angles range from ∼45° to nearly vertical near the surface but gradually decrease with the depth (Burchfiel et al., 2008; Zhang, 2008; Xu Y. et al., 2009; Lin et al., 2009).
Method and Model
In this study, we established two two-dimensional viscoelastic-elastoplastic profiles, which cross the northern Longmen Shan orogenic belt (referred to as Model N in the text) and southern Longmen Shan orogenic belt (referred to as Model S in the text) to reconstruct the uplift process of the eastern Tibetan margin (Figure 2). Furthermore, we investigated how rheological transverse variations in the Tibetan Plateau impacted lithospheric deformation and uplift of the eastern Tibetan margin.
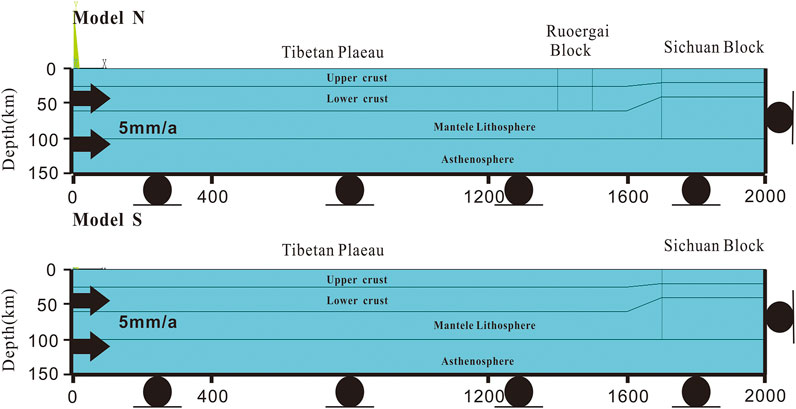
FIGURE 2. Two two-dimensional reference models crossing the southern Longmen Shan fault (Model S) and the northern Longmen Shan fault (Model N).
The two-dimensional momentum conservation equation is:
where
In the lower crust and mantle, we defined viscoelasticity properties. The stress is related to the strain rate and depends on the stress–strain history, so a hereditary integral is employed:
where
where
We applied the Drucker–Prager yield criterion to the elastoplastic upper crust. All the parameters are listed in Table 1.
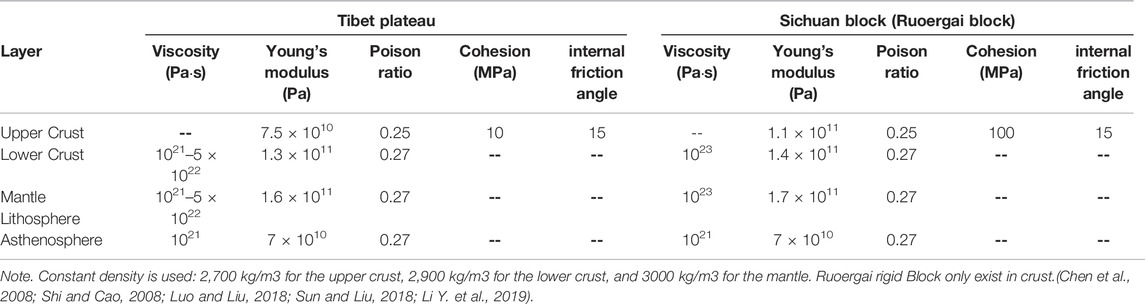
TABLE 1. Parameters for Models.
These 2 profiles cross the northern and southern Longmen Shan orogenic belts. The total profile length is 2000 km, the Bayan Har block length is 1700 km, and the Sichuan block length is 300 km according to DEM data. In the plateau, the upper crust is 25 km deep, the lower crust is 60 km deep, and the lithosphere is 100 km deep. In the Sichuan block, the upper crust is 20 km deep, the lower crust is 40 km deep, and the lithosphere is 100 km deep (Jia S. et al., 2010; Gao et al., 2014; Sun and Liu, 2018; Tan et al., 2019). In the Tibetan Plateau, the thickness of the upper crust rapidly decreases from 25 to 20 km in the 1,600–1700 km section of the profile, and the thickness of the lower crust rapidly decreases from 60 to 40 km in the 1,600–1700 km section of the profile (Laske et al., 2013). In the profile, which crosses the northern Longmen Shan fault, we set the rigid Ruoergai block in the 1,400–1,500 km section of the profile (Jia S. et al., 2010; Gao et al., 2014; Lei et al., 2014). We imposed a vertical displacement of 5 mm/a on the left side of the model domain. The right side of the model domain was fixed along all directions, assuming imposed boundary conditions without vertical deviation, with the bottom defined as a free-slip boundary along the horizontal direction and a fixed boundary along the vertical direction, while the surface was defined as a free boundary (Figure 2). The main uplift of the Longmen Shan orogenic belt has occurred since the Cenozoic. The study of the uplift of the Longmen Shan orogenic belt should consider the preexisting topographic relief and the impact of erosion. In particular, the preexisting topographic relief affected the deformation localization within the evolving thrust wedges (Sun et al., 2016). This study does not consider the preexisting topographic relief, mainly to simplify the model, eliminate the interference of other factors, and only explore the influence of rheology on the uplift and slope of Longmen Mountain. Our modeling process encompassed 10 ten million years (Wang et al., 2012; Shen et al., 2019).
All modeling was conducted in ANSYS® finite element software. ANSYS® employs the Newton–Raphson approach to solve nonlinear problems. In this method, a load is subdivided into a series of increments applied over several steps. Prior to each solution, the out-of-balance load vector is evaluated. If the convergence criteria are not satisfied, the load vector is reevaluated, the stiffness matrix is updated, and a new solution is obtained until convergence is reached.
Simulation Results
We extracted DEM data pertaining to 6 sections perpendicular to the Longmen Shan fault (3 sections in the north and 3 sections in the south), and every section was 500 km in length and 25 km in width (Figure 3A). Profiles 1-1′, 2-2′, and 3-3′ crossed the southern Longmen Shan fault, and Profiles 4-4′, 5-5′, and 6-6’ crossed the northern Longmen Shan fault. In each section, we plotted the average elevation (red line) and highest and lowest elevation ranges (gray part) (Figure 3B). Furthermore, we compared the DEM data of these 6 sections, and clearly shows the trend, in which the slope declined and the average elevation decreased from south to north. Thereafter, we extracted uplift data from our numerical simulated models (Figure 4).
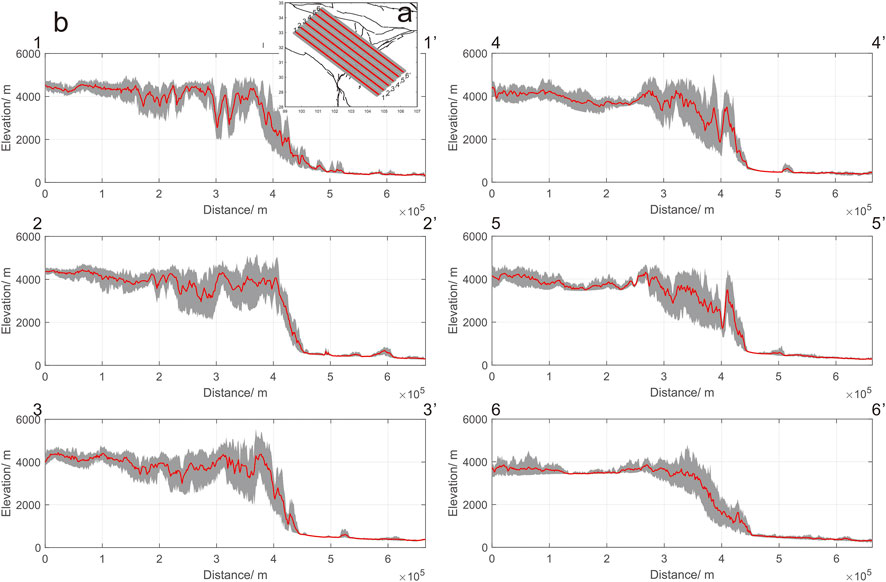
FIGURE 3. (A) 6 profiles cross the Longmen Shan fault, every section was 500 km in length and 25 km in width. (B) Profiles 1-1′, 2-2′, and 3-3′ cross the southern Longmen Shan fault, and Profiles 4-4′, 5-5′, and 6-6′ cross the northern Longmen Shan fault. The red line indicates the average elevation. The gray range indicates the highest and lowest elevation ranges.
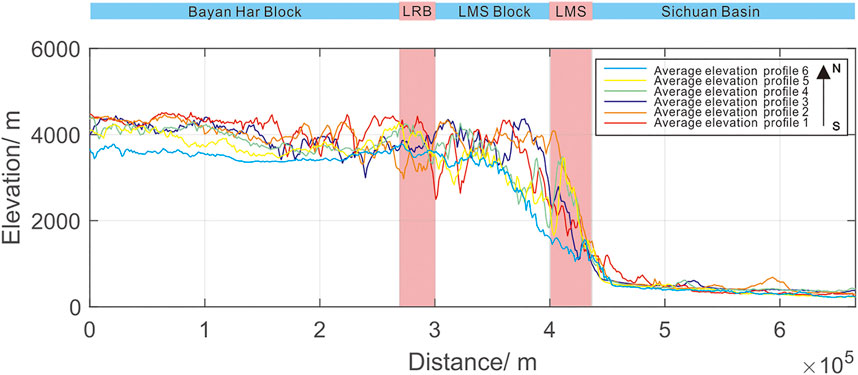
FIGURE 4. Combination of the average altitude curves along the 6 profiles. The light blue area is the block area, and the pink area indicates the fault zone. LRB-Longriba fault; LMS-Longmen Shan fault; LMS block-Longmen Shan block (the Longmen Shan block is the area between the Longriba fault and Longmen Shan fault in the eastern part of Bayan Har block).
We merged the modeling results with the observed DEM data to obtain data with a good fitting effect (Figure 5). Then we extract the curves with relatively good fitting. Figure 6 shows the final modeling result. Profiles 1, 2, and 3 crossed the southern Longmen Shan fault, and Profiles 4, 5, and 6 crossed the northern Longmen Shan fault. We could obtain a better fitted model along Profile 1 with a lower crust viscosity of 1021 Pa∙s and an upper mantle viscosity of 5
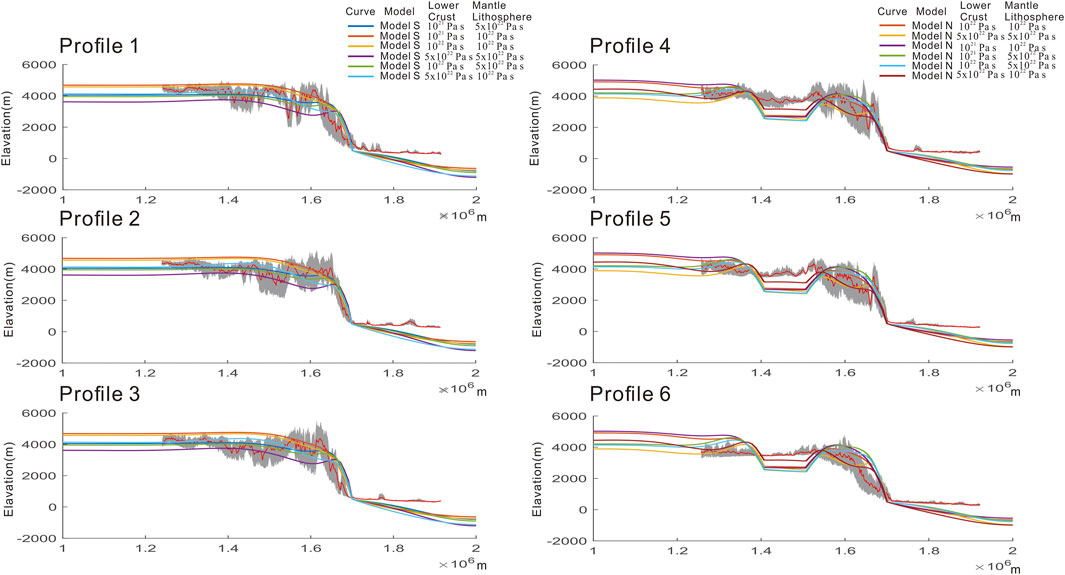
FIGURE 5. Comparison between the simulation results and extracted DEM results. Profiles 1, 2, and 3 are the results of Model S merged with the extracted DEM profiles 1-1′, 2-2′, and 3-3′, respectively. Profiles 4, 5, and 6 are the results of Model N merged with the extracted DEM profiles 4-4′, 5-5′, and 6-6′, respectively. In the legend exhibits different the viscosity of lower crust and mantle lithosphere in the Tibet Plateau.
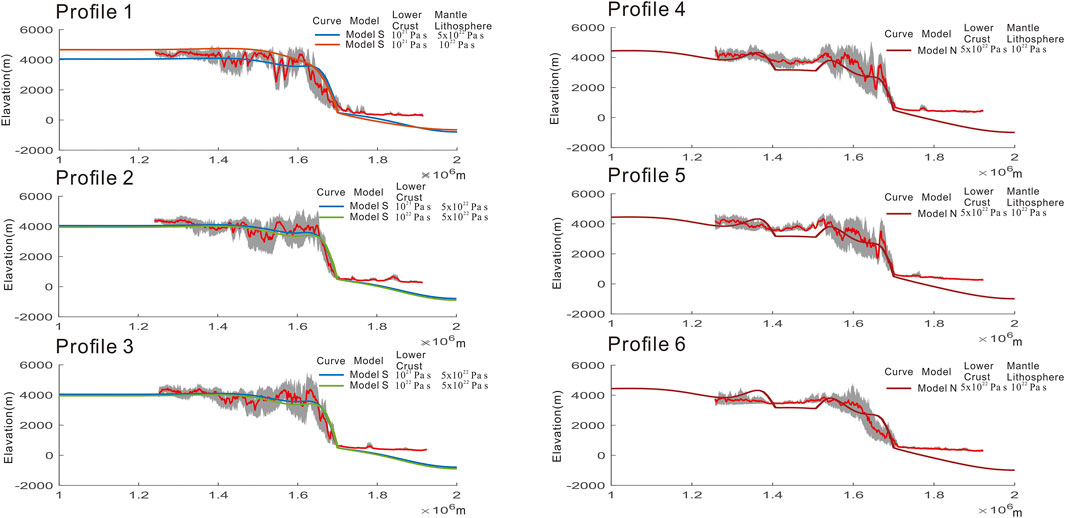
FIGURE 6. Best fitting result from the comparison between the simulation results and DEM extraction results. Profiles 1, 2, and 3 are the results of Model S merged with the extracted DEM profiles 1-1′, 2-2′, and 3-3′, respectively. Profiles 4, 5, and 6 are the results of Model N merged with the extracted DEM profiles 4-4′, 5-5′, and 6-6′, respectively. In the legend exhibits different the viscosity of lower crust and mantle lithosphere in the Tibet Plateau.
However, as shown in Figure 5, the southern profile appeared to achieve a good fitting effect, whereas the fitting effect of the northern profile was a little insufficient. Then, we further refined the viscosity coefficient in the Model N and adjusted the model across the northern Longmen Shan fault (referred to as Model AN in the text; shown as model in Supplementary Figure S1) for fitting purposes. We adjusted the upper crustal elasticity and viscosity of lower crust of the Ruoergai block on the basis of the optimal simulation parameters (lower crust viscosity of 5
As shown in the Supplementary Figures S2, S3, left profiles 4, 5, and 6 are the results of Model N merged with the extracted DEM profiles 4-4′, 5-5′, and 6-6′, respectively. Model NU1, Model NU2 and Model NU3 present Model N with weaker upper crust in Ruoergai block. Model NL present Model N with weaker lower crust in Ruoergai block. Right profiles 4, 5, and 6 are the results of Model AN (shown as model in Supplementary Figure S1) merged with the extracted DEM profiles 4-4′, 5-5′, and 6-6’, respectively. Model ANU1 and Model ANU2 present Model AN with weaker upper crust in Ruoergai block. The upper crust of Ruoergai block of Model NU1 has the same strength as the surrounding Bayan-Har Block. It is means that only lower crust is the strength part in the Ruoergai block Model NU1, thickness is about 35 km in the depth. The lower crust of Ruoergai block of Model NL is the same strength as the surrounding Bayan-Har Block. It is means that only upper crust is the strength part in the Ruoergai block of Model NL, thickness is about 25 km. These two profiles exhibit different uplift curve in the Supplementary Figure S2, which means the thickness of Ruoergai block impact the uplift result of modeling. In the legend exhibits different the viscosity of lower crust and mantle lithosphere in the Tibet Plateau. Eastern profile and Western profile exhibits in the Model AN referred Ruoergai block. (The parameter in Model NU1, Model NU2, Model NU3, Model NL, Model ANU1 and Model ANU2 shown in Supplementary Table S1).
In the northern profile as shown in Supplementary Figure S3. Left profiles 4, 5, and 6 is regarded to Model N, we could conclude that the better fitted model NU1 along Profile 4 with a lower crust viscosity 5
Based on our modeling results, we suggest that in the southern part of the Bayan Har block, the viscosity of the lower crust ranges from 1021 Pa∙s–1022 Pa∙s or is lower than 1021 Pa∙s (in our simulations, a viscosity lower than 1021 Pa∙s was not observed because the simulated time encompassed 10 million years), and the viscosity of the lithosphere (upper mantle) ranges from 1022 Pa∙s–5
We compare the modeling displacements result of the best fitting property. In the Model S viscosity of lower crust and mantle lithosphere (upper mantle) is 1021 Pa∙s and 5
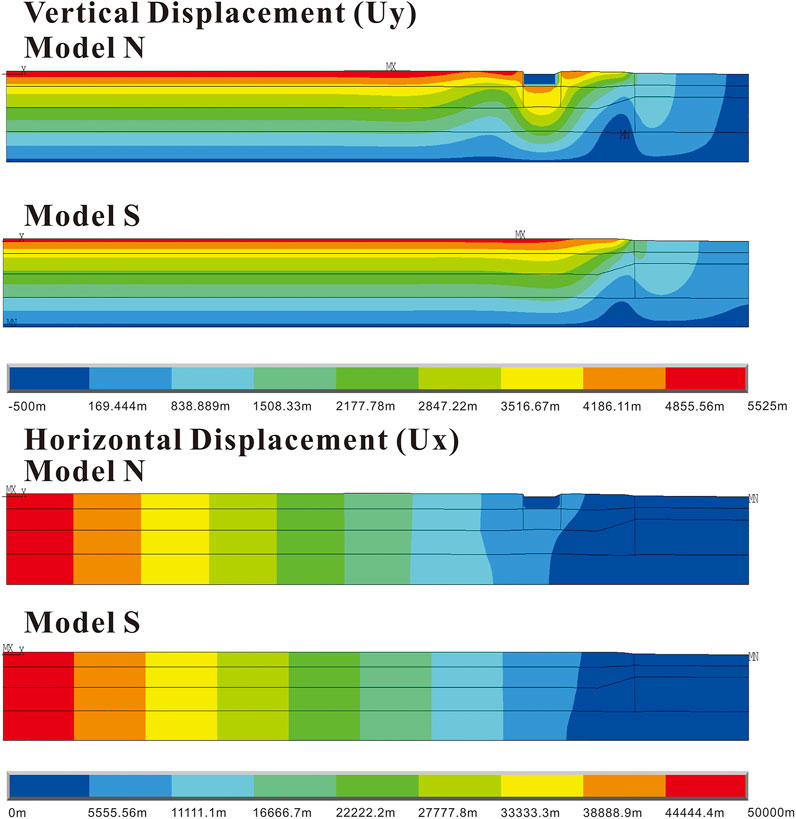
FIGURE 7. Compared to the simulation results of displacements in Model S and Model N. The above two are the results of vertical displacement. The next two are the results of horizontal displacement. MX: Maximum displacement; MN: Minimum displacement; X: x direction.
Discussion
The current landform is the result of the joint action of external and internal dynamic causes on the Earth’s surface. In our research area, we should first exclude the factors of the difference between the northern and southern uplift processes of the Longmen Shan orogenic belt due to external dynamic reasons. In the southern Longmen Shan orogenic belt, in the hanging wall of the Wenchuan–Maoxian fault, the Xue-longbao massif yields AFT and AHe ages of ca. 2–3 Ma, and the magnitude can be measured since 10 Ma. Moreover, the highest exhumation rate is ∼1 mm/a (Godard et al., 2009; Tan et al., 2017). In the northern Longmen Shan orogenic belt, the maximum exhumation rate is ∼0.9 mm/a, as documented by the Pliocene cooling age (Kirby et al., 2002; Tan et al., 2019). The exhumation rate can also reflect external dynamic reasons (personal communication with Tan), which suggests that the erosion level in the northern Longmen Shan orogenic belt is lower than that in the southern Longmen Shan orogenic belt. Hence, we can exclude the factors of the difference between the northern and southern uplift processes of the Longmen Shan orogenic belt due to external dynamic reasons.
One of the most obvious differences across the north–south section of the Longmen Shan orogenic belt is the presence of a rigid Ruoergai block in the north. We defined Models S and N with the same properties, and the only difference was the occurrence of a rigid Ruoergai block in Model N. The results (Figure 8A) suggest that if only the lithospheric properties remain the same and only a rigid Ruoergai block occurs, it is difficult to alter the slope of the northern uplift. This could eventually lead to the final convergence height of the northern plateau exceeding that of the southern plateau. The resistance of the Ruoergai block could result in strain concentration on both sides of the rigid block, further causing more severe uplift (Figure 8B). The presence of the Ruoergai block is not the only reason for the different strain partitioning results in the Longmen Shan block. We could confirm that the existence of the Ruoergai block could not explain our observed results.
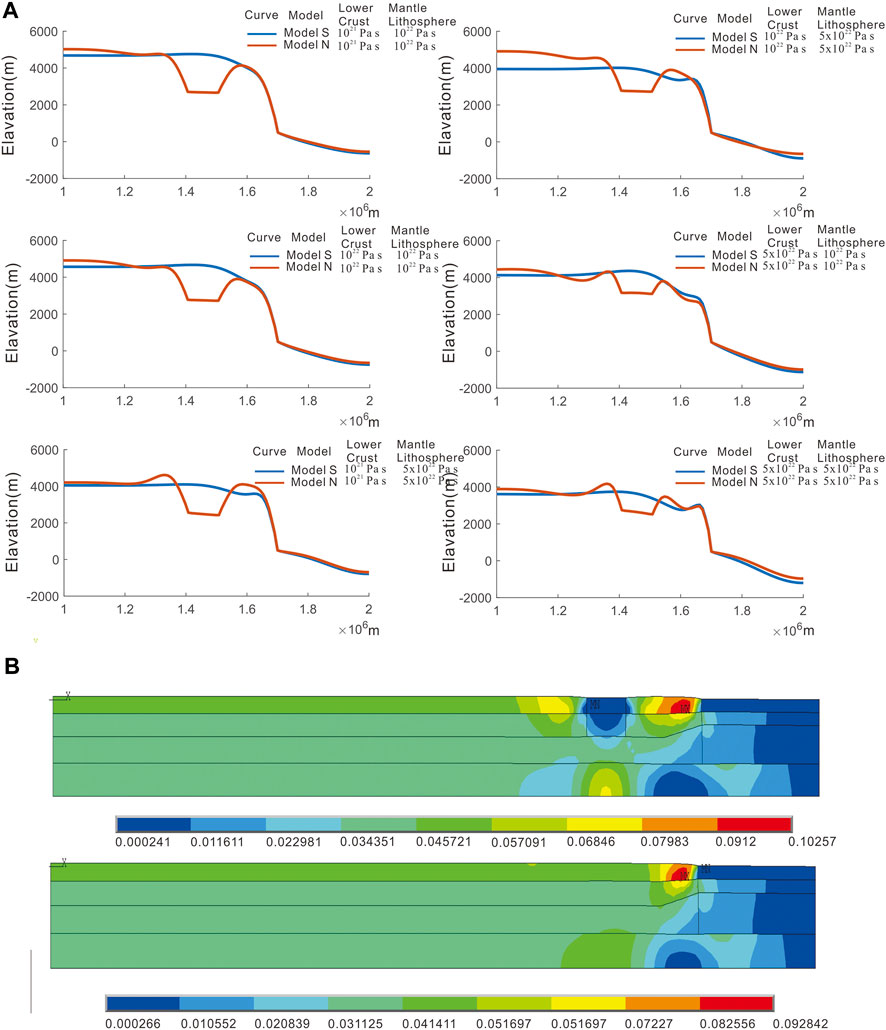
FIGURE 8. (A) Compared to the simulation results, there is only a single variable Ruoergai rigid block. (B) Comparing the strain results of the simulations, there only occurs a single variable Ruoergai rigid block. MX: Maximum strain; MN: Minimum strain; X: x direction.
Through analysis of GNSS data (Gan et al., 2007; Zheng et al., 2017; Wang and Shen, 2020), the current GPS rate change across the north–south section of the Longmen Shan fault tends to remain consistent (Figure 9). Our GPS rate change supports the strain-partitioning model: oblique extrusion motion of eastern Tibet is partitioned dominantly by strike-slip motion on the Longriba fault and dip-slip motion for the Longmen Shan thrust belt (Ren et al., 2013; Li et al., 2018). Moreover, the local shortening rates of the piedmont and hinterland between the central and the southern Longmen Shan orogenic belt are slightly different, they tend to be consistent as a whole (Li Z. et al., 2019). However, GPS data suggest that there occurs no obvious weakening along the northern profile, further there exists no notable difference in stress and strain between the northern and southern parts of the Longmen Shan fault section. Velocity in both profiles decelerate from about 11 mm/a to about 6 mm/a. Therefore, the stress–strain fields along the north–south profile perpendicular to the Longmen fault do not explain the difference in uplift between the northern and southern ends. The uplift difference between the north and South profiles is mainly caused by the vertical uplift difference under the surface. It should be caused by the different strain of the whole lithosphere mantle and the different decoupling degree of the upper crust from the lower crust.
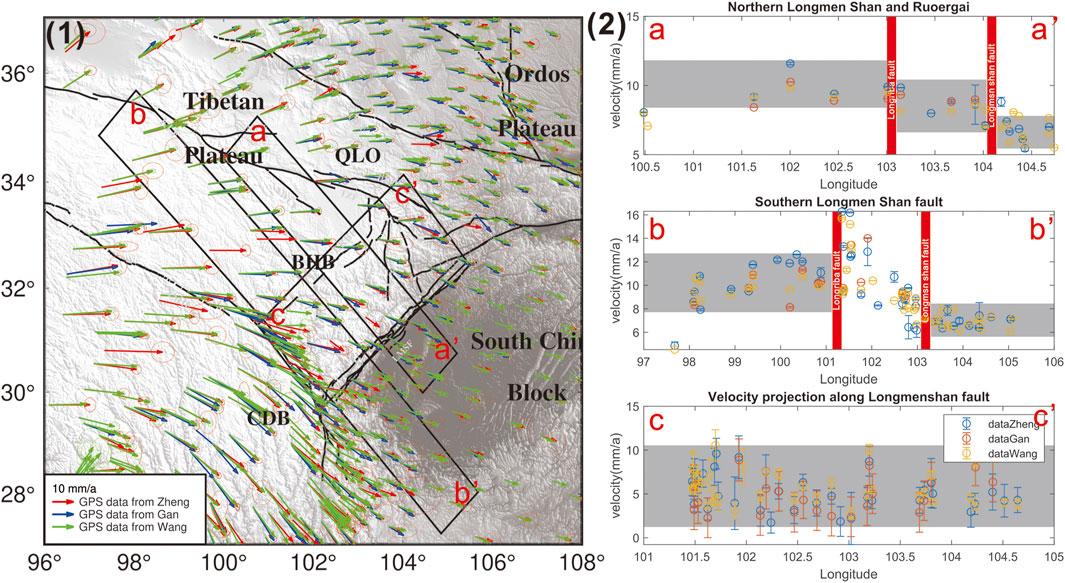
FIGURE 9. Analysis of the GNSS extraction data. (1) GNSS datasets from (Gan et al., 2007; Zheng et al., 2017; Wang and Shen, 2020) visualized in the map and 3 extraction areas based on the GNSS data. (2) Profiles a-a’, b-b’ Extracted GNSS data within the box range and projected velocity field perpendicular to the Longmen Shan fault. Profile c-c’ GPS data are extracted within the box, and the velocity field is projected parallel to the Longmen Shan fault. BHB: Bayan-Har Block; QLO: Qinling Orogen; CDB: Chuandian Block.
The velocity of the surface nodes extracted from our simulation results is projected into the North-South profiles of GPS observation data (Supplementary Figure S5). The results show that the rate of simulation results decreases continuously from west to East, and remains stable after reaching the Sichuan block. The rate decrease in the Model N is slightly greater than that in the Model S, indicating that the Ruoergai rigid block still has a certain resistance effect in the eastern extrusion process of Bayan Har block (Supplementary Figure S6).
Along the Longmen Shan fault zone, the velocity component parallel to the northern end of the Longmen Shan fault zone does not significantly increase at the northern end of the Longmen Shan fault.
The advanced velocity field does not indicate that the material has been subjected to obvious northward escape. Northward motion is not the obvious reason why the northern Longman Shan uplift is weaker than the southern part.
Several studies have demonstrated that the southern Longmen Shan fault and northern Longmen Shan fault exhibit different dip angles (Xu X. et al., 2009; Shen et al., 2009) Moreover, the Moho ramp differs between the southern Longmen Shan fault and northern Longmen Shan fault (Laske et al., 2013). Therefore, we adjusted the dip angle of Model S and compared the results (shown as model in Supplementary Figure S4). The results indicate that the above change in dip angle affected the final uplift height, but it remained difficult to improve the uplift slope. The gentle Moho ramp will lead to more intense uplift in the north of the Longmen Shan orogenic belt. In order to obtain better fitting results, the viscosity coefficient of the lower crust is about 5
The channel flow theory gives a new explanation to the deformation and strain distribution of the Qinghai Tibet Plateau (Royden et al., 1997; Clark and Royden, 2000). A series of subsequent studies on geothermal, electromagnetic and seismic wave reflection also confirmed the existence of a high temperature and low resistivity layer in the middle and lower crust of the Tibetan Plateau (Wang, 2001; Unsworth et al., 2005; Gao et al., 2009; Bai et al., 2010). Subsequently, it caused an upsurge in the study of the viscosity coefficient of the lower crust of the Tibetan Plateau. According to Clark’s research, the viscosity coefficient of the middle and lower crust is 1016 Pa
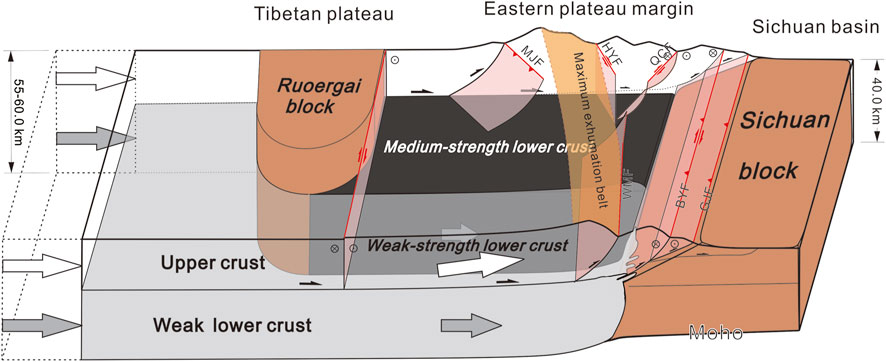
FIGURE 10. Our conceptual tectonic models for the eastern margin of the Tibetan plateau crossed the Longmen Shan orogenic belt. The model further integrates the rigid Ruoergai block, Sichuan block and our simulation results. After imposing a uniform displacement field on the west side of the model, upper and lower crust movements are partially decoupled near the Sichuan block. Due to the weak layer in the lower crust south of the Bayan Har block, the lower crust uplifts the plateau more in the shortening process of the movement of the Bayan Har block. The red lines indicate the fault traces. The maximum exhumation belt represents the maximum uplift area (Tan et al., 2019).
Previous studies have pointed out that the weak lower crust may be formed by partial melting of crust at depths of 15–50 km in areas under the environment of high temperature and high pressure (Wang Q. et al., 2016). It is also pointed out that the weak lower crust has a certain fluidity, and shear action of channel flow on the upper crust caused the rapid uplift of Longmen Shan area (Clark and Royden, 2000; Bai et al., 2010). The existence of Ruoergai rigid block may resisted the weak lower crust in the process of eastward movement, further cause the weak lower crust can not effectively enter the northern lower crust of Longmen Shan orogenic belt. The simulation results show that the deformation of the lower crust in the northern Longmen Shan orogenic belt is weaker than it in the south, which may lead to the weaker partial melting of the crust and the formation of less weak materials in the lower crust of the northern Longmen Shan orogenic belt. Therefore, the rigid Ruoergai block resists the formation of a weak layer or enters the northern Longmen Shan block, resulting in the observed difference in lithospheric properties between the northern and southern Longmen Shan blocks. Moreover, the eastern Tibetan crust is partially decoupled in the shortening process of the lithosphere. Thus, the above uplift difference between the northern and southern Longmen Shan blocks is generated.
The structure of the lithospheric mantle in the eastern margin of the Tibetan Plateau is very complex. It collides with the rigid Sichuan block and also has a complex three-dimensional structure (Wang M. et al., 2016). In particular, the Longmen Shan orogenic belt produced by compression with the rigid Sichuan block, which has a low thrust angle, steep moho ramp and strong Baoxing and Pengguan Massifs in deep depth at the southern Longmen Shan orogenic belt. There is a high thrust dip angle with a dextral strike slip component, a gentle Moho ramp at the northern Longmen Shan orogenic belt (Feng et al., 2021). Further, the Bikou block is an important block which is located between the Longmen Shan fault and the Minjiang fault. Its strength is high and it has a Proterozoic basement. Bikou block, Pengguan massif and Baoxing massif have very high strength (Zhan et al., 2013; Zhao et al., 2012). Since these hard small blocks exist, the high-steep change belt can be distributed along the zone of Minjiang-southern segment of the Longmen Shan fault. Due to the shortcomings and limitations of this work, it does not completely discuss these blocks. We will further improve these points in our future work. Previous studies have also proved that the rheological heterogeneity of Longmen Shan orogenic belt determines the difference of deformation and strain distribution in the North-South section of Longmen Shan orogenic belt (Sun et al., 2019). More reasonable model is considering of the three-dimensional strength inhomogeneity. That is the key to study the geomorphology, lithospheric deformation and strain distribution. Our work explains the difference of North-South uplift of Longmen Shan orogenic belt from a new perspective. I hope to provide more thinking directions for the future research work in this area.
Conclusion
Based on our simulation results and relevant observation data, we obtained the following conclusions:
1. The eastern Tibetan crust is partially decoupled between the upper crust and lower crust. The deformation of lithosphere in the northern Longmen Shan orogenic belt is smaller than it in southern Longmen Shan orogenic belt.
2. The mechanical properties of the lithosphere south of the Longmen Shan orogenic belt were slightly less favorable than those of the lithosphere north of the Longmen Shan orogenic belt. For the better fitting result in the southern part viscosity of lower crust is less than 1021 Pa∙s and in the northern part viscosity of lower crust is around 1022 Pa∙s. The viscosity of the southern Longmen Shan block is lower than that of the northern part.
3. The presence of the Ruoergai block impacts strain partitioning in the Longmen Shan block. However, the difference in uplift between the southern and northern Longmen Shan orogenic belts is caused by a difference in lithospheric properties.
4. The Ruoergai block resists the formation of a weak layer or enters of weak materials to the northern Longmen Shan block, resulting in the abovementioned difference in lithospheric properties between the northern and southern Longmen Shan blocks. Thus, the observed uplift difference between the northern and southern Longmen Shan blocks can be explained.
Data Availability Statement
Publicly available datasets were analyzed in this study. This data can be found here: https://doi.org/10.1029/2005JB004120 GPS Gan Weijun https://doi.org/10.1002/2017JB014465 GPS Zheng Gang https://doi.org/10.7910/DVN/C1WE3N GPS Wang Min.
Author Contributions
TS conceived the study, performed numerical experiments, interpreted results and wrote the manuscript. XX, and YL help to organize ideas and experiments, further help to interpreted results. LH and YL contributed to the modeling process. QW contributed to the GPS analysis part. QW, WK, and XL contributed to the geological analysis and discussion part.
Funding
This work was supported by the Research Grant from the National Institute of Natural Hazards, Ministry of Emergency Management of China Research Fund (ZDJ2020-03), National Key Research and Development Project of China (2018YFC1504101), National Natural Science Foundation of China, China (grant numbers 41902217, 40802052, U2139201 & U1839204), KAUST award BAS/1/1353-01-01, ANR project ANR-005-CATT-0006 and National Institute of Natural Hazards, Ministry of Emergency Management of China Research Fund (ZDJ2017-24).
Conflict of Interest
The authors declare that the research was conducted in the absence of any commercial or financial relationships that could be construed as a potential conflict of interest.
Publisher’s Note
All claims expressed in this article are solely those of the authors and do not necessarily represent those of their affiliated organizations, or those of the publisher, the editors and the reviewers. Any product that may be evaluated in this article, or claim that may be made by its manufacturer, is not guaranteed or endorsed by the publisher.
Acknowledgments
We benefited from discussion with Zhou shiyong.
Supplementary Material
The Supplementary Material for this article can be found online at: https://www.frontiersin.org/articles/10.3389/feart.2022.895363/full#supplementary-material
References
Bai, D., Unsworth, M. J., Meju, M. A., Ma, X., Teng, J., Kong, X., et al. (2010). Crustal Deformation of the Eastern Tibetan Plateau Revealed by Magnetotelluric Imaging. Nat. Geosci. 3, 358–362. doi:10.1038/ngeo830
Bischoff, S. H., and Flesch, L. M. (2018). Normal Faulting and Viscous Buckling in the Tibetan Plateau Induced by a Weak Lower Crust. Nat. Commun. 9. doi:10.1038/s41467-018-07312-9
Burchfiel, B. C., Royden, L. H., van der Hilst, R. D., Hager, B. H., Chen, Z., King, R. W., et al. (2008). A Geological and Geophysical Context for the Wenchuan Earthquake of 12 May 2008, Sichuan, People's Republic of China. GSA Today 18, 4–11. doi:10.1130/GSATG18A.1
Chen, L., Zhang, P., Lu, Y., Chen, H., Ma, H., Li, L., et al. (2008). Numerical Simulation of Loading/unloading Effect on Coulomb Failure Stress Among Strong Earthquakes in Sichuan-Yunnan Area. Chin. J. Geophys., 1411–1421. (in Chinese). doi:10.3321/j.issn:0001-5733.2008.05.014
Clark, M. K., and Royden, L. H. (2000). Topographic Ooze: Building the Eastern Margin of Tibet by Lower Crustal Flow. Geology 28, 703. doi:10.1130/0091-7613(2000)028<0703:tobtem>2.3.co;2
Clark, M. K., Bush, J. W. M., and Royden, L. H. (2005). Dynamic Topography Produced by Lower Crustal Flow against Rheological Strength Heterogeneities Bordering the Tibetan Plateau. Geophys. J. Int. 162, 575–590. doi:10.1111/j.1365-246X.2005.02580.x
Ding, H., Zhang, Z., Dong, X., Tian, Z., Xiang, H., Mu, H., et al. (2016). Early Eocene ( C . 50 Ma) Collision of the Indian and Asian Continents: Constraints from the North Himalayan Metamorphic Rocks, Southeastern Tibet. Earth Planet. Sci. Lett. 435, 64–73. doi:10.1016/j.epsl.2015.12.006
Feng, M., Qian, H., Mechie, J., An, M., Li, H., Xue, G., et al. (2021). Crustal Seismogenic Structures and Deformation Styles along the Longmen Shan Fault Belt in the Eastern Tibetan Plateau Inferred from Ambient Noise Tomography. Tectonophysics 798, 228689. doi:10.1016/j.tecto.2020.228689
Feng, S. y., Zhang, P. z., Liu, B. j., Wang, M., Zhu, S. b., Ran, Y. k., et al. (2016). Deep Crustal Deformation of the Longmen Shan, Eastern Margin of the Tibetan Plateau, from Seismic Reflection and Finite Element Modeling. J. Geophys. Res. Solid Earth 121, 767–787. doi:10.1002/2015JB012352
Gan, W., Zhang, P., Shen, Z.-K., Niu, Z., Wang, M., Wan, Y., et al. (2007). Present-day Crustal Motion within the Tibetan Plateau Inferred from GPS Measurements. J. Geophys. Res. 112, 1–14. doi:10.1029/2005JB004120
Gao, R., Wang, H., Zeng, L., Zhang, J., Guo, T., Li, Q., et al. (2014). The Crust Structures and the Connection of the Songpan Block and West Qinling Orogen Revealed by the Hezuo-Tangke Deep Seismic Reflection Profiling. Tectonophysics 634, 227–236. doi:10.1016/j.tecto.2014.08.014
Gao, X., Su, Y., Wang, W., Pei, S., and Guo, Z. (2009). Lower-crust S-Wave Velocity beneath Western Yunnan Province from Waveform Inversion of Dense Seismic Observations. Terra Nov. 21, 105–110. doi:10.1111/j.1365-3121.2008.00862.x
Godard, V., Pik, R., Lavé, J., Cattin, R., Tibari, B., de Sigoyer, J., et al. (2009). Late Cenozoic Evolution of the Central Longmen Shan, Eastern Tibet: Insight from (U-Th)/He Thermochronometry. Tectonics 28, a–n. doi:10.1029/2008TC002407
Guo, X., Gao, R., Randy Keller, G., Xu, X., Wang, H., and Li, W. (2013). Imaging the Crustal Structure beneath the Eastern Tibetan Plateau and Implications for the Uplift of the Longmen Shan Range. Earth Planet. Sci. Lett. 379, 72–80. doi:10.1016/j.epsl.2013.08.005
He, J., Lu, S., and Wang, W. (2013). Three-dimensional Mechanical Modeling of the GPS Velocity Field Around the Northeastern Tibetan Plateau and Surrounding Regions. Tectonophysics 584, 257–266. doi:10.1016/j.tecto.2012.03.025
Hu, G., Yu, L., Dong, Z., Lu, J., Li, J., Wang, Y., et al. (2018). Holocene Aeolian Activity in the Zoige Basin, Northeastern Tibetan Plateau, China. Catena 160, 321–328. doi:10.1016/j.catena.2017.10.005
Hubbard, J., and Shaw, J. H. (2009). Uplift of the Longmen Shan and Tibetan Plateau, and the 2008 Wenchuan (M = 7.9) Earthquake. Nature 458, 194–197. doi:10.1038/nature07837
Jia, D., Li, Y., Lin, A., Wang, M., Chen, W., Wu, X., et al. (2010a). Structural Model of 2008 Mw 7.9 Wenchuan Earthquake in the Rejuvenated Longmen Shan Thrust Belt, China. Tectonophysics 491, 174–184. doi:10.1016/j.tecto.2009.08.040
Jia, D., Wei, G., Chen, Z., Li, B., Zeng, Q., and Yang, G. (2006). Longmen Shan Fold-Thrust Belt and its Relation to the Western Sichuan Basin in Central China: New Insights from Hydrocarbon Exploration. Bulletin 90, 1425–1447. doi:10.1306/03230605076
Jia, S., Zhang, X., Zhao, J., Wang, F., Zhang, C., Xu, Z., et al. (2010b). Deep Seismic Sounding Data Reveal the Crustal Structures beneath Zoigê Basin and its Surrounding Folded Orogenic Belts. Sci. China Earth Sci. 53, 203–212. doi:10.1007/s11430-009-0166-0
Jiang, X., and Jin, Y. (2005). Mapping the Deep Lithospheric Structure beneath the Eastern Margin of the Tibetan Plateau from Gravity Anomalies. J. Geophys. Res. 110, B07407. doi:10.1029/2004JB003394
Jin, W., Tang, L., Yang, K., Wan, G., and Lü, Z. (2010). Segmentation of the Longmen Mountains Thrust Belt, Western Sichuan Foreland Basin, SW China. Tectonophysics 485, 107–121. doi:10.1016/j.tecto.2009.12.007
Kirby, E., Reiners, P. W., Krol, M. A., Whipple, K. X., Hodges, K. V., Farley, K. A., et al. (2002). Late Cenozoic Evolution of the Eastern Margin of the Tibetan Plateau: Inferences from40Ar/39Ar and (U-Th)/He Thermochronology. Tectonics 21, 1. doi:10.1029/2000TC001246
Laske, G., Masters, G., Ma, Z., and Pasyanos, M. (2013). Update on CRUST1. 0 A 1-degree Global Model of Earth’s Crust. Geophys. Res. Abstr. 15, 2658.
Lei, J., Li, Y., Xie, F., Teng, J., Zhang, G., Sun, C., et al. (2014). Pn Anisotropic Tomography and Dynamics under Eastern Tibetan Plateau. J. Geophys. Res. Solid Earth 119, 2174–2198. doi:10.1002/2013JB010847
Lei, J., and Zhao, D. (2009). Structural Heterogeneity of the Longmenshan Fault Zone and the Mechanism of the 2008 Wenchuan Earthquake (Ms 8.0). Geochem. Geophys. Geosyst. 10, a–n. doi:10.1029/2009GC002590
Li, Y., Liu, M., Li, Y., and Chen, L. (2019b). Active Crustal Deformation in Southeastern Tibetan Plateau: The Kinematics and Dynamics. Earth Planet. Sci. Lett. 523, 115708. doi:10.1016/j.epsl.2019.07.010
Li, Z.-W., Liu, S., Chen, H., Deng, B., Hou, M., Wu, W., et al. (2012). Spatial Variation in Meso-Cenozoic Exhumation History of the Longmen Shan Thrust Belt (Eastern Tibetan Plateau) and the Adjacent Western Sichuan Basin: Constraints from Fission Track Thermochronology. J. Asian Earth Sci. 47, 185–203. doi:10.1016/j.jseaes.2011.10.016
Li, Z., Zhang, P., Zheng, W., Jia, D., Hubbard, J., Almeida, R., et al. (2018). Oblique Thrusting and Strain Partitioning in the Longmen Shan Fold‐and‐Thrust Belt, Eastern Tibetan Plateau. J. Geophys. Res. Solid Earth 123, 4431–4453. doi:10.1029/2018JB015529
Li, Z., Zheng, W., Zhang, P., Almeida, R., Jia, D., Sun, C., et al. (2019a). Evidence for Three Cenozoic Phases of Upper Crustal Shortening of the Xiongpo Structure in the Longmen Shan Fold-And-Thrust Belt, China: Implications for the Eastward Growth of the Eastern Tibetan Plateau. J. Asian Earth Sci. 179, 138–148. doi:10.1016/j.jseaes.2019.04.017
Lin, A., Ren, Z., Jia, D., and Wu, X. (2009). Co-seismic Thrusting Rupture and Slip Distribution Produced by the 2008 Mw 7.9 Wenchuan Earthquake, China. Tectonophysics 471, 203–215. doi:10.1016/j.tecto.2009.02.014
Luo, G., and Liu, M. (2018). Stressing Rates and Seismicity on the Major Faults in Eastern Tibetan Plateau. J. Geophys. Res. Solid Earth 123 (10), 968. doi:10.1029/2018jb015532
Maus, S., Sazonova, T., Hemant, K., Fairhead, J. D., and Ravat, D. (2007). National Geophysical Data Center Candidate for the World Digital Magnetic Anomaly Map. Geochem. Geophys. Geosyst. 8, a–n. doi:10.1029/2007GC001643
Molnar, P., and Tapponnier, P. (1975). Cenozoic Tectonics of Asia: Effects of a Continental Collision: Features of Recent Continental Tectonics in Asia Can Be Interpreted as Results of the India-Eurasia Collision. Science 189, 419–426. doi:10.1126/science.189.4201.419
Qasim, M., Ding, L., Khan, M. A., Jadoon, I. A. K., Haneef, M., Baral, U., et al. (2018). Tectonic Implications of Detrital Zircon Ages from Lesser Himalayan Mesozoic-Cenozoic Strata, Pakistan. Geochem. Geophys. Geosyst. 19, 1636–1659. doi:10.1002/2017GC006895
Ren, J., Xu, X., Yeats, R. S., and Zhang, S. (2013). Latest Quaternary Paleoseismology and Slip Rates of the Longriba Fault Zone, Eastern Tibet: Implications for Fault Behavior and Strain Partitioning. Tectonics 32, 216–238. doi:10.1002/tect.20029
Royden, L. H., Burchfiel, B. C., King, R. W., Wang, E., Chen, Z., Shen, F., et al. (1997). Surface Deformation and Lower Crustal Flow in Eastern Tibet. Science 276, 788–790. doi:10.1126/science.276.5313.788
Schellart, W. P., Chen, Z., Strak, V., Duarte, J. C., and Rosas, F. M. (2019). Pacific Subduction Control on Asian Continental Deformation Including Tibetan Extension and Eastward Extrusion Tectonics. Nat. Commun. 10, 12337. doi:10.1038/s41467-019-12337-9
Shen, X., Tian, Y., Zhang, G., Zhang, S., Carter, A., Kohn, B., et al. (2019). Late Miocene Hinterland Crustal Shortening in the Longmen Shan Thrust Belt, the Eastern Margin of the Tibetan Plateau. J. Geophys. Res. Solid Earth 124, 11972–11991. doi:10.1029/2019JB018358
Shen, Z.-K., Sun, J., Zhang, P., Wan, Y., Wang, M., Bürgmann, R., et al. (2009). Slip Maxima at Fault Junctions and Rupturing of Barriers during the 2008 Wenchuan Earthquake. Nat. Geosci. 2, 718–724. doi:10.1038/ngeo636
Shi, Y., and Cao, J. (2008). Lithosphere Effective Viscosity of Continental China. Earth Sci. Front. 15, 82–95. doi:10.1016/s1872-5791(08)60064-0
Sun, C., Jia, D., Yin, H., Chen, Z., Li, Z., Shen, L., et al. (2016). Sandbox Modeling of Evolving Thrust Wedges with Different Preexisting Topographic Relief: Implications for the Longmen Shan Thrust Belt, Eastern Tibet. J. Geophys. Res. Solid Earth 121, 4591–4614. doi:10.1002/2016JB013013
Sun, M., Yin, A., Yan, D., Ren, H., Mu, H., Zhu, L., et al. (2018). Role of Pre-existing Structures in Controlling the Cenozoic Tectonic Evolution of the Eastern Tibetan Plateau: New Insights from Analogue Experiments. Earth Planet. Sci. Lett. 491, 207–215. doi:10.1016/j.epsl.2018.03.005
Sun, X., Zhan, Y., Zhao, L., Chen, X., Sun, J., Li, C., et al. (2019). Electrical Structure of the Kunlun-Qinling Fault System, Northeastern Tibetan Plateau, Inferred from 3-D Inversion of Magnetotelluric Data. J. Asian Earth Sci. 181, 103910. doi:10.1016/j.jseaes.2019.103910
Sun, Y., Li, H., and Fan, T. (2019). A Numerical Study of Lithospheric Deformation and Strain Partitioning across the Longmen Shan Orogenic Belt, Eastern Tibetan Plateau. Tectonics 38, 3108–3123. doi:10.1029/2019TC005512
Sun, Y., and Liu, M. (2018). Rheological Control of Lateral Growth of the Tibetan Plateau: Numerical Results. J. Geophys. Res. Solid Earth 123 (10), 10124–10141. doi:10.1029/2018JB016601
Tan, X.-B., Xu, X.-W., Lee, Y.-H., Lu, R.-Q., Liu, Y., Xu, C., et al. (2017). Late Cenozoic Thrusting of Major Faults along the Central Segment of Longmen Shan, Eastern Tibet: Evidence from Low-Temperature Thermochronology. Tectonophysics 712-713, 145–155. doi:10.1016/j.tecto.2017.05.016
Tan, X., Liu, Y., Lee, Y.-H., Lu, R., Xu, X., Suppe, J., et al. (2019). Parallelism between the Maximum Exhumation Belt and the Moho Ramp along the Eastern Tibetan Plateau Margin: Coincidence or Consequence? Earth Planet. Sci. Lett. 507, 73–84. doi:10.1016/j.epsl.2018.12.001
Tapponnier, P., and Molnar, P. (1977). Active Faulting and Tectonics in China. J. Geophys. Res. 82, 2905–2930. doi:10.1029/JB082i020p02905
Tapponnier, P., Peltzer, G., Le Dain, A. Y., Armijo, R., and Cobbold, P. (1982). Propagating Extrusion Tectonics in Asia: New Insights from Simple Experiments with Plasticine. Geology 10, 611–661. doi:10.1130/0091-7613(1982)10<611:PETIAN>2.010.1130/0091-7613(1982)10<611:petian>2.0.co;2
Tapponnier, P., Zhiqin, X., Roger, F., Meyer, B., Arnaud, N., Wittlinger, G., et al. (2001). Oblique Stepwise Rise and Growth of the Tibet Plateau. Science 294, 1671–1677. doi:10.1126/science.105978
Unsworth, M. J., Jones, A. G., Jones, A. G., Wei, W., Marquis, G., Gokarn, S. G., et al. (2005). Crustal Rheology of the Himalaya and Southern Tibet Inferred from Magnetotelluric Data. Nature 438, 78–81. doi:10.1038/nature04154
Wang, E., Kirby, E., Furlong, K. P., Van Soest, M., Xu, G., Shi, X., et al. (2012). Two-phase Growth of High Topography in Eastern Tibet during the Cenozoic. Nat. Geosci. 5, 640–645. doi:10.1038/ngeo1538
Wang, E., Meng, Q., Clark Burchfiel, B., and Zhang, G. (2003). Mesozoic Large-Scale Lateral Extrusion, Rotation, and Uplift of the Tongbai-Dabie Shan Belt in East China. Geology 31, 3072–3310. doi:10.1130/0091-7613(2003)031<0307:mlsler>2.0.co;2
Wang, M., Hubbard, J., Plesch, A., Shaw, J. H., and Wang, L. (2016a). Three‐dimensional Seismic Velocity Structure in the Sichuan Basin, China. J. Geophys. Res. Solid Earth 121, 1007–1022. doi:10.1002/2015JB012644
Wang, M., and Shen, Z. K. (2020). Present‐Day Crustal Deformation of Continental China Derived from GPS and its Tectonic Implications. J. Geophys. Res. Solid Earth 125, 8774. doi:10.1029/2019JB018774
Wang, Q., Hawkesworth, C. J., Wyman, D., Chung, S.-L., Wu, F.-Y., Li, X.-H., et al. (2016b). Pliocene-Quaternary Crustal Melting in Central and Northern Tibet and Insights into Crustal Flow. Nat. Commun. 7, 11888. doi:10.1038/ncomms11888
Wang, X., and He, J. (2012). Channel Flow of the Lower Crust and its Relation to Large-Scale Tectonic Geomorphology of the Eastern Tibetan Plateau. Sci. China Earth Sci. 55, 1383–1390. doi:10.1007/s11430-012-4391-6
Wang, Y. (2001). Heat Flow Pattern and Lateral Variations of Lithosphere Strength in China Mainland: Constraints on Active Deformation. Phys. Earth Planet. Interiors 126, 121–146. doi:10.1016/S0031-9201(01)00251-5
Wei, X., Jiang, M., Liang, X., Chen, L., and Ai, Y. (2017). Limited Southward Underthrusting of the Asian Lithosphere and Material Extrusion beneath the Northeastern Margin of Tibet, Inferred from Teleseismic Rayleigh Wave Tomography. J. Geophys. Res. Solid Earth 122, 7172–7189. doi:10.1002/2016JB013832
Xin, H., Zhang, H., Kang, M., He, R., Gao, L., and Gao, J. (2018). High‐Resolution Lithospheric Velocity Structure of Continental China by Double‐Difference Seismic Travel‐Time Tomography. Seismol. Res. Lett. 90, 229–241. doi:10.1785/0220180209
Xu, X., Keller, G. R., Gao, R., Guo, X., and Zhu, X. (2016). Uplift of the Longmen Shan Area in the Eastern Tibetan Plateau: an Integrated Geophysical and Geodynamic Analysis. Int. Geol. Rev. 58, 14–31. doi:10.1080/00206814.2015.1055595
Xu, X., Wen, X., Yu, G., Chen, G., Klinger, Y., Hubbard, J., et al. (2009a). Coseismic Reverse- and Oblique-Slip Surface Faulting Generated by the 2008 Mw 7.9 Wenchuan Earthquake, China. Geology 37, 515–518. doi:10.1130/G25462A.1
Xu, Y., Huang, R.-Q., Li, Z.-W., Xu, Y., Liu, J.-S., and Liu, J.-H. (2009b). S-wave Velocity Structure of the Longmen Shan and Wenchuan Earthquake Area. Chin. J. Geophys. 52, 329
Xu, Z., Hou, L.-W., Wang, D.-K., and Wang, Z. (1991). Xikang-type’folds and Their Deformation Mechanism A New Fold Type in Orogenic Belts. Reg. Geol. China 1, 1
Yin, A. (2010). Cenozoic Tectonic Evolution of Asia: a Preliminary Synthesis. Tectonophysics 488, 293–325. doi:10.1016/j.tecto.2009.06.002
Yin, A., and Harrison, T. M. (2000). Geologic Evolution of the Himalayan-Tibetan Orogen. Annu. Rev. Earth Planet. Sci. 28, 211–280. doi:10.1146/annurev.earth.28.1.211
Zhan, Y., Zhao, G. Z., Unsworth, M., Wang, L. F., Chen, X. B., Li, T., et al. (2013). Deep structure beneath the southwestern section of the Longmenshan fault zone and seimogenetic context of the 4.20 Lushan MS7.0 earthquake. Chinese Sci. Bull. 58, 3467–3474. doi:10.1007/s11434-013-6013-x
Zhang, G.-W., Guo, A., and Yao, A. (2004). Western Qinling-Songpan Continental Tectonic Nodein China’s Continental Tectonics. Earth Sci. Front. 11, 23
Zhang, P.-Z. (2008). Slip Rates and Recurrence Intervals of the Longmen Shan Active Fault Zone, and Tectonic Implications for the Mechanism of the May 12 Wenchuan Earthquake, 2008, Sichuan, China. Chin. J. Geophys. 51, 1066
Zhao, G., Unsworth, M. J., Zhan, Y., Wang, L., Chen, X., Jones, A. G., et al. (2012). Crustal Structure and Rheology of the Longmenshan and Wenchuan Mw 7.9 Earthquake Epicentral Area from Magnetotelluric Data. Geology 40 (12), 1139–1142. doi:10.1130/g33703.1
Keywords: Longmen Shan fault, viscosity, finite element method, uplift, Ruoergai block, lithosphere
Citation: Shen T, Xu X, Li Y, Huang L, Rogozhin EA, Wang Q, Kang W and Lei X (2022) Effects of Lithospheric Properties on Crustal Strain at Both Ends of Longmen Shan Orogenic Belt: Based on Numerical Simulation. Front. Earth Sci. 10:895363. doi: 10.3389/feart.2022.895363
Received: 13 March 2022; Accepted: 02 May 2022;
Published: 25 May 2022.
Edited by:
Zhong-Hai Li, University of Chinese Academy of Sciences, ChinaReviewed by:
Yujun Sun, Chinese Academy of Geological Science, ChinaXiaoyu Guo, Sun Yat-Sen University, China
Zhigang Li, Sun Yat-Sen University, China
Copyright © 2022 Shen, Xu, Li, Huang, Rogozhin, Wang, Kang and Lei. This is an open-access article distributed under the terms of the Creative Commons Attribution License (CC BY). The use, distribution or reproduction in other forums is permitted, provided the original author(s) and the copyright owner(s) are credited and that the original publication in this journal is cited, in accordance with accepted academic practice. No use, distribution or reproduction is permitted which does not comply with these terms.
*Correspondence: Xiwei Xu, eGl3ZWl4dUB2aXAuc2luYS5jb20=