 Alexander Motorin
 Sergey Baranov*
- Geophysical Survey, Kola Branch, Russian Academy of Sciences, Apatity, Russia
The paper considers the distribution of magnitudes of the strongest aftershocks–depending on the time after the main shock–that occur during the extraction of minerals in tectonically loaded rock massifs. The study is based on the data of long-term seismological observations at the apatite-nepheline deposits of the Khibiny Massif located in the Kola Peninsula. The article demonstrates that the distribution of the difference between the magnitudes of the strongest aftershock and the main shock is described by the dynamic Båth law, previously obtained by the authors during the study of the regularities of aftershock processes of tectonic earthquakes.
1 Introduction
The present study is a continuation of the research on the aftershock hazard assessment associated with mining-induced seismicity. In previous studies (Shebalin et al., 2020; Shebalin and Baranov, 2021), the law of productivity for tectonic earthquakes was established. According to this law, the productivity (the number of events triggered by another–earlier–earthquake) has an exponential distribution. This law was also confirmed for the mining-induced seismicity of the Khibiny Massif (Baranov et al., 2020a).
This study examines the distribution of magnitudes of the strongest aftershocks depending on the time after the main shock. Previously in (Baranov and Shebalin, 2018; Baranov et al., 2022) it was theoretically substantiated the Båth law (Båth, 1965), according to which the average difference between the magnitude of the strongest aftershock and the main shock is 1.1–1.2. There it was also obtained the distribution of the difference in the magnitudes of the strongest aftershock and the main shock depending on time, which we call the dynamic Båth law, and demonstrated the correspondence of this model to the regional and global statistics of tectonic earthquakes over a long period.
In this paper, we will demonstrate the implementation of the dynamic Båth law for the case of mining-induced seismicity that occurs during the extraction of minerals in tectonically loaded rock massifs, using the Khibiny massif as an example.
The relevance of the study is determined by two components. The first component is the summarization of the theoretical constructions obtained for tectonic earthquakes for the case of weak mining-induced seismicity, which is recorded only by local monitoring networks and does not reach the catalogs of seismological agencies. In this regard, this research fills a gap between laboratory experiments (see, for example, (Smirnov et al., 2019) and studies performed using global and regional data. The second component is determined by the possibility of using the dynamic Båth law as a base model when testing other developed models for post seismic hazard assessment (see, for example, (Baranov et al., 2019)) on mining areas.
The practical significance of this article is determined by the demand of mining enterprises for aftershock hazard assessment initiated by a seismic event. Such an assessment is necessary when planning measures to mitigate risk during mining operations.
2 Materials and Methods
Similarly to the previous works devoted to the study of mining-induced seismicity of the Khibiny Massif (Baranov et al., 2020a,b), this study uses a catalog of seismic events registered by the seismic monitoring network of Europe’s largest mining company, the Kirovsk branch of Apatit JSC for the period from 1996 to August 2020 (Figure 1). The monitoring network provides complete registration of seismic events with M ≥ 0 (E ≥ 104 J) with accuracy of up to 25 m in the area of increased accuracy and up to 100 m in the area of confident registration (Korchak et al., 2014). This completeness and accuracy of the calculation of hypocenters makes it possible to make studies for very weak seismicity, filling the gap between laboratory experiments and natural observations.
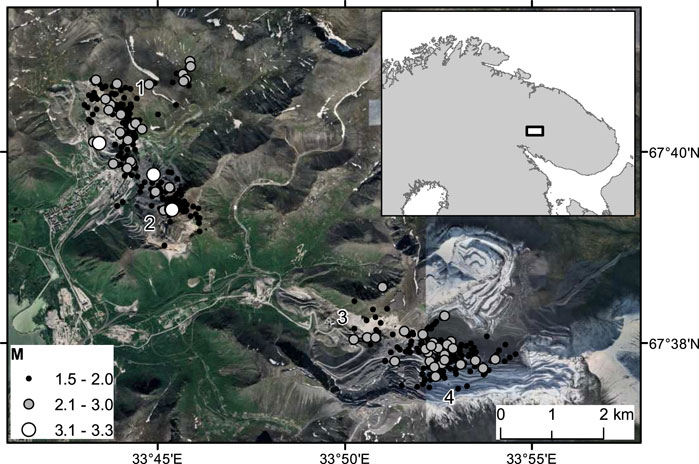
FIGURE 1. Epicenters of mining-induced earthquakes with M ≥ 1.5 occurred in the Khibiny Massif from 1996 to August 2020 explicated over the relief. A rectangle on the insert indicates the location of the research area. The figures indicate the deposits: 1—Kukisvumchorr, 2—Yukspor (developed by the Kirovsk Mine); 3—Apatite Circus (Rasvumchorr Mine); 4—Rasvumchorr (until 2014 Central, currently Eastern Mine).
The Khibiny pluton located in the west of Kola Peninsula is the world’s largest alkaline intrusion (Arzamastsev et al., 2013), which contains unique deposits of apatite-nepheline. The largest deposits (Kukisvumchorr, Yuksporr, Apatite Circus, and Rasvumchorr Plateau, see Figure 1) are concentrated in the southwestern part of Khibiny and represent various parts of the same apatite-nepheline rock body (Nivin, 2019) extended for about 12 km in length. The deposits lie at a depth of up to 1,500 m, varying in thickness from a few meters to 500 m. The Khibiny massif has a high level of tectonic stress established by field measurements (Kozyrev et al., 2017). The maximum tectonic stress (compression stress) of rock in the massif reaches 40–60 MPa at depths of 200–600 m from the day surface, which is 3–5, and in some cases 20 times higher than the gravitational stress (see (Rebetsky et al., 2017) and references therein) due to the weight of the overlying rocks. There are many faults in the Khibiny massif (Arzamastsev et al., 2013), some of them cross the area of deposits. The present tectonic evolution of this region is evidenced by recent uplifts of the massif at a rate of 0.5 to 2–4 mm per year and periodical earthquakes (Kremenetskaya and Trjapitsin, 1995). Thus, the seismicity of the Khibiny massif is the result of combined influence of tectonic conditions and mining activity.
Selecting triggering events (main shocks) and the triggered ones (aftershocks) was carried out using the “nearest neighbor” method (Zaliapin and Ben-Zion, 2013, 2016), based on the use of the proximity function in space-time-magnitude (Baiesi and Paczuski, 2004), which depends on the parameters of the local seismic regime: b-value and the spatial fractal dimension of the earthquake hypocenters df:
where tij = tj − ti is the interevent time, rij the spatial distance between the events, mi the magnitude of event i, df the fractal dimension of the epicenter distribution and b the slope of the earthquake-size distribution.
The idea of the method is to find an “ancestor” for each event from the catalog (except the first one); it is determined by the minimum of values of the proximity functions (Eq. 1) calculated for all previous events. If the distance to the “ancestor” is less than some threshold value η0, then the “ancestor” is declared the trigger for a given event. Otherwise, the connection between these events is broken. Events have not been triggered are background ones.
Various methods based on mixture modeling have been proposed to estimate the η0-value, e.g., Weibull or Gaussian distributions (Zaliapin and Ben-Zion, 2013). Bayliss et al. (2019) suggested to use Markov Chain Monte Carlo mixture models based on Weibull or gamma distributions. Here, as in (Baranov et al., 2020a), we used a model-independent method, which may be more preferable for the case of mining seismicity, when industrial explosions affect the aftershock decay. However, the decay of aftershock number over the set of series (see below) obeys the Omori-Utsu law.
The application of the nearest neighbor method to declustering the seismicity of the Khibiny Mountains was discussed in detail in (Baranov et al., 2020a). The following parameter estimates were also obtained there: b = 1.25 (Supplementary Figure S1 in supplementary material), df = 1.5 (Supplementary Figure S2 in supplementary material), log10η0 = − 6.25 (Figure 2 from (Baranov et al., 2020a)).
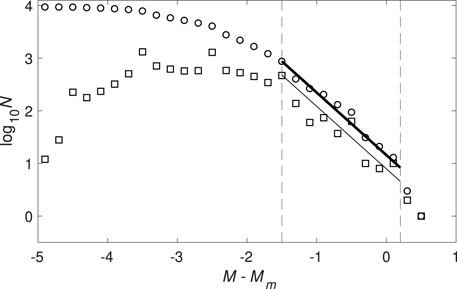
FIGURE 2. Estimating Gutenberg–Richter b-value for the set of 451 aftershock series. Cumulative (circles, thick line) and differential (squares, thin line) graphs of frequency-magnitude relationship for M−Mm. Circles denote cumulative values, squares denote differential ones. Dashed lines mark the interval [–1.5, 0.2] for estimating b-value. The value ba = 1.19 ± 0.09 (95% confidence interval).
3 Båth Law Dynamic
Problems of theoretical background and interpretation of the Båth law are considered in detail in (Baranov and Shebalin, 2018; Baranov et al., 2022). Here, for the convenience of the reader, we will only briefly outline the derivation of the formula. The probability that an arbitrary triggered event has a magnitude less than M is given by the Gutenberg-Richter distribution (Gutenberg and Richter, 1956):
Here βa/ log(10) = ba is the slope of the frequency-magnitude curve of triggered events; Mc is the lower cutoff magnitude not less than the completeness one.
Then the probability that N of the triggered events have magnitudes less than M is equal to F(M)N. Assuming that these N aftershocks follow the Poisson distribution with the rate Λ and, following the formula of total probability, we will obtain a distribution of the probability that the magnitude of the strongest aftershock (M1) in an individual sequence is a double exponent (Vere-Jones, 2008; Zöller et al., 2013):
In order to proceed to the distribution of M1 over a set of series (Bath law), it is necessary to take into account that Λ obeys an exponential distribution (Baranov et al., 2020a; Shebalin et al., 2020) with density
The Equation 4 is the law of earthquake productivity. The parameter ΛΔM, clustering factor, is the mean rate of events with magnitude M ≥ Mm−ΔM, ΔM > 0, triggered by an event of magnitude Mm.
Integrating, we obtain
Equation 5 is known as logistic distribution. In (Baranov et al., 2019) it was shown that this distribution is also valid for an arbitrary time interval (t, T). In this case, the value ΛΔM in Eq. 5 must be replaced by a time-dependent value ΛΔM(t, T) obeying the Omori–Utsu law (Utsu et al., 1995), then we can write Eq. 5 as follows:
Here m1(t, T) = M1(t, T)−Mm is the difference between the magnitudes of the strongest aftershock (M1) and the main shock (Mm) in the time interval (t, T) after the main shock; ba is the b-value estimated by the set of aftershock series; ΛΔM(t, T) is a mean rate of triggered events in the time interval (t, T) with the magnitude M ≥ Mm−ΔM ≥ Mc, determined by the relation:
Here c, p are the parameters of the Omori–Utsu law, estimated from a set of series; ΛΔM(0, T) is a parameter of the productivity law (4), the estimation of which is the average number of triggered events with M ≥ Mm−ΔM at a time interval (0, T); the function D(t1, t2; c, p) is the integral of the Omori–Utsu law:
The law of productivity (Eq. 4) was confirmed for mining-induced seismicity of Khibiny Mountains by Baranov et al. (2020a) (events with magnitude Mm ≥ 1.5 were considered as triggers). Therefore, in this case, the application of dynamic Bath law does not contradict the theory.
The mean, median and mode of the distribution (Eq. 6) are equal and have the form:
The value of − ΔM + log10[ΛΔM(0, T)]/ba in Eq. 8 sets the average difference between the magnitudes of the strongest aftershock and the main shock E[m1(0, T)], which according to the Båth empirical law does not depend on the main shock magnitude and is equal to 1.1–1.2. The third term in Eq. 8 defines how this average difference of magnitudes decreases with time.
4 Estimation of the Parameters
To estimate the average values of the parameters ba, c and p of the model (Eq. 6), we will use the technique of aftershock stacking (Shebalin and Narteau, 2017; Baranov et al., 2019). We will stack all aftershock sequences into a single set, replacing for each sequence the values of the aftershock magnitudes M with relative magnitudes M−Mm. Times are calculated relative the time of corresponding main shock. This data set is then rearranged in increasing time.
This approach to estimation is more preferable compared to averaging the estimates obtained for individual sequences, since the distributions of parameters are generally asymmetrical. Moreover, the parameters p and c of the Omori-Utsu law are correlated with each other. Thus, when the fracture occurs along the formed fault, the relaxation parameter p increases with increasing axial stresses; the delay in the onset of hyperbolic decay (parameter c in the Omori–Utsu law) decreases with the growth of axial stresses and increases with the rise of the level of uniform compression (Smirnov et al., 2019). For example, in a number of laboratory and natural studies, correlation of the Omori-Utsu and Gutenberg-Richter parameters is revealed, indicating realization of various relaxation mechanisms (see, for example, (Smirnov et al., 2019, 2020) and references therein).
The parameters of the Gutenberg-Richter and Omori–Utsu laws were estimated using the set of series at the time interval [tstart = 0.005, tstop = 30] days. The delay after the main shock (tstart) is necessary to eliminate the bias of parameter estimates due to a lack of weak aftershocks at the beginning of the sequence (Narteau et al., 2009; Smirnov et al., 2010; Holschneider et al., 2012). The value of tstop = 30 days after main shock was chosen because during this time cumulative curve (cumulative number of aftershocks vs time) build from stacked aftershocks sequences has a regular form and Omori-Utsu law describes well the observed data.
Estimating the parameter ba of the Gutenberg-Richter law using relative magnitudes from the set of sequences has the following advantages. First, the magnitude of completeness for early aftershocks depends on the main shock magnitude, while the relative completeness magnitude does not have such a dependence (Helmstetter et al., 2006; Hainzl, 2016). Second, the value is estimated for all series using large magnitudes, thereby minimizing the possible effect of break of slope in frequency magnitude distribution due to possible post-seismic deformations in the earthquake source (Vorobieva et al., 2016; Shebalin and Baranov, 2017). Third, the use of large magnitudes for estimating b-value eliminates the problem of incomplete detection of early weak aftershocks. In the case of small number of aftershock series to avoid this problem one can use the Omi et al. (2013) method to explicitly take into account the aftershocks incompleteness. Another way is to extract the parameters of Gutenberg-Richter and Omori-Utsu laws from the ground velocity recorded some minutes after the main shock (Lippiello et al., 2019).
Figure 2 shows the differential and cumulative graphs of the distribution of the value M − Mm in a set of series. The value of the parameter ba is estimated using the Bender (1983) method in the interval [−1.5, 0.2] and the estimate is ba = 1.19 ± 0.09 (the 95% confidence interval). The left boundary of this interval corresponds to the completeness magnitude. Limiting the estimate on the right with a value of 0.2 is to exclude the possible effect of finite volumes (Romanowicz, 1992).
The Bayesian estimation of the parameters c and p of the Omori-Utsu law was made following the Holschneider et al. (2012) method in time interval [tstart = 0.005, tstop = 30] days with uniform a priori distributions of parameters c in the interval [tstart/2, 2tstop] and p in the interval [0.5, 1.5]. Figure 3 shows the posterior distributions of estimates c and p, as well as the empirical and theoretical distribution of aftershock times. The resulting values are c = 0.013 ± 0.008 days and p = 1.22 ± 0.056 (95% confidence interval). The proximity of theoretical and empirical cumulative curves of the aftershock number (Figure 3B) shows that the mining-induced post-seismic activity can be modeled by the Omori-Utsu law.
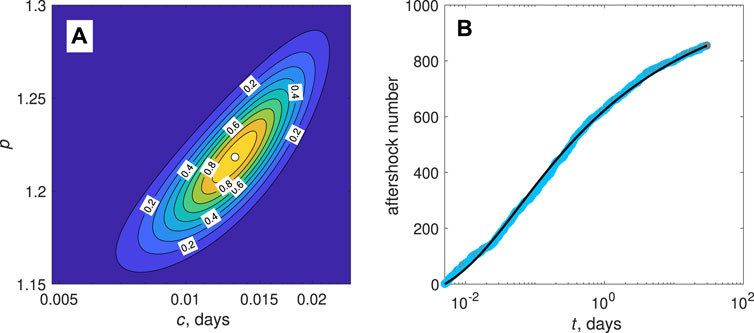
FIGURE 3. Estimating parameters c and p of Omori-Utsu law for the set of 451 aftershock series: (A) a posteriori distribution of Bayesian estimates of c and p. Contours with markers show lines of levels of quantiles, white circle marks position of maximum likelihood; (B) distribution of times of aftershocks. Blue circles show empirical distribution over the stack; thin black line shows distribution by Omori-Utsu law with estimated parameter values c = 0.013 ± 0.008 days, p = 1.22 ± 0.056 (95% confidence interval).
Baranov et al. (2020a) showed that post-seismic activity in the Khibiny Massif obeys the law of productivity: the number of initiated events is distributed exponentially. In this case, an earthquake with Mm ≥ 1.5 initiates an average of 2.7 seismic events with magnitudes M ≥ Mm − 1.5, i.e. Λ1.5 = 2.7.
5 Results
Substituting the estimates of parameters ba = 1.19, c = 0.013 days, p = 1.22, Λ1.5 = 2.7 obtained in the previous section into Eq. 8, we get that E[m1] = −1.1, which corresponds to the actual value. Using these estimates, the values of the mean and standard deviations of the differences of magnitudes of the strongest aftershocks and main shocks for the times (t, 90) days after the main shock at t = 2j, where j = −6, − 5, …, 2, were calculated. The time of T = 90 days was chosen because after this time, aftershocks stop to occur in the Khibiny massif, that is, stress is almost relaxed. Calculations showed (Figure 4) good correspondence of actual and model values (the maximum deviation not exceed 0.05). The actual and theoretical standard deviations of the value m1 = M1−Mm are close and approximately equal 0.66. From the point of view of practical use, such a deviation is suitable only as a preliminary estimate obtained immediately after an earthquake with a magnitude of 1.5 or higher. To improve the estimate, it is necessary to use information about aftershocks that have already occurred (see, for example, (Shcherbakov et al., 2017; Baranov et al., 2019)).
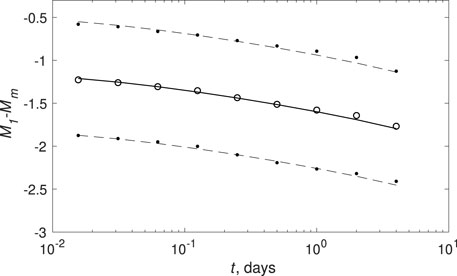
FIGURE 4. Comparison of observed and model values of the average differences of magnitudes of the strongest aftershocks and main shocks E[M1(t,90)−Mm] calculated using Eq. 8 at ba = 1.19, c = 0.013 days, p = 1.22, Λ1.5 = 2.7. Circles (dots) indicate observed values E[M1(t, 90)−Mm] (plus/minus observed standard deviations); solid (dotted) line indicates model values (plus/minus model standard deviations).
We compared empirical (Gn) and theoretical (G, Eq. 6) distribution functions (Figure 5) using Kolomogorov-Smirnov test (Massey, 1951). The values of Gn are within interval G ± dα where dα is a critical value of the test for which
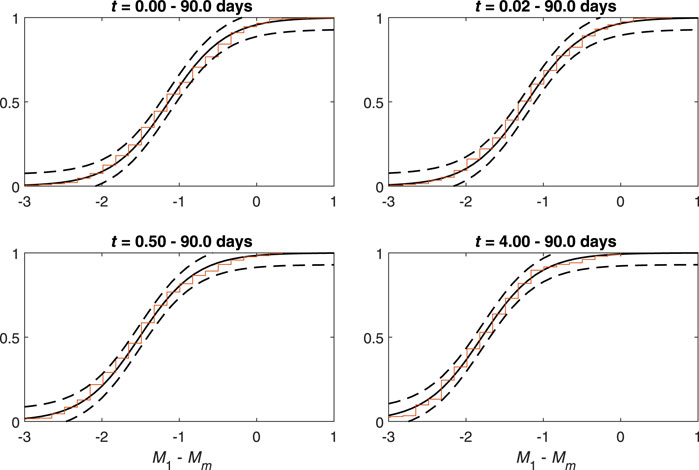
FIGURE 5. Comparison of empirical (Gn) and theoretical (G) distribution functions of the difference of magnitudes of the strongest aftershocks and main shocks M1(t, 90) − Mm, for different values of time after the main shock t (days). Steps indicate empirical values; solid line indicates theoretical values calculated using the dynamic Båth law (Eq. 6) with parameters from the caption of Figure 4. Dashed lines show of G ± dα, where dα is a critical value of Kolmogorov-Smirnov test (Massey, 1951): Prob( max |Gn − G| > dα) = α for significance level α = 0.05.
6 Discussion and Summary
According to the data of long-term seismological observations in the Khibiny Mountains, it has been demonstrated that for the case of mining-induced seismicity, the distribution of the difference in magnitude of the strongest aftershocks and the main shocks depending on time obeys the dynamic Båth law, which was previously obtained for tectonic earthquakes.
The use of representative data, starting with the magnitude M = 0, fills the gap between studies performed on laboratory and field data. The validity of the dynamic Båth law for tectonic earthquakes and weak mining-induced seismicity is an additional confirmation of the universal nature of the used laws of statistical seismology (Gutenberg-Richter, Omori-Utsu and productivity).
The combination of the Gutenberg-Richter (Eq. 2) and productivity (Eq. 4) laws used in the expression (Eq. 5) makes it possible to explain not only the average value of the difference in the magnitudes of the strongest aftershock and the main shock, determined by the empirical Båth law, but also the form of distribution of this difference. Taking into account the aftershock decay rate according to the Omori–Utsu law in the Eq. 4 made it possible to derive the dynamic Båth law (Eq. 6), which is an extension of the Båth law taking into account the time factor.
The main result of the article is the Bath law dynamic is appropriate for mining-induced seismicity in Khibiny massif. This result is not obvious, since in mining-induced seismicity stress relaxation after the main shock is affected by explosions, which also change the local stress field. This feature, absent in natural seismicity, can cause the aftershock decay in a specific sequence to deviate from the Omori-Utsu law. Nevertheless, on average, the attenuation of aftershocks obeys the Omori-Utsu law. This result shows that approaches for assessment of aftershock hazard due to natural earthquakes can be applied to the mining-induced seismicity in tectonically loaded rock masses.
The dynamic Båth law, first, allows us to obtain an average estimate of the magnitude of the future strongest aftershock at successive moments of time immediately after the main shock. Second, this law can be used as a baseline model when testing other models for assessing post-seismic hazards arising from mining in tectonically loaded rock massifs.
Data Availability Statement
The datasets presented in this article are not readily available because The data for the study belong to Kirovsk Branch of Joint Stock Company “Apatit.” Requests to access the datasets should be directed to Alexander Motorin, QVl1TW90b3JpbkBwaG9zYWdyby5ydQ==.
Author Contributions
All authors listed have made a substantial, direct, and intellectual contribution to the work and approved it for publication.
Funding
The research was supported by the Russian Science Foundation, Project No.22-27-20125 (estimating the model parameters), state assignment of the Federal Research Center “Geophysical Survey of Russian Academy of Sciences” No.075-01471-22 (catalog declustering to highlight the main shocks and their aftershocks).
Conflict of Interest
The authors declare that the research was conducted in the absence of any commercial or financial relationships that could be construed as a potential conflict of interest.
Publisher’s Note
All claims expressed in this article are solely those of the authors and do not necessarily represent those of their affiliated organizations, or those of the publisher, the editors and the reviewers. Any product that may be evaluated in this article, or claim that may be made by its manufacturer, is not guaranteed or endorsed by the publisher.
Supplementary Material
The Supplementary Material for this article can be found online at: https://www.frontiersin.org/articles/10.3389/feart.2022.902812/full#supplementary-material
References
Arzamastsev, A. A., Arzamastseva, L. V., Zhirova, A. M., and Glaznev, V. N. (2013). Model of Formation of the Khibiny-Lovozero Ore-Bearing Volcanic-Plutonic Complex. Geol. Ore Deposits 55, 341–356. doi:10.1134/S1075701513050024
Båth, M. (1965). Lateral Inhomogeneities of the Upper Mantle. Tectonophysics 2, 483–514. doi:10.1016/0040-1951(65)90003-X
Baiesi, M., and Paczuski, M. (2004). Scale-free Networks of Earthquakes and Aftershocks. Phys. Rev. E 69, 066106. doi:10.1103/PhysRevE.69.066106
Baranov, S. V., and Shebalin, P. N. (2018). Forecasting Aftershock Activity: 3. Båth's Dynamic Law. Izv. Phys. Solid Earth 54, 926–932. doi:10.1134/S1069351318060022
Baranov, S. V., Pavlenko, V. A., and Shebalin, P. N. (2019). Forecasting Aftershock Activity: 4. Estimating the Maximum Magnitude of Future Aftershocks. Izv. Phys. Solid Earth 55, 548–562. doi:10.1134/S1069351319040013
Baranov, S. V., Zhukova, S. A., Korchak, P. A., and Shebalin, P. N. (2020a). Productivity of Mining-Induced Seismicity. Izv. Phys. Solid Earth 56, 326–336. doi:10.1134/S1069351320030015
Baranov, S. V., Zhukova, S., Zhukova, S. A., Korchak, P. A., and Shebalin, P. N. (2020b). Seismic Productivity of Blasts: A Case-Study of the Khibiny Massif. Eurasian Min. 2020, 14–18. doi:10.17580/em.2020.02.04
Baranov, S., Narteau, C., and Shebalin, P. (2022). Modeling and Prediction of Aftershock Activity Surv. Geophys. doi:10.1007/s10712-022-09698-0
Bayliss, K., Naylor, M., and Main, I. G. (2019). Probabilistic Identification of Earthquake Clusters Using Rescaled Nearest Neighbour Distance Networks. Geophys. J. Int. 217, 487–503. doi:10.1093/gji/ggz034
Bender, B. (1983). Maximum Likelihood Estimation of b Values for Magnitude Grouped Data. Bull. Seismol. Soc. Am. 73, 831–851. doi:10.1785/BSSA0730030831
Gutenberg, B., and Richter, C. F. (1956). Earthquake Magnitude, Intensity, Energy, and Acceleration. Seismol. Soc. Am. Bull. 46, 105–145. doi:10.1785/BSSA0460020105
Hainzl, S. (2016). Rate‐Dependent Incompleteness of Earthquake Catalogs. Seismol. Res. Lett. 87, 337–344. doi:10.1785/0220150211
Helmstetter, A., Kagan, Y. Y., and Jackson, D. D. (2006). Comparison of Short-Term and Time-independent Earthquake Forecast Models for Southern California. Bull. Seismol. Soc. Am. 96, 90–106. doi:10.1785/0120050067
Holschneider, M., Narteau, C., Shebalin, P., Peng, Z., and Schorlemmer, D. (2012). Bayesian Analysis of the Modified Omori Law. J. Geophys. Res. 117, B06317. doi:10.1029/2011JB009054
Korchak, P., Zhukova, S., and Me’shikov, P. Y. (2014). Seismic Monitoring Build-Up and Development in the Production Activity Zone of Apatit JSC. Gorn. Zhurnal 10, 42–46.
Kozyrev, A. A., Semenova, I. E., and Zemtsovskiy, A. V. (2017). Investigation of Geomechanical Features of the Rock Mass in Mining of Two Contiguous Deposits under Tectonic Stresses. Procedia Eng. 191, 324–331. doi:10.1016/j.proeng.2017.05.188
Kremenetskaya, E. O., and Trjapitsin, V. M. (1995). Induced Seismicity in the Khibiny Massif (Kola Peninsula). Pageoph 145, 29–37. doi:10.1007/BF00879481
Lippiello, E., Petrillo, G., Godano, C., Tramelli, A., Papadimitriou, E., and Karakostas, V. (2019). Forecasting of the First Hour Aftershocks by Means of the Perceived Magnitude. Nat. Commun. 10, 2953. doi:10.1038/s41467-019-10763-3
Massey, F. J. (1951). The Kolmogorov-Smirnov Test for Goodness of Fit. J. Am. Stat. Assoc. 46, 68–78. doi:10.1080/01621459.1951.10500769
Narteau, C., Byrdina, S., Shebalin, P., and Schorlemmer, D. (2009). Common Dependence on Stress for the Two Fundamental Laws of Statistical Seismology. Nature 462, 642–645. doi:10.1038/nature08553
Nivin, V. A. (2019). Occurrence Forms, Composition, Distribution, Origin and Potential Hazard of Natural Hydrogen-Hydrocarbon Gases in Ore Deposits of the Khibiny and Lovozero Massifs: A Review. Minerals 9, 535. doi:10.3390/min9090535
Omi, T., Ogata, Y., Hirata, Y., and Aihara, K. (2013). Forecasting Large Aftershocks within One Day after the Main Shock. Sci. Rep. 3, 2218. doi:10.1038/srep02218
Rebetsky, Y. L., Sim, L. A., and Kozyrev, A. A. (2017). Possible Mechanism of Horizontal Overpressure Generation of the Khibiny, Lovozero, and Kovdor Ore Clusters on the Kola Peninsula. Geol. Ore Deposits 59, 265–280. doi:10.1134/s1075701517040043
Romanowicz, B. (1992). Strike-slip Earthquakes on Quasi-Vertical Transcurrent Faults: Inferences for General Scaling Relations. Geophys. Res. Lett. 19, 481–484. doi:10.1029/92GL00265
Shcherbakov, R., Zhuang, J., and Ogata, Y. (2017). Constraining the Magnitude of the Largest Event in a Foreshock-Main Shock-Aftershock Sequence. Geophys. J. Int. 212, 1–13. doi:10.1093/gji/ggx407
Shebalin, P., and Baranov, S. (2017). Long-Delayed Aftershocks in New Zealand and the 2016 M7.8 Kaikoura Earthquake. Pure Appl. Geophys. 174, 3751–3764. doi:10.1007/s00024-017-1608-9
Shebalin, P., and Baranov, S. (2021). Statistical Laws of Post-seismic Activity. London: John Wiley & Sons, 63–103. chap. 3. doi:10.1002/9781119825050.ch3
Shebalin, P., and Narteau, C. (2017). Depth Dependent Stress Revealed by Aftershocks. Nat. Commun. 8, 1–8. doi:10.1038/s41467-017-01446-y
Shebalin, P. N., Narteau, C., and Baranov, S. V. (2020). Earthquake Productivity Law. Geophys. J. Int. 222, 1264–1269. doi:10.1093/gji/ggaa252
Smirnov, V. B., Ponomarev, A. V., Benard, P., and Patonin, A. V. (2010). Regularities in Transient Modes in the Seismic Process According to the Laboratory and Natural Modeling. Izv. Phys. Solid Earth 46, 104–135. doi:10.1134/S1069351310020023
Smirnov, V. B., Ponomarev, A. V., Stanchits, S. A., Potanina, M. G., Patonin, A. V., Dresen, G., et al. (2019). Laboratory Modeling of Aftershock Sequences: Stress Dependences of the Omori and Gutenberg-Richter Parameters. Izv. Phys. Solid Earth 55, 124–137. doi:10.1134/S1069351319010105
Smirnov, V. B., Kartseva, T. I., Ponomarev, A. V., Patonin, A. V., Bernard, P., Mikhailov, V. O., et al. (2020). On the Relationship between the Omori and Gutenberg-Richter Parameters in Aftershock Sequences. Izv. Phys. Solid Earth 56, 605–622. doi:10.1134/S1069351320050110
Utsu, T., Ogata, Y., and Matsu'ura, R. S. (1995). The Centenary of the Omori Formula for a Decay Law of Aftershock Activity. J. Phys. Earth 43, 1–33. doi:10.4294/jpe1952.43.1
Vere-Jones, D. (2008). A Limit Theorem with Application to Båth's Law in Seismology. Adv. Appl. Probab. 40, 882–896. doi:10.1239/aap/1222868190
Vorobieva, I., Shebalin, P., and Narteau, C. (2016). Break of Slope in Earthquake Size Distribution and Creep Rate along the San Andreas Fault System. Geophys. Res. Lett. 43, 6869–6875. doi:10.1002/2016GL069636
Zaliapin, I., and Ben-Zion, Y. (2013). Earthquake Clusters in Southern california I: Identification and Stability. J. Geophys. Res. Solid Earth 118, 2847–2864. doi:10.1002/jgrb.50179
Zaliapin, I., and Ben-Zion, Y. (2016). A Global Classification and Characterization of Earthquake Clusters. Geophys. J. Int. 207, 608–634. doi:10.1093/gji/ggw300
Keywords: mining-induced seismicity, main shocks, aftershocks, magnitude of the strongest aftershock, dynamic Båth law, Khibiny Mountains
Citation: Motorin A and Baranov S (2022) Distribution of Strongest Aftershock Magnitudes in Mining-Induced Seismicity. Front. Earth Sci. 10:902812. doi: 10.3389/feart.2022.902812
Received: 23 March 2022; Accepted: 25 April 2022;
Published: 11 May 2022.
Edited by:
Vladimir Smirnov, Lomonosov Moscow State University, RussiaReviewed by:
Alina Besedina, Institute of Geosphere Dynamics (RAS), RussiaEleftheria Papadimitriou, Aristotle University of Thessaloniki, Greece
Copyright © 2022 Motorin and Baranov. This is an open-access article distributed under the terms of the Creative Commons Attribution License (CC BY). The use, distribution or reproduction in other forums is permitted, provided the original author(s) and the copyright owner(s) are credited and that the original publication in this journal is cited, in accordance with accepted academic practice. No use, distribution or reproduction is permitted which does not comply with these terms.
*Correspondence: Sergey Baranov, YmFycy52bEBnbWFpbC5jb20=