- 1Istituto Nazionale di Geofisica e Vulcanologia, Sezione di Bologna, Bologna, Italy
- 2Istituto Nazionale di Geofisica e Vulcanologia, Osservatorio Nazionale Terremoti, Roma, Italy
In this work we present and discuss new geodetic velocity and strain-rate fields for the Euro-Mediterranean region obtained from the analysis of continuous GNSS stations. We describe the procedures and methods adopted to analyze raw GPS observations from >4000 stations operating in the Euro-Mediterranean, Eurasian and African regions. The goal of this massive analysis is the monitoring of Earth’s crust deformation in response to tectonic processes, including plate- and micro-plate kinematics, geodynamics, active tectonics, earthquake-cycle, but also the study of a wide range of geophysical processes, natural and anthropogenic subsidence, sea-level changes, and hydrology. We describe the computational infrastructure, the methods and procedures adopted to obtain a three-dimensional GPS velocity field, which is used to obtain spatial velocity gradients and horizontal strain-rates. We then focus on the Euro-Mediterranean region, where we discuss the horizontal and vertical velocities, and spatial velocity gradients, obtained from stations that have time-series lengths longer than 6 and 7 years, which are found to be the minimum spans to provide stable and reliable velocity estimates in the horizontal and vertical components, respectively. We compute the horizontal strain-rate field and discuss deformation patterns and kinematics along the major seismogenic belts of the Nubia-Eurasia plate boundary zone in the Mediterranean region. The distribution and density of continuous GNSS stations in our geodetic solution allow us to estimate the strain-rate field at a spatial scale of ∼27 km over a large part of southern Europe, with the exclusion of the Dinaric mountains and Balkans.
1 Introduction
The increasing availability of GNSS observations, both from geophysical and non-geophysical networks, pushed forward the use of ground displacement measurements to study active geophysical processes on land, ice and atmosphere, with applications in a broad range of Earth science disciplines (e.g., Blewitt et al., 2018). Studies on earthquakes, tectonics, geodynamics, sea-level, hydrology, and atmosphere, to cite a few, can now benefit from unprecedented high spatial and temporal resolution of crustal deformation measurements from continuous GNSS stations. Over the European plate, GNSS networks, managed by national and regional agencies, provide a rather uniform spatial coverage. An enormous effort, in this sense, is being made in the context of various European initiatives and projects, such as the EUREF Permanent GNSS Network (EPN) densification project (https://epnd.sgo-penc.hu) and the European Plate Observing System (EPOS) project (https://gnss-epos.eu). The EPN densification project integrates geodetic solutions (in the form of Solution INdependent EXchange, SINEX, files) at the level of weekly position. These solutions are produced independently by different analysis centers using different approaches and different software, to obtain a combined dataset of displacement time-series, which are used to derive three-dimensional station velocities and strain-rate maps with a much higher spatial resolution than that made available by the EPN itself. The EPOS GNSS Thematic Core Service (Boler et al., 2014; Fernandes et al., 2017), aims at facilitating access to relevant and validated GNSS data, metadata, and products. The GNSS network of the EPOS backbone is independently analyzed by two analysis centers using different methods and software, whose solutions are later combined with others (including the EPN-Densification solution) at the level of geodetic velocities (Kenyeres et al., 2019). Another initiative for a pan-European GNSS velocity field is the EUREF WG on European Dense Velocities (http://pnac.swisstopo.admin.ch/divers/dens_vel/index.html), where GNSS velocities from several geodetic solutions are combined together and used to generate higher-level products (e.g., strain-rate maps). All these initiatives provide, in the end, geodetic products (time-series or velocities) obtained from the combination, at different levels, of diverse and heterogeneous solutions.
Modern computational infrastructures now make it possible to analyze huge amounts of GNSS data, at regional or global scales, providing homogeneous geodetic products. The Nevada Geodetic Laboratory (http://geodesy.unr.edu/), for example, analyzes data from several thousand GNSS stations, at global scale, with the Precise Point Positioning technique (PPP) implemented in the Gipsy software. The disadvantage of this approach is that it requires huge efforts in terms of data collection, metadata generation and processing, and may lack of independent check of processing-related systematic errors or reference frame realization. However, one advantage of this approach, for example, is that uniformly-realized, homogeneous, displacement time series offer the opportunity to study common mode signals/errors, allowing improvements of the signal-to-noise ratio (e.g., Serpelloni et al., 2013; Kreemer and Blewitt, 2021) and improve our ability to detect small transient deformation signals of both tectonic (e.g., Gualandi et al., 2017; Mandler et al., 2021) and non-tectonic origin (e.g., Pintori et al., 2021), with important implications for the study of the earthquake cycle and mechanical properties of the Earth.
At the Istituto Nazionale di Geofisica e Vulcanologia (INGV) three different GNSS data analysis centers routinely process data from continuous GNSS stations in the Euro-Mediterranean area and cross-check the results. Two of them are based on double-difference GNSS processing software, specifically Bernese (Dach et al., 2015) and GAMIT/GLOBK ( Herring et al., 2015), the latter is based on the PPP approach using Gipsy software (Zumberge et al., 1997). The comparison of the three solutions (Avallone et al., 2010; Devoti et al., 2017; Palano et al., 2020) shows overall good agreement, both in terms of displacement time series and velocities.
In this paper we describe the procedures implemented and routinely applied to process data from a pan-European and African GNSS station networks, whose data are freely available and accessible, by using the GAMIT/GLOBK software, which updates the ones described in previous works (e.g., Serpelloni et al., 2006; Avallone et al., 2010; Devoti et al., 2017). In particular, Section 2 describes the GNSS dataset, the computational infrastructure and the methods used to analyze the GPS observations, Section 3 describes the results from the time-series analysis in terms of velocities and strain-rate fields, and, finally, Section 4 describes the kinematics of deformation through velocity and strain-rate profiles across some active tectonic zones of the Euro-Mediterranean plate boundary zone.
2 Data and Methods
2.1 GNSS Data
Figure 1 shows the geographical distribution of the GNSS stations that are routinely downloaded, archived, and processed in the analysis center. The complete list of networks is provided in Supplementary Table S1. Stations are plotted based on their time-series length in the interval from 1/1/1996 to 30/4/2021. As we can see, the European region is vastly covered by GNSS stations, many of which have long-lasting site occupation (>10 years). Access to data for many GNSS networks operating in Central and Eastern Europe is not that easy and sometimes not possible at all. For this reason, the map is certainly incomplete for this specific area and the same is true for Switzerland and most of the Balkans. Regarding the African continent, excluding South Africa, the distribution is rather heterogeneous. It is worth considering that Figure 1 represents a snapshot of the current situation, i.e., at the time of writing, and it will certainly evolve toward better coverage in the near future thanks to pan-European and pan-African efforts.
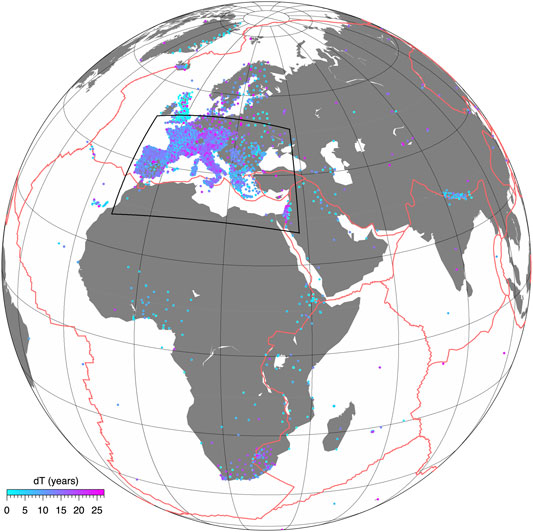
FIGURE 1. Distribution and observational time-span of the GNSS stations analyzed. The black box shows the Euro-Mediterranean region for which we derive the strain-rate map, and where the analysis center described in this work focuses the most. The red lines show major plate boundaries.
The daily GNSS observation data, which are distributed in the form of Receiver INdependent EXchange (RINEX) format (both RINEX2 and RINEX3), are kept synchronized between the INGV-centralized Mediterranean GNSS Archive (AA, 2020), and a set of remote repositories (Supplementary Table S1). Although most of the data come from GNSS networks not specifically installed for geophysical purposes, several works have already demonstrated the validity of these stations for reliable velocity measurements. Importantly, redundancy and high spatial density allow the extraction of spatial patterns even from noisy velocity data (e.g., Serpelloni et al., 2013; Devoti et al., 2017; Briole et al., 2021; Kreemer and Blewitt, 2021).
The largest GNSS network considered is RGP, which is located in France and consists of ∼580 sites. All the ∼440 EUREF-EPN stations are also included in the analysis, together with all IGS stations in the Eurasian, African, Arabian, and Indian plates. All the stations available through the EPOS GNSS data portal (http://gnssdata-epos.oca.eu/#/site) are included in our analysis. The largest private networks considered are operating in Italy, where the Hexagon SmartNet (∼360 sites) and the Topcon NetGeo (∼230 sites) provide free access to daily observations. Overall, the archive comprises data from ∼4030 individual GNSS stations, although the temporal evolution of RINEX files is not constant or linearly growing in time, as shown in Figure 2. Currently, we process ∼2500–3000 stations each day.
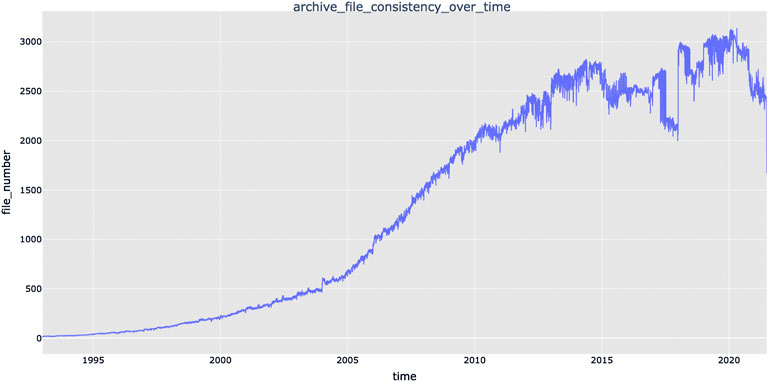
FIGURE 2. Temporal evolution of the number of RINEX files archived from 1996 to the end of April 2021.
Information on the GNSS devices the stations are equipped with (e.g., antenna type, receiver type), the so-called metadata, is required by scientific software for processing GNSS data. Normally, the history of changes to the GNSS configuration of the stations is usually stored in a SITELOG file (https://kb.igs.org/hc/en-us/articles/202011433-Current-IGS-Site-Guidelines), at least for the stations belonging to the most important GNSS networks. In this case, the information contained in the SITELOG is simply transferred to the so-called station information file according to a specific format for each GNSS processing software. Unfortunately, the SITELOG is not the standard for many GNSS networks. In this latter case, the history of instrumental changes must be reconstructed through the information that can be retrieved from the header of the RINEX file or through specific searches made by the user.
In summary, GNSS station metadata is retrieved from two main sources: 1) the standard IGS SITELOG, when available, and 2) the RINEX file headers. The metadata is managed and processed through a relational database. Specifically, a suite of Python scripts has been developed in order to manage errors or incorrect formatting within the SITELOG and RINEX file headers and to merge the different sources of metadata to reconstruct the history of the station’s GNSS instrument changes (Randazzo et al., 2018; Randazzo et al., 2022).
Because of the continuous increase in the number of GNSS stations worldwide, a relatively large number of different stations sharing the same 4-character GNSS station ID are continuously discovered. This problem is particularly annoying while processing thousands of GNSS stations, especially if they belong to different networks. By using four characters in building the GNSS station ID (i.e., the MARKER NAME within the RINEX file), about eighty thousand combinations of characters (a-z, 0–9) are possible. While this number may seem quite large, name conflicts are increasingly common. For these reasons and for the ability of the current operating systems (OS) to support 255-character file names, the RINEX naming convention has evolved over time into the RINEX3 naming convention, which involves a 9-character GNSS station ID. Unfortunately, some GNSS processing software cannot actually handle this kind of ID.
For the latter reason, we have developed a Python3 routine capable of detecting the availability of a new station within the remote repository by checking for its 4-character ID against a local station dictionary. If stations of the same name are found, a cross-check of the coordinates is carried out in order to determine whether the RINEX files belong to the same station or not. In the latter case, the new station is automatically assigned an alias in the dictionary and all files (e.g., station information files, a priori coordinates, etc.) but RINEX are renamed accordingly.
2.2 Computational Infrastructure
The analysis of GNSS observations with the double-differencing approach requires intense use of computational resources. In fact, it is known that the computational time increases exponentially, and not linearly, with the number of stations, differently from the PPP approach. For this reason, large GNSS networks are commonly separated into smaller sub-networks, typically of a number <100, and analyzed independently. Recently, we moved our processing and post-processing procedures on a new computational infrastructure, hosted at INGV in Bologna.
The High Performance Computing (HPC) Cluster in the Bologna Department, called ADA, is a Beowulf parallel computing system consisting of a Master Node, 12 Computing Nodes (for a whole total of 1712 cores, 6TB RAM, InfiniBand connectivity at 100Gbps and Ethernet connectivity at 10Gbps, 20TB of Scratch space) for high performing computation and 2 HPC Workstations (for a whole total of 96 cores, 768GB RAM Ethernet connectivity at 10 Gb/s, 40TB of Scratch space) for data visualization, post-processing and final tool elaboration. ADA is based on the Linux/GNU CentOS 7 distribution developed on OpenHPC (https://openhpc.community) guidelines. OpenHPC is a community effort to support collaborative development and management for HPC Linux clusters including provisioning tools, resource management, I/O clients, tools, and a variety of scientific libraries. In this contest, ADA uses SLURM resource manager and job scheduler (Simple Linux Utility for Resource Management) and WareWulf (https://warewulf.lbl.gov) as provisioning systems (https://slurm.schedmd.com). SLURM is in charge of three key functions: 1) allocating exclusive and/or non-exclusive access to resources in computer nodes to users for a specific duration of time, 2) providing a framework for starting, executing, and monitoring work (such as Message Passing Interface - MPI) on a set of allocated nodes, and 3) arbitrating contention for resources by managing a queue of pending jobs. WareWulf is a scalable system provisioning and management suite specifically developed for large HPC Linux clusters. WareWulf facilitates the installation of the cluster and the long-term administration, automates the distribution of the node file system during boot and supports the central administration model. In order to work with ADA, it is necessary to adopt an Authentication, Authorization and Accounting (AAA) protocol to allow respectively: to access to cluster resources with own rights, to manage shared data permissions and to grant priorities on project/group resources. AAA is implemented by a combination of the Lightweight Directory Access Protocol (LDAP) and SLURM tools (https://wiki.fysik.dtu.dk/niflheim/SLURM). ADA mounts Data Sets via distributed network filesystems. In order to provide a flexible development environment, ADA adopts the use of modules (via Lmod) and includes creation of module files for relevant components as part of the build process.
2.3 GPS Processing
The GAMIT/GLOBK software (10.71 version) is used to analyze the Global Positioning System (GPS) observations from the continuous GNSS stations shown in Figure 1. Although the number of stations acquiring full GNSS data is growing, we limit routine analysis to GPS observables only. The processing scheme is based on three different steps: 1) GPS phase reduction and generation of loosely-constrained sub-networks solutions, 2) combination of daily subnet solutions and realization of positions in specific reference frames, and 3) time series analysis.
Step 1 is performed using the GAMIT module of the GAMIT/GLOBK software. First, the RINEX dataset available in the archive is subdivided, for each day, into smaller sub-networks, each consisting of 40 stations, plus an additional network of tie-stations (including at least one site in common with all clusters) and a subnet including all the IGb14 core sites available in the study region. The number of 40 sites has been defined after testing processing times on the HPC cluster, considering different sub-networks dimensions. We use the NETSEL program of the GAMIT/GLOBK software, which considers base lengths among stations. The area covered by GNSS stations, on a particular day, is spaced with a 1x1 degree grid and the sum of reciprocals of the distances to the stations is assigned as a density value to each grid point. The grid point with the largest density value is selected as the center of the first sub-network, to which the 40 closest stations are assigned. The procedure is applied to the remaining stations iteratively. In order to tie these groups of stations, an additional group composed by common stations, using 1 tie-site per sub-network, is created. In order to improve the link between all sub nets, considering the heterogeneous density of stations (dense in Europe and sparse in Africa), we also include a subnet containing the IGb14 core stations available in the study area, which are later used to define the reference frame, together with other IGb14 sites.
The GAMIT software uses the ionosphere-free linear combination of GPS phase observables by applying a double differencing technique to eliminate phase biases related to drifts in the satellite and receiver clock oscillators. GPS phase data are weighted according to an elevation-angle-dependent error model (Herring et al., 2015) using an iterative analysis procedure whereby the elevation dependence was determined by the observed scatter of phase residuals. The parameters of satellite orbit are fixed to the IGS final values. IGS absolute antenna phase center models (available at https://files.igs.org/pub/station/general/igs14_WWWW.atx) for both satellite and ground-based antennas, as well as the NGS antenna calibrations that are used to supplement the version distributed with GAMIT/GLOBK (https://www.ngs.noaa.gov/ANTCAL), are adopted in order to improve the accuracy of site position estimations. The first-order ionospheric delay is eliminated by using the ionosphere-free linear combination, while second-order ionospheric corrections (Petrie et al., 2010) are applied using the IONEX files from the Center for Orbit Determination in Europe (CODE). The tropospheric delay is modeled as a piecewise linear model and estimated using the Vienna Mapping Function 1 (VMF1, Boehm et al., 2007) with a 10° cutoff. We use the Global Pressure and Temperature 2 (GPT2; Lagler et al., 2013) model to provide a priori hydrostatic delay. The Earth Orientation Parameters (EOP) are tightly constrained to priori values obtained from IERS Bulletin B. The ocean tidal loading is corrected using the FES2004 model (Lyard et al., 2006).
Processing is conducted independently for each day and for each subnetwork. For example, day of year 050 of 2020 (shown in Figure 3) consists of 63 jobs (61 sub-networks + 1 tie-network + 1 IGb14 core site network), and the analysis of year 2020 requires 22.195 jobs. Each job is managed by the SLURM scheduler running automatic procedures specifically developed to handle the GAMIT sh_gamit script in our computational infrastructure that copy and write data, metadata and ancillary files in scratch directories, moving daily solutions for each independent task/sub-network in the solutions archive. In terms of computational times, the GAMIT analysis of 1 month of data, comprising ∼2.200 tasks in 2021, takes less than 4 h, whereas the combination with GLOBK and time-series generation takes less than 30 min.
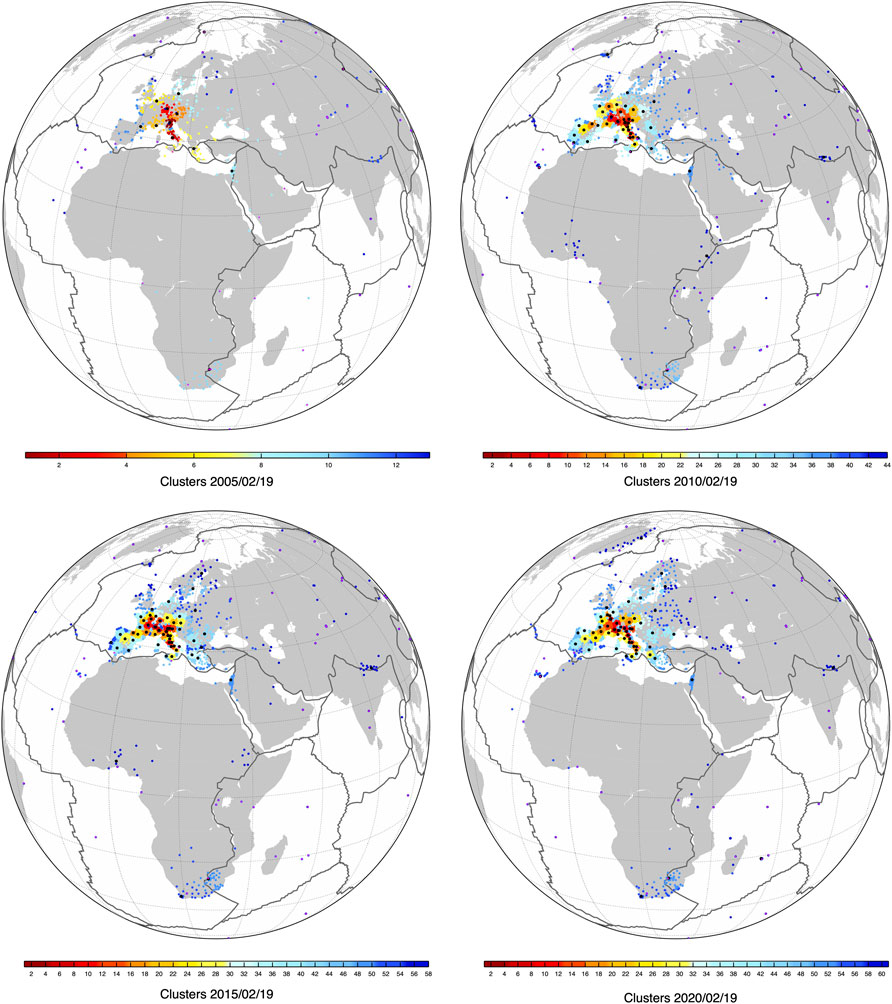
FIGURE 3. Distribution of sub-networks (or daily clusters) for different epochs (day of year 050 of 2005, 2010, 2015, and 2020). The colors from red to blue represent the cluster ID/number. The black and purple circles show the tie-stations and the available IGb14-core sites, respectively.
In Step 2 the daily, loosely constrained, subnet solutions, plus the tie-network and the IGb14-core subnet, are combined using the GLOBK software, which adopts a Kalman filter estimation algorithm, simultaneously realizing a global reference frame by applying generalized constraints (Dong et al., 1998). Specifically, we define the reference frame by minimizing the velocities of the IGb14 core stations, augmented by a set of high-quality IGS stations (http://igscb.jpl.nasa.gov), while estimating a seven-parameter transformation with respect to the GPS realization of the ITRF2014 frame, i.e., the IGb14 reference frame.
In Step 3, the displacement time-series are analyzed in order to estimate linear velocities. Our routine processing uses the ANALYZE_TSERI (ATS) code of the Quasi Observation Combination Analysis (QOCA) software, developed by JPL (https://qoca.jpl.nasa.gov). ATS estimates, in a least-square sense, different parameters describing the displacement time-series of GNSS stations, where the major ones are: offsets due to equipment changes (derived from station’s metadata), linear trend, seasonal (annual and semi-annual) terms, co-seismic offsets and post-seismic relaxation. ATS can also model any shape of periodic pattern and its modulation, but we do not apply complex models for the routine analysis. The uncertainties on the linear velocities are estimated using a white + Flicker noise model, following Williams, (2003) formulation.
In the next section, the results from ATS are compared with the results from other two software: HECTOR (Bos et al., 2013) and MIDAS (Blewitt et al., 2016). Other GNSS time-series analysis software are available, such as TSFIT (Floyd and Herring, 2020) and SARI (Santamaría-Gómez, 2019). We limited our analysis to HECTOR and MIDAS because these are used to realize EPOS products (https://gnssproducts.epos.ubi.pt). HECTOR, different from ATS, assumes a specific model for the temporal correlated noise in the observations and estimates both the linear trend and the parameters of the chosen noise model using the Maximum Likelihood Estimation (MLE) method. MIDAS (Median Interannual Difference Adjusted for Skewness) median-trend algorithm, is a variant of the Theil-Sen nonparametric median trend estimator (Theil, 1950; Sen, 1968), modified to use pairs of data in the time series separated by approximately 1 year, making it insensitive to seasonal variation and time series outliers. The MIDAS-estimated velocity is the median of the distribution of these ∼1-year slopes, making this algorithm also insensitive to the effects of steps in the time series. MIDAS provides realistic uncertainties based on the scaled median of absolute deviations of the residual dispersion, and thus, velocity uncertainties increase if the time series have more scatter or are less linear.
3 Results
3.1 Time Series and Velocities
We fit the IGb14 time-series with a “classic” trajectory model (Bevis and Brown, 2014) consisting of a linear term, annual and semi-annual seasonal terms, instrumental offsets and, eventually, co-seismic offsets and post-seismic decays. We use information in the metadata to set the epochs of instrumental jumps. Post-fit RMS analyses and visual inspections provide information on additional, undocumented, offsets. Co-seismic offsets, instead, are assigned based on the magnitude of instrumental earthquakes, retrieved from seismic bulletins (e.g., USGS), and the distance of each station from the epicenter. Potential earthquake jumps are marked if the distance r0 from a station to the epicenter is less than a threshold distance calculated using a simple formula based on event magnitude: r0 = 10^(0.5*M—0.8) km, where M is the earthquake magnitude. As regard post-seismic deformation, this analysis is specifically carried out for sites affected by earthquakes with M > 5.5. The amplitude and decay times of the post-seismic displacements, assuming an exponential model, are obtained using a constrained non-linear least-squares, and reported, together with the co-seismic offsets, as a Supplementary Data (Supplementary Data S1). It is worth considering that the linear trends estimated at GNSS stations located near active volcanic areas are not accurate and fully representative of long-term tectonic deformation, because of non-linear transient deformation signals recorded by those stations, due to unrest episodes, magma dynamics or gravitational collapse (Newman et al., 2012; Mattia et al., 2015; De Martino et al., 2021; Bruno et al., 2022). However, given the long time-span available for some stations, these linear velocity values still contain some informative content that is discussed in Section 4.
The velocity estimates, for all stations with more than 2.5 years of observation time-span are provided as Supplementary Dataset (Supplementary Data S2). It is well known that the length of the time-series is a primary factor in limiting the accuracy and precision of the estimated linear velocities. Blewitt and Lavallee, (2002) suggest that 2.5 years is the standard minimum data span for velocity solutions, intended for tectonic interpretation, to avoid velocity biases due to the presence of annual signals in the time-series. Masson et al. (2019), by analyzing synthetic displacement time-series, concluded that series durations of less than 4.5 years are not suitable for studies that require precision lower than 1 mm/yr. Series durations longer than 8 years provide small velocity biases in both horizontal (0.2 mm/yr) and vertical (0.5 mm/yr) velocities. Masson et al. (2019) also concluded that very long durations do not ensure a significantly lower improvement in the velocity estimates with respect to a series of 8–10 years; long-period noise and multi-annual loading signals are critical to further improve velocity precision. Here we exploit the large number of GNSS stations processed to infer some hints on the minimum length required to stabilize the velocity estimates toward the one obtained by using the longest time series duration. We limit the analysis to a set of stations continuously running in the 2009–2021 time span and characterized by a rather complete observation history (percentage of missing data lower than 10%) and low RMS values (lower than 1.5 and 5.5 mm for the horizontal and vertical components, respectively). The dataset includes 566 stations, covering the Euro-Mediterranean region (see the black box in Figure 1). We use HECTOR, assuming a Power-Law (PL) + White Noise (WN) stochastic model, to estimate a linear trend, together with annual and semi-annual terms on IGb14 displacement time-series corrected for offsets and post-seismic deformation. Looking at the distribution of the spectral index values estimated for each component (Figure 4), Flicker noise appears to be the appropriate model to describe correlated noise in the analyzed position time-series.

FIGURE 4. Distribution of the spectral index values estimated on the East, North and Vertical components using the HECTOR software, assuming a PL + WN noise model.
It is worth considering that these values are obtained from displacement time-series where the instrumental and tectonic offsets are assumed as known and corrected apriori. The impact of offsets in the noise and uncertainties has been discussed by Santamaría‐Gómez and Ray, (2021), who found that estimating offset parameters absorbs most of the low-frequency colored noise in the series, independent of both the series length and the number of offsets, changing the apparent noise color toward whiter.
We estimate the velocities and uncertainties, adopting a PL + WN noise model, using the whole time-span (12 years), and use these values as reference to be compared with velocity values obtained using increasing series length from an initial time-span of 2.5 years, with steps of 100 days. Starting from the reference velocity values, we check if the value obtained for decreasing time intervals (testing value) corresponds to the reference value. We claim that there is correspondence if the difference between the reference and testing velocity value is smaller than two times the error associated with the reference value (see Figure 5A).
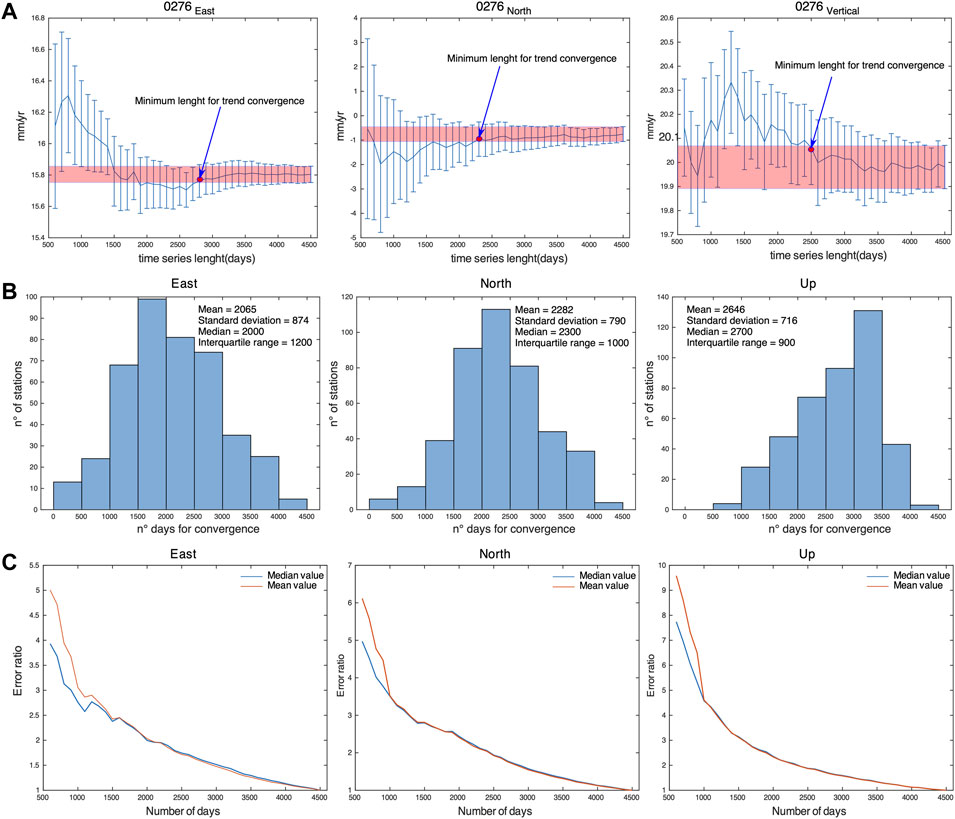
FIGURE 5. (A) Examples of velocity uncertainty values (2σ) for station 0276 (in Germany), estimated for increasing time-spans starting from series length of 2.5–12 years (reference value), with 100 days time steps. The red band shows the 95% confidence error obtained using the whole time-series and a PL-WN model. The red point marks the number of days when the difference between the velocity value and the reference value is smaller than two times the error associated with the reference value. (B) Distribution of the number of days to converge toward the reference velocity values (obtained using the whole, 12 years, time series) at 95% confidence level. (C) Mean and median value of the ratio between the error on the velocities estimated with increasing time-series length from an initial time-span of 2.5 years and steps of 100 days, and the error on the velocity estimated using the longest time series.
Figure 5B shows the mean and median values of the number of days to convergence for the east, north and vertical components of the velocities. For the east, north and vertical components, 6.0 ± 3.6 years, 6.3 ± 2.7 years and 7.4 ± 2.2 years (considering the median and interquartile range values) are needed to have velocity estimates that are consistent, at 95% confidence level, with the velocities obtained using 12 years of data. As regards the velocity uncertainties, we compute the ratio between the value estimated at a certain series length and the value obtained using the longest time series, which acts as a normalizing factor. We then estimate the mean and median ratio values over the dataset, observing that the error ratios decrease with an exponential-like behavior as the length of the time series increases (Figure 5B). Figure 5C shows that after 5.5–7 years, the uncertainties in the horizontal components are less than two times the one obtained with the 12 years series.
It is worth considering that the numbers obtained in these analyses are to be considered optimistic, since they are obtained considering a relatively large number of sites but selected among the ones with the highest quality in terms of series completeness. It is likely that including “bad” sites would cause larger dispersion of the distributions.
Considering the 12 years long time-series, we compare the velocities and uncertainties obtained using ATS with the results obtained using HECTOR, adopting a PL + WN model, and MIDAS. Supplementary Tables S2, S3 report the results, in terms of velocity and uncertainty differences between ATS and HECTOR, ATS and MIDAS and between HECTOR and MIDAS (see also Supplementary Figures S1, S2). Overall, we find that the three software provide very consistent results in the velocity values (see Supplementary Figure S3), with ATS and HECTOR providing very consistent uncertainties, which are, however, smaller than the ones obtained with MIDAS.
3.2 Multiscale Velocity and Strain-Rate Fields
Considering the results described in Section 3.1, we estimate the velocities and uncertainties of all stations with more than 6 and 7 years of observation time-spans, for the horizontal and vertical components, respectively, using the ATS software, which is routinely adopted in our GNSS data analysis center. Figure 6 shows the horizontal velocities (Figure 6A), rotated in the Eurasian-fixed reference frame from Altamimi et al. (2017), and the absolute (IGb14) vertical velocities (Figure 6B). As regards the horizontal component, we integrate velocity data from published solutions, in particular for Turkey (Özdemir and Karslıoğlu, 2019), Tunisia (Bahrouni et al., 2020), Algeria (Bougrine et al., 2019) and Morocco (Koulali et al., 2011). The common stations between the published velocity fields and our solution are used to estimate the 6 parameter Helmert transformation. The published velocities are then aligned to the IGb14 reference frame defined in our solution and rotated in the same Eurasia-fixed frame (black arrows in Figure 6A). Figure 6 shows a greatly improved kinematic picture, in terms of stations density, accuracy and precision, with respect to the first works dealing with GPS velocities and strain-rates in the Euro-Mediterranean region of the first decades of the 2000s. Nocquet, (2012), combined published GPS results, from campaign and continuous GPS networks, to derive a geodetic horizontal velocity field. Despite the limited number of stations and time-series lengths, the overall blocks kinematics discussed in Nocquet, (2012) is still valid, but new velocity solutions, including the one presented in this work, provide better spatially resolved strains across active tectonic blocks boundaries, with important implications for the study of active faults and geodynamics.
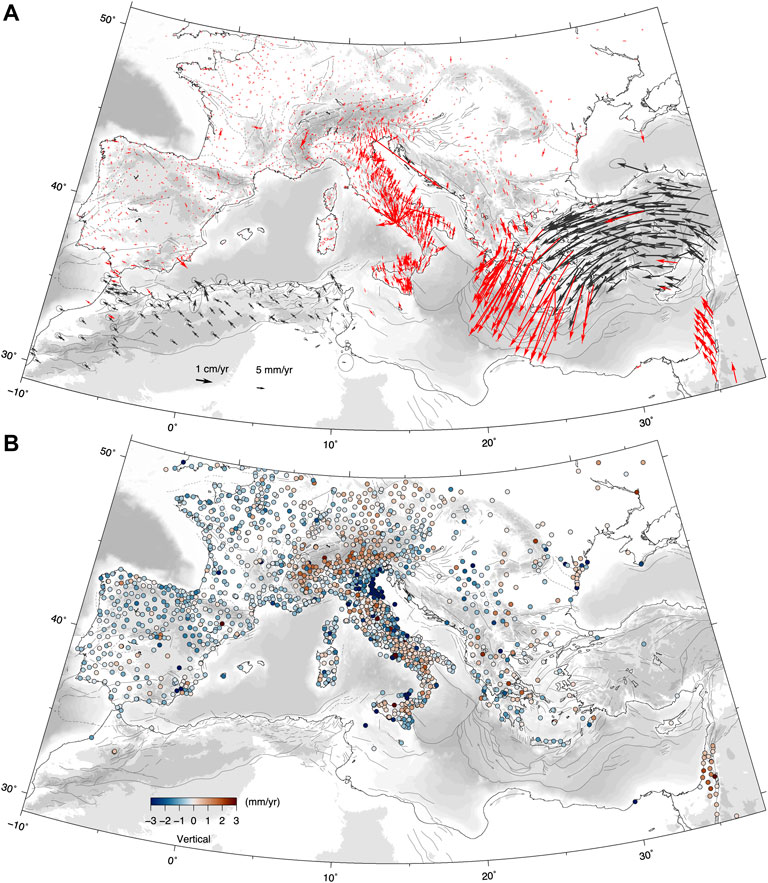
FIGURE 6. Horizontal (A) and vertical (B) velocities. The red arrows in A represent horizontal velocities, with the black arrows refer to horizontal velocities of continuous GNSS stations from published velocity fields, that provide a kinematic framework for northern Africa and Anatolia, where no freely accessible GNSS RINEX data are available, to our knowledge. Blue and red circles in B show negative (subsidence) and positive (uplift) vertical ground motion rates. The maps contain some “anomalous” velocity values, with respect to the mean trends, that must be considered as non-tectonic outliers.
In order to better describe the kinematics of the Euro-Mediterranean Africa-Eurasia plate boundary zone, we compute the continuous velocity field from the discrete velocity values and derive the horizontal strain-rate field. We use the wavelet-based multiscale approach described in Tape et al. (2009), which adopts spherical wavelets to estimate a spatially continuous velocity field on a sphere starting from a set of irregularly spaced geodetic stations. This method describes the surface velocity at a given point of the Earth’s surface as the superposition of values obtained at different spatial scales. The multiscale aspect is achieved by using wavelets from progressively finer meshes, going to finer scales only where justifiable by GNSS site density, that is, allowing for short-scale spherical wavelets in the estimation where GNSS stations are dense, and allowing only for long-scale spherical wavelets in the estimation where stations are sparse. This approach allows to locally match the smallest resolved process according to the local spatial density of observations, as well as to detect outliers in the set of velocity measurements. Supplementary Figure S4 shows a Delaunay triangulation of the GNSS stations used to compute the multiscale velocity field, where each site is colored as a function of the minimum distance (in km) from the connected sites. The figure provides a clear view of stations density and its important variations in the study region.
Following Tape’s et al. (2009) notation, q indicates the wavelet order with a corresponding spatial scale. In the case of tectonic deformation fields, reasonable maximum values of q ranges between 7 and 9, corresponding to length scales of ∼55 and ∼14 km, respectively. Figure 7 shows the maximum q-scale wavelet covering each area, where the coverage is determined by the length scale for each spherical wavelet. Where stations are dense, wavelets with all scales, q = 1–10 (in red) are available; where stations are sparse, only wavelets with long length scales are available (q = 1–7). Figure 7 points out that strain-rate variations at spatial scales smaller than ∼27 km (qmax >8) are resolvable only in some regions, such as along the Apennines for q = 9 (∼14 km) and only as spot-like areas for q = 10 (∼7 km), consistently with Supplementary Figure S4.
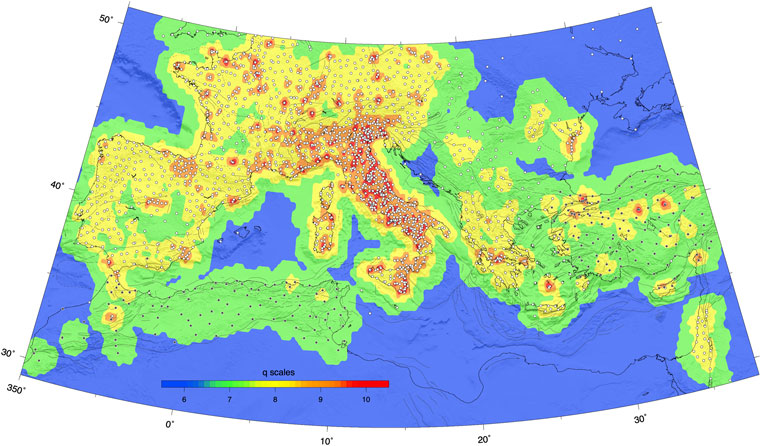
FIGURE 7. Maximum values of spherical-wavelet orders based on the GNSS station distribution (white circles from the analysis discussed in this work, black circles from literature). The interval q = 1–10 is considered but only the 6–10 (∼110–7 km) interval is shown in figure. The density of the geodetic points controls the selection of spherical wavelets, whose center points are not shown in this map. The color map shows the maximum-q scale wavelet that covers each area where the coverage is determined by the length scale for each spherical wavelet. Where stations are dense, wavelets with all scales q = 1–10 (red corresponds to length scales of ∼7 km) are available; where stations are sparse, only wavelets with longer length scales q = 4–7 (green corresponds to length scales of ∼55 km) are available.
We use qmax = 8 (yellow areas in Figure 7), corresponding to a scale value of ∼27 km, as the maximum allowed wavelet scale, and estimate 1) the continuous vertical velocity field, using only the velocities estimated in this work (the gridded values are provided as Supplementary Data in Supplementary Data S3), and 2) the continuous horizontal velocity field obtained integrating our solution with horizontal velocity fields for northern Africa and Anatolia (the gridded values are provided as Supplementary Data in Supplementary Data S3). Figure 8 shows the continuous vertical (Figure 8A) and horizontal (Figure 8B) velocity fields. Surface derivatives and tensor and scalar quantities are computed from the horizontal continuous velocity field (the gridded values are provided as Supplementary Data in Supplementary Data S4). Figure 9 shows a map of the scalar strain-rate defined as the square root of the sum of squares of all its components (Bos et al., 2003; Tape et al., 2009). Figure 10 shows the maximum compressional and extensional principal strain-rate axes plotted on a regular grid and superimposed on a map of the dilatation rate, or volumetric strain rate. In all these maps, we only show regions that are resolved to a minimum scale of ∼55 km (q = 7), masking the regions of the estimated vertical velocity and strain-rate fields resolved at larger spatial scales based on the diagonal terms of the posterior data covariance (Tape et al., 2009). The maps have been obtained excluding sites that show velocity residuals greater than 5 mm/yr. Supplementary Figure S5 shows the modulus of the horizontal velocity residuals. The largest residuals are observed in the volcanic areas (Etna, Campi Flegrei, Aeolian Islands), where higher wavelet orders (qmax > 8) would be necessary to better fit the short-wavelength volcanic deformation signals. High residuals are also present in the Ionian islands, and, involving regions where velocities have been integrated from the literature, in northern Africa and along the North Anatolian fault, where we cannot check the time-series for possible problems in the velocity estimations.
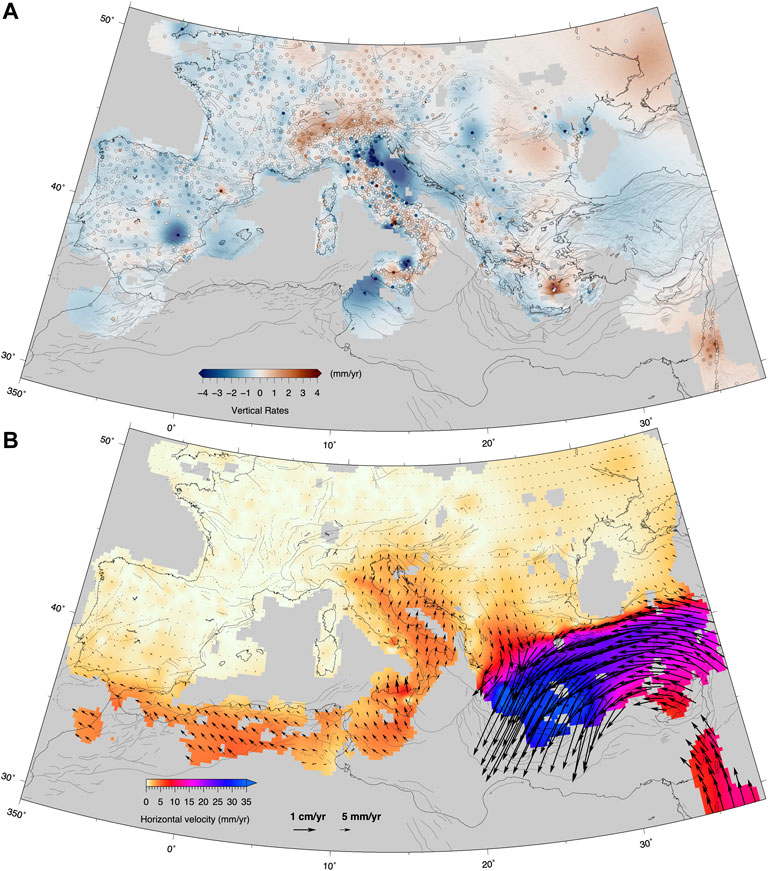
FIGURE 8. Continuous vertical (A) and horizontal (B) velocity fields in the Eurasia-fixed frame obtained by adopting the multiscale spherical wavelets approach from Tape et al. (2009). We mask regions of the estimated vertical velocity field based on the diagonal terms of the posterior data covariance. The regions shown in color are resolved to a minimum length scale of ∼55 km (q = 7). The dashed lines show the traces of the cross sections discussed in Section 5.
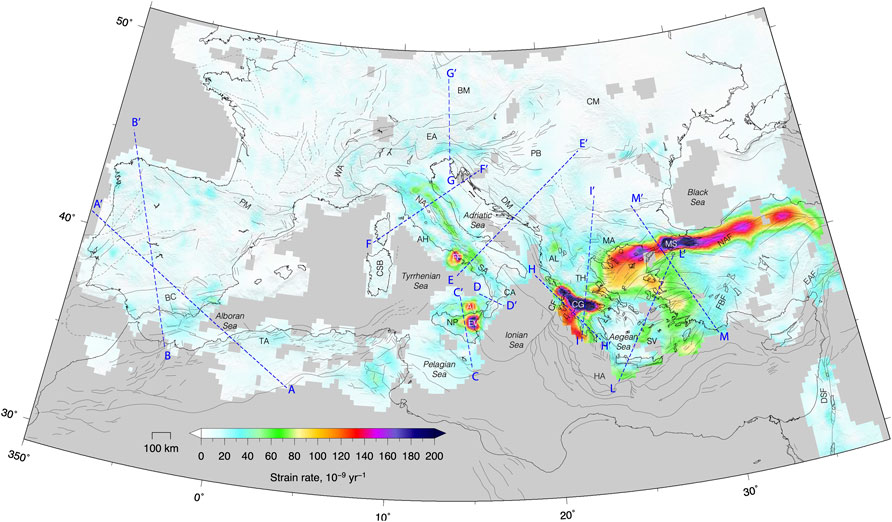
FIGURE 9. Map of the scalar value of the strain-rate tensor defined as the square root of the sum of squares of all its components (Bos et al., 2003; Tape et al., 2009). As in Figure 8, we mask regions of the estimated vertical velocity field based on the diagonal terms of the posterior data covariance. The regions shown in color are resolved to a minimum scale of ∼55 km (q = 7). The dashed lines show the traces of the (∼200 km wide) cross sections shown in Figures from 11 to 15. EV, Etna Volcano; AI, AEolian Islands; FF, Flegrei Field; AH, Alban Hills; SV, Santorini Volcano. BC, Betic Cordillera; AS, Alboran Sea; TA, Tell Atlas; PM, Pyrenee mountains; WA, Western Alps; EA, Eastern Alps; NA, Northern Apennines; SA, Southern Apennines; CA, Calabrian Arc; NP, Nebrodi-Peloritani mountains; BM, Bohemian Massif; PB, Pannonian Basin; CM, Carpathian Mountains; DM, Dinaric mountains; AL, Albanides; HA, Hellenic Arc; CG, Corinth Gulf; TH, Thessaly; MA, Macedonia; MS, Marmara Sea; NAF, North Anatolian Fault; EAF, East Anatolian Fault, FBF, Fethiye Burdur Fault; DSF, Dead Sea Fault.
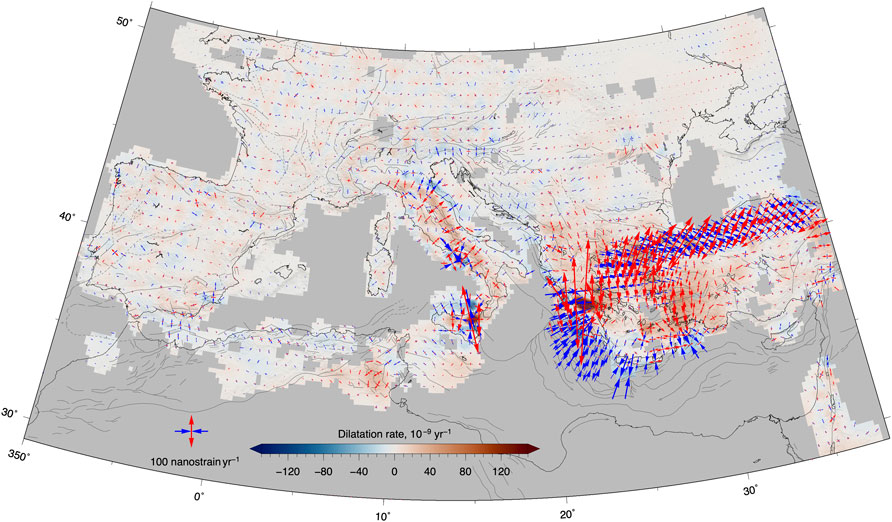
FIGURE 10. Map of the dilatational rate, where blue and red colors indicate contractional and extensional deformation, respectively. The diverging (blue) and converging (red) arrows show the axes of the principal strain-rates.
Supplementary Figure S6 shows the difference in the scalar strain-rate values obtained assuming qmax = 11 (corresponding to a maximum spatial scale of ∼3.4 km) and qmax = 8 (maximum spatial scale of ∼27 km, as in Figure 9). The greater differences are localized, as expected, in correspondence of active volcanic areas and in the Gulf of Corinth. Elsewhere, Supplementary Figure S6 shows short-wavelength, localized, spots of relatively high strain-rate differences that are mostly located in correspondence of regions of high station’s density (see Supplementary Figure S4), without a clear spatial pattern, for example, along the Apennine-Alpine belt.
We also use the method proposed by Shen et al. (2015) to calculate the horizontal strain-rate field. The results are presented in the Supplementary Material and, overall, confirm the results obtained using the multiscale approach of Tape et al. (2009), both in terms of strain-rates pattern (Supplementary Figure S7) and spatial resolution (Supplementary Figure S8). In the next section we discuss the main features of the velocity and strain-rate fields in the Euro-Mediterranean region.
4 Discussion
4.1 Vertical and Horizontal Deformation Rates
The results presented in this work provide some new clues on the actual ability of GNSS stations to measure spatial gradients of the geodetic velocity field across the Africa-Eurasia plate boundary zone in the Mediterranean region and its surroundings. Figure 7 shows that for large parts of the tectonically active belts in southern Europe the horizontal strain-rate field is resolved at a spatial scale of ∼27 km (adopting Tape et al., 2009 notation). A poorer spatial resolution (∼55 km) is present in northern Africa (Morocco, Algeria and Tunisia), along the Dinaric chain and in Anatolia. Along the Alps and the Apennines, the strain-rate field is, on average, resolved at a spatial scale of ∼13 km, providing a well-constrained image of the different deformation belts along the Apennines. Nevertheless, recent studies that investigate interseismic coupling on active faults in the Alps and Apennines (e.g., Cheloni et al., 2014; Anderlini et al., 2016; Serpelloni et al., 2016) suggest that higher GNSS station densities (interdistance < 10 km) are required to properly resolve the spatial extent of locked fault asperities on typical fault segments in these areas.
Figure 8 shows maps of the vertical and horizontal multiscale velocity fields. The latter is given with respect to the Eurasian plate as described by the ITRF 2014 Euler pole (Altamimi et al., 2017). NW-ward, “Africa-Eurasia”, oriented horizontal velocities characterize the Western Mediterranean, with trends rotating to N-ward at Lon. ∼14°E, where NE-ward, “Adria-Eurasia”, directions characterize the Apennines. East of Lon. ∼20°E, S-ward velocity trends characterize the Balkans, with increasing rates toward the Aegean region, where the fastest velocities (> 30 mm/yr) of the Mediterranean region are observed. Figure 8B already highlights areas characterized by sharp velocity variations, such as in the Aegean/Anatolia region and the Apennines, and regions with more distributed velocity variations, such as south Iberia and the Eastern Alps and Pannonian Basin. These features are better emphasized in the horizontal strain-rate map shown in Figure 9, which highlights rather diffuse belts of deformation in northern Africa and Southern Iberia, narrower deformation belts along the Apennine and Alpine chains, in the Balkans and Ionian Greece and Gulf of Corinth, where, together with the Marmara Sea, the highest strain-rates of the Mediterranean region are measured. More localized, relatively higher strain-rates are observed at active volcanic districts: the Etna volcano and Aeolian Islands in northern Sicily, the Flegrei Fields in the southern Apennines. Lower, but still localized, strain-rates highlight the Alban Hills in central Italy and Santorini, in Greece.
Due to the lack of raw GNSS data available for northern Africa and Turkey, our vertical velocity solution is limited to southern and central European countries, as shown in Figure 8A. The vertical velocity field is overall consistent with the one presented in Serpelloni et al. (2013), where fewer stations and much shorter time-series (with a minimum series length of 2.5 years) were used. The new vertical velocity has also greater precision, accuracy and coverage than those previously available (e.g., Serpelloni et al., 2013; Faccenna et al., 2014a; Devoti et al., 2017). Figure 8A shows that western Europe is mostly stable (within ± 0.5 mm/yr) or slowly subsiding (at an average rate of ∼1 mm/yr). The most striking feature of Figure 8A is the belt of positive velocities along the Apennines and the Alps, from northern Sicily, through the Calabrian Arc and the Southern Apennines, which is interrupted in the Central Apennines, affected by important seismic sequences in 2009 (L’Aquila) and 2016 (Amatrice-Visso-Norcia).
In the next sections we will describe and discuss horizontal and vertical spatial velocity gradients in the Euro-Mediterranean area. The description is not intended to be exhaustive for the entire study region, and we focus on some profiles across major plate boundary zones in the western, central and eastern Mediterranean.
4.2 Western Mediterranean
In northern Africa the GNSS velocity data available (Bougrine et al., 2019) highlight a diffuse belt of deformation, with principal, compressive, strain-rate axes oriented about parallel to Africa-Eurasia plate convergence and maximum strain-rate values of the order of 20–40 nanostrain/yr (Figures 9, 10). In Tunisia, GNSS velocity vectors appear not very coherent, probably due to the use of limited data ranges of continuous stations and the strain-rate field resembles the pattern already discussed in Bahrouni et al. (2020). The main features are the NW-SE shortening in the Tell Atlas, which is, however, not well spatially resolved by the data, and SW-NE extension that is likely accommodated across the NNW-SSE trending grabens that characterize central Tunisia.
Profile-parallel velocities in Figure 11 show, according to Bougrine et al. (2019), that ∼2 mm/yr of shortening is accommodated across the Tell Atlas in northern Algeria. Another ∼2 mm/yr of shortening is accommodated in the Alboran Sea, where the principal compressional strain-rate axes are oriented N-S. A more diffuse deformation characterizes Southern Iberia, where shortening is mainly confined to Murcia, with N-S compression being associated with relatively higher strain-rate values (up to 50 nanostrain/yr). About ∼ E-W extension prevails in Southern Iberia in agreement with previous results (e.g., Stich et al., 2006; Sparacino et al., 2020). Profile normal velocities (bottom panel in Figure 11) describe ∼2 mm/yr of left-lateral shear accommodated in the internal Betics Cordillera, likely across the Carboneras fault, and ∼1 mm/yr of right-lateral shear across the Crevilente fault, depicting a kinematics that is consistent with seismotectonic data (Stich et al., 2006; Rutter et al., 2012). North of the external Betics Cordillera, there is only limited deformation with a, not well-defined, sub-mm/yr shortening along A-A’ profile. As regards vertical ground velocities, profile B-B’ in Figure 12 runs across Iberia, showing some “fluctuations” of the vertical velocities, with positive values at sites in the Betics and Sierra Morena mountain belts, and, further to the north, in Galicia, without, however, a clear correlation between strain-rates and vertical ground velocities. The strain-rate field of Figure 9 does not evidence a well-defined deformation belt along the Pyrenees, as in Masson et al. (2019), being the weak SW-NE extensional deformation of the same level of other strain-patches in inner Iberia and central France.
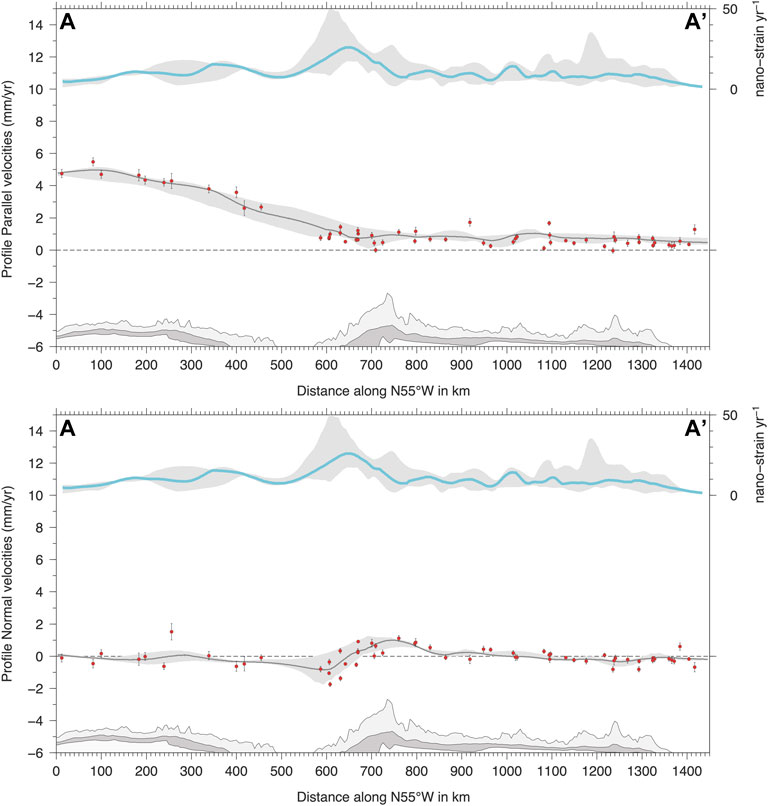
FIGURE 11. Profile parallel (top) and profile normal (bottom) velocities along the A-A’ profile (see Figure 9). The red circles show the observed velocity components projected along the profile (with error bars representing 1σ uncertainties) of GNSS stations included in a 200 km wide swath profile. The continuous gray line in each plot shows the (median value) modeled velocity components from the continuous velocity field obtained using the multiscale approach described in Section 4.2 (Figure 8B), where the gray area is the envelope of the minimum and maximum values of the modeled velocity components in the swath profile. The cyan continuous line shows the (median value) scalar strain-rate (see Figure 9) where the gray area is the envelope of the minimum and maximum values of the strain-rate values in the swath profile. At the bottom of the figure, the dark gray, light gray and white areas show the average (median), maximum and minimum elevations along the swath profile, respectively.
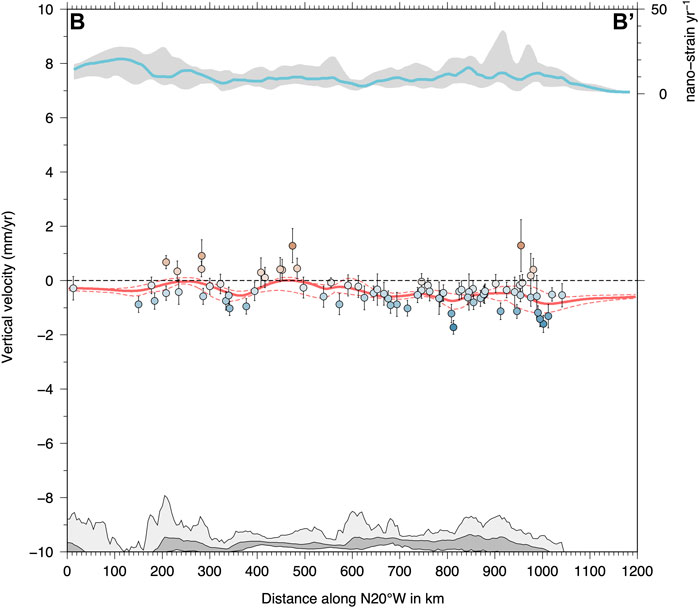
FIGURE 12. Vertical velocities along the profile B-B’ shown in Figure 9. Colored circles (same color scale as in Figure 8A) show the observed velocities (with error bars representing 1σ uncertainties) of GNSS stations included in a 200 km wide swath profile. The continuous red line in each plot shows the median value of the modeled vertical velocity field obtained using the multiscale approach described in Section 4.2, where the dashed red lines define the envelope of the minimum and maximum values of the modeled velocity in the swath profile. The cyan continuous line shows the median value of the scalar strain-rate (see Figure 9), where the gray area is the envelope of the minimum and maximum values of the strain-rate values in the swath profiles. At the bottom of the figure, the dark gray, light gray and white areas show the average (median), maximum and minimum elevations along the swath profile, respectively.
4.3 Central Mediterranean
The extensional belt running from northern Sicily to the northern Apennines is located along the chain axis. Maximum uplift rates along the Apennines, of the order of 1–1.5 mm/yr, correspond to the area of higher topography and higher horizontal extensional deformation rates, feature that has been interpreted as the results of deep-seated processes dynamically controlled by mantle convection (e.g., Faccenna et al., 2014b) or lower crustal processes (e.g., Cowie et al., 2013). Excluding the volcanic areas, here maximum horizontal strain-rate values are of the order of 60–80 nanostrain/yr, with relatively slower deformation rates measured in Calabria. In the Northern Apennines, GNSS velocities highlight three sub-parallel belts of deformation: an extensional belt along the inner northern Apennines, an extensional belt along the chain axis and a contractional belt along the Apennine front. Along the Alpine chain, strain-rates reach lower maximum values than the Apennines, with maximum rates of ∼40 nanostrain/yr localized along the Western Alps, with chain-normal extension, and in the Eastern Southern Alps, with ∼N-S shortening, broadening toward the east, in the Pannonian basin system. Along the external Dinarides, the few available GNSS velocities describe slow, contractional, deformation rates (<20 nanostrain/yr), which increase toward the south, where shortening along the Albanian coasts and ∼E-W extension in the Albanides occur, accompanied by positive (∼1 mm/yr) vertical velocities, which continuous in Western Greece (Figure 8A). Overall, the results shown in Figure 9 and Figure 10 are consistent with recent works that studied portions of the central Mediterranean and peri-Adriatic regions (e.g., D’Agostino, 2014; Faccenna et al., 2014b; Sani et al., 2016; Barani et al., 2017; D’Agostino et al., 2020) and maps from the Global Strain Rate Model (Kreemer et al., 2014).
Profiles C-C’ in Figures 13, 14 runs across the Hyblean block, characterized by ∼1 mm/yr of subsidence, Mount Etna, the Madonie-Nebroni-Peloritani mountains, characterized by ∼1 mm/yr uplift rates and the southern Tyrrhenian. About 2 mm/yr of N-S shortening south of the Etna and fast (up to 5 mm/yr) N-S extension in northern Sicily are the result of volcano tectonic processes and fast blocks rotations (consistent with Palano et al., 2012 and Mastrolembo Ventura et al., 2014). In the southern Tyrrhenian, where fast subsidence rates (up to ∼10 mm/yr) are observed in the central Aeolian Islands, ∼5 mm/yr of N-S shortening is accommodated along a narrow belt of deformation. Profile D-D’ runs across the Calabrian arc, showing ∼2 mm/yr of NW-SE extension accommodated over ∼100 km, resulting in slower strain-rate values than the surrounding segments of the Apennine chain. As regards vertical velocities, Figure 13 shows that positive rates increase from NW toward SE, with maximum uplift rates of the order of ∼1 mm/yr.
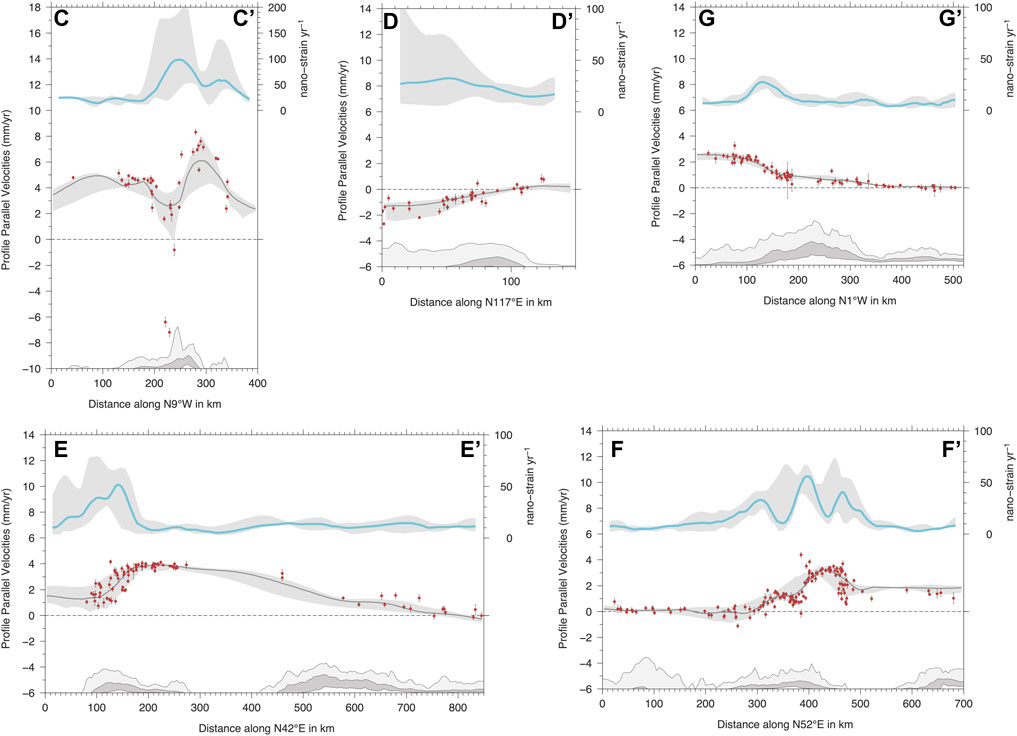
FIGURE 13. Same as Figure 11 for cross sections in the Central Mediterranean (see Figure 9) across Sicily (B-B’), the Calabrian Arc (C-C’), the Southern Apennines and southern Dinarides (D-D’), the Northern Apennines and northern Dinarides (E-E’) and the Eastern Alps (F-F’).
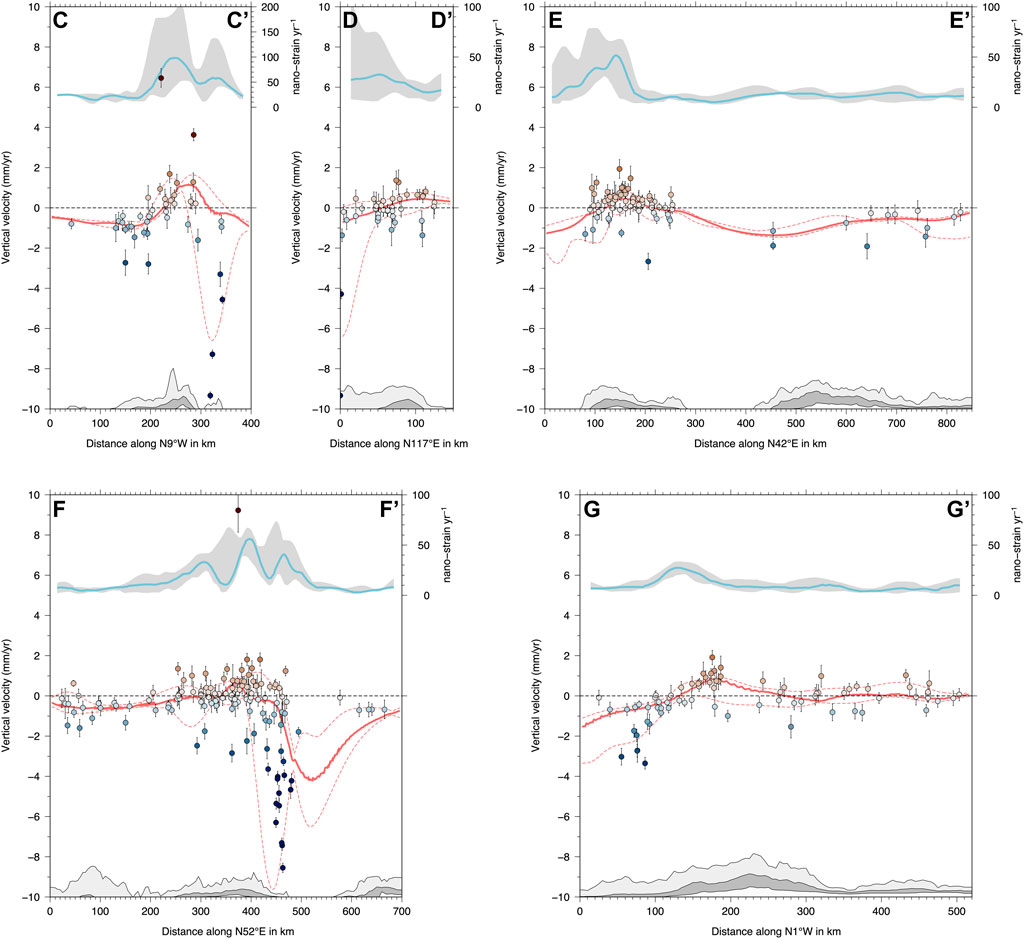
FIGURE 14. Same as Figure 12 for cross sections in the Central Mediterranean (see Figure 9) across Sicily (2–2’), the Calabrian Arc (3–3’), the Southern Apennines and southern Dinarides (4–4’), the Northern Apennines and northern Dinarides (5–5’), the Western Alps (6–6’) and the Eastern Alps (7–7’).
Profile E-E’ runs across the southern Apennines and southern Dinarides, showing ∼3 mm/yr of SW-NE extension in the Southern Apennines (Figure 13), with the high strain-rates belt spatially correlated with the area of positive vertical velocities and higher topography (Figure 14). While limited shortening (∼1 mm/yr) is accommodated across the Adriatic Sea, ∼2 mm/yr of shortening is taken up across the Dinaric mountains, where the few GNSS stations available show <1 mm/yr level subsidence.
Profile F-F’ runs from Corsica to the Northern Dinarides, crossing the northern Apennines, showing three well spatially defined belts of deformation (Figure 13), with SW-NE extension spatially correlated with positive vertical velocities and topography (Figure 14). The inner northern Apennines accommodate ∼1 mm/yr of extension, whereas higher strain-rates along the chain axis are associated with ∼2 mm/yr of extension and a steeper velocity gradient. It is worth considering that the fast shortening rates in the northern Adriatic reflects the use of horizontal velocities from GNSS stations located on onshore and offshore gas exploitation sites (Palano et al., 2020), which are, for the most part, subjected to fast (> 5 mm/yr) subsidence rates (Figure 14). Only a limited number of these stations, in fact, appear suitable for tectonic studies (Pezzo et al., 2020). On average we find that ∼2 mm/yr of shortening is accommodated at the front of the northern Apennines and in the northern Adriatic, whereas limited to null shortening is accommodated across the Adriatic Sea and ∼1 mm/yr across the external northern Dinarides, which are slowly subsiding at ∼1 mm/yr.
In the Alps we find horizontal deformation rates <50 nanostrain/yr, mainly localized along the Western Alps, with arc-normal extension, and along an ∼ E-W oriented deformation belt in the Eastern Southern Alps, with N-S contractional deformation (Figure 10). Figure 8A shows, in agreement with previous results (e.g., Serpelloni et al., 2013; Sternai et al., 2019) that the Alpine chain is characterized by a continuous belt of positive vertical velocities that is positively correlated with topography. Maximum uplift rates (up to 2.5 mm/yr) are observed in the Central and Western Alps, where the interplay between different endogenic and exogenic processes are driving the present-day uplift (Sternai et al., 2019). Figure 8A shows that positive vertical velocities, at rates of ∼0.5 mm/yr, are observed in the Alpine foreland and southern Bohemian massif. On the contrary, the largest part of the Pannonian Basin system, where the GNSS density is, unfortunately, poorer, shows subsidence, with the few GNSS sites available on the Carpathians showing mostly stable to weakly positive vertical velocities, as for the sites on the Moesian platform and along the western coasts of the Black Sea.
Profile G-G’ in Figure 13 shows that ∼1.5 mm/yr of N-S shortening is accommodated across the South Alpine belt and that ∼1 mm/yr is also accommodated, over longer distances, in the Eastern Alps and across the Northern Alpine thrust front. In the Eastern Alps, where glacial isostatic adjustment is considered as the most important process responsible for the actual uplift (Mey et al., 2016; Sternai et al., 2019), a significant contribution to the short-wavelength (tens of km) vertical velocity gradients comes from the present-day 1–3 mm/yr N-S convergence rates between the Adria plate and Europe (Serpelloni et al., 2016). Profile G-G’ in Figure 14 shows that >1 mm/yr uplift is located slightly northward with respect to the horizontal strain-rates peak, and southward with respect to the highest topography, suggesting that this positive vertical signal may have a relationship with elastic strain build-up at S-verging, locked, thrust faults, in agreement with results from Anderlini et al. (2020).
4.4 Eastern Mediterranean
Profile H-H’ in Figure 15 runs from the Albanian coats to the Peloponnese, showing progressively increasing SW-ward velocities toward the SE, and a total amount of ∼35 mm/yr right lateral motion, ∼10 of which are accommodated across the Kefalonia fault. The strain-rate field along the Hellenic Arc is characterized by arc-normal shortening (Figure 10) with rates increasing south of the Kefalonia fault. The same area is characterized by a 1 mm/yr-level subsidence signal (Figure 8A), whereas stable to positive vertical velocities are present in central Greece, along the Hellenides, with a belt of (∼1 mm/yr level) positive vertical rates that, apparently, continues to the north in the Albanides, where uplift-rates of the order of 0.5–1 mm/yr are measured in coexistence of ∼E-W extensional deformation. According to previous results (e.g., Floyd et al., 2010; Chousianitis et al., 2015; Briole et al., 2021), deformation rates in the Central Aegean Sea are limited, whereas ∼ N-S extension characterizes large portions of northern Greece and western Turkey. Profile I-I’ in Figure 15 runs across the Peloponnese toward Central Macedonia, showing the steep velocity gradient across the Corinth Gulf, with ∼20 mm/yr of N-S extension accommodated in ∼60 km, resulting in the highest strain-rates of the Euro-Mediterranean area. Another ∼8 mm/yr of extension is accommodated in Central Greece and Thessaly. Profile L-L’ in Figure 15 runs across Crete and the Aegean Sea to Western Turkey. It shows ∼2 mm/yr of shortening between Gavdos and Crete, which is, however, not well modeled, limited deformation in the southern Aegean Sea (excluding the signal associated with Santorini volcano) and ∼16 mm/yr of extension accommodated in the northern Aegean Sea and western Turkey.

FIGURE 15. Same as Figure 11 for profiles in the Eastern Mediterranean (see Figure 9) across the Ionian Islands and Khephalinia faults (H-H’; profile normal velocities plotted), the Corinth Gulf and Southern Balkans (I-I’), Crete and the Aegean Sea (L-L’) and across Anatolia (M-M’; profile normal velocities plotted).
The strain-rate field in the Anatolian region is mainly constrained by the horizontal velocities published in Özdemir and Karslıoğlu, (2019). The most striking feature here is the belt of high strain-rates along the North Anatolian fault, which accommodates ∼20 mm/yr of right-lateral motion (see profile M-M’ in Figure 15), with peak values (up to 300 nanostrain/yr) in the Marmara Sea, and the limited deformation within the Anatolian block. Strain-rates are relatively higher along the East Anatolian fault zone and along a SW-NE oriented belt of ∼50 nanostrain/yr, almost parallel to the Fethiye-Burdur Fault zone. Profile M-M’ in Figure 15 shows that across southern Anatolia, ∼10 mm/yr of left-lateral motion are also accommodated.
In the Levantine region, the lack of continuous GNSS velocities east of the Dead Sea fault does not allow us to measure a well constrained strain-rate field. At the same time, the available continuous GNSS stations show a coherent pattern of positive vertical ground velocities, up to ∼2 mm/yr, consistent with previous results (Serpelloni et al., 2013; Devoti et al., 2017).
5 Conclusion
We present the results obtained from the analysis of GPS observations from a large number of continuous GNSS stations (> 4000) operating on the Eurasia and African plates. Our computational infrastructure, with dynamic sub-networking and automatic management of duplicate station names and metadata, guarantees flexible and automatic procedures to realize displacement time-series from an increasing number of sites. By analyzing the displacement time-series from a subset of good-quality stations, and estimating linear velocities by using increasing series lengths, we find that median duration lengths of about 6 and 7 years are required to obtain results that are statistically consistent with velocity estimates from longer time-series (> 10 years), in the horizontal and vertical components, respectively. We also show that the use of different time-series analysis software, among the most widely used in the scientific community, provides highly consistent velocity estimates. We present a new vertical and horizontal velocity field for the Euro-Mediterranean region, the main area of interest of our GNSS data analysis center, computing multiscale, continuous, vertical and horizontal velocities and their spatial gradients. The horizontal geodetic strain-rate field is resolved at a spatial length of ∼27 km over large parts of the tectonically active belts in southern Europe, with a higher resolution (∼13 km) along the Apennines and the Alps. While considering that even higher station’s density is required to resolve elastic asperities on active faults segments in the study area, it is worth noting that there are still large areas where the vertical velocity field and the horizontal strain-rate field are not properly resolved for studying active faults and tectonic/geodynamic deformation sources, such as in northern Africa, the Dinarides and Balkans. In this regard, daily observations from non-geophysical stations, such as those realized for topographic applications that are maintained at national or regional levels by private and public entities, are still a key measurement and the hope is that additional data will be made more easily accessible for scientific applications in the near future.
The highest deformation rates, excluding active volcanic areas, are measured in the Gulf of Corinth, with rates up to ∼400 nanostrain/yr, and along the North Anatolian Fault. By looking at velocity and strain-rate profiles we find that in the central and eastern Mediterranean extensional belts are characterized by positive vertical ground motion rates. Tectonic and geodynamic interpretations of the geodetic velocity field are out of the scope of this work, but the deformation patterns highlighted in this work, or others that will be made available through ongoing pan-European initiatives, provide important kinematic boundary conditions to develop geodynamic models or earthquake-cycle and tectonic deformation models. We provide as Supplementary Datasets the station’s velocities, together with gridded velocities and strain-rate values.
Data Availability Statement
The GNSS networks considered in this study are listed in Supplementary Table S1 in the Supplementary Material. We provide link to public repositories, if available. Requests to access GNSS datasets of non-public repositories should be directed to the network’s owners. We provide as Supplementary Datasets the estimated station ’s velocities, together with gridded velocities and strain-rates values.
Author Contributions
ES coordinated this research, the GNSS data and strain-rate analyses and wrote the manuscript. AC contributed to the GNSS data analysis and development of the metadata management system. LM contributed to the development of the procedures for the automatic GNSS data analysis and metadata management. FP contributed to the time-series analysis and comparison of algorithms. LA estimated the co-seismic and post-seismic deformation. AB contributed to the time-series analysis. DR, RD, and SB contributed to the development of the metadata management system and of the Mediterranean GNSS Archive. PP contributed to the development of the computational infrastructure. SC supervised the development of the computational infrastructure. All the authors discussed the contents and approved the final manuscript.
Funding
The GNSS data analysis center described in this work is realized and maintained by different founding resources and projects, including EPOS-MIUR, the Department of Italian Civil Protection and Istituto Nazionale di Geofisica e Vulcanologia agreement (Annex A), Programma Operativo Nazionale (PON) GRINT, ILG Minerbio, MISE DGISSEG-INGV 2020 agreement, Med-MFC. FP is supported by the project MUSE, funded by the Istituto Nazionale di Geofisica e Vulcanologia (INGV), within which the re-analysis discussed in this work has been developed.
Conflict of Interest
The authors declare that the research was conducted in the absence of any commercial or financial relationships that could be construed as a potential conflict of interest.
Publisher’s Note
All claims expressed in this article are solely those of the authors and do not necessarily represent those of their affiliated organizations, or those of the publisher, the editors and the reviewers. Any product that may be evaluated in this article, or claim that may be made by its manufacturer, is not guaranteed or endorsed by the publisher.
Acknowledgments
We are greatly indebted with all the private and public institutions that maintain and provide free access to GNSS data and non-public data providers for allowing us the use of RINEX data for scientific applications (the full list of networks used is provided in Supplementary Table S1). Some of the data are collected from the EPOS GNSS data gateway portal https://gnssdata-epos.oca.eu and some of the meta-data are retrieved from the M3G Metadata Management and Distribution System for Multiple GNSS Networks (https://gnss-metadata.eu). Some of the figures are created using the Generic Mapping Tools (GMT) software (Wessel et al., 2013). We acknowledge the use of scripts from the Strain_2D code (Materna et al., 2021). We thank the GAMIT/GLOBK team at MIT (http://geoweb.mit.edu/gg) for the continuous support. The authors thank the reviewers for their helpful comments and suggestions.
Supplementary Material
The Supplementary Material for this article can be found online at: https://www.frontiersin.org/articles/10.3389/feart.2022.907897/full#supplementary-material
References
AA, V. V. (2020). Progetto “Sale Operative Integrate e Reti di Monitoraggio del futuro: l’INGV 2.0”. Report Finale. M. Moretti. Misc. INGV. 57, 1186. doi:10.13127/misc/57
Altamimi, Z., Métivier, L., Rebischung, P., Rouby, H., and Collilieux, X. (2017). ITRF2014 Plate Motion Model. Geophys. J. Int. 209, 1906–1912. doi:10.1093/gji/ggx136
Anderlini, L., Serpelloni, E., and Belardinelli, M. E. (2016). Creep and Locking of a Low-Angle Normal Fault: Insights from the Altotiberina Fault in the Northern Apennines (Italy). Geophys. Res. Lett. 43, 4321–4329. doi:10.1002/2016GL068604
Anderlini, L., Serpelloni, E., Tolomei, C., De Martini, P. M., Pezzo, G., Gualandi, A., et al. (2020). New Insights Into Active Tectonics and Seismogenic Potential of the Italian Southern Alps from Vertical Geodetic Velocities. Solid earth. 11, 1681–1698. doi:10.5194/se-11-1681-2020
Antonio, A., Giulio, S., D'Agostino, E., D'Agostino, N., Grazia, P., and Federica, R. (2010). The RING Network: Improvement of a GPS Velocity Field in the Central Mediterranean. Ann. Geophys 53 (2), 39–54. doi:10.4401/ag-4549
Bahrouni, N., Masson, F., Meghraoui, M., Saleh, M., Maamri, R., Dhaha, F., et al. (2020). Active Tectonics and GPS Data Analysis of the Maghrebian Thrust Belt and Africa-Eurasia Plate Convergence in Tunisia. Tectonophysics 785, 228440. doi:10.1016/j.tecto.2020.228440
Barani, S., Mascandola, C., Serpelloni, E., Ferretti, G., Massa, M., and Spallarossa, D. (2017). Time-Space Evolution of Seismic Strain Release in the Area Shocked by the August 24-October 30 Central Italy Seismic Sequence. Pure Appl. Geophys. 174, 1875–1887. doi:10.1007/s00024-017-1547-5
Bevis, M., and Brown, A. (2014). Trajectory Models and Reference Frames for Crustal Motion Geodesy. J. Geod. 88 (3), 283–311. doi:10.1007/s00190-013-0685-5
Blewitt, G., Hammond, W., and Kreemer, C. (2018). Harnessing the GPS Data Explosion for Interdisciplinary Science. Eos 99. doi:10.1029/2018EO104623 https://eos.org/science-updates/harnessing-the-gps-data-explosion-for-interdisciplinary-science.
Blewitt, G., Kreemer, C., Hammond, W. C., and Gazeaux, J. (2016). MIDAS Robust Trend Estimator for Accurate GPS Station Velocities without Step Detection. J. Geophys. Res. Solid Earth 121 (3), 2054–2068. doi:10.1002/2015JB012552
Blewitt, G., and Lavallée, D. (2002). Effect of Annual Signals on Geodetic Velocity. J. Geophys. Res. 107 (B7), 9–1. doi:10.1029/2001JB000570
Boehm, J., Heinkelmann, R., and Schuh, H. (2007). Short Note: A Global Model of Pressure and Temperature for Geodetic Applications. J. Geod. 81, 679–683. doi:10.1007/s00190-007-0135-3
Boler, F., Wier, S., D’Agostino, N., Fernandes, R. M., Ganas, A., Bruyninx, C., et al. (2014). New Collaboration Among Geodesy Data Centers in Europe and the US Facilitates Data Discovery and Access. Geophys. Res. Abstr. 16, EGU2014–12385.
Bos, A. G., Spakman, W., and Nyst, M. C. J. (2003). Surface Deformation and Tectonic Setting of Taiwan Inferred from a GPS Velocity Field. J. Geophys. Res. 108 (B10), 2458. doi:10.1029/2002JB002336
Bos, M. S., Fernandes, R. M. S., Williams, S. D. P., and Bastos, L. (2013). Fast Error Analysis of Continuous GNSS Observations with Missing Data. J. Geod. 87 (4), 351–360. doi:10.1007/s00190-012-0605-0
Bougrine, A., Yelles-Chaouche, A. K., and Calais, E. (2019). Active Deformation in Algeria from Continuous GPS Measurements. Geophys. J. Int. 217, 572–588. doi:10.1093/gji/ggz035
Briole, P., Ganas, A., Elias, P., and Dimitrov, D. (2021). The GPS Velocity Field of the Aegean. New Observations, Contribution of the Earthquakes, Crustal Blocks Model. Geophys. J. Int. 226 (1), 468–492. doi:10.1093/gji/ggab089
Bruno, V., Aloisi, M., Gambino, S., Mattia, M., Ferlito, C., and Rossi, M. (2022). The Most Intense Deflation of the Last Two Decades at Mt. Etna: The 2019–2021 Evolution of Ground Deformation and Modeled Pressure Sources. Geophys. Res. Lett. 49 (6), e2021GL095195. doi:10.1029/2021gl095195
Cheloni, D., D'Agostino, N., and Selvaggi, G. (2014). Interseismic Coupling, Seismic Potential, and Earthquake Recurrence on the Southern Front of the Eastern Alps (NE Italy). J. Geophys. Res. Solid Earth 119, 4448–4468. doi:10.1002/2014JB010954
Chousianitis, K., Ganas, A., and Evangelidis, C. P. (2015). Strain and Rotation Rate Patterns of Mainland Greece from Continuous GPS Data and Comparison between Seismic and Geodetic Moment Release. J. Geophys. Res. Solid Earth 120, 3909–3931. doi:10.1002/2014JB011762
Cowie, P. A., Scholz, C. H., Roberts, G. P., Faure Walker, J. P., and Steer, P. (2013). Viscous Roots of Active Seismogenic Faults Revealed by Geologic Slip Rate Variations. Nat. Geosci. 6 (12), 1036–1040. doi:10.1038/ngeo1991
D'Agostino, N. (2014). Complete Seismic Release of Tectonic Strain and Earthquake Recurrence in the Apennines (Italy). Geophys. Res. Lett. 41, 1155–1162 doi:10.1002/2014gl059230
D'Agostino, N., Métois, M., Koci, R., Duni, L., Kuka, N., Ganas, A., et al. (2020). Active Crustal Deformation and Rotations in the Southwestern Balkans from Continuous GPS Measurements. Earth Planet. Sci. Lett. 539, 116246. doi:10.1016/j.epsl.2020.116246
Dach, R., Lutz, S., Walser, P., and Fridez, P. (2015). Bernese GNSS Software Version 5.2. User Manual. Astronomical Institute, University of Bern, Bern Open Publishing. doi:10.7892/boris.72297
De Martino, P., Dolce, M., Brandi, G., Scarpato, G., and Tammaro, U. (2021). The Ground Deformation History of the Neapolitan Volcanic Area (Campi Flegrei Caldera, Somma-Vesuvius Volcano, and Ischia Island) from 20 Years of Continuous GPS Observations (2000-2019). Remote Sens. 13, 2725. doi:10.3390/rs13142725
Devoti, R., D'Agostino, N., Serpelloni, E., Pietrantonio, G., Riguzzi, F., Avallone, A., et al. (2017). A Combined Velocity Field of the Mediterranean Region. Ann. Geophys. 60 (2), S0215. doi:10.4401/ag-7059
Dong, D., Herring, T. A., and King, R. W. (1998). Estimating Regional Deformation from a Combination of Space and Terrestrial Geodetic Data. J. Geodesy 72 (4), 200–214. doi:10.1007/s001900050161
Faccenna, C., Becker, T. W., Auer, L., Billi, A., Boschi, L., Brun, J. P., et al. (2014a). Mantle Dynamics in the Mediterranean. Rev. Geophys. 52 (3), 283–332. doi:10.1002/2013RG000444
Faccenna, C., Becker, T. W., Miller, M. S., Serpelloni, E., and Willett, S. D. (2014b). Isostasy, Dynamic Topography, and the Elevation of the Apennines of Italy. Earth Planet. Sci. Lett. 407, 163–174. doi:10.1016/j.epsl.2014.09.027
Fernandes, R. M., Bos, C., Bruyninx, P., Crocker, J., Dousa, A., and Socquet, A. (2017). EPOS-GNSS – Improving the Infrastructure for GNSS Data and Products in Europe. Geophys. Res. Abstr. 19, EGU2017–10766.
Floyd, M. A., Billiris, H., Paradissis, D., Veis, G., Avallone, A., Briole, P., et al. (2010). A New Velocity Field for Greece: Implications for the Kinematics and Dynamics of the Aegean. J. Geophys. Res. 115, B10403. doi:10.1029/2009JB007040
Floyd, M. A., and Herring, T. A. (2020). “Fast Statistical Approaches to Geodetic Time Series Analysis,” in Geodetic Time Series Analysis in Earth Sciences. Editors J. P. Montillet,, and M. Bos (Cham, Switz: Springer Geophysics, Springer), 157–183. doi:10.1007/978-3-030-21718-1_5
Gualandi, A., Nichele, C., Serpelloni, E., Chiaraluce, L., Anderlini, L., Latorre, D., et al. (2017). Aseismic Deformation Associated with an Earthquake Swarm in the Northern Apennines (Italy). Geophys. Res. Lett. 44 (15), 7706–7714. doi:10.1002/2017gl073687
Herring, T. A., King, R. W., Floyd, M. A., and McClusky, S. C. (2015). Introduction to GAMIT/GLOBK, Release 10.6. Available at: gpsg.mit.edu/∼simon/gtgk/Intro_GG.pdf.
Kenyeres, A., Bellet, J. G., Bruyninx, C., Caporali, A., de Doncker, F., Droscak, B., et al. (2019). Regional Integration of Long-Term National Dense GNSS Network Solutions. GPS Solut. 23 (4), 122. doi:10.1007/s10291-019-0902-7
Koulali, A., Ouazar, D., Tahayt, A., King, R. W., Vernant, P., Reilinger, R. E., et al. (2011). New GPS Constraints on Active Deformation along the Africa-Iberia Plate Boundary. Earth Planet. Sci. Lett. 308, 211–217. doi:10.1016/j.epsl.2011.05.048
Kreemer, C., and Blewitt, G. (2021). Robust Estimation of Spatially Varying Common-Mode Components in GPS Time-Series. J. Geod. 95 (1), 13. doi:10.1007/s00190-020-01466-5
Kreemer, C., Klein, G. E., Shen, Z.-K., Wang, M., Estey, L., Wier, S., et al. (2014). Global Geodetic Strain Rate Model, GEM Technical Report 2014-07 V1.0.0. Pavia, Italy: GEM Foundation.
Lagler, K., Schindelegger, M., Böhm, J., Krásná, H., and Nilsson, T. (2013). GPT2: Empirical Slant Delay Model for Radio Space Geodetic Techniques. Geophys. Res. Lett. 40, 1069–1073. doi:10.1002/grl.50288
Lyard, F., Lefevre, F., Letellier, T., and Francis, O. (2006). Modelling the Global Ocean Tides: Modern Insights from FES2004. Ocean. Dyn. 56, 394–415. doi:10.1007/s10236-006-0086-x
Mandler, E., Pintori, F., Gualandi, A., Anderlini, L., Serpelloni, E., and Belardinelli, M. E. (2021). Post‐Seismic Deformation Related to the 2016 Central Italy Seismic Sequence from GPS Displacement Time‐Series. J. Geophys. Res. Solid Earth 126 (9), e2021JB022200. doi:10.1029/2021jb022200
Masson, C., Mazzotti, S., Vernant, P., and Doerflinger, E. (2019). Extracting Small Deformation beyond Individual Station Precision from Dense Global Navigation Satellite System (GNSS) Networks in France and Western Europe. Solid Earth. 10, 1905–1920. doi:10.5194/se-10-1905-2019
Mastrolembo Ventura, B., Serpelloni, E., Argnani, A., Bonforte, A., Bürgmann, R., Anzidei, M., et al. (2014). Fast Geodetic Strain-Rates in Eastern Sicily (Southern Italy): New Insights into Block Tectonics and Seismic Potential in the Area of the Great 1693 Earthquake. Earth Planet. Sci. Lett. 404, 77–88. doi:10.1016/j.epsl.2014.07.025
Materna, K., Maurer, J., and Sandoe, L. (2021). Strain-2D (Version 1.0.0). Available at: https://github.com/kmaterna/Strain_2D.
Mattia, M., Bruno, V., Caltabiano, T., Cannata, A., Cannavò, F., D'Alessandro, W., et al. (2015). A Comprehensive Interpretative Model of Slow Slip Events on Mt. Etna's Eastern Flank. Geochem. Geophys. Geosyst. 16 (3), 635–658. doi:10.1002/2014gc005585
Mey, J., Scherler, D., Wickert, A. D., Egholm, D. L., Tesauro, M., Schildgen, T. F., et al. (2016). Glacial Isostatic Uplift of the European Alps. Nat. Commun. 7 (1), 13382. doi:10.1038/ncomms13382
Newman, A. V., Stiros, S., Feng, L., Psimoulis, P., Moschas, F., Saltogianni, V., et al. (2012). Recent Geodetic Unrest at Santorini Caldera, Greece. Geophys. Res. Lett. 39 (6), n/a. doi:10.1029/2012gl051286
Nocquet, J.-M. (2012). Present-day Kinematics of the Mediterranean: A Comprehensive Overview of GPS Results. Tectonophysics 579, 220–242. doi:10.1016/j.tecto.2012.03.037
Özdemir, S., and Karslıoğlu, M. O. (2019). Soft Clustering of GPS Velocities from a Homogeneous Permanent Network in Turkey. J. Geod. 93, 1171–1195. doi:10.1007/s00190-019-01235-z
Palano, M., Ferranti, L., Monaco, C., Mattia, M., Aloisi, M., Bruno, V., et al. (2012). GPS Velocity and Strain Fields in Sicily and Southern Calabria, Italy: Updated Geodetic Constraints on Tectonic Block Interaction in the Central Mediterranean. J. Geophys. Res. 117, B07401. doi:10.1029/2012JB009254
Palano, M., Pezzo, G., Serpelloni, E., Devoti, R., D'Agostino, N., Gandolfi, S., et al. (2020). Geopositioning Time Series from Offshore Platforms in the Adriatic Sea. Sci. Data. doi:10.1038/s41597-020-00705-w
Petrie, E. J., King, M. A., Moore, P., and Lavallée, D. A. (2010). Higher-order Ionospheric Effects on the GPS Reference Frame and Velocities. J. Geophys. Res. 115, B03417. doi:10.1029/2009JB006677
Pezzo, G., Petracchini, L., Devoti, R., Maffucci, R., Anderlini, L., Antoncecchi, I., et al. (2020). Active Fold‐Thrust Belt to Foreland Transition in Northern Adria, Italy, Tracked by Seismic Reflection Profiles and GPS Offshore Data. Tectonics 39 (11), e2020TC006425. doi:10.1029/2020TC006425
Pintori, F., Serpelloni, E., Longuevergne, L., Garcia, A., Faenza, L., D’Alberto, L., et al. (2021). Mechanical Response of Shallow Crust to Groundwater Storage Variations: Inferences from Deformation and Seismic Observations in the Eastern Southern Alps, Italy. J. Geophys. Res. Solid Earth 126 (2), e2020JB020586. doi:10.1029/2020jb020586
Randazzo, D., Cavaliere, A., Bruni, S., Martelli, L., Serpelloni, E., and Devoti, R. (2022). PyGLogDB: Software to Generate STATIONINFO Files for GNSS Data Analysis. Rapp. Tec. INGV 446, 124. doi:10.13127/rpt/446
Randazzo, D., Serpelloni, E., and Cavaliere, A. (2018). PyGLog: a Python Software for Handling GNSS Metadata and Log-Files. Rapp. Tec. INGV 396, 1–26. doi:10.13127/rpt/396
Rutter, E. H., Faulkner, D. R., and Burgess, R. (2012). Structure and Geological History of the Carboneras Fault Zone, SE Spain: Part of a Stretching Transform Fault System. J. Struct. Geol. 45, 68–86. doi:10.1016/j.jsg.2012.08.009
Sani, F., Vannucci, G., Boccaletti, M., Bonini, M., Corti, G., and Serpelloni, E. (2016). Insights into the Fragmentation of the Adria Plate. J. Geodyn. 102, 121–138. doi:10.1016/j.jog.2016.09.004
Santamaría-Gómez, A., and Ray, J. (2021). Chameleonic Noise in GPS Position Time Series. J. Geophys. Res. Solid Earth 126, e2020JB019541. doi:10.1029/2020JB019541
Santamaría-Gómez, A. (2019). SARI: Interactive GNSS Position Time Series Analysis Software. GPS Solut. 23, 52. doi:10.1007/s10291-019-0846-y
Sen, P. K. (1968). Estimates of the Regression Coefficient Based on Kendall's Tau. J. Am. Stat. Assoc. 63, 1379–1389. doi:10.1080/01621459.1968.10480934
Serpelloni, E., Casula, G., Galvani, A., Anzidei, M., and Baldi, P. (2006). Data Analysis of Permanent GPS Networks in Italy and Surrounding Region: Application of a Distributed Processing Approach. Ann. Geophys. 49, 897–928. doi:10.4401/ag-4410
Serpelloni, E., Faccenna, C., Spada, G., Dong, D., and Williams, S. D. P. (2013). Vertical GPS Ground Motion Rates in the Euro-Mediterranean Region: New Evidence of Velocity Gradients at Different Spatial Scales along the Nubia-Eurasia Plate Boundary. J. Geophys. Res. Solid Earth 118, 6003–6024. doi:10.1002/2013JB010102
Serpelloni, E., Vannucci, G., Anderlini, L., and Bennett, R. A. (2016). Kinematics, Seismotectonics and Seismic Potential of the Eastern Sector of the European Alps from GPS and Seismic Deformation Data. Tectonophysics 688, 157–181. doi:10.1016/j.tecto.2016.09.026
Shen, Z. K., Wang, M., Zeng, Y., and Wang, F. (2015). Optimal Interpolation of Spatially Discretized Geodetic Data. Bull. Seismol. Soc. Am. 105 (4), 2117–2127. doi:10.1785/0120140247
Sparacino, F., Palano, M., Peláez, J. A., and Fernández, J. (2020). Geodetic Deformation versus Seismic Crustal Moment-Rates: Insights from the Ibero-Maghrebian Region. Remote Sens. 12, 952–1027. doi:10.3390/rs12060952
Sternai, P., Sue, C., Husson, L., Serpelloni, E., Becker, T. W., Willett, S. D., et al. (2019). Present-day Uplift of the European Alps: Evaluating Mechanisms and Models of Their Relative Contributions. Earth-Science Rev. 190, 589–604. doi:10.1016/j.earscirev.2019.01.005
Stich, D., Serpelloni, E., de Lis Mancilla, F., and Morales, J. (2006). Kinematics of the Iberia-Maghreb Plate Contact from Seismic Moment Tensors and GPS Observations. Tectonophysics 426, 295–317. doi:10.1016/j.tecto.2006.08.004
Tape, C., Musé, P., Simons, M., Dong, D., and Webb, F. (2009). Multiscale Estimation of GPS Velocity Fields. Geophys. J. Int. 179 (2), 945–971. doi:10.1111/j.1365-246X.2009.04337.x
Theil, H. (1950). A Rank-Invariant Method of Linear and Polynomial Regression Analysis. Indag. Math. 12, 85–91.
Wessel, P., Smith, W. H. F., Scharroo, R., Luis, J., and Wobbe, F. (2013). Generic Mapping Tools: Improved Version Released. Eos. Trans. Am. Geophys. Union 94 (45), 409–410. doi:10.1002/2013EO450001
Williams, S. D. P. (2003). The Effect of Coloured Noise on the Uncertainties of Rates Estimated from Geodetic Time Series. J. Geodesy 76, 483–494. doi:10.1007/s00190-002-0283-4
Keywords: GNSS data processing, time series analysis, horizontal strain rates, vertical ground velocities, Euro-Mediterranean region
Citation: Serpelloni E, Cavaliere A, Martelli L, Pintori F, Anderlini L, Borghi A, Randazzo D, Bruni S, Devoti R, Perfetti P and Cacciaguerra S (2022) Surface Velocities and Strain-Rates in the Euro-Mediterranean Region From Massive GPS Data Processing. Front. Earth Sci. 10:907897. doi: 10.3389/feart.2022.907897
Received: 30 March 2022; Accepted: 09 May 2022;
Published: 01 June 2022.
Edited by:
Andrea Magrin, Istituto Nazionale di Oceanografia e di Geofisica Sperimentale (Italy), ItalyReviewed by:
Michael Floyd, Massachusetts Institute of Technology, United StatesAthanassios Ganas, National Observatory of Athens, Greece
Copyright © 2022 Serpelloni, Cavaliere, Martelli, Pintori, Anderlini, Borghi, Randazzo, Bruni, Devoti, Perfetti and Cacciaguerra. This is an open-access article distributed under the terms of the Creative Commons Attribution License (CC BY). The use, distribution or reproduction in other forums is permitted, provided the original author(s) and the copyright owner(s) are credited and that the original publication in this journal is cited, in accordance with accepted academic practice. No use, distribution or reproduction is permitted which does not comply with these terms.
*Correspondence: Enrico Serpelloni, ZW5yaWNvLnNlcnBlbGxvbmlAaW5ndi5pdA==
 Enrico Serpelloni
 Adriano Cavaliere
 Leonardo Martelli
 Francesco Pintori
 Letizia Anderlini
 Alessandra Borghi
 Daniele Randazzo
 Sergio Bruni
 Roberto Devoti
 Paolo Perfetti
 Stefano Cacciaguerra