- 1Chengdu University of Technology, College of Geophysics, Chengdu, China
- 2Chengdu University of Technology, College of Ecology and Environment, Chengdu, China
- 3County Planning and Natural Resources Bureau of Chongqing Dianjiang, Chongqing, China
- 4County Planning and Natural Resources Bureau of Chongqing Fuling, Chongqing, China
- 5Sichuan Nine One Five Engineering Survey and Design Limited Company, Meishan, China
Comprehensive research on reservoir rock mechanics and in-situ stress properties combined with petrophysical experiments, logging models and numerical simulation is an important means to achieve efficient development of tight sandstone oil reservoirs. In this study, a large number of rock mechanics and acoustic experiments, full-wave train array acoustic wave tests, hydraulic fracturing data and three-dimensional finite element simulations were used to study the rock mechanical properties and in-situ stress characteristics of continental tight oil reservoirs in the Yanchang Formation. The results show that under uniaxial conditions, the tight sandstone samples mainly suffer from tensional ruptures. With the increase of confining pressure, the tight sandstone samples undergo obvious shear ruptures. When the confining pressure is loaded to 35 MPa, a typical vertical shear fracture will be formed. The hydraulic fracturing calculation results show that the in-situ stress state of the target layer satisfies σv (vertical principal stress)>σH (maximum horizontal principal stress)>σh (minimum horizontal principal stress). Based on the results of rock mechanics and acoustic tests, we have constructed the dynamic and static mechanical parameter conversion models of tight oil reservoirs and the logging interpretation model of current in-situ stress. Furthermore, the finite element method is used to simulate the three-dimensional structural stress field of the target layer. The simulations show that the horizontal principal stress distribution in the work area is consistent with the applied environmental stress. The σH of the target layer is mainly distributed in 32–50 MPa, and the σh is mainly distributed in 20–34 MPa. Both σH and σh are relatively high in the southern uplift of the work area; among them, σH is usually greater than 44 MPa, and σh is usually greater than 24 MPa. The northern part of the study area developed several grooved areas with relatively low stress values. The regions with high stress values are often distributed in bands, which may be related to the compression caused by the deformation of the strata. For shear stress, left-handed and right-handed regions usually alternate with each other. However, the extent of the left-handed area in the southern uplift area is larger than that of the right-handed area, indicating that the tight oil reservoirs in the study area are mainly affected by left-handed activities.
Introduction
Continental tight oil reservoirs are developed in the Upper Triassic Yanchang Formation in the Ordos Basin. In the process of oil and gas exploitation, the determination of rock mechanics and in-situ stress properties of tight reservoirs can provide a basis for fracturing plan and production pressure difference design (Borgia et al., 1996; Hong et al., 2020; Lan et al., 2021). In addition, during drilling, rock mechanics and in-situ stress properties of tight reservoirs are also necessary for wellbore stability analysis (Baecher., 1983; Fan et al., 2014; Chen et al., 2021). At present, the methods to obtain rock mechanics parameters mainly include rock mechanics experiments and calculation using logging data (Li Y. et al., 2020; Cui and Radwan., 2021; Li., 2022). Rock mechanics experiment is the most basic and direct method to determine rock mechanics parameters (Li., 2022). However, the core experimental data is limited and discrete, which cannot reflect the changing trend of rock strength in the whole well section (Chitrala et al., 2013; Lommatzsch et al., 2015; Dong et al., 2018; Li Y. et al., 2020). Using logging data to predict rock strength parameters can lead to continuous stratigraphic rock strength profiles. However, the rock mechanical properties obtained from logging data are dynamic results, which need to be corrected to static values when applied to engineering constructions (Huang et al., 2019; Zuo et al., 2019; Li H. et al., 2020; Gao., 2021).
Continental tight sandstone reservoirs are characterized by low porosity, low permeability, strong heterogeneity and anisotropy. Therefore, the comprehensive study of reservoir rock mechanics and in-situ stress properties combined with experimental testing, logging model and 3D simulation method is an important means for efficient development of tight sandstone oil reservoirs (Gurocak et al., 2012; He et al., 2015; Mahmoodi et al., 2019; Yin and Wu., 2020). The petrophysical properties and fluid occurrence states of tight reservoirs are affected by rock mechanical properties and current in-situ stresses. The study area is located in the western part of the Ordos Basin. In the past, there were few studies on the rock mechanical properties and in-situ stress of the Yanchang Formation in this area, which restricted the efficient exploration and development of tight oil and gas in the Yanchang Formation. In this study, a large number of rock mechanics and acoustic experiments, full-wave train array acoustic wave tests, hydraulic fracturing data and three-dimensional finite element simulations were used to systematically study the rock mechanical properties and in-situ stress characteristics of continental tight oil reservoirs. This study has important reference value for efficient exploration and development of tight oil reservoirs.
Geological Background
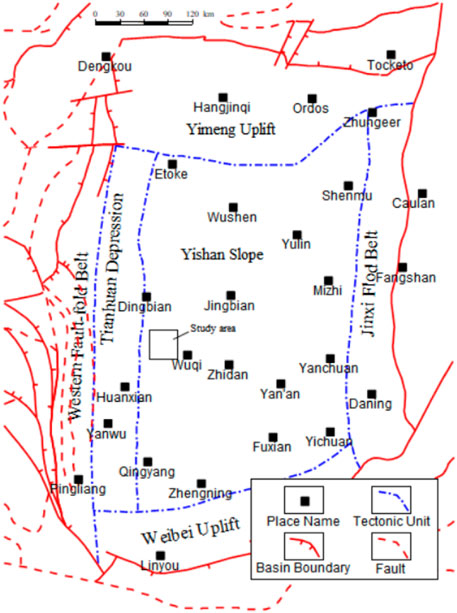
The study area is located in the western part of the Yishan Slope in the Ordos Basin (Figure 1). The stratigraphic structure in this area is a west-dipping monocline (Cui and Radwan., 2021). The Ordos inland lake basin was formed in the Late Triassic. The basement of the basin is composed of metamorphic rocks and crystalline rock series, which is a rigid basement of cratons. The tectonic movement is mainly manifested in the up-and-down movement inside the basin, the stratum is gentle, and the structure is simple. Some low-amplitude structures developed locally in the study area (Shuai et al., 2013). The direction of the present maximum principal stress in the study area is NE45° (Yin and Wu., 2020).
The target layers in the study area are the Chang 6, Chang 7 and Chang 8 Members (C6, C7 and C8) of the Yanchang Formation, which belong to the delta front sedimentary facies. The sedimentary microfacies developed in the target layer are mainly distributary channels and inter-channel bays. The grain size of the channel sand body is usually coarse, and the lithology is mainly fine sandstone, which gradually transitions upward to siltstone and silty mudstone; while the interdistributary bay is mainly composed of silty mudstone and mudstone.
Materials and Methods
In this study, uniaxial and triaxial rock mechanics and acoustic experiments and full-wave train array acoustic wave tests of tight oil reservoirs were conducted. At the same time, the basic fracturing parameters and fracturing curve data of 38 groups of fracturing intervals were collected, and then the in-situ stresses of the work area were calculated using the fracturing data.
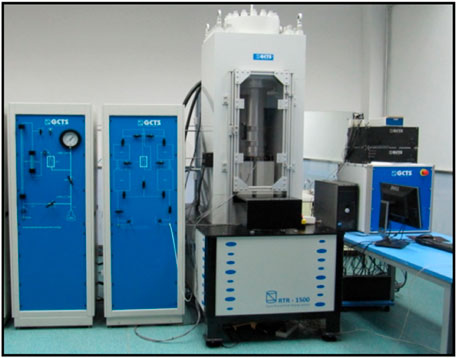
The instrument for triaxial rock mechanics and acoustic testing is a rock physics testing system (Figure 2). There are 10 groups of rock mechanics test samples, and each group have four samples. The sample size is a small cylinder with a diameter of 2.5 cm and a height of 5 cm. The test confining pressures are 0, 10, 20, and 35 MPa, respectively; the acoustic test results are the rock compressional and shear wave velocities under the condition of 35 MPa confining pressure, and the samples are all saturated with formation water. The design of confining pressure takes into account the burial depth and pore pressure of the formation. The average formation depth is 2,500 m, and the formation pressure is 1, so the effective pressure is 35 MPa. Moreover, the pressure sensor error of rock mechanics test is less than 1%, the displacement sensor range is between ±50 mm, and the displacement range resolution is 0.000 1 mm. The high test accuracy ensures the reliability of the experimental results.
The full-wave train array acoustic wave testing well interval is from the Chang 6 to Chang 8 Members. Full-wave train array acoustic logging can measure the full wave train information of the formation, with high signal-to-noise ratio, and can obtain high-quality formation shear wave data. At the same time, it overcomes the shortcomings of formation shear waves that cannot be measured by ordinary acoustic wave instruments in soft formations (mudstone formations) or formations with higher toughness. The test results are completed on the LEAD software platform, which uses the completion natural gamma ray as the reference curve for depth calibration.
Using fracturing construction data to determine in-situ stress is one of the most direct and reliable methods at present. When applying this method, the fracturing well interval with complete formation should be selected, that is, the fracturing well with the rupture point can be clearly identified in the fracturing operation curve. Finally, 38 groups of fracturing interval data in the study area were selected for in-situ stress calculation.
Results
Reservoir Petrological Characteristics
The main components of terrigenous clasts in the target layers (C6, C7 and C8) of the Yanchang Formation are quartz and feldspar, while the content of lithic debris and other minerals is less. There is no significant difference in the components of terrigenous detritus among the three layers. In addition, there was no significant difference in feldspar content between C6, C7 and C8. Feldspar is composed of potassium feldspar and plagioclase, of which the plagioclase content is slightly higher than that of potassium feldspar. For debris component, the content of debris in the three layers is dominated by metamorphic rocks. The debris components of the three layers are mainly eruptive rocks and granites, and the content of eruptive rocks is higher than that of granites. Among them, the granite content of the C6 and C7 Members is obviously higher than that of the C8 Member, but there is no significant difference between the granite content of the C6 and C7 Members. Statistics show that the eruptive rock content of the C6 Member is higher than that of the C7 and C8 Members, and the eruptive rock content of the C7 Member is slightly lower than that of the C8 Member.
The relationship between the cement and various framework mineral components and the face ratio of the rock samples is shown in Figure 3. There is a good negative correlation between the cement components (mainly siliceous, carbonate and clay cements) and face ratio and average pore size. This indicates that cement plays a certain role in destroying the petrophysical properties of the Yanchang Formation tight sandstone reservoirs. Furthermore, the correlation between quartz content and face ratio is not significant. However, there is a good positive correlation between feldspar component content and face ratio, which is related to the development of a large number of dissolved pores and fractures in the feldspar minerals.
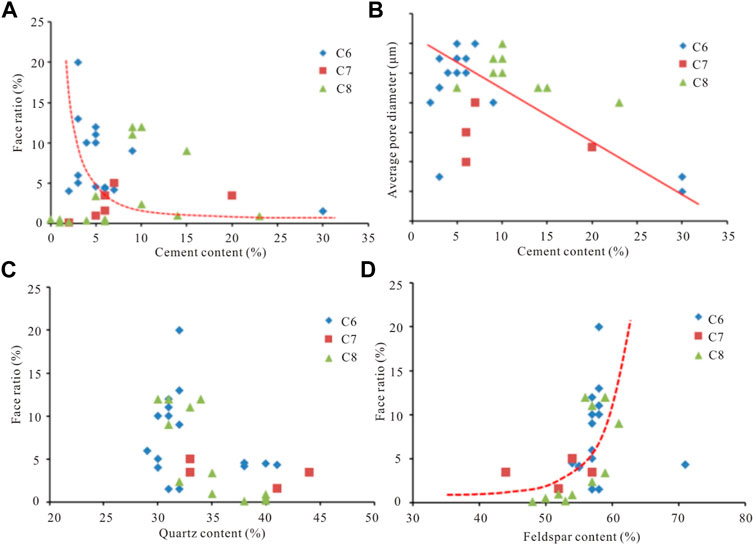
FIGURE 3. Effects of different types of mineral components on petrophysical properties of tight oil reservoirs. (A) Relationship between cement content and face ratio; (B) Relationship between cement content and average pore diameter; (C) Relationship between quartz content and face ratio; (D) Relationship between feldspar content and face ratio.
Rock Rupture Characteristics
Typical stress-strains of the samples in rock mechanics tests are shown in Figure 4. Under uniaxial conditions, the rock has a relatively obvious compaction process, and then transitions to an elastic deformation process, and the main failure mode is exhibited with brittle failures. Under triaxial conditions (35 MPa confining pressure), the rock exhibits elastic-plastic deformation. The higher the confining pressure, the greater the proportion of plastic deformation before failure (Liu et al., 2020; Xu et al., 2021). The main failure mode under triaxial conditions is compression-shear failure, and the plastic segment is significantly extended (Kang et al., 2010; He et al., 2020). Due to the internal mineral composition, micro-cracks or edge damage, the strength values of some samples under high confining pressure conditions are lower than those under low confining pressure conditions.

FIGURE 4. Stress and strain curves of Lc-1 sample in rock mechanics experiments. (A) Uniaxial condition; (B) Confining pressure 35 MPa condition.
The study found that under uniaxial conditions, the samples had obvious tensile rupture patterns. With the addition and increase of confining pressure, the rupture of rock has obvious shear rupture pattern. When the confining pressure is loaded to 35 MPa, a vertical shear fracture is formed.
Changes of Rock Mechanical Parameters Under Different Confining Pressures
The rock mechanics test results show that the compressive strength and Young’s modulus of tight reservoirs are very low under uniaxial conditions. The strength and Young’s modulus of the C7 Member are slightly higher than those of the C6 and C8 Members. The Poisson’s ratios of the C6, C7 and C8 Members are not very different. The difference in rock strength under triaxial conditions is small, and the overall strength of the C6 and C7 Members is slightly higher than that of the C8 Member. Under triaxial conditions, the Young’s modulus of rocks has little difference, and the overall Young’s modulus of the C6 and C7 Members is slightly higher than that of the C8 Member. There is little difference in the Poisson’s ratio of rocks under triaxial conditions. Under the condition of low confining pressure (10 MPa), the Poisson’s ratio of the C6 Member is slightly higher. Under the condition of high confining pressure, the Poisson’s ratio of the C6 and C7 Members is slightly lower than that of the Chang 8 Member.
The variation law of rock mechanical parameters of the samples under different confining pressure conditions is shown in Figure 5. On the whole, as the confining pressure increases, the rock is gradually compacted, and at this time, the compressive strength of the samples gradually increases (Li., 2022). With the increase of confining pressure, the Young’s modulus of rock will gradually increase. However, the sample 2# is abnormal, and the Young’s modulus under the condition of confining pressure of 10 MPa shows a high abnormal value (Figure 5A). Analysis of the reasons found that the sample has an extremely fine-grained sand-like structure and a high content of volcanic debris, resulting in an abnormally high modulus value. For the Poisson’s ratio, with the increase of confining pressure, the Poisson’s ratio has a slightly decreasing trend, which means that the rock hardness gradually increases and the lateral strain amount gradually decreases (Figure 5B).
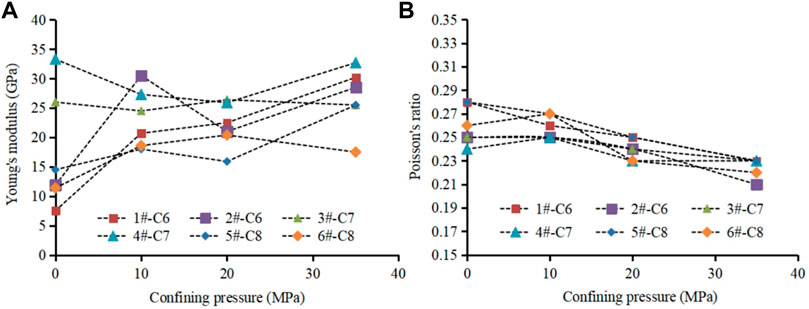
FIGURE 5. Variation of rock mechanical parameters of samples under different confining pressures. (A) Young’s modulus; (B) Poisson’s ratio.
The cohesive force (C) represents the mutual force between the particles inside the rock, and the internal friction angle (φ) represents the direction of rupture of the particles inside the rock. According to the linear Mohr-Coulomb criterion, the rock C and φ are calculated according to the relationship between the axial stress σ1 and the confining pressure σ3 at failure.
where σ1 is the axial stress when the rock sample fails, MPa; σ3 is the confining pressure, MPa.
The relationship between axial stress and confining pressure of some test samples is shown in Figure 6. According to the slope and intercept of this straight line, the cohesion and internal friction angle of the sample can be calculated. The test results show that the cohesion of the C7 Member sand body is relatively high, which represents a high degree of consolidation between grains. The cohesion values of the C6 and C8 Members have little difference. In addition, the internal friction angles of the C6 to C8 sand bodies are mainly distributed between 36.6° and 46.5°. The internal friction angle of the C6 sand body is slightly higher than that of the C7 and C8 Members, while the internal friction angle of the C7 and C8 Members has little difference.
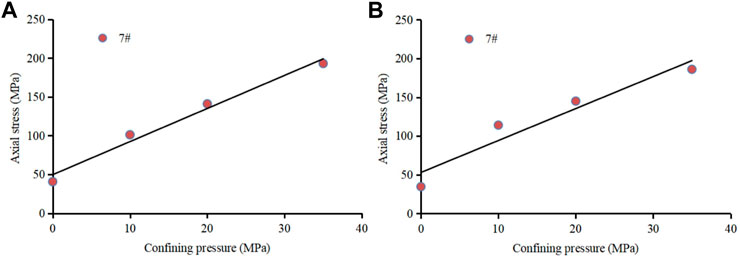
FIGURE 6. Relationship between axial stress and confining pressure of the sandstone samples. (A) Sample 7#; (B) Sample 7#.
Discussion
Logging Interpretation of Rock Mechanical Parameters
When using logging data to extract rock mechanical parameters, the longitudinal and shear wave time differences are required. Based on the full-wave train array acoustic wave test of the target layer, reliable longitudinal and shear wave velocity data were obtained for the C6 to C8 oil groups. Using the Eq. 2, the shear wave time difference of the formation rock can be predicted.
where Δtp is the longitudinal wave time difference, Δts is the shear wave time difference, and R is the correlation coefficient.
The interpretation of rock Young’s modulus and Poisson’s ratio adopts the following physical equations (Eqs 3, 4).
In the formula, Ed is the dynamic Young’s modulus, GPa; vd is the dynamic Poisson’s ratio; Δtp is the longitudinal wave time difference, μs·ft−1; Δts is the shear wave time difference, μs·ft−1; ρb is the bulk density, g·cm−3.
There are differences between the dynamic and static elastic parameters of rocks. On the one hand, it is related to factors such as micro-fractures, pore fluids, mineral components and micro-fabric differences in the rock, and on the other hand, it is related to the strain amplitude and frequency of the loads. Generally, the value of dynamic elastic parameters of rock is larger than its static value, but the parameters of static mechanical properties of rock are more in line with the actual geological situation. The conversion relationships between the dynamic and static Young’s modulus and the Poisson’s ratio of the target layer are shown in Figure 7. Poisson’s ratio is the ratio of the lateral strain to the longitudinal strain of a sample, which is affected by the combined effects of different mineral compositions and tiny sample processing dimensions. Therefore, the dynamic and static Poisson’s ratio usually has a certain degree of dispersion. We think the test results in Figure 7 can satisfy the logging interpretation of mechanical parameters.

FIGURE 7. Conversion relationship between dynamic and static rock mechanics parameters of the target layer in the study area. (A) Dynamic and static Young’s modulus; (B) Dynamic and static Poisson’s ratio.
The logging interpretation formula of cohesion is as follows (Eq. 5):
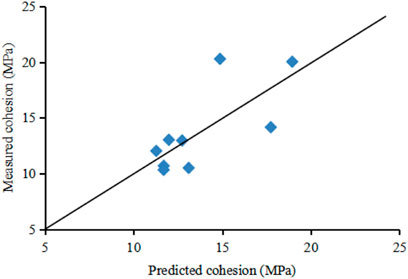
Based on the empirical formula, the least squares method is used to fit the cohesion, and the final cohesion fitting formula is as follows:
The average absolute error of the prediction results of the cohesion of the rock samples is 1.9 MPa, and the prediction accuracy is high (Figure 8).
The internal friction angle is explained by Equations 7, 8:
In the formula, M, A and B are intermediate process variables, dimensionless.
Based on the empirical formula, the least squares method is used to fit the internal friction angle, and the fitting formula of the internal friction angle of the samples is obtained (Eqs 9, 10):
The comparison between the predicted and the measured values of the internal friction angle of the rock samples is shown in Figure 9. It can be seen that the average absolute error of the overall internal friction angle is 2.9°, and the interpretation accuracy is high.
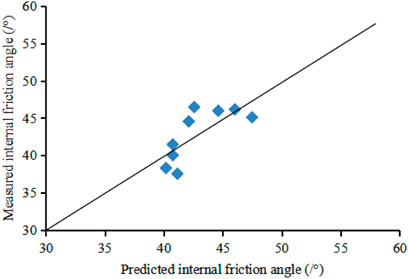
FIGURE 9. Comparison of the tested and predicted values of the internal friction angle of the samples.
Logging Interpretation of In-Situ Stresses
During the fracturing process, the fracturing pressure (Pf) of the rock can be obtained directly from the fracturing test curve (Jaeger and Cook, 1976; Kirmani et al., 2021). Furthermore, the maximum horizontal principal stress (σH) can be determined by the theoretical formula: σH = 3σh−Pf−Pp+σt. Pp is the formation pressure, and the average pressure coefficient of the target layer is 0.74. σt represents the tensile strength, which is usually 10% of the rock’s compressive strength for tight sandstones (Zoback et al., 2003; Yin et al., 2018).
The relationship between the horizontal maximum and horizontal minimum principal stresses of the target layer in the study area is shown in Figure 10. It can be seen that σH is mainly distributed in 30–60 MPa, and σh is mainly distributed in 25–37 MPa. With the increase of burial depth, each principal stress value increases. The state of in-situ stress satisfies: vertical principal stress (σv) >horizontal maximum principal stress (σH) >horizontal minimum principal stress (σh). It shows that the current in-situ stress of the target layer basically presents a relatively relaxed normal stress state.
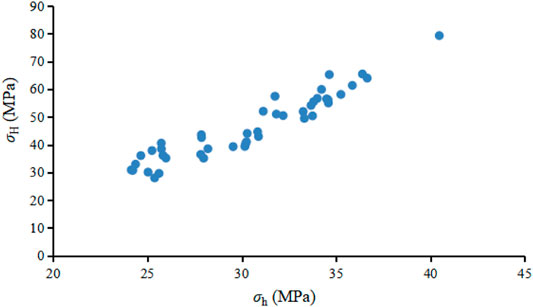
FIGURE 10. Relationship between the maximum and minimum horizontal principal stresses of the target layer in the study area.
In-situ stress refers to the internal stress existing in the crustal rock mass. It is the force on the unit area inside the medium caused by the force of vertical motion and horizontal motion inside the crust and the force of other factors (Li and Zhang 1997; Li et al., 2012; Shuai et al., 2013; Yin et al., 2020). The rock formations in sedimentary basins are under triaxial stress state, and the stress sources are complex. It is generally believed that the stress they are subjected to is composed of the gravity of the overlying rock, the formation pressure, and the tectonic activity. Because the geological situation is very complex, each factor is not independent, but interacts and influences each other (McBride., 1989; Santosh and Feng., 2020; Zheng et al., 2020; Xue et al., 2021).
In this study, an improved Newberry model based on the principle of anisotropy was used to calculate the in-situ stress of tight oil reservoirs. The calculation method has been described in detail by Cui and Radwan (2021). Finally, the comparison between the calculated and the measured results of in-situ stress of some fracturing intervals in the study area is shown in Figure 11. Overall, the mean absolute error of σH of the target layer in the study area is 5.7 MPa, and the mean absolute error of σh is 1.9 MPa. The overall error is small, indicating that the prediction results are reliable.

FIGURE 11. Calculated and measured results of the in-situ stresses of some fracturing intervals in the study area. (A) σH; (B) σh.
In-situ Stress Field Simulation
To establish a tectonic stress field simulation geological model, a series of geological parameters need to be determined. These parameters include the direction of the tectonic stress field, the magnitude of the tectonic stress value, and the mechanical parameters of the deformed medium rock (Zou et al., 2013; Zhao et al., 2017). They are not only the basis for the tectonic stress field simulation, but also the constraint conditions to test the results of the tectonic stress field simulation. According to the triaxial rock mechanics experiment, the Young’s modulus of the target layer is 23 GPa, the Poisson’s ratio is 0.23, the cohesive force is 15 MPa, and the internal friction angle is 42°. Generally, the finer the division of the geological body unit, the higher the calculation accuracy of the mathematical model. There are no faults in the study area, and only low-amplitude structures are developed in local areas. Thus, the mesh density is increased in the low-amplitude uplift regions. The finite element simulation of the established target layer is meshed with hexahedral elements, and a total of 134,213 elements are obtained. The area of the study area is 70 km2, and the size of the grid is 30 m.
A three-dimensional finite element model is constructed according to the main geological structural features of the target layer. The current principal stress direction of the target layer in the study area is the NE direction, so the maximum horizontal principal stress direction is set to the NE direction. Similarly, the minimum horizontal principal stress direction is set to the NW direction. The NE direction stress value is set to 50 MPa, and the NW direction stress value is set to 30 MPa. This boundary condition is reasonable.
In the process of mathematical simulation, according to the law of statics, the resultant force of the external force on the model must be equal to zero, and the resultant moment of the external force must also be equal to zero. That is, the external force system must be balanced to ensure that the calculated model does not move and rotate as a whole. After each force system is balanced, the elasto-plastic incremental method is used to construct the stress field numerical simulation software for in-situ stress calculation and output. If the difference between the calculated value and the measured value is large, it is needed to continue to adjust the boundary force, re-compile the input data body, and then carry out the balance debugging of the force system. Furthermore, it is needed to repeat adjustment→calculation→verification until the principal stress direction calculated by simulation is the same as the measured one. The calculation is not stopped until the differential stress value is quite close to the measured differential stress value of each well point. In this study, the error of the principal stress in the horizontal direction of the simulation results is less than 3 MPa, so the simulation results are reliable.
The finite element mesh model of the study area A is shown in Figure 12A. The model covers the C6 to C8 Members, the C6 Member contains C61 to C64 sublayers, the C7 Member contains C71 to C73 sublayers, and the C8 Member contains C81 to C82 sublayers. Thus, the target layer contains nine sublayers (Figure 12B).
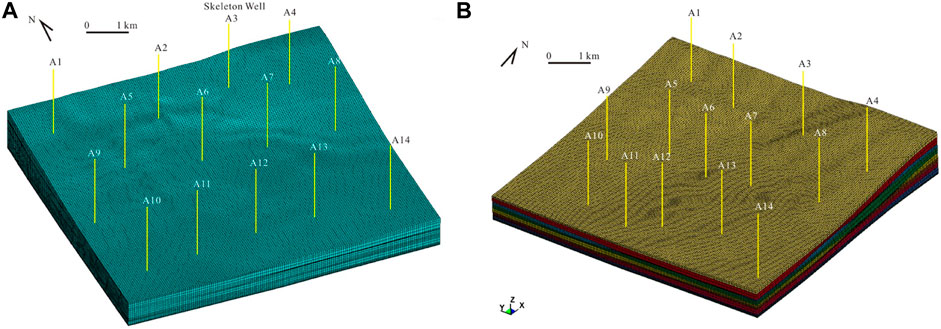
FIGURE 12. 3D finite element model of the target layer in Block (A) Overall mesh model; (B) Layered mesh model.
In this study, the C81 sublayer was taken as an example to illustrate the simulation results of the tectonic stress field (Figure 13). The simulation results show that the horizontal maximum principal stress is distributed along the NE direction, while the horizontal minimum principal stress is distributed along the NW direction (Figure 13). Thus, the stress distribution in the target layer of the work area matches the direction of the applied environmental stress. The values in Figure 13 are all positive, representing compression. In the target layer, σH is mainly distributed in 32–50 MPa, while σh is mainly distributed in 20–34 MPa. Both σH and σh are relatively high in the southern uplift, and the σH is usually greater than 44 MPa, while the σh is usually greater than 24 MPa. The northern part of the study area developed several grooves with relatively low stress values. High stress values are usually banded, which may be related to compression caused by formation deformation.
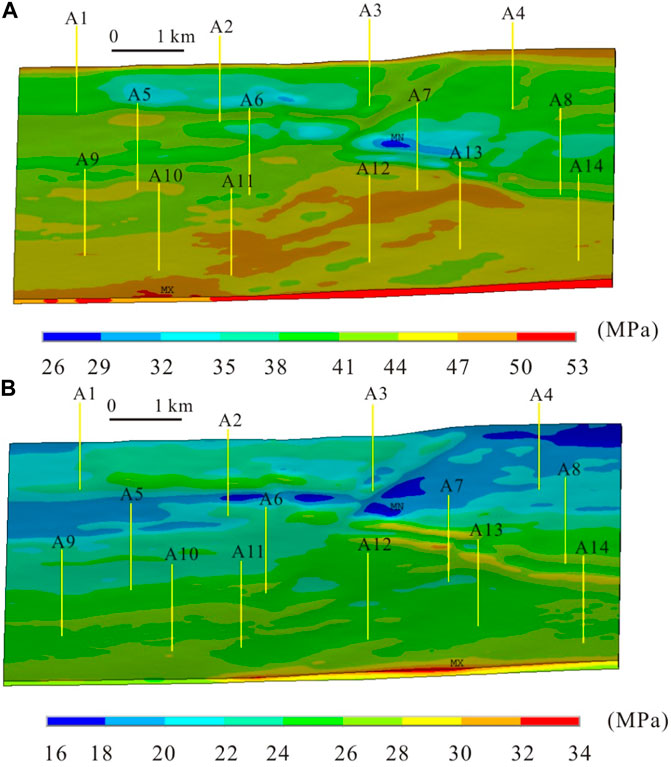
FIGURE 13. Planar distribution of the horizontal principal stresses of the target layer. (A) Maximum horizontal principal stress; (B) Minimum horizontal principal stress.
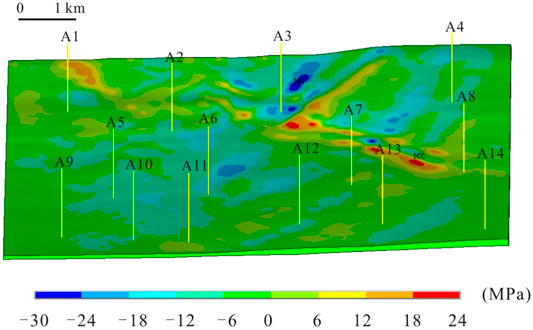
The distribution characteristics of shear stress in the target layer were further analyzed, and the results are shown in Figure 14. It can be seen that the shear stress of the target layer is mainly distributed between −24 and 24 MPa. Typically, negative values represent left-handed, and positive values represent right-handed. The shear stress of the target layer also presents a band-like distribution. Moreover, the left-handed regions and the right-handed regions are usually alternately distributed. However, the extent of the left-handed area in the southern uplift area is larger than that of the right-handed area, indicating that the tight oil reservoirs in the study area are mainly affected by left-handed activities.
Conclusion
1) Under uniaxial conditions, the tight sandstone samples mainly suffer from tensional ruptures. With the increase of confining pressure, the tight sandstone samples undergo obvious shearing ruptures. When the confining pressure is loaded to 35 MPa, a typical vertical shear fracture will be formed in a certain sample.
2) The hydraulic fracturing results show that the in-situ stress state of the target layer satisfies σv > σH > σh. Based on the results of rock mechanics and acoustic tests, we have constructed the dynamic and static mechanical parameter conversion models of tight oil reservoirs and the logging interpretation model of current in-situ stress.
3) The finite element method is used to simulate the three-dimensional structural stress field of the target layer. The horizontal principal stress distribution in the work area is consistent with the applied environmental stress. The σH of the target layer is mainly distributed in 32–50 MPa, and the σh is mainly distributed in 20–34 MPa. Both σH and σh are relatively high in the southern uplift of the work area; among them, σH is usually greater than 44 MPa, and σh is usually greater than 24 MPa.
4) The northern part of the study area developed several grooved areas with relatively low stress values. The regions with high stress values are often distributed in bands, which may be related to the compression caused by the strong deformation of the strata. Left-handed and right-handed regions usually alternate with each other. However, the extent of the left-handed area in the southern uplift area is larger than that of the right-handed area, indicating that the tight oil reservoirs in the study area are mainly affected by left-handed activities.
Data Availability Statement
The original contributions presented in the study are included in the article/Supplementary Material, further inquiries can be directed to the corresponding author.
Author Contributions
MC and ML are responsible for the idea and writing of this paper and XZ, HL, and QZ are responsible for the data preparation and analysis.
Conflict of Interest
XZ was employed by the company County Planning and Natural Resources Bureau of Chongqing Dianjiang and HL was employed by the company County Planning and Natural Resources Bureau of Chongqing Fuling and QZ was employed by the company Sichuan Nine One Five Engineering Survey and Design Limited Company.
The remaining authors declare that the research was conducted in the absence of any commercial or financial relationships that could be construed as a potential conflict of interest.
Publisher’s Note
All claims expressed in this article are solely those of the authors and do not necessarily represent those of their affiliated organizations, or those of the publisher, the editors and the reviewers. Any product that may be evaluated in this article, or claim that may be made by its manufacturer, is not guaranteed or endorsed by the publisher.
References
Baecher, G. B. (1983). Statistical Analysis of Rock Mass Fracturing. Math. Geology. 15 (2), 329–348. doi:10.1007/bf01036074
Borgia, G. C., Bortolotti, V., Brancolini, A., Brown, R. J., and Fantazzini, P. (1996). Developments in Core Analysis by NMR Measurements. Magn. Reson. Imaging 14 (7-8), 751–760. doi:10.1016/s0730-725x(96)00160-9
Chen, G. B., Li, T., Yang, L., Zhang, G. H., Li, J. W., and Dong, H. J. (2021). Mechanical Properties and Failure Mechanism of Combined Bodies with Different Coal-Rock Ratios and Combinations. J. Mining Strata Control. Eng. 3 (2), 023522. doi:10.13532/j.jmsce.cn10-1638/td.20210108.001
Chitrala, Y., Moreno, C., Sondergeld, C., and Rai, C. (2013). An Experimental Investigation into Hydraulic Fracture Propagation under Different Applied Stresses in Tight Sands Using Acoustic Emissions. J. Pet. Sci. Eng. 108, 151–161. doi:10.1016/j.petrol.2013.01.002
Cui, X., and Radwan, A. E. (2021). Coupling Relationship between Current In-Situ Stress and Natural Fractures of continental Tight sandstone Oil Reservoirs. Interpretation 12, 1–53. doi:10.1190/int-2021-0200.1
Dong, S., Zeng, L., Dowd, P., Xu, C., and Cao, H. (2018). A Fast Method for Fracture Intersection Detection in Discrete Fracture Networks. Comput. Geotechnics 98, 205–216. doi:10.1016/j.compgeo.2018.02.005
Fan, X. Y., Gong, M., Zhang, Q. Z., Wang, J. R., Bai, L., and Chen, Y. J. (2014). Prediction of the Horizontal Stress of the Tight sandstone Formation in Eastern Sulige of China. J. Pet. Sci. Eng. 113, 72. doi:10.1016/j.petrol.2013.11.016
Gao, F. Q. (2021). Influence of Hydraulic Fracturing of strong Roof on Mining-Induced Stress Insight from Numerical Simulation. J. Mining Strata Control. Eng. 3 (2), 023032. doi:10.13532/j.jmsce.cn10-1638/td.20210329.001
Gurocak, Z., Solanki, P., Alemdag, S., and Zaman, M. M. (2012). New Considerations for Empirical Estimation of Tensile Strength of Rocks. Eng. Geology. 145-146, 1–8. doi:10.1016/j.enggeo.2012.06.005
He, S. M., Wang, W., and Shen, H. (2015). Factors Influencing Wellbore Stability during Underbalanced Drilling of Horizontal wells when Fluid Seepage Is Considered. J. Nat. Gas Sci. Eng. 23, 80∼–89. doi:10.1016/j.jngse.2015.01.029
He, X., Zhang, P., He, G., Gao, Y., Liu, M., Zhang, Y., et al. (2020). Evaluation of Sweet Spots and Horizontal-Well-Design Technology for Shale Gas in the basin-margin Transition Zone of southeastern Chongqing, SW China. Energ. Geosci. 1 (3–4), 134–146. doi:10.1016/j.engeos.2020.06.004
Hong, D., Cao, J., Wu, T., Dang, S., Hu, W., and Yao, S. (2020). Authigenic clay Minerals and Calcite Dissolution Influence Reservoir Quality in Tight Sandstones: Insights from the central Junggar Basin, NW China. Energ. Geosci. 1 (1–2), 8–19. doi:10.1016/j.engeos.2020.03.001
Huang, X., Li, A., Li, X., and Liu, Y. (2019). Influence of Typical Core Minerals on Tight Oil Recovery during CO2 Flooding Using the Nuclear Magnetic Resonance Technique. Energy Fuels 33 (8), 7147–7154. doi:10.1021/acs.energyfuels.9b01220
Jaeger, J. C., and Cook, N. G. W. (1976). Fundamentals of Rock Mechanics. London: Chapman & Hall, 128
Kang, H., Zhang, X., and Si, L. (2010). In-situ Stress Measurements and Stress Distribution Characteristics in Underground Coal Mines in China. Eng. Geology. 116, 333− 345. doi:10.1016/j.enggeo.2010.09.015
Kirmani, F. U. D., Raza, A., Gholami, R., Haidar, M. Z., and Fareed, C. S. (2021). Analyzing the Effect of Steam Quality and Injection Temperature on the Performance of Steam Flooding. Energ. Geosci. 2 (1), 83–86. doi:10.1016/j.engeos.2020.11.002
Lan, S. R., Song, D. Z., Li, Z. L., and Liu, Y. (2021). Experimental Study on Acoustic Emission Characteristics of Fault Slip Process Based on Damage Factor. J. Mining Strata Control. Eng. 3 (3), 033024. doi:10.13532/j.jmsce.cn10-1638/td.20210510.002
Li, D. Y., Wong, L. N. Y., Liu, G., and Zhang, X. P. (2012). Influence of Water Content and Anisotropy on the Strength and Deformability of Low Porosity Meta-Sedimentary Rocks under Triaxial Compression. Eng. Geology. 126, 46−–66. doi:10.1016/j.enggeo.2011.12.009
Li, H., Qin, Q., Zhang, B., Ge, X., Hu, X., Fan, C., et al. (2020b). Tectonic Fracture Formation and Distribution in Ultradeep Marine Carbonate Gas Reservoirs: A Case Study of the Maokou Formation in the Jiulongshan Gas Field, Sichuan Basin, Southwest China. Energy Fuels 34 (11), 14132–14146. doi:10.1021/acs.energyfuels.0c03327
Li, H. (2022). Research Progress on Evaluation Methods and Factors Influencing Shale Brittleness: A Review. Energ. Rep. 8, 4344–4358. doi:10.1016/j.egyr.2022.03.120
Li, Y., Zhou, D., Wang, W., Jiang, T., and Xue, Z. (2020a). Development of Unconventional Gas and Technologies Adopted in China. Energ. Geosci. 1 (1–2), 55–68. doi:10.1016/j.engeos.2020.04.004
Li, Z. M., and Zhang, J. C. (1997). Crustal Stress and Hydrocarbon Exploration and Development. Beijing: Petroleum Industry Press, 138− 140.
Liu, Y., Gao, M., and Zhao, H. (2020). Detection of Overlying Rock Structure and Identification of Key Stratum by Drilling and Logging Technology. J. Mining Strata Control. Eng. 2 (2), 023038. doi:10.13532/j.jmsce.cn10-1638/td.2020.02.004
Lommatzsch, M., Exner, U., Gier, S., and Grasemann, B. (2015). Dilatant Shear Band Formation and Diagenesis in Calcareous, Arkosic Sandstones, Vienna Basin (Austria). Mar. Pet. Geology. 62, 144–160. doi:10.1016/j.marpetgeo.2015.02.002
Mahmoodi, S., Abbasi, M., and Sharifi, M. (2019). New Fluid Flow Model for Hydraulic Fractured wells with Non-uniform Fracture Geometry and Permeability. J. Nat. Gas Sci. Eng. 68, 1–14. doi:10.1016/j.jngse.2019.102914
McBride, E. F. (1989). Quartz Cement in Sandstones: A Review. Earth- Sci. Rev. 26, 69∼112. doi:10.1016/0012-8252(89)90019-6
Santosh, M., and Feng, Z. Q. (2020). New Horizons in Energy Geoscience. Energ. Geosci. 1 (1–2), 1–3. doi:10.1016/j.engeos.2020.05.005
Shuai, Y., Zhang, S., Mi, J., Gong, S., Yuan, X., Yang, Z., et al. (2013). Charging Time of Tight Gas in the Upper Paleozoic of the Ordos Basin, central China. Org. Geochem. 64, 38–46. doi:10.1016/j.orggeochem.2013.09.001
Xu, Y., Zhang, H., and Guan, Z. (2021). Dynamic Characteristics of Downhole Bit Load and Analysis of Conversion Efficiency of Drill String Vibration Energy. Energies 14, 228–229. doi:10.3390/en14010229
Xue, F., Liu, X. X., and Wang, T. Z. (2021). Research on Anchoring Effect of Jointed Rock Mass Based on 3D Printing and Digital Speckle Technology. J. Mining Strata Control. Eng. 3 (2), 023013. doi:10.13532/j.jmsce.cn10-1638/td.20201020.001
Yin, S., Dong, L., Yang, X., and Wang, R. (2020). Experimental Investigation of the Petrophysical Properties, Minerals, Elements and Pore Structures in Tight Sandstones. J. Nat. Gas Sci. Eng. 76 (1), 1–14. doi:10.1016/j.jngse.2020.103189
Yin, S., Lv, D., and Ding, W. (2018). New Method for Assessing Microfracture Stress Sensitivity in Tight sandstone Reservoirs Based on Acoustic Experiments. Int. J. Geomechanics 18 (4), 1–10. doi:10.1061/(asce)gm.1943-5622.0001100
Yin, S., and Wu, Z. (2020). Geomechanical Simulation of Low-Order Fracture of Tight sandstone. Mar. Pet. Geology. 100, 1–10. doi:10.1016/j.marpetgeo.2020.104359
Zhao, J., Tang, D., Qin, Y., Xu, H., Lv, Y., Tao, S., et al. (2017). Evaluation of Fracture System for Coal Marcolithotypes in the Hancheng Block, Eastern Margin of the Ordos Basin, China. J. Pet. Sci. Eng. 159, 799–809. doi:10.1016/j.petrol.2017.09.031
Zheng, H., Zhang, J., and Qi, Y. (2020). Geology and Geomechanics of Hydraulic Fracturing in the Marcellus Shale Gas Play and Their Potential Applications to the Fuling Shale Gas Development. Energ. Geosci. 1 (1–2), 36–46. doi:10.1016/j.engeos.2020.05.002
Zoback, M. D., Barton, C. A., and Brudy, M. (2003). Determination of Stress Orientation and Magnitude in Deep wells. Int. J. Rock Mech. Mining Sci. 40, 1049∼–1076. doi:10.1016/j.ijrmms.2003.07.001
Zou, C. N., Yang, Z., Tao, S. Z., Yuan, X. J., Zhu, R. K., Hou, L. H., et al. (2013). Continuous Hydrocarbon Accumulation over a Large Area as a Distinguishing Characteristic of Unconventional Petroleum: The Ordos Basin, North-Central China. Earth-Science Rev. 126, 358–369. doi:10.1016/j.earscirev.2013.08.006
Keywords: tight oil reservoir, triaxial experiment, rock mechanical properties, in-situ stress, numerical simulation
Citation: Cai M, Li M, Zhu X, Luo H and Zhang Q (2022) Comprehensive Evaluation of Rock Mechanical Properties and in-situ Stress in Tight Sandstone Oil Reservoirs. Front. Earth Sci. 10:911504. doi: 10.3389/feart.2022.911504
Received: 02 April 2022; Accepted: 13 April 2022;
Published: 27 April 2022.
Edited by:
Shuai Yin, Xi’an Shiyou University, ChinaReviewed by:
Peng Wang, Yibin University, ChinaTeng Zhao, China University of Geosciences, China
Ying Tang, Xi’an Shiyou University, China
Copyright © 2022 Cai, Li, Zhu, Luo and Zhang. This is an open-access article distributed under the terms of the Creative Commons Attribution License (CC BY). The use, distribution or reproduction in other forums is permitted, provided the original author(s) and the copyright owner(s) are credited and that the original publication in this journal is cited, in accordance with accepted academic practice. No use, distribution or reproduction is permitted which does not comply with these terms.
*Correspondence: Ming Li, bGltaW5nMzc3NUAxMjYuY29t
 Mingliyang Cai1
 Ming Li