 Zhiqi Zhang
 Jikun Feng
 Huajian Yao
- 1Laboratory of Seismology and Physics of Earth’s Interior, School of Earth and Space Sciences, University of Science and Technology of China, Hefei, Anhui, China
- 2Mengcheng National Geophysical Observatory, University of Science and Technology of China, Mengcheng, Anhui, China
- 3CAS Center for Excellence in Comparative Planetology, University of Science and Technology of China, Hefei, Anhui, China
The tectonic evolution and deformation process of the southeastern Tibetan Plateau has been one of the focuses of the geoscience community in recent decades. However, the crustal and mantle deformation mechanism in the southeastern Tibetan Plateau is still under debate. Seismic anisotropy inferred from surface wave tomography could provide critical insights into the deformation mechanism of the Earth’s tectonosphere. Here, we constructed a 3-D azimuthal anisotropy velocity model with Rayleigh wave phase velocity dispersion data from 132 permanent stations to analyze the deformation modes in the southeastern Tibetan Plateau. In the upper crust, the azimuthal anisotropy near the main strike-slip faults exhibits strong magnitude with fast axis subparallel to the fault strike, which is consistent with the rigid block extrusion pattern. In the mid-lower crust, two low-velocity anomalies appeared beneath the Sonpan-Ganzi Terrane and Xiaojiang Fault zone with strong azimuthal anisotropy, which may indicate ductile deformation of the weak mid-lower crust. However, the two low-velocity anomalies are separated by a high-velocity barrier with weak azimuthal anisotropy in the inner zone of the Emeishan large igneous province. In the upper mantle, the anisotropy pattern is relatively simple in the rigid Yangtze Craton and mainly represents fossil anisotropy. In the southern part, the lithosphere thinned beneath the Indochina and Cathaysia Blocks, and the anisotropy is plausibly caused by the upwelling and lateral flows of upwelling hot asthenospheric materials.
1 Introduction
As a result of the India-Asian collision since the Cenozoic (Molnar and Tapponnier, 1975; Rowley, 1996), the lithospheric architecture and the geodynamic process of the Tibetan Plateau and adjacent areas have long been major concerns of the geoscience community. Many models have been proposed to explain the extreme uplift and crustal thickening of the Tibetan Plateau, and two typical models have been widely adopted. One is a rigid block extrusion model that suggests lithospheric materials extruded from the Tibetan Plateau as rigid blocks along strike-slip faults (Tapponnier et al., 1982; England and Houseman, 1986; Tapponnier et al., 2001); another type of model is a mid-lower crustal channel flow model that emphasizes the existence of low-viscosity channels in the mid-lower crust facilitating effective crustal material migration (Royden et al., 1997; Clark and Royden, 2000; Beaumont et al., 2001). As a significant weak window for material migration away from the Tibetan Plateau interior (Figure 1), the southeastern margin of the Tibetan Plateau plays an important role in understanding the tectonic evolution and material extrusion of the Tibetan Plateau.
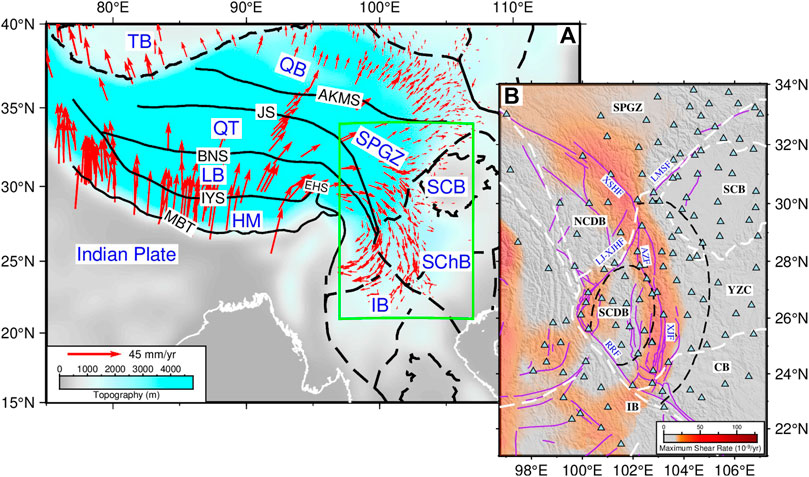
FIGURE 1. (A) Geological setting in the Tibetan Plateau. The red arrows exhibit the GPS velocity measurements with respect to a stable Eurasia plate from Zhang et al. (2004). The green box denotes the study area. (B) Station map and geological setting in the southeastern Tibetan Plateau. Light blue triangles mark the distribution of stations. The background color shows the maximum shear rate (modified from Wang and Shen, 2020). Purple lines mark faults: LMSF, Longmenshan Fault; LJ-XJHF, Lijiang-Xiaojinhe Fault; AZF, Anninghe-Zemuhe Fault; XJF, Xiaojiang Fault; RRF, Red River Fault. The black and white lines represent the suture or block boundary. AKMS, Ayimaqin-Kunlun-Muztagh Suture; JS, Jinsha Suture; BNS, Bangong-Nujiang Suture; IYS, Indus-Yarlung Zangbo Suture; EHS, Eastern Himalayan Syntaxis; MBT, Main Himalayan Thrust. TB, Tarim Basin; QB, Qaidam Basin; QT, Qiantang Terrane; LB, Lhasa Terrane; HM, Himalayan Block; SPGZ, Songpan-Ganzi Terrane; SChB, South China Block; SCB, Sichuan Basin; NCDB, North Chuan-Dian Block; SCDB, South Chuan-Dian Block; YZC, Yangtze Craton; CB, Cathaysia Block; IB, Indochina Block. Black dashed lines mark the inner and intermediate zones of the Emeishan large igneous province (Xu et al., 2004).
The southeastern Tibetan Plateau consists of several blocks, including the Songpan-Ganzi Terrane in the north, the stable Yangtze Craton, the Cathaysia Block in the east, the Indochina Block in the south and the Chuan-Dian Block (Figure 1). Field observations suggest that this area is dominated by strike-slip faults such as the Xianshuihe-Xiaojiang Fault and Red River Fault and lacks large-scale crustal shortening (Royden et al., 1997; Burchfiel and Chen, 2013). GPS data show clockwise rotational movement of the surface in this area and a strong shear strain rate along the main strike-slip faults (Figure 1) (King et al., 1997; Chen et al., 2000; Zhang et al., 2004; Wang and Shen, 2020).
To investigate the subsurface structure of the southeastern Tibetan Plateau, many tomography studies have been performed in recent decades and have obtained many important results. Two significant low-velocity anomalies (Yao et al., 2008; Bao et al., 2015; Zhang et al., 2020; Han et al., 2022) with high conductivity (Bai et al., 2010; Li et al., 2019) and high seismic attenuation (Zhao et al., 2013; Dai et al., 2020) have been detected in the mid-lower crust by seismic and magnetotelluric tomography. The two low-velocity anomalies are separated by a high-velocity anomaly located in the South Chuan-Dian Block (Bao et al., 2015; Xu et al., 2015; Qiao et al., 2018; Yang et al., 2020; Zhang et al., 2020; Han et al., 2022). This crustal high-velocity anomaly is likely related to an ancient mantle plume that formed the Emeishan large igneous province (ELIP) in the western Yangtze Craton (black dashed line in Figure 1) (Chung and Jahn, 1995; Xu et al., 2001; Lo et al., 2002; He et al., 2003; Xu et al., 2004). In the Indochina and Cathaysia Blocks, significant lithospheric thinning and low-velocity material upwelling have been revealed by receiver functions (Yang et al., 2017) and seismic wave tomography (Li et al., 2008; Huang Z. C. et al., 2015; Lei and Zhao, 2016; Huang et al., 2019).
Although large-scale mid-lower crustal low-velocity anomalies beneath the southeastern Tibetan Plateau have been confirmed, their spatial distribution and associated deformation mechanisms between the crust and upper mantle are still under debate. Seismic anisotropy is the dependence of seismic velocity on direction or upon angle (Thomsen, 2014), which is closely related to the regional stress distribution. Compared to isotropic velocity structures, anisotropic structures can provide crucial information about tectonic deformation.
Therefore, seismic anisotropy studies are needed to further investigate the deformation features and regional tectonic processes in the southeastern Tibetan Plateau (e.g., Crampin, 1981; Savage, 1999; Weiss et al., 1999; Mainprice et al., 2005). Teleseismic XKS shear-wave splitting observations revealed two distinct anisotropy patterns in this area (Lev et al., 2006; Chang et al., 2008; Chang et al., 2015). The fast axis is oriented NW‒SE or nearly N‒S north of 26°N but suddenly changes to nearly E‒W south of 26°N. Shear-wave splitting from Pms (Chen et al., 2013; Kong et al., 2016; Han et al., 2020) and local earthquakes (Shi et al., 2012), which is sensitive to crustal anisotropy, shows fault-parallel fast direction and is almost perpendicular to the fast direction inferred from teleseismic shear-wave splitting south of 26°N (Huang Z. et al., 2015; Chang et al., 2015). All these shear-wave splitting results indicate a complicated, laterally varied and depth-dependent deformation mechanism in the southeastern Tibetan Plateau. However, it is very difficult to evaluate the depth range of the anisotropy source due to the relatively poor depth resolution of shear-wave splitting data (e.g., Savage, 1999). Seismic anisotropy inverted from surface waves is a powerful tool to analyze tectonic deformation and the source location of anisotropy (Yao et al., 2010). Several surface wave tomography studies have been performed in the southeastern Tibetan Plateau and have revealed strong variations in the depth of the anisotropy pattern (e.g., Liu et al., 2019; Bao et al., 2020; Liang et al., 2020; Han et al., 2022). All these azimuthal anisotropy models show nearly N-S fast axis directions or are parallel to the strike of faults in the upper crust, while the strong anisotropy area is overall consistent with the low-velocity area in the mid-lower crust. However, the fast axis of the model from Liu et al. (2019) is nearly the E-W direction in the upper mantle, similar to the teleseismic shear wave splitting results, the fast axis direction is still nearly N-S in the other three models (Bao et al., 2020; Liang et al., 2020; Han et al., 2022). Although there are some anisotropy models of SE Tibet derived from body/surface wave tomography (Wei et al., 2013; Han et al., 2022) that are down to the asthenosphere, the depth range of most previous studies was mainly concentrated in the crust or uppermost mantle and cannot constrain the whole lithospheric mantle or asthenosphere.
In this paper, we use Rayleigh wave phase velocity dispersion data collected from permanent stations in the southeastern Tibetan Plateau and apply a direct inversion method (Liu et al., 2019) to invert the 3-D shear wave velocity structure and azimuthal anisotropy from the crust to the upper mantle (<200 km). Then, we carefully discuss the azimuthal anisotropy patterns and the corresponding tectonic deformation, especially for the depth distribution of anisotropy sources.
2 Data and methods
We measured the phase velocity dispersion curves in the period range of 5–150 s from ambient noise cross-correlations (Yang et al., 2020) and teleseismic waveforms recorded by 132 permanent stations (Figure 1) in the southeastern Tibetan Plateau (Zheng et al., 2010). Finally, we obtained 7,441 phase velocity dispersion curves in total. Figure 2 shows the ray path coverage at 25 s and the ray path number at each period (Ray path coverage at other periods and the distribution of teleseismic events used are shown in Supplementary Figure S1). The ray path number at the short and intermediate periods (5–50 s) increases dramatically after adding the dispersion measurements from ambient noise data. At intermediate to long periods (50–150 s), the ray path number is approximately 2,000 and exhibits good azimuthal coverage in the center study area. The phase velocity dispersion data utilized in this study are the same as in our previous work (Zhang et al., 2020), for more data details, please refer to this paper and Supplementary Figure S2.
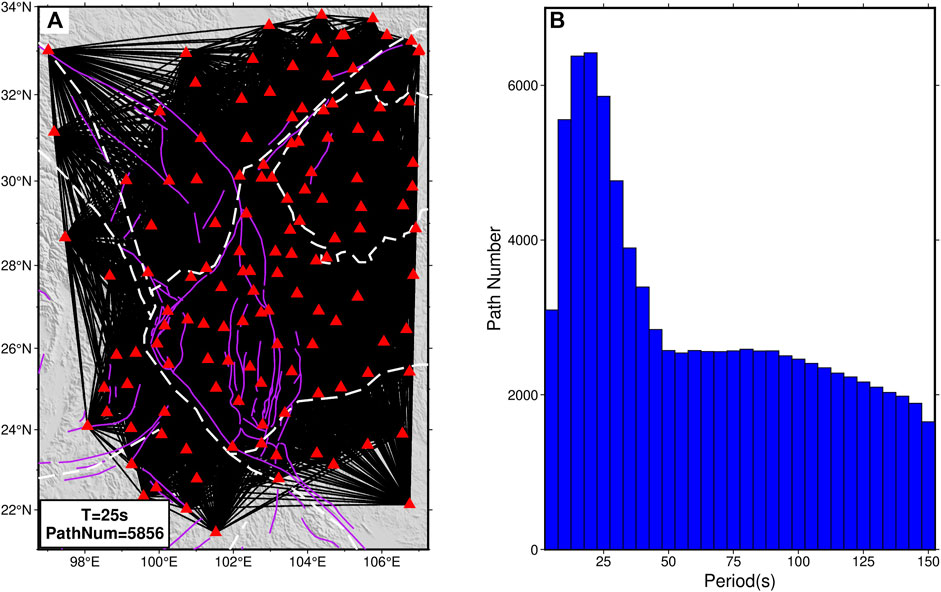
FIGURE 2. (A) Path coverage at a period of 25 s. The red triangles represent stations. “T” is the period, and “PathNum” is the path number at the corresponding period. (B) Number of paths of each period.
We used the direct inversion method proposed by Liu et al. (2019) to directly invert the 3-D shear wave velocity structure and azimuthal anisotropy in southeastern Tibetan Plateau from Rayleigh wave phase velocity dispersion measurements. The direct inversion method has two obvious advantages: (1) The direct inversion method is based on a 3-D velocity structure with lateral and vertical model smoothness; (2) the forward calculation of the direct inversion method is based on the fast-marching ray-tracing method (Rawlinson and Sambridge, 2004), so it can consider the frequency-dependent ray-bending effect of surface waves and efficiently improve the inversion accuracy. Typically, the azimuthally anisotropic velocity perturbations are within several percent, so a reliable initial velocity model is needed to ensure the convergence of the inversion for azimuthal anisotropy. Therefore, the procedure of the direct inversion method is divided into two parts: (1) first, we inverted only the 3-D isotropic shear wave velocity model directly from Rayleigh wave phase travel times (Fang et al., 2015); (2) then, we adopted the isotropic shear wave velocity model obtained in the first step as the initial model to invert the 3-D isotropic shear wave velocity and azimuthal anisotropy simultaneously.
We inverted the crust and upper mantle (0–200 km at depth) 3-D shear wave velocity and azimuthal anisotropy structure in the study area according to the period range of dispersion data (5–150 s). We took the smoothed SWChinaVs_2018 model from Yang et al. (2020) as the initial crustal model (≤50 km) and used the ak135 model (Kennett et al., 1995) as the initial mantle part model. We divided the crust and mantle parts according to the Moho depth from previous studies (He et al., 2014), therefore, our initial velocity model included the Moho depth information. We use such an initial model to avoid the inaccuracy in the crust broadcast to the upper mantle in the inversion and try to ensure that the inversion result in the upper mantle is mainly restricted by the data. The grid size of the initial model is 0.5° × 0.5° in the horizontal direction and has variable intervals in the vertical direction considering the decreasing resolution of the surface wave with increasing depth. The grid interval in the depth, therefore, is 5 km from 0 to 70 km depth, 7.5 km from 70 to 115 km depth, and 10 km from 115 to 185 km depth. The weight (smoothing) parameters of isotropic and anisotropic were both subjectively set to 20 after many attempts.
3 Results
3.1 Checkerboard test
We performed checkerboard tests to estimate the data coverage and resolution of the direct inversion method. The checkerboard size of the isotropic model is 1°×1° above 50 km depth and 1.5°×1.5° beneath 50 km depth. The checkerboard size of the anisotropic model is 1.5°×1.5° at all depths. Both isotropic and anisotropic checkerboard models are depth dependent, and the pattern reverses after a depth of 107.5 km. We added 1% and 0.5% Gaussian random noise to the synthetic travel-time data calculated from the isotropic model and anisotropic model, respectively. Other parameters are the same as those in the inversion.
The recovered result is good in the central study area but relatively poor in the western and southern margins, especially for the anisotropic pattern (Figure 3). The isotropic checkerboard pattern can be well recovered in most of the study area except in the northwest corner and west of 99°E. For the anisotropic checkerboard model, the area that can be recovered is almost the same as the isotropic results at shallow depths (≤85 km). At deep depths (>85 km), the recovered anisotropic results are relatively poor at the margin of the study area but still show good resolution in the central area (approximately between 99°E−106°E and 24°N-32°N). Both isotropic and anisotropic checkerboard tests suggest high resolution in the central area but low resolution in the western margin.
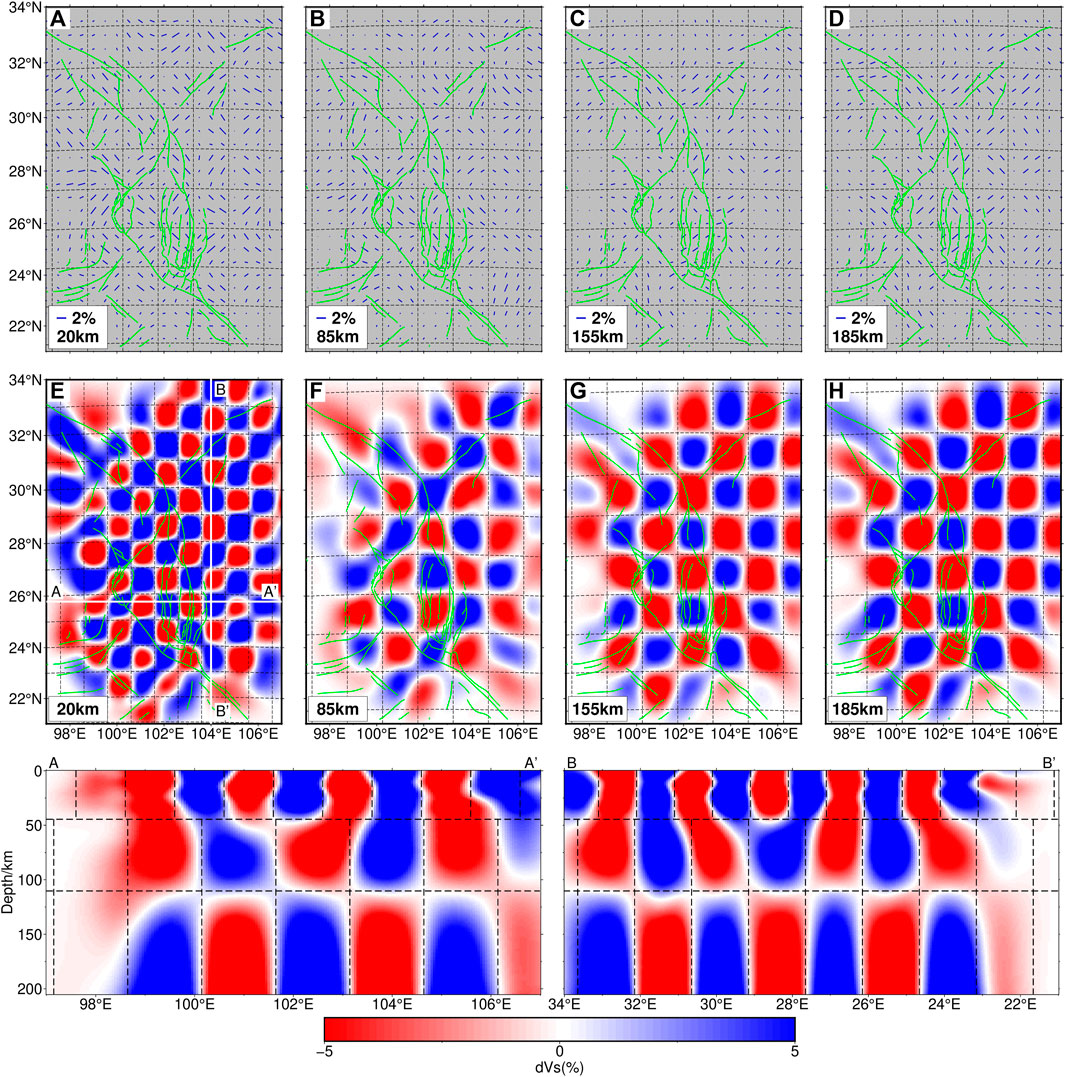
FIGURE 3. Results of checkerboard tests. The true isotropic and anisotropic anomalies are ±5% and ±2%, respectively. Figures (A–H) show the recovered anisotropic and isotropic results, respectively. Blue short lines show the fast axis direction and magnitude of azimuthal anisotropy. Black dashed lines mark the boundary of true anisotropic and isotropic checkerboard patterns. Green lines represent the faults. Profiles AA’ and BB’ show the vertical slice of the recovered isotropic models, and their locations are marked as white lines in (E).
Three resolution synthetic tests were performed to demonstrate the trade-off between isotropic and anisotropic structures and the robustness of our inversion (Supplementary Figures S3–S7). The synthetic test results show good reliability of the isotropic and anisotropic patterns. However, the resolution of anisotropic structure in the southern part of the study area is not good in the deep part. Therefore, we eliminated the west margin of the inverted model, and the anisotropic structure south of 24°N was not shown below 135 km depth (Figures 5H–I).
3.2 Isotropic shear wave velocity and azimuthal anisotropy structure
The residual distribution results show good convergence after inversion (Figure 4). The average and standard deviation values of residuals exhibit a significant decrease after isotropic inversion. After anisotropic inversion, the standard deviation value of the data residuals further decreases. Although the average value of the data residuals shows a slight increase after anisotropic inversion, it (∼0.08 s) is only approximately 0.05% of the average surface travel time (∼153 s) and is negligible within the measurement uncertainty (approximately 0.5%–1%) (Yao and van der Hilst, 2009).
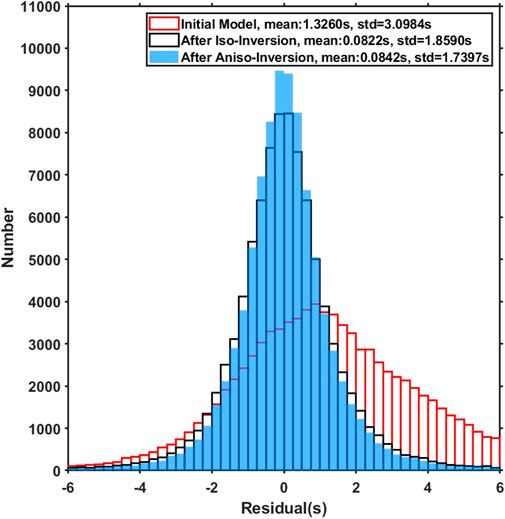
FIGURE 4. The distribution of Rayleigh wave travel-time residuals for the initial model (red bar), after isotropic inversion (black bar), and after anisotropic inversion (blue bar). “Mean” and “‘std” show the average and standard deviation values of residuals at different inversion steps.
Our 3-D isotropic shear wave velocity and azimuthal anisotropy structure demonstrate strong lateral contrast at given depths (Figure 5). At a depth of 10 km, there are two significant low-velocity anomalies in the northwestern and southeastern parts of the Sichuan Basin, and other areas mainly show relatively high-velocity anomalies except the fault zones. The magnitude of azimuthal anisotropy is relatively weak in the Yangtze Craton and Cathaysia Block. The fast axis is NW‒SE in the Songpan-Ganzi Terrane and subparallel to the strike of the Xiaojiang Fault zone at a depth of 10 km.
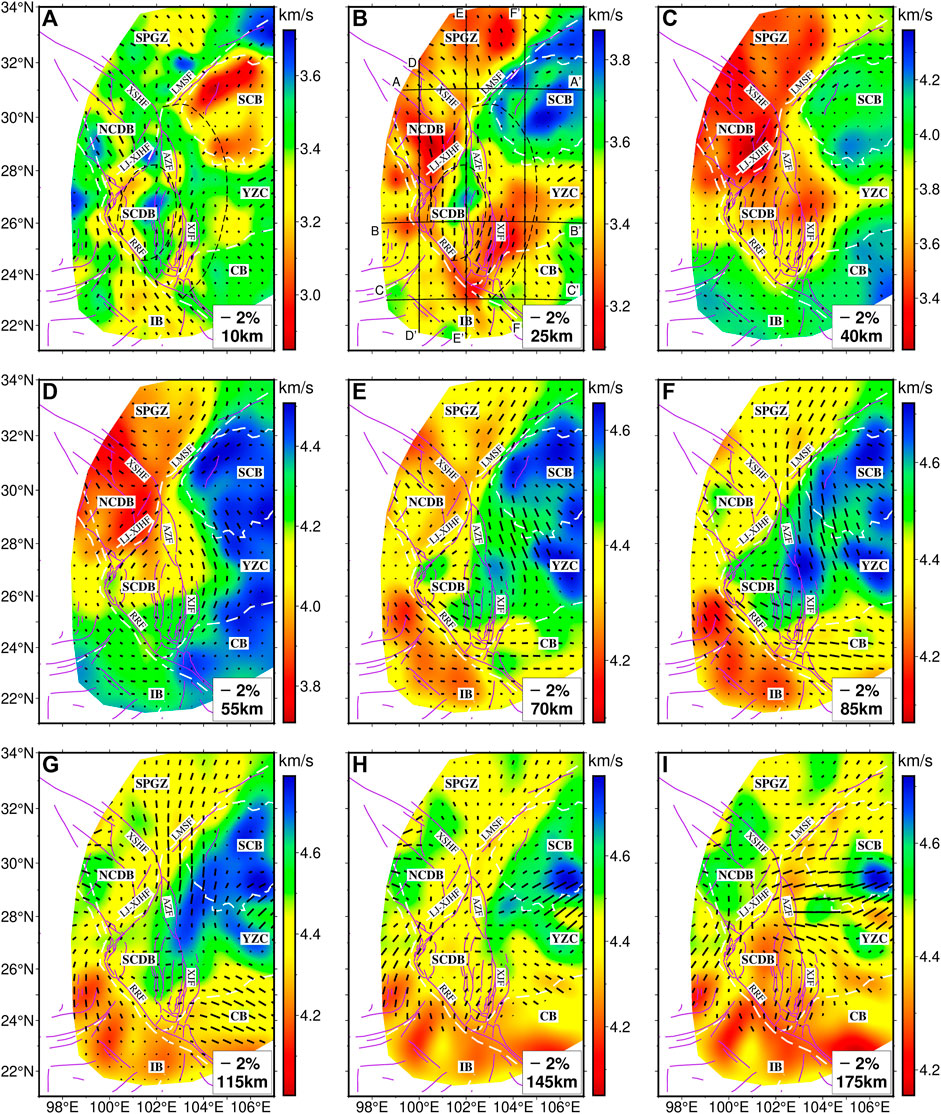
FIGURE 5. Map views of the 3-D shear wave velocity and azimuthal anisotropy structure at different depths. (A–I) Purple lines and white dashed lines are the faults and block boundaries, respectively (the abbreviations of faults and blocks are the same as Figure 1). Short black lines represent the azimuthal anisotropy. Black dashed lines mark the inner and intermediate zones of the Emeishan large igneous province.
The velocity pattern is almost reversed at 25 km depth. The Sichuan Basin is represented by a high-velocity anomaly, and two low-velocity anomalies appear beneath the Songpan-Ganzi Terrane, North Chuan-dian Block and Xiaojiang Fault zone. However, the two low-velocity anomalies are separated by an obvious high-velocity anomaly in the inner zone of the ELIP. The two low-velocity anomalies exhibit strong azimuthal anisotropy with a fast axis direction nearly parallel to the strikes of the two low-velocity anomalies. In contrast, weak azimuthal anisotropy is observed in the high-velocity area in the inner zone of the ELIP.
Large-scale low-velocity anomalies appear in the Songpan-Ganzi Terrane, South Chuandian Block and west margin of the Yangtze Craton at 40 km depth, whereas high-velocity anomalies appear in the Indochina Block and Cathaysia Block. In the low-velocity area, the magnitude of anisotropy is strong, and the fast axis direction is parallel to the strike of major faults (e.g., Lijiang-Xiaojinhe Fault, Longmenshan Fault and Xiaojiang Fault) but becomes relatively weak in the area with high-velocity anomalies.
The velocity structure at 55 km depth basically represents the upper mantle in most regions featured by high velocities except the Songpan-Ganzi Terrane, where the low velocities characterize the lower crust. The fast axis direction is NW‒SE in the Sonpan-Ganzi Terrane and North Chuan-dian Block, but it is changed to NE‒SW when it reaches the Longmenshan Fault. It is worth noting that the azimuthal anisotropy becomes strong with NW‒SE or nearly N‒S fast axis direction in the Yangtze Craton.
Beneath 70 km depth, a low-velocity anomaly appears in the Indochina Block and gradually extends to the Cathaysia Block in the east at 115 km depth and then extends northward to the South Chuandian Block along the Xiaojiang Fault at approximately 175 km depth. South of 26°N, the fast axis direction of anisotropy is E‒W at 70 km depth but becomes very weak in the Indochina Block with increasing depth. The fast axis direction of anisotropy is NW‒SE or nearly N‒S north of 26°N between 70 km and 110 km depths but gradually rotates to NE‒SW below 115 km depth.
To further show the depth variation of our velocity model, we plotted six vertical profiles (Figure 6). The locations of these profiles are marked in Figure 5B. We notice a strong high-velocity body with weak anisotropy in the Sichuan Basin that extends downward to approximately 185 km depth in profiles AA’ and FF’. Two significant low-velocity anomalies with strong azimuthal anisotropy can be observed from most profiles except profile CC’ between 20 and 40 km depth. However, these two low-velocity anomalies are separated by the high-velocity anomaly in the South Chuandian Block in the middle-lower crust, as shown in profiles BB’ and EE’ and the high-velocity anomaly seems to extend downward to approximately 140 km depth. In profiles CC’ to FF’, we can observe large-scale low-velocity anomalies with nearly E‒W fast axis directions in the mantle beneath the Indochina Block and Cathaysia Block. The low-velocity anomaly then extends northward to the South Chuandian Block at approximately 150 km depth, but the magnitude of anisotropy becomes weak beneath with increasing depth in the Indochina Block.
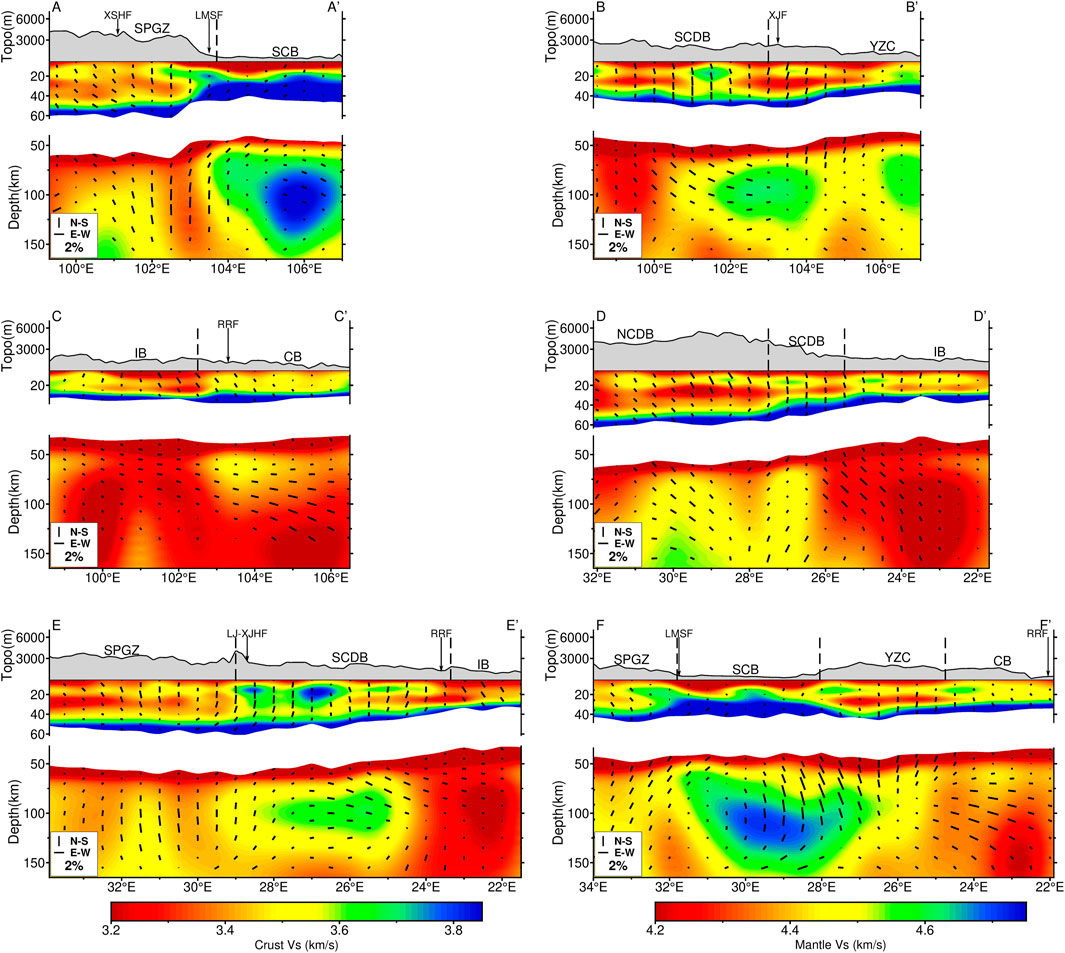
FIGURE 6. Vertical profiles (AA'–FF') of shear wave velocity and azimuthal anisotropy structure in the study area. The locations of the profiles are marked by the black lines in Figure 5B. In each profile, the top part shows the topography along this profile, and the middle and bottom parts show the shear wave velocity and azimuthal anisotropy structure of the crust and mantle, respectively. We separated the crust and mantle according to the Moho depth from He et al. (2014). Dashed lines and black arrows represent the block boundary and faults. The vertical and horizontal bars in the bottom left corner represent the N‒S and E‒W fast directions of the azimuthal anisotropy, respectively.
4 Discussion
4.1 Comparison with shear wave splitting data
Many shear wave splitting results have been applied in the southeastern Tibetan Plateau to understand its lithospheric and asthenospheric deformation (Sun et al., 2012; Huang Z. et al., 2015; Chang et al., 2015; Zheng et al., 2018). The poor vertical resolution of shear wave splitting results makes it difficult to determine the location of the anisotropy source, although it can provide a wide depth range by some methods (e.g., Chevrot, 2000; Chevrot, 2006; Monteiller and Chevrot, 2011). By contrast, the depth-dependent seismic anisotropy inferred from surface wave tomography can provide depth information for the anisotropy source. Here, we used our 3-D shear wave velocity model to calculate the predicted shear wave splitting parameters at different depth ranges (Montagner et al., 2000) and compared them with the observed data.
To analyze the contribution of crustal and upper mantle (<200 km) anisotropy to the shear wave splitting results, we compared the predicted shear wave splitting parameters from the crust and upper mantle (<200 km), respectively, with the observed values (Figures 7–9). The quantitative differences between the predicted and observed data are shown in Supplementary Figures S8–S10. The observed shear wave splitting parameters we compared in the crust are inverted from local events (Zhang and Gao, 2017; Zhang et al., 2018) and Pms phase data (Sun et al., 2012; Cai et al., 2016; Zheng et al., 2018), which are mainly sensitive to crustal anisotropy. The observed data from the XKS phase (Chang et al., 2008; Chang et al., 2015; Chang et al., 2017), representing the integrated effect of anisotropy along the ray path, were compared with the upper mantle anisotropy (<200 km) inferred from surface wave tomography. The predicted and observed parameters from local events and Pms phase data show a certain coherence in the crust (Figure 7; Figures 8A, B). However, the predicted anisotropy in the upper layer (0–15 km, Figure 7A) is smaller than that in the lower layer (15-Moho, Figure 7B) of the crust, which agrees with the splitting parameters based on two-layered model analysis in the crust (Han et al., 2020). These results also indicate different deformation mechanisms between the upper and mid-lower crust. The deformation in the mid-lower crust is more intense and is the main anisotropy source of the observed crustal shear wave splitting. The predicted crustal shear wave splitting parameters show large differences from the observed parameters based on XKS phase data (Figures 8A–D), which suggests different deformation patterns in the crust and upper mantle.
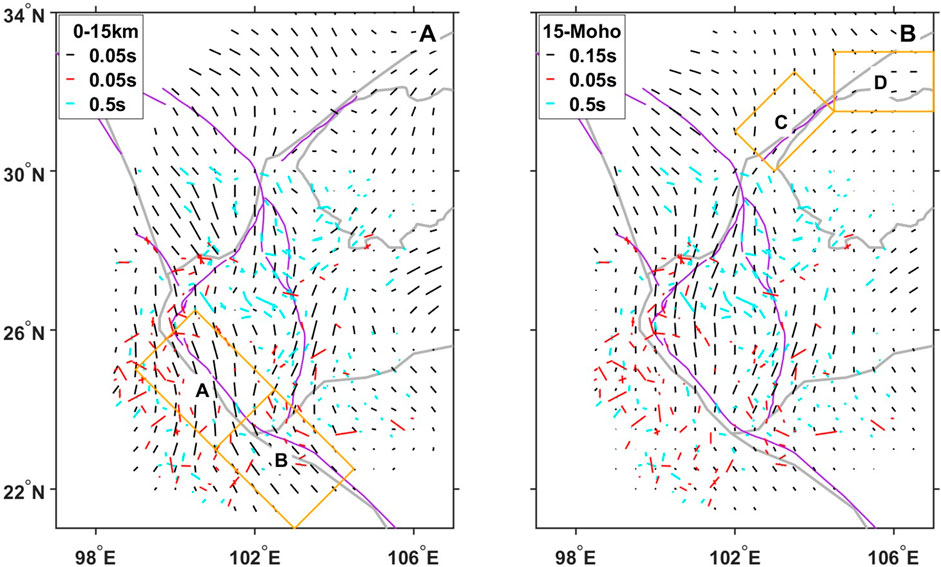
FIGURE 7. The comparison between the predicted shear wave splitting parameters (black bars) from our velocity model and the observed shear wave splitting parameters from local events (red bars) and Pms phase data (light blue bars) at upper crust (A) and mid-lower crust (B). The purple and gray lines represent the main fault and block boundary, respectively. The Moho depth is from He et al. (2014).
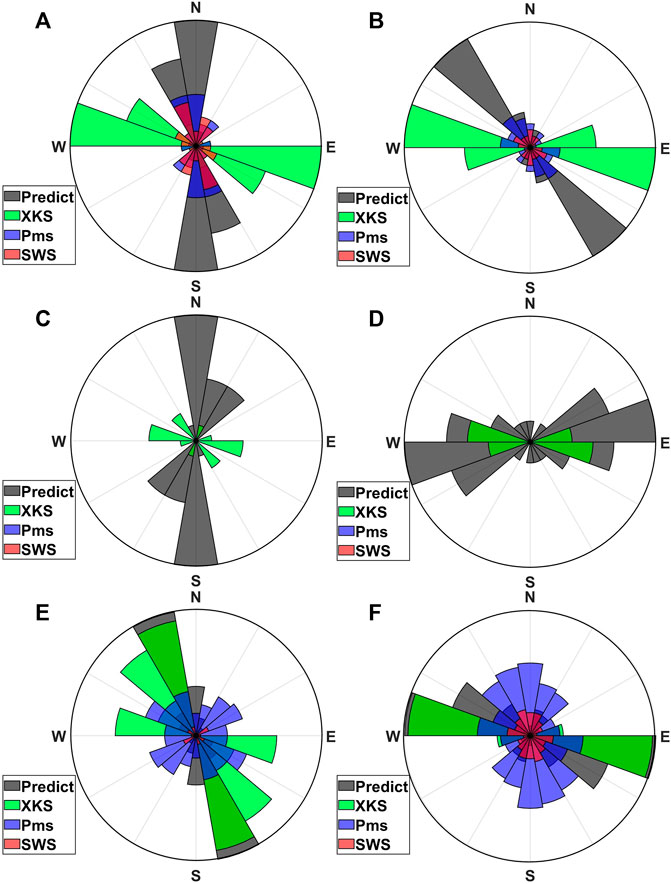
FIGURE 8. Rose diagram of the fast axis direction (A–F) of the predicted (black bars) and the observed data from XKS phase data (green bars), Pms phase data (blue bars) and local events (red bars) at different areas marked in Figure 7 and Figure 9 by orange boxes. The depth range of the predicted fast axis direction is the same as the corresponding depth range of Figure 7 and Figure 9.
Within the upper mantle (Moho-125 km), the predicted splitting parameters are consistent with the observed splitting parameters based on XKS phase (Figures 8E, F; Figures 9A, B). However, the predicted and observed splitting parameters are quite different in the Yangtze Craton near the lithosphere-asthenosphere boundary (125–185 km, Figure 9C), which suggests that the deeper part of the upper mantle (125–185 km) may experience other complicated deformation processes. Overall, the predicted fast axis direction is similar to the observed teleseismic shear wave splitting results in most of the study area, and the magnitude of anisotropy is also comparable (Figure 9D). These results suggest that the main anisotropy source above 185 km depth is from the lithospheric mantle north of 26°N and the asthenosphere south of 26°N. The azimuthal anisotropy in the upper mantle (<200 km) has a significant contribution to the observed shear wave splitting parameters based on the XKS phase. However, considering the depth range in our study and the approximations when we calculate the predicted shear wave splitting data, further study about the contribution of the anisotropy source in a deeper depth range is needed.
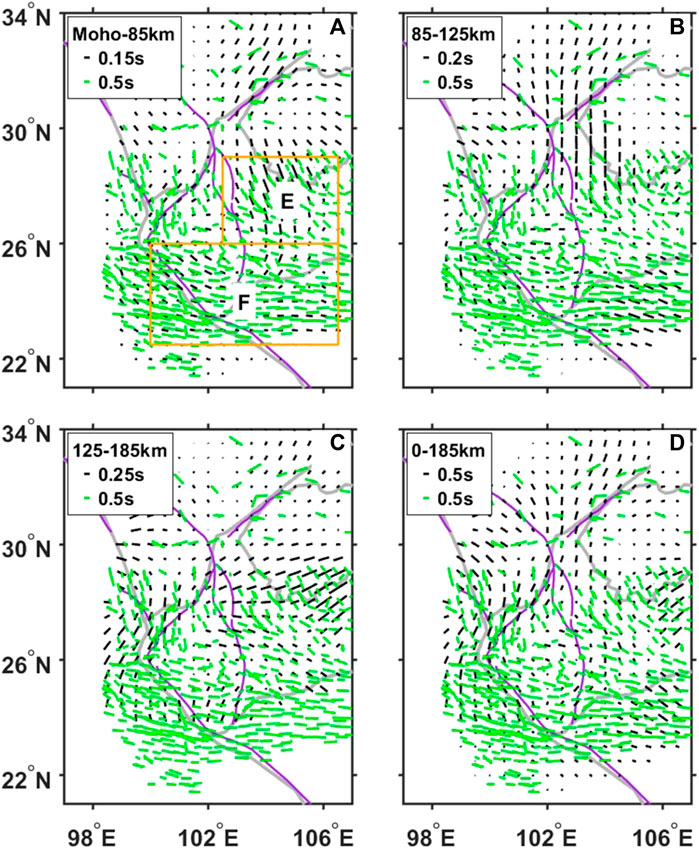
FIGURE 9. Same as Figure 7, but green bars represent the observed shear wave splitting parameters from the XKS phase data in (A–D).
4.2 The deformation mechanism in the crust
Our 3-D isotropic shear wave velocity and azimuthal anisotropy structure show evident variation with respect to depth. The fast axis is oriented NW‒SE in the Songpan-Ganzi Terrane and North Chuandian Block, which is mainly due to the southeastward extrusion of the crust in this area. As a result, GPS observations indicate that the traces of the Lijiang-Xiaojinhe Fault and Red River Fault have been distorted by crustal movements (Gan et al., 2022). Our results show distinct patterns of the fast axis direction along the Red River Fault (Figure 7A; Figures 8A, B). The fast axis is nearly N‒S in the northwest part of the Red River Fault (Figure 8A), which is mainly caused by southward crustal movement. However, the fast axis changes to the NW‒SE direction in the southeastern part of the Red River Fault within our study area (Figure 8B), which probably represents the fossil anisotropy reformed by the episodic strike-slip of the fault in the Cenozoic. The shear wave splitting parameters from local events (Zhang and Gao, 2017; Zhang et al., 2018) and the Pms phase (Sun et al., 2012; Cai et al., 2016; Zheng et al., 2018) also show similar results (Figures 8A, B). The central area of the South Chuandian Block shows high velocity and weak anisotropy (Figure 10F), but the azimuthal anisotropy is strong and shows a fault-parallel fast axis direction in the boundary of the South Chuandian Block (Figure 10C, F), which indicates that the deformation within the upper crust is concentrated at the block boundary and faults.
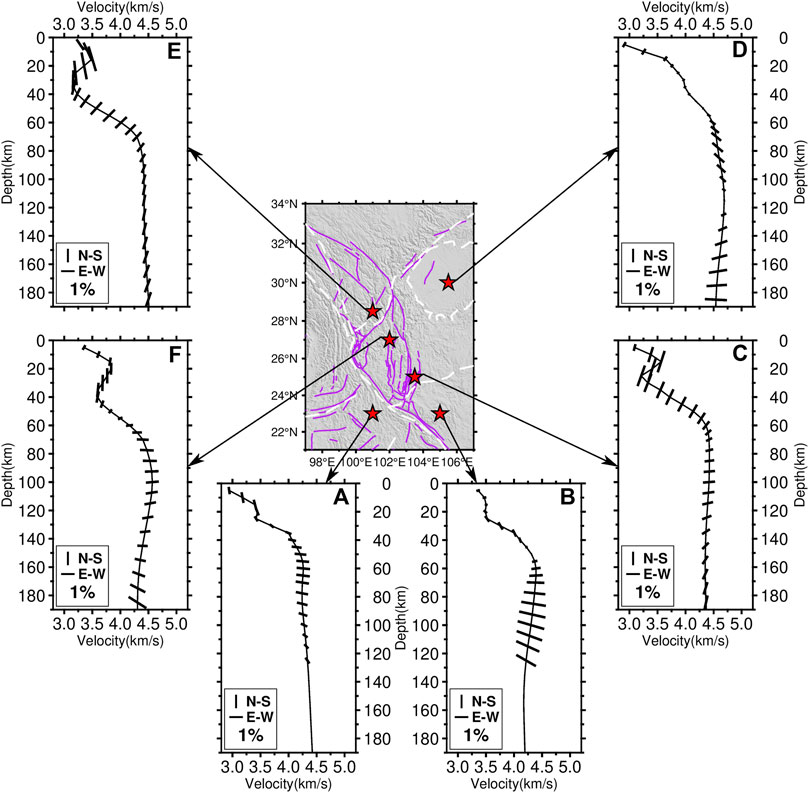
FIGURE 10. Shear wave velocity and azimuthal anisotropy varied with depth at six locations (A–F) marked by the red stars in the study area. Azimuthal anisotropy is not shown below 135 km depth in (A) and (B) due to lack of resolution south of 24°N.
In the mid-lower crust (approximately 25–40 km depth, Figures 5B, C), two obvious low-velocity anomalies appear in the Songpan-Ganzi Terrane and east of the Xiaojiang Fault. Previous studies (Yao et al., 2008; Yao et al., 2010; Bao et al., 2015; Chen et al., 2016; Qiao et al., 2018) have also observed two low-velocity anomalies and attributed them to the extrusion of viscous material flows from the central Tibetan Plateau. However, there is a high-velocity body in the South Chuandian Block that separates these two low-velocity anomalies. The high-velocity body in the South Chuandian Block is also confirmed by other data and methods (Bao et al., 2015; Qiao et al., 2018; Dai et al., 2020; Li et al., 2020; Yang et al., 2020; Han et al., 2022). This high-velocity body is located in the inner zone of the ELIP and may be at the lithosphere scale (Profiles BB’ and EE’ in Figure 6), which is speculated to be related to magma intrusion and underplating when the ELIP formed (Chen et al., 2015; Xu et al., 2015). The fast axis is nearly in the N‒S direction west of the South Chuandian Block but suddenly becomes weak in the inner zone of the ELIP and agrees well with the teleseismic shear-wave splitting result (Li et al., 2021). The high-velocity and weak azimuthal anisotropy feature in the inner zone of the ELIP is also confirmed by a new surface wave tomography result based on temporary stations (Han et al., 2022). The weak anisotropy in the northeast corner of the South Chuandian Block further demonstrates the resistance effect of the ELIP and the disconnection of the two low-velocity anomalies in this area. The obstruction of a high-velocity anomaly within the ELIP may cause strong deformation localized along the margins of the South Chuandian Block and then transfer further to the XJF (Han et al., 2022). Receiver function results (Wang et al., 2017) suggest that the crust thickened near the XJF. Therefore, we prefer that the low-velocity anomaly east of the XJF is most likely caused by in situ plastic deformation and/or partial melting (Zhang et al., 2020) due to crustal thickening and strong deformation. The fast axis direction in these two low-velocity anomalies is subparallel to the trend of low-velocity anomalies (Figures 10C, F) and consistent with the local shear wave splitting results (Zhang and Gao, 2017; Zhang et al., 2018) and receiver functions (Sun et al., 2012; Cai et al., 2016; Zheng et al., 2018) (Figure 7B). The fast axis direction may indicate the migration direction of the low-velocity material. Notably, the fast axis is bifurcated near the Sichuan Basin; it is nearly N‒S in the northwest margin of the Sichuan Basin but nearly E‒W in the north margin (Figure 8C, D). This anisotropy pattern is also confirmed by other high-resolution surface wave tomography results (Zhang et al., 2022) and demonstrates the obstruction of the rigid Sichuan Basin for low-velocity material migration.
At 40 km depth, most areas are already in the mantle except the Chuandian Block and Songpan-Ganzi Terrane due to crustal thickening (Wang et al., 2017; Cheng et al., 2022). The azimuthal anisotropy is very strong in the low-velocity anomaly areas but becomes weak in the high-velocity anomaly areas (Figure 5C), which suggests that the lower crustal deformation pattern in the Chuandian Block and Songpan-Ganzi Terrane is still controlled by the deformation and/or migration of low velocities but obstructed by the rigid uppermost mantle in other areas.
Our azimuthal anisotropy pattern suggests different deformation mechanisms within the upper and mid-lower crust. The fast axis direction near the Lijiang-Xiaojinhe Fault, for instance, is almost perpendicular to the fault in the upper crust but soon changes to subparallel to the fault in the mid-lower crust (Figure 10E). Therefore, we prefer that the upper crustal azimuthal anisotropy in the southeastern Tibetan Plateau is dominated by large fault systems, and therefore, the magnitude of anisotropy is often weak in the center of blocks (Figures 10A–C), which agrees well with the main features of the rigid block extrusion model (Tapponnier et al., 1982; Tapponnier et al., 2001). In the mid-lower crust, the magnitude of azimuthal anisotropy is very strong in the two low-velocity anomalies but very weak in the high-velocity anomaly, and the faults are the main boundary of the velocity and anisotropy pattern. Therefore, the mid-lower crust in the southeastern Tibetan Plateau is more likely to undergo significant ductile deformation (Royden et al., 1997; Clark and Royden, 2000; Beaumont et al., 2001), and the migration of low-velocity material flows is bounded by faults.
4.3 The deformation mechanism in the upper mantle
Our results reveal an anisotropy pattern in the upper mantle (<200 km) that is distinct from that in the crust. At depths of 40–55 km, the velocity model mainly represents the uppermost mantle in the Yangtze Craton, Cathaysia Block, and Indochina Block. The azimuthal anisotropy is nearly N‒S in the Yangtze Craton but very weak in the Indochina Block and Cathaysia Block, which indicates a rigid uppermost mantle and lack of deformation in the last two blocks. Below 70 km depth, the whole study area is in the upper mantle, and the anisotropy pattern is divided into two parts. North of 26°N, the fast axis is in the NW‒SE or nearly N‒S direction with a high shear wave velocity anomaly, but the direction rapidly changes to the E‒W direction south of 26°N with a significant large-scale low-velocity anomaly (Figures 5E–I; Figures 10A, B). The anisotropy pattern in the upper mantle is in good agreement with the XKS splitting results (Chang et al., 2008; Huang Z. et al., 2015; Chang et al., 2015) (Figure 9). In the Yangtze Craton, the fast axis is oriented nearly N‒S with a very high-velocity anomaly. Considering that the lithospheric thickness of the Yangtze Craton is more than 120 km and can even reach approximately 200 km under the Sichuan Basin (Pasyanos et al., 2014; Yang et al., 2017), we prefer it to reflect the fossil anisotropy of the rigid lithosphere.
Receiver function results (Hu et al., 2012; Yang et al., 2017) suggest that the lithospheric thickness has significantly thinned (<100 km) in the Indochina Block and Cathaysia Block. Lithospheric thinning may be caused by lithospheric delamination (Chung et al., 1997; Feng et al., 2022) and rollback of the Indian Plate (Li et al., 2008; Lei and Zhao, 2016; Huang et al., 2019). Then, asthenospheric upwelling and dehydration of the subducting plate caused the large-scale low-velocity anomaly in this area. However, we note that the anisotropy weakens with increasing depth in the Indochina Block (Figure 10A). We speculate that the variation in the anisotropy pattern in the upper mantle (<200 km) beneath the Indochina Block is mainly due to the upwelling of hot materials. The upwelling materials may form vertical mineral alignment and cause weak azimuthal anisotropy (Huang and Chevrot, 2021). After it reaches the basement of the lithosphere (approximately 70 km–100 km depth), it deflects transversely due to the resistance of rigid lithosphere and forms the E‒W fast axis direction (Wu et al., 2019).
5 Conclusion
We used 7,441 broadband (5–150 s) phase velocity dispersion curves extracted from 132 permanent stations to invert the 3-D isotropic shear wave velocity model and azimuthal anisotropy in the southeastern Tibetan Plateau. Our 3-D model shows dramatic lateral and vertical variations in the isotropic shear wave velocity and azimuthal anisotropy patterns. Together with previous studies, we obtained the following major conclusions.
1. The upper crust is relatively rigid and extruded along the major strike-slip faults (Figure 11A), while two low-velocity channels exist in the mid-lower crust, and viscous material may facilitate regional deformation (Figure 11B).
2. The azimuthal anisotropy is probably the fossil anisotropy in the upper mantle of the YZC. The lithosphere has significantly thinned beneath the IB and CB. Then, the upwelling of hot asthenospheric materials and its lateral flows when meeting the rigid lithosphere formed weak anisotropy in the deeper part and a nearly E‒W fast axis in the shallow part (Figure 11C).
3. The predicted shear wave splitting parameters show good coherence with the observed parameters in the depth range from the Moho to 125 km (Figures 9A, B). This result suggests that the anisotropy in the lithospheric mantle in this area has a significant contribution to the observed teleseismic shear wave splitting.
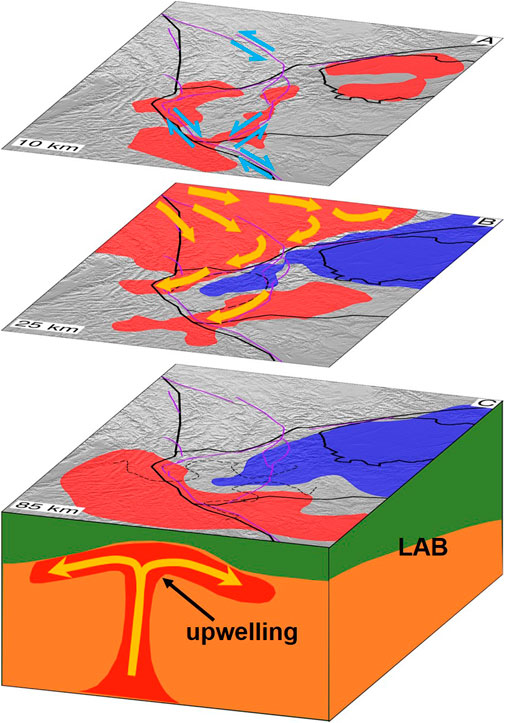
FIGURE 11. Schematic model for the possible deformation mechanisms at different depth ranges (A–C) in the southeastern Tibetan Plateau. Thick colored arrows represent the possible movement direction of blocks (blue) or materials (yellow). Red and blue areas mark the low- and high-velocity bodies, respectively. Black dashed lines in (B) and (C) mark the inner zone of the ELIP and lithospheric thickness less than 100 km, respectively. Purple and black lines represent the main faults and blocks.
Data availability statement
The original contributions presented in the study are included in the article/Supplementary Material, further inquiries can be directed to the corresponding authors.
Author contributions
ZZ: conceptualization, data curation, writing—original draft, writing—review and editing, validation and visualization. JF: conceptualization, writing—review and editing, validation, supervision and funding acquisition. HY: conceptualization, methodology, writing—review and editing, validation, supervision, funding acquisition and project administration. All authors contributed to the article and approved the submitted version.
Funding
This work is supported by the Special Fund of Key Laboratory of Earthquake Prediction, CEA (2021IEF0103), the National Natural Science Foundation of China (42125401), and the National Key R&D Program of China (2021YFC3000600).
Acknowledgments
The authors acknowledge Ph.D. student Ying Li from the Institute of Earthquake Forecasting, China Earthquake Administration, for providing the shear wave splitting data for comparison with our results. The waveform data used in this study were provided by Data Management Centre of China National Seismic Network, Institute of Geophysics, China Earthquake Administration (doi:10.11998/SeisDmc/SN, http://www.seisdmc.ac.cn).
Conflict of interest
The authors declare that the research was conducted in the absence of any commercial or financial relationships that could be construed as a potential conflict of interest.
Publisher’s note
All claims expressed in this article are solely those of the authors and do not necessarily represent those of their affiliated organizations, or those of the publisher, the editors and the reviewers. Any product that may be evaluated in this article, or claim that may be made by its manufacturer, is not guaranteed or endorsed by the publisher.
Supplementary material
The Supplementary Material for this article can be found online at: https://www.frontiersin.org/articles/10.3389/feart.2023.1095609/full#supplementary-material
References
Bai, D., Unsworth, M. J., Meju, M. A., Ma, X., Teng, J., Kong, X., et al. (2010). Crustal deformation of the eastern Tibetan plateau revealed by magnetotelluric imaging. Nat. Geosci. 3, 358–362. doi:10.1038/ngeo830
Bao, X., Song, X., Eaton, D. W., Xu, Y., and Chen, H. (2020). Episodic lithospheric deformation in eastern Tibet inferred from seismic anisotropy. Geophys. Res. Lett. 47. doi:10.1029/2019gl085721
Bao, X., Sun, X., Xu, M., Eaton, D. W., Song, X., Wang, L., et al. (2015). Two crustal low-velocity channels beneath SE Tibet revealed by joint inversion of Rayleigh wave dispersion and receiver functions. Earth Planet. Sci. Lett. 415, 16–24. doi:10.1016/j.epsl.2015.01.020
Beaumont, C., Jamieson, R. A., Nguyen, M. H., and Lee, B. (2001). Himalayan tectonics explained by extrusion of a low-viscosity crustal channel coupled to focused surface denudation. Nature 414, 738–742. doi:10.1038/414738a
Burchfiel, B. C., and Chen, Z. (2013). Tectonics of the southeastern Tibetan Plateau and its adjacent foreland. Mem. Geol. Soc. Am. 210, 1–164. doi:10.1130/2012.1210(01
Cai, Y., Wu, J. P., Fang, L. H., Wang, W. L., and Yi, S. (2016). Crustal anisotropy and deformation of the southeastern margin of the Tibetan Plateau revealed by Pms splitting. J. Asian Earth Sci. 121, 120–126. doi:10.1016/j.jseaes.2016.02.005
Chang, L., Ding, Z., Wang, C., and Flesch, L. M. (2017). Vertical coherence of deformation in lithosphere in the NE margin of the Tibetan plateau using GPS and shear-wave splitting data. Tectonophysics 699, 93–101. doi:10.1016/j.tecto.2017.01.025
Chang, L., Ding, Z., and Wang, C. (2015). Upper mantle anisotropy beneath the southern segment of North-South tectonic belt, China. Chin. J. Geophys. 58, 4052–4067. doi:10.6038/cjg20151114
Chang, L., Wang, C., and Ding, Z. (2008). Seismic anisotropy of upper mantle in Sichuan and adjacent regions. Sci. China Ser. D Earth Sci. 51, 1683–1693. doi:10.1007/s11430-008-0147-8
Chen, H. P., Zhu, L. B., and Su, Y. J. (2016). Low velocity crustal flow and crust-mantle coupling mechanism in Yunnan, SE Tibet, revealed by 3D S-wave velocity and azimuthal anisotropy. Tectonophysics 685, 8–20. doi:10.1016/j.tecto.2016.07.007
Chen, Y., Xu, Y. G., Xu, T., Si, S. K., Liang, X. F., Tian, X. B., et al. (2015). Magmatic underplating and crustal growth in the Emeishan Large Igneous Province, SW China, revealed by a passive seismic experiment. Earth Planet. Sci. Lett. 432, 103–114. doi:10.1016/j.epsl.2015.09.048
Chen, Y., Zhang, Z., Sun, C., and Badal, J. (2013). Crustal anisotropy from Moho converted Ps wave splitting analysis and geodynamic implications beneath the eastern margin of Tibet and surrounding regions. Gondwana Res. 24, 946–957. doi:10.1016/j.gr.2012.04.003
Chen, Z., Burchfiel, B. C., Liu, Y., King, R. W., Royden, L. H., Tang, W., et al. (2000). Global Positioning System measurements from eastern Tibet and their implications for India/Eurasia intercontinental deformation. J. Geophys. Research-Solid Earth 105, 16215–16227. doi:10.1029/2000jb900092
Cheng, S. H., Xiao, X., Wu, J. P., Wang, W. L., Sun, L., Wang, X. X., et al. (2022). Crustal thickness and Vp/Vs variation beneath continental China revealed by receiver function analysis. Geophys. J. Int. 228, 1731–1749. doi:10.1093/gji/ggab433
Chevrot, S. (2006). Finite-frequency vectorial tomography: A new method for high-resolution imaging of upper mantle anisotropy. Geophys. J. Int. 165, 641–657. doi:10.1111/j.1365-246X.2006.02982.x
Chevrot, S. (2000). Multichannel analysis of shear wave splitting. J. Geophys. Research-Solid Earth 105, 21579–21590. doi:10.1029/2000jb900199
Chung, S.-L., Lee, T.-Y., Lo, C.-H., Wang, P.-L., Chen, C.-Y., Yem, N. T., et al. (1997). Intraplate extension prior to continental extrusion along the Ailao Shan-Red River shear zone. Geology 25, 311–314. doi:10.1130/0091-7613(1997)025<0311:ieptce>2.3.co;2
Chung, S. L., and Jahn, B. M. (1995). Plume-lithosphere interaction in generation of the Emeishan flood basalts at the Permian-Triassic boundary. Geology 23, 889–892. doi:10.1130/0091-7613(1995)023<0889:Pliigo>2.3.Co;2
Clark, M. K., and Royden, L. H. (2000). Topographic ooze: Building the eastern margin of Tibet by lower crustal flow. Geology 28, 703–706. doi:10.1130/0091-7613(2000)028<0703:tobtem>2.3.co;2
Crampin, S. (1981). A review of wave motion in anisotropic and cracked elastic-media. Wave Motion 3, 343–391. doi:10.1016/0165-2125(81)90026-3
Dai, A., Tang, C. C., Liu, L., and Xu, R. (2020). Seismic attenuation tomography in southwestern China: Insight into the evolution of crustal flow in the Tibetan Plateau. Tectonophysics 792, 228589. doi:10.1016/j.tecto.2020.228589
England, P., and Houseman, G. (1986). Finite strain calculations of continental deformation: 2. Comparison with the India-asia collision zone. J. Geophys. Research-Solid Earth Planets 91, 3664–3676. doi:10.1029/JB091iB03p03664
Fang, H., Yao, H., Zhang, H., Huang, Y.-C., and van der Hilst, R. D. (2015). Direct inversion of surface wave dispersion for three-dimensional shallow crustal structure based on ray tracing: Methodology and application. Geophys. J. Int. 201, 1251–1263. doi:10.1093/gji/ggv080
Feng, J. K., Yao, H. J., Chen, L., and Wang, W. T. (2022). Massive lithospheric delamination in southeastern Tibet facilitating continental extrusion. Natl. Sci. Rev. 9, nwab174. doi:10.1093/nsr/nwab174
Gan, W., Molnar, P., Zhang, P., Xiao, G., Liang, S., Zhang, K., et al. (2022). Initiation of clockwise rotation and eastward transport of southeastern Tibet inferred from deflected fault traces and GPS observations. Geol. Soc. Am. Bull. 134, 1129–1142. doi:10.1130/b36069.1
Han, C., Huang, Z., Hao, S., Wang, L., Xu, M., and Hammond, J. O. S., (2022). Restricted lithospheric extrusion in the SE Tibetan Plateau: Evidence from anisotropic Rayleigh-wave tomography. Earth Planet. Sci. Lett., 598, 117837. doi:10.1016/j.epsl.2022.117837
Han, C. R., Xu, M. J., Huang, Z. C., Wang, L. S., Xu, M. J., Mi, N., et al. (2020). Layered crustal anisotropy and deformation in the SE Tibetan plateau revealed by Markov-Chain-Monte-Carlo inversion of receiver functions. Phys. Earth Planet. Interiors 306, 106522. doi:10.1016/j.pepi.2020.106522
He, B., Xu, Y. G., Chung, S. L., Xiao, L., and Wang, Y. (2003). Sedimentary evidence for a rapid, kilometer-scale crustal doming prior to the eruption of the Emeishan flood basalts. Earth Planet. Sci. Lett. 213, 391–405. doi:10.1016/s0012-821x(03)00323-6
He, R., Shang, X., Yu, C., Zhang, H., and Van der Hilst, R. D. (2014). A unified map of Moho depth and Vp/Vs ratio of continental China by receiver function analysis. Geophys. J. Int. 199, 1910–1918. doi:10.1093/gji/ggu365
Hu, J. F., Yang, H. Y., Xu, X. Q., Wen, L. M., and Li, G. Q. (2012). Lithospheric structure and crust-mantle decoupling in the southeast edge of the Tibetan Plateau. Gondwana Res. 22, 1060–1067. doi:10.1016/j.gr.2012.01.003
Huang, Z. C., and Chevrot, S. (2021). Mantle dynamics in the SE Tibetan Plateau revealed by teleseismic shear-wave splitting analysis. Phys. Earth Planet. Interiors 313, 106687. doi:10.1016/j.pepi.2021.106687
Huang, Z. C., Wang, L. S., Xu, M. J., Zhao, D. P., Mi, N., and Yu, D. Y. (2019). P and S Wave tomography beneath the SE Tibetan plateau: Evidence for lithospheric delamination. J. Geophys. Research-Solid Earth 124, 10292–10308. doi:10.1029/2019jb017430
Huang, Z. C., Wang, P., Xu, M. J., Wang, L. S., Ding, Z. F., Wu, Y., et al. (2015b). Mantle structure and dynamics beneath SE Tibet revealed by new seismic images. Earth Planet. Sci. Lett. 411, 100–111. doi:10.1016/j.epsl.2014.11.040
Huang, Z., Wang, L., Xu, M., Ding, Z., Wu, Y., Wang, P., et al. (2015a). Teleseismic shear-wave splitting in SE Tibet: Insight into complex crust and upper-mantle deformation. Earth Planet. Sci. Lett. 432, 354–362. doi:10.1016/j.epsl.2015.10.027
Kennett, B. L., Engdahl, E., and Buland, R. (1995). Constraints on seismic velocities in the Earth from traveltimes. Geophys. J. Int. 122, 108–124. doi:10.1111/j.1365-246x.1995.tb03540.x
King, R. W., Shen, F., Burchfiel, B. C., Royden, L. H., Wang, E. C., Chen, Z. L., et al. (1997). Geodetic measurement of crustal motion in southwest China. Geology 25, 179–182. doi:10.1130/0091-7613(1997)025<0179:Gmocmi>2.3.Co;2
Kong, F., Wu, J., Liu, K. H., and Gao, S. S. (2016). Crustal anisotropy and ductile flow beneath the eastern Tibetan Plateau and adjacent areas. Earth Planet. Sci. Lett. 442, 72–79. doi:10.1016/j.epsl.2016.03.003
Lei, J., and Zhao, D. (2016). Teleseismic P-wave tomography and mantle dynamics beneath Eastern Tibet. Geochem. Geophys. Geosystems 17, 1861–1884. doi:10.1002/2016gc006262
Lev, E., Long, M. D., and van der Hilst, R. D. (2006). Seismic anisotropy in Eastern Tibet from shear wave splitting reveals changes in lithospheric deformation. Earth Planet. Sci. Lett. 251, 293–304. doi:10.1016/j.epsl.2006.09.018
Li, C., Van der Hilst, R. D., Meltzer, A. S., and Engdahl, E. R. (2008). Subduction of the Indian lithosphere beneath the Tibetan Plateau and Burma. Earth Planet. Sci. Lett. 274, 157–168. doi:10.1016/j.epsl.2008.07.016
Li, W., Chen, Y., Liang, X., and Xu, Y.-G. (2021). Lateral seismic anisotropy variations record interaction between Tibetan mantle flow and plume-strengthened Yangtze Craton. J. Geophys. Research-Solid Earth 126. doi:10.1029/2020jb020841
Li, X., Bai, D., Ma, X., Chen, Y., Varentsov, I. M., Xue, G., et al. (2019). Electrical resistivity structure of the Xiaojiang strike-slip fault system (SW China) and its tectonic implications. J. Asian Earth Sci. 176, 57–67. doi:10.1016/j.jseaes.2019.01.031
Li, X., Ma, X. B., Chen, Y., Xue, S., Varentsov, I. M., and Bai, D. H. (2020). A plume-modified lithospheric barrier to the southeastward flow of partially molten Tibetan crust inferred from magnetotelluric data. Earth Planet. Sci. Lett. 548, 116493. doi:10.1016/j.epsl.2020.116493
Liang, C., Liu, Z., Hua, Q., Wang, L., Jiang, N., and Wu, J. (2020). The 3D seismic azimuthal anisotropies and velocities in the eastern Tibetan plateau extracted by an azimuth-dependent dispersion curve inversion method. Tectonics 39, e2019TC005747. doi:10.1029/2019tc005747
Liu, C., Yao, H., Yang, H.-Y., Shen, W., Fang, H., Hu, S., et al. (2019). Direct inversion for three-dimensional shear wave speed azimuthal anisotropy based on surface wave ray tracing: Methodology and application to yunnan, southwest China. J. Geophys. Res. 124, 11394–11413. doi:10.1029/2018jb016920
Lo, C. H., Chung, S. L., Lee, T. Y., and Wu, G. Y. (2002). Age of the Emeishan flood magmatism and relations to Permian-Triassic boundary events. Earth Planet. Sci. Lett. 198, 449–458. doi:10.1016/s0012-821x(02)00535-6
Mainprice, D., Tommasi, A., Couvy, H., Cordier, P., and Frost, D. J. (2005). Pressure sensitivity of olivine slip systems and seismic anisotropy of Earth's upper mantle. Nature 433, 731–733. doi:10.1038/nature03266
Molnar, P., and Tapponnier, P. (1975). Cenozoic Tectonics of Asia: Effects of a Continental Collision: Features of recent continental tectonics in Asia can be interpreted as results of the India-Eurasia collision. Science 189, 419–426. doi:10.1126/science.189.4201.419
Montagner, J. P., Griot-Pommera, D. A., and Lave, J. (2000). How to relate body wave and surface wave anisotropy? J. Geophys. Research-Solid Earth 105, 19015–19027. doi:10.1029/2000jb900015
Monteiller, V., and Chevrot, S. (2011). High-resolution imaging of the deep anisotropic structure of the San Andreas Fault system beneath southern California. Geophys. J. Int. 186, 418–446. doi:10.1111/j.1365-246X.2011.05082.x
Pasyanos, M. E., Masters, T. G., Laske, G., and Ma, Z. T. (2014). LITHO1.0: An updated crust and lithospheric model of the Earth. J. Geophys. Research-Solid Earth 119, 2153–2173. doi:10.1002/2013jb010626
Qiao, L., Yao, H., Lai, Y. C., Huang, B. S., and Zhang, P. (2018). Crustal structure of southwest China and northern Vietnam from ambient noise tomography: Implication for the large-scale material transport model in SE Tibet. Tectonics 37, 1492–1506. doi:10.1029/2018tc004957
Rawlinson, N., and Sambridge, M. (2004). Wave front evolution in strongly heterogeneous layered media using the fast marching method. Geophys. J. Int. 156, 631–647. doi:10.1111/j.1365-246X.2004.02153.x
Rowley, D. B. (1996). Age of initiation of collision between India and asia: A review of stratigraphic data. Earth Planet. Sci. Lett. 145, 1–13. doi:10.1016/s0012-821x(96)00201-4
Royden, L. H., Burchfiel, B. C., King, R. W., Wang, E., Chen, Z. L., Shen, F., et al. (1997). Surface deformation and lower crustal flow in eastern Tibet. Science 276, 788–790. doi:10.1126/science.276.5313.788
Savage, M. K. (1999). Seismic anisotropy and mantle deformation: What have we learned from shear wave splitting? Rev. Geophys. 37, 65–106. doi:10.1029/98rg02075
Shi, Y., Gao, Y., Su, Y., and Wang, Q. (2012). Shear-wave splitting beneath yunnan area of southwest China. Earthq. Sci. 25, 25–34. doi:10.1007/s11589-012-0828-4
Sun, Y., Niu, F. L., Liu, H. F., Chen, Y. L., and Liu, J. X. (2012). Crustal structure and deformation of the SE Tibetan plateau revealed by receiver function data. Earth Planet. Sci. Lett. 349, 186–197. doi:10.1016/j.epsl.2012.07.007
Tapponnier, P., Peltzer, G., Ledain, A. Y., Armijo, R., and Cobbold, P. (1982). Propagating extrusion tectonics in asia: New insights from simple experiments with plasticine. Geology 10, 611–616. doi:10.1130/0091-7613(1982)10<611:Petian>2.0.Co;2
Tapponnier, P., Xu, Z. Q., Roger, F., Meyer, B., Arnaud, N., Wittlinger, G., et al. (2001). Oblique stepwise rise and growth of the Tibet plateau. Science 294, 1671–1677. doi:10.1126/science.105978
Thomsen, L. (2014). Understanding seismic anisotropy in exploration and exploitation. Soc. Explor. Geophys. doi:10.1190/1.9781560803270
Wang, M., and Shen, Z. K. (2020). Present-day crustal deformation of continental China derived from GPS and its tectonic implications. J. Geophys. Research-Solid Earth 125. doi:10.1029/2019jb018774
Wang, W., Wu, J., Fang, L., Lai, G., and Cai, Y. (2017). Crustal thickness and Poisson's ratio in southwest China based on data from dense seismic arrays. J. Geophys. Res. 122, 7219–7235. doi:10.1002/2017jb013978
Wei, W., Zhao, D., and Xu, J. (2013). P-wave anisotropic tomography in Southeast Tibet: New insight into the lower crustal flow and seismotectonics. Phys. Earth Planet. Interiors 222, 47–57. doi:10.1016/j.pepi.2013.07.002
Weiss, T., Siegesmund, S., Rabbel, W., Bohlen, T., and Pohl, M. (1999). Seismic velocities and anisotropy of the lower continental crust: A review. Pure Appl. Geophys. 156, 97–122. doi:10.1007/s000240050291
Wu, T., Zhang, S., Li, M., Hong, M., and Hua, Y. (2019). Complex deformation within the crust and upper mantle beneath SE Tibet revealed by anisotropic Rayleigh wave tomography. Phys. Earth Planet. Interiors 286, 165–178. doi:10.1016/j.pepi.2018.12.002
Xu, T., Zhang, Z., Liu, B., Chen, Y., Zhang, M., Tian, X., et al. (2015). Crustal velocity structure in the Emeishan large igneous province and evidence of the Permian mantle plume activity. Sci. China Earth Sci. 58, 1133–1147. doi:10.1007/s11430-015-5094-6
Xu, Y. G., Chung, S. L., Jahn, B. M., and Wu, G. Y. (2001). Petrologic and geochemical constraints on the petrogenesis of Permian-Triassic Emeishan flood basalts in southwestern China. Lithos 58, 145–168. doi:10.1016/s0024-4937(01)00055-x
Xu, Y. G., He, B., Chung, S. L., Menzies, M. A., and Frey, F. A. (2004). Geologic, geochemical, and geophysical consequences of plume involvement in the Emeishan flood-basalt province. Geology 32, 917–920. doi:10.1130/g20602.1
Yang, H., Peng, H., and Hu, J. (2017). The lithospheric structure beneath southeast Tibet revealed by P and S receiver functions. J. Asian Earth Sci. 138, 62–71. doi:10.1016/j.jseaes.2017.02.001
Yang, Y., Yao, H., Wu, H., Zhang, P., and Wang, M. (2020). A new crustal shear-velocity model in Southwest China from joint seismological inversion and its implications for regional crustal dynamics. Geophys. J. Int. 220, 1379–1393.
Yao, H., Beghein, C., and Van Der Hilst, R. D. (2008). Surface wave array tomography in SE Tibet from ambient seismic noise and two-station analysis-II. Crustal and upper-mantle structure. Geophys. J. Int. 173, 205–219. doi:10.1111/j.1365-246x.2007.03696.x
Yao, H. J., and van der Hilst, R. D. (2009). Analysis of ambient noise energy distribution and phase velocity bias in ambient noise tomography, with application to SE Tibet. Geophys. J. Int. 179, 1113–1132. doi:10.1111/j.1365-246X.2009.04329.x
Yao, H., van der Hilst, R. D., and Montagner, J.-P. (2010). Heterogeneity and anisotropy of the lithosphere of SE Tibet from surface wave array tomography. J. Geophys. Research-Solid Earth 115, B12307. doi:10.1029/2009jb007142
Zhang, B., Zhang, S. X., Wu, T. F., and Hua, Y. J. (2018). Upper crustal anisotropy from local shear-wave splitting and crust-mantle coupling of Yunnan, SE margin of Tibetan Plateau. Geodesy Geodyn. 9, 302–311. doi:10.1016/j.geog.2018.01.004
Zhang, P. Z., Shen, Z., Wang, M., Gan, W. J., Burgmann, R., Molnar, P., et al. (2004). Continuous deformation of the Tibetan Plateau from global positioning system data. Geology 32, 809–812. doi:10.1130/g20554.1
Zhang, Y., and Gao, Y. (2017). The characteristics of crustal shear-wave splitting in North-South seismic zone revealed by near field recordings of two observation periods of ChinArray. Chin. J. Geophysics-Chinese Ed. 60, 2181–2199. doi:10.6038/cjg20170613
Zhang, Z., Yao, H., Wang, W., and Liu, C. (2022). 3-D crustal azimuthal anisotropy reveals multi-stage deformation processes of the Sichuan Basin and its adjacent area, SW China. J. Geophys. Research-Solid Earth 127. doi:10.1029/2021jb023289
Zhang, Z., Yao, H., and Yang, Y. (2020). Shear wave velocity structure of the crust and upper mantle in Southeastern Tibet and its geodynamic implications. Sci. China Earth Sci. 63, 1278–1293. doi:10.1007/s11430-020-9625-3
Zhao, L. F., Xie, X. B., He, J. K., Tian, X. B., and Yao, Z. X. (2013). Crustal flow pattern beneath the Tibetan Plateau constrained by regional Lg-wave Q tomography. Earth Planet. Sci. Lett. 383, 113–122. doi:10.1016/j.epsl.2013.09.038
Zheng, T., Ding, Z., Ning, J., Chang, L., Wang, X., Kong, F., et al. (2018). Crustal azimuthal anisotropy beneath the southeastern Tibetan Plateau and its geodynamic implications. J. Geophys. Research-Solid Earth 123, 9733–9749. doi:10.1029/2018jb015995
Keywords: southeastern Tibetan Plateau, surface wave tomography, azimuthal anisotropy, asthenospheric upwelling, deformation modes
Citation: Zhang Z, Feng J and Yao H (2023) 3-D azimuthal anisotropy structure reveals different deformation modes of the crust and upper mantle in the southeastern Tibetan Plateau. Front. Earth Sci. 11:1095609. doi: 10.3389/feart.2023.1095609
Received: 11 November 2022; Accepted: 23 January 2023;
Published: 03 February 2023.
Edited by:
Xiao Xu, Sun Yat-sen University, ChinaReviewed by:
Zhen Guo, Southern University of Science and Technology, ChinaXuewei Bao, Zhejiang University, China
Copyright © 2023 Zhang, Feng and Yao. This is an open-access article distributed under the terms of the Creative Commons Attribution License (CC BY). The use, distribution or reproduction in other forums is permitted, provided the original author(s) and the copyright owner(s) are credited and that the original publication in this journal is cited, in accordance with accepted academic practice. No use, distribution or reproduction is permitted which does not comply with these terms.
*Correspondence: Jikun Feng, amtmZW5nQG1haWwudXN0Yy5lZHUuY24=; Huajian Yao, aGp5YW9AdXN0Yy5lZHUuY24=