 Gonzalo Navarro
 Rémi Valois
 Shelley MacDonell
 Giulia de Pasquale
 Juan Pablo Díaz5
- 1Universidad de La Serena, La Serena, Chile
- 2Centro de Estudios Avanzados en Zonas Áridas—CEAZA, La Serena, Chile
- 3Environnement Méditerranéen et Modélisation des Agro-Hydrosystèmes—EMMAH, Université de Avignon, Avignon, France
- 4Waterways Centre for Freshwater Management, University of Canterbury and Lincoln University, Christchurch, New Zealand
- 5Department of Structural and Geotechnical Engineering, Pontificia Universidad Católica de Chile, Santiago, Chile
Rock glaciers are the most abundant (peri) glacial landform in the semiarid Andes (SA, 29–34°S), covering about three times the area of mountain glaciers. Recent studies suggest they may play an important hydrological role, including generating, storing and routing water. However, processes governing these roles are still poorly known especially for glacier complex units, i.e., where there is a juxtaposition or continuity of different (peri) glacial landforms, which are common in semiarid Andean and Himalayan areas. This study aims to understand how the internal structure of an ice-debris landform assemblage controls hydrological routing. To address this aim, we used a combination of three geophysical techniques to qualitatively determine the internal structure and favourable water routing and storage zones at the Tapado glacier complex (30°S), Chile. The Tapado glacier complex consists of an assemblage of a debris-free glacier, a debris-covered glacier and two rock glaciers. For the purpose of this study, we focused on the debris-covered and active rock glacier connection. At this site, the debris-covered glacier has a relatively thin debris-cover that increases thickness downglacier. This debris cover connects to the active rock glacier and forms the active layer. The rock glacier contains a heterogenous internal structure consisting of debris with water or segregated ice filling the voids, which likely derives from the massive ice of the debris-covered glacier. The superficial debris layer of the ice-debris landforms may act as a transmissive medium by routing water downstream above the massive ice of the debris-covered glacier, but also into deeper areas, as intra-permafrost flow, in the rock glacier. The rock glacier likely has a higher capacity to transmit vertical and horizontal flows, thereby enhancing infiltration processes. This study reinforces the value of geophysical methods to determine the internal structure of ice-debris landforms, particularly in the transition between landforms, and highlights how a warming climate and consequent paraglacial processes will impact the hydrological system not only in terms of water storage, but also water transfer.
1 Introduction
Mountain and valley glaciers are crucial hydrological units in semiarid regions of Chile as they provide an important water contribution during the ablation season (e.g., Favier et al., 2009; Ayala et al., 2016; Ayala et al., 2020), when precipitation is scarce and water demand is at its maximum (Navarro et al., 2023). In total, more ice is stored in debris-free glaciers than in debris-covered and rock glaciers (Barcaza et al., 2017), and as they are more sensitive to recent climate changes (Schaffer and MacDonell, 2022) they currently provide higher volumes of water to rivers (Ayala et al., 2016; Burger et al., 2019). However, in some catchments, debris-covered glaciers provide a notable contribution to streamflow (Ayala et al., 2016), and insulation provided by the debris-cover (Nicholson et al., 2018) enables ice to be stored at lower elevations than what might be possible for exposed ice (Ayala et al., 2016). This affects the mass and energy balance (Ayala et al., 2016; Burger et al., 2019) and directly impacts the timing and quantity of runoff delivery to the wider catchment (e.g., Fyffe et al., 2019). Rock glaciers are widespread distributed in semiarid Andes (29–34°S) and become even more prevalent further north, accounting for at least three times the surface coverage area of debris-free glaciers in this zone (Azócar and Brenning, 2010; Barcaza et al., 2017). Due to their prevalence some studies have suggested that rock glaciers have an important hydrological function in this region, including in the storage, production and transfer of water (Pourrier et al., 2014; Schaffer et al., 2019; Halla et al., 2021). Whilst these categories of ice body are generally treated separately, this region also contains several complex units that comprises different glacier types, i.e., starting as debris-free glaciers at high elevations, turning into debris-covered glaciers and finally rock glaciers at lower elevations (Monnier et al., 2014; Janke et al., 2015; Monnier and Kinnard, 2015; 2017), which would imply that these landforms are connected not only structurally but also hydrologically (e.g., Pourrier et al., 2014).
These assemblages imply a shift from glacial to periglacial environments and it is sometimes difficult to establish the limit between ice-debris landform types when debris-covered glaciers exhibit a morphological continuum to rock glaciers in their termini. They are also present in other mountainous areas of the world such as the Himalayas (e.g., Jones et al., 2019a), Alps (e.g., Ribolini et al., 2007) or Iceland (e.g., Fernández-Fernández et al., 2020). These glacier complexes very likely correspond to evidence of different stages of a continuous transition from debris-free glaciers to periglacial landforms as a result of glacial valley degradation (Monnier and Kinnard, 2017; Anderson et al., 2018). Such evolution is characterised by a reduction in the proportion of internal ice in relation to the supraglacial and englacial deposits, accompanied with a reduction in the flow and, therefore, impacts on its geomorphology (Janke et al., 2015). The latter is part of the glacigenic origin of rock glaciers, where a former glacial ice body has been buried by an insulating weathered debris layer. This process is in contrast to rock glaciers of periglacial origin, where creeping interstitial pore-ice or segregated ice is derived either from freezing of groundwater or percolating water, or the burial of snow and ice accumulations (see Jones et al., 2019b for an overview). This transition between end members has largely focused on the geomorphological processes and consequences, with scant consideration of other implications such as for internal structure transition and water routing.
The combination of different glacier types within a glacier complex likely causes a myriad of hydrological behaviours depending on the different internal structure possibilities of glacial and periglacial units. Transitions from one type to another likely impact meltwater generation quantity and timing as well as storage and routing dynamics. Additionally, the inherent features that define each glacier type, particularly their debris cover properties, mean that they would respond to climatic changes with varying degree of sensitivity (Schaffer and MacDonell, 2022). Hence, the evolution to periglacial landforms, as warming and drier climate impacts its ice content, may change runoff timing and hydrological connectivity.
This paper aims to understand how the internal structure of a semiarid Andean ice-debris landform assemblage controls hydrological routing. To address this aim, we use a combination of surface-based geophysical techniques to study the Tapado glacier complex, Chilean Andes (30°S). Here, we analyse key structural controls including ice distribution and glacial limits to identify favourable zones for water routing and storage, and to suggest possible impacts of paraglacial processes on hydrology in deglaciating environments.
Whilst the genetic origin of the Tapado glacier complex has been studied previously (Milana and Güell, 2008; Monnier et al., 2014), we do not attempt to establish the (para) glacial evolution of this complex unit. Here we explore a debris-covered glacier to rock glacier continuity to understand the hydrological implications that their internal structures have, and possible consequences to it caused by future paraglacial processes. We posit that a perturbation of one part of these complex units will potentially impact the entire system and the water quality and quantity downstream, which extends beyond the dichotomy between rock glacier origin.
2 Study area
The Tapado glacier complex (30°S, Figure 1) corresponds to the larger glacial assemblage (1.83 km2) of La Laguna sub-basin, at the headwaters of the Elqui River catchment. The waters of this complex are drained by the Colorado River, which supplies the artificial La Laguna reservoir (3,130 m a.s.l., 37.8 Mm3), at the outlet of the sub-basin, managed to support the water delivery for human and industrial use.
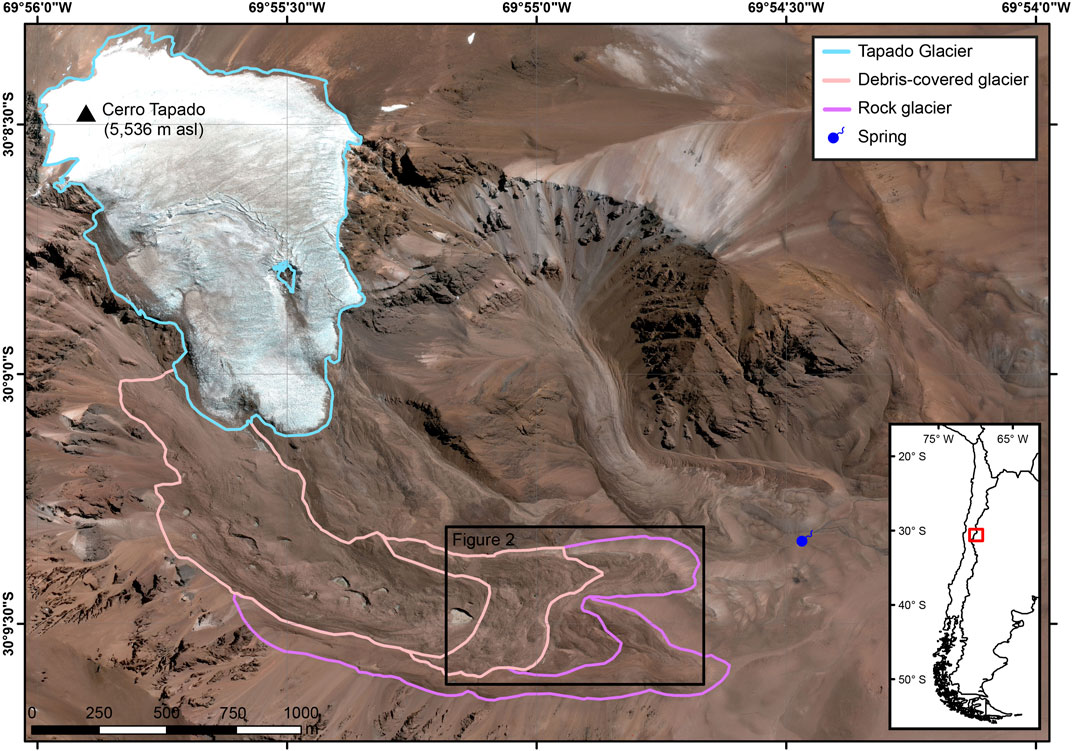
FIGURE 1. Tapado glacier complex (30° S) displaying its current inventory of landforms (Dirección General de Aguas, 2022). Background image corresponds to a Pléiades scene from 2020. © CNES (2018) and Airbus DS (2018), all rights reserved.
This landform assemblage comprises the Tapado Glacier (0.93 km2), a cold-based mountain glacier (Ginot et al., 2006) that prevails owing to favourable climatic conditions like local wind transport and precipitation conditions due to its elevated location (e.g., Ginot et al., 2006; Sinclair and MacDonell, 2016). The ablation zone of it is covered by penitentes, originated from non-linear ablation with sublimation prevalence at the top of the cones and melt at the bottom (Sinclair and MacDonell, 2016; Nicholson et al., 2018). In connection with the Tapado Glacier, a complex ice-debris landform assemblage consisting of a series of debris-covered and rock glaciers, along with moraine complexes, is present (Monnier et al., 2014; Vivero et al., 2021). A morphologically continuous landscape exists between the debris-covered and rock glaciers. The former is characterised by frequent supraglacial lakes that expose the massive debris-layered, usually hummocky, glacial ice, while the latter display viscous topography with no exposure of its internal structure and steep lateral-frontal talus.
An increase in temperature, decrease in humidity and variable precipitation since the 1980s have severely affected the mass balance of the Tapado Glacier, showing a mass loss of ─0.11 ± 0.05 m w. e.a−1 between 1956 and 2020, with highest average values of ─0.54 ± 0.10 m w. e.a−1 between 2012 and 2015, product of the severe drought that has affected central and northern Chile since 2010 (Robson et al., 2022). Contrastingly, borehole temperatures from the northern rock glacier suggest a slight cooling trend in the active layer during the 2010–2015 period, interpreted as an easier penetration of the cold front in the active layer due to early removal of snow cover (Vivero et al., 2021).
3 Geophysical data acquisition
Here we combine electrical resistivity tomography (ERT), ground penetrating radar (GPR) and refraction seismic tomography (RST) to reduce ambiguities in interpretations on the internal structures of the landforms. The geophysical surveys on the Tapado glacier complex were conducted in two consecutive austral summers, during 2021 and 2022. The field campaigns were logistically challenging in terms of both equipment transportation to the site and data acquisition due to extreme mountainous environment with a rugged topography at high elevations. The location of the sensors of all the profiles were taken with a Global Navigation Satellite System (Trimble, England) in kinematic mode with differential accuracies (0.06 and 0.1 m average horizontal and vertical accuracy, respectively). Geophones, electrodes and GPR antenna centre were often not positioned exactly on the planned line due to surface irregularities, resulting in a source of noise for final models.
The geophysical profiles were delineated in the longitudinal axis of the northern rock glacier (Figure 2) as its frontal talus is located closer to the spring on the moraine, which superficially drains the water from the complex unit (Pourrier et al., 2014, spring in Figure 1). In addition, it has previously registered higher dynamics than the southern rock glacier (Vivero et al., 2021; Robson et al., 2022), presuming higher ice and/or water content within this landform. During the 2021 fieldwork, we collected simultaneously ERT and GPR dataset on the ice-debris landforms in a discontinuous profile (0–340 m and 375–715 m). We attempted to follow the same 2021 line for the 2022 campaign, to validate the observed datasets and add potential additional information using ERT and RST. However, this was not entirely possible because of the rugged topography and logistical challenges. The result is a continuous longitudinal profile starting at 220 m of the 2021 profile, sharing the same positions up to 425 m, after which it splits, which offset positions are indicated as asterisk (*) meters up to the end of the line (720* m). Additionally, we acquired four cross-sectional profiles using ERT and RST to inspect the spatial distribution of the measurements observed in the longitudinal profiles, whose locations and inversion models are shown in Supplementary Figures S1, S2, respectively.
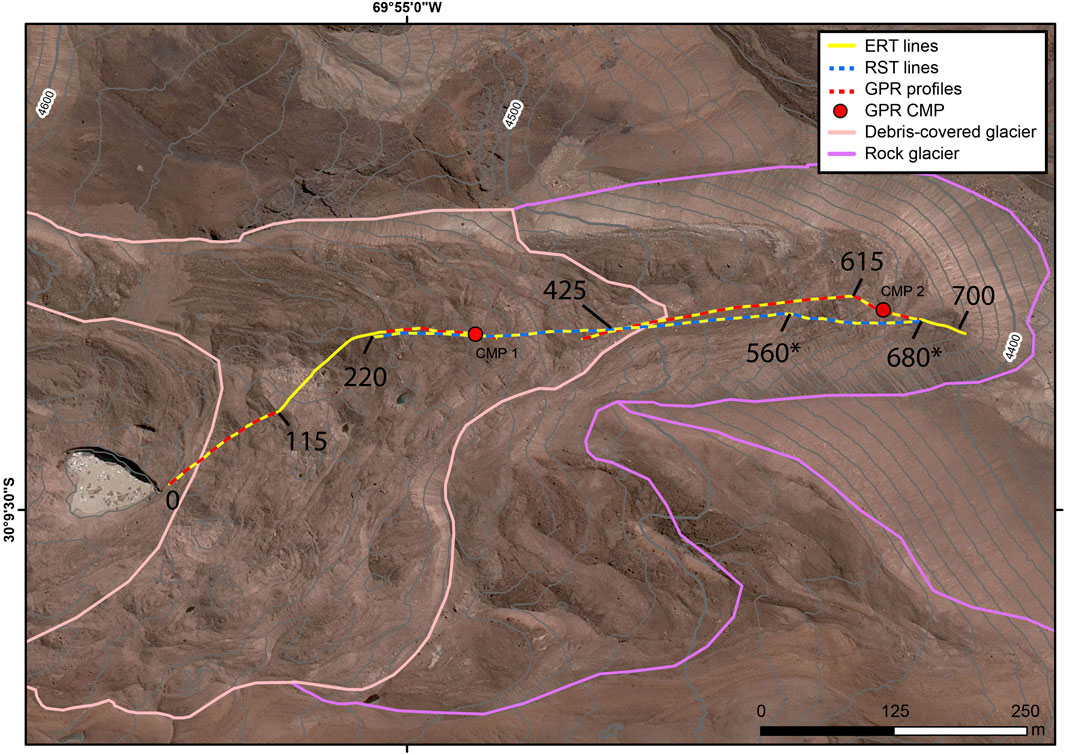
FIGURE 2. Lowest section of Tapado glacier complex, consisting of its debris-covered section and active rock glacier, displaying the location of geophysical survey profiles. NB: ERT: Electrical Resistivity Tomography; RST: Refraction Seismic Tomography; GPR: Ground Penetrating Radar; CMP: Common Mid-Point survey.
3.1 Electrical resistivity tomography (ERT)
Electrical resistivity tomography characterises the electrical resistivity distribution in the subsurface from which the possible material types or properties can be determined due to contrasting electrical resistivity between lithological material, water and ice (Valois et al., 2021). Here the ERT profiles were acquired using a Syscal Junior switch-48 (IRIS instruments, France) consisting of two 24-channels cables using 45 (2021 survey) and 48 (2022) stainless-steel electrodes spaced 5 m apart. Lines were extended by rolling out the western (uppermost) cable to the front of the line, to the east, employing a 50% roll-along scheme. Sponges soaked in salt water were attached to the electrodes to improve the galvanic contact of the electrodes with the ground on rough-boulder surfaces (Hauk and Kneisel, 2008).
The planned ERT survey used a Wenner-Schlumberger array. However, due to technical problems the first 45-electrode survey on the debris-covered glacier (0–220 m, Figure 2) used a dipole-dipole array configuration. The roll-along of this 69-electrode survey (115–340 m) used a Wenner-Schlumberger array, similarly to the other profiles (375–715 m and 220–695* m). For all measurements, injection cycles were set to 500 µs and measuring voltages to about 50 mV. Acquisition details are given in Table 1.
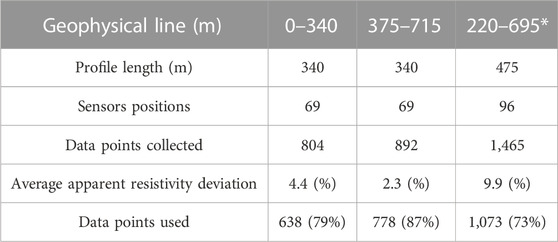
TABLE 1. Acquisition settings for ERT during 2021 (0–340 m and 375–715 m) and 2022 (220–695* m).
Each quadrupole was staked between three and ten times, with measurements with a standard deviation of >5% discarded. Measurements that yielded negative resistivity and obvious outliers were also removed. The data was smooth filtered using X2PI software (Robain and Bobachev, 2017), by reducing P (related to potential dipole) and C (to injecting dipole) effects, which can be generated by superficial heterogeneities and/or by weak electrical contact between the electrodes and the soil. These filters significantly reduce noise. The inversion of apparent resistivity data was carried out with Res2Dinv software (Geotomo Software; Loke and Barker, 1996). Modelled resistivity was used to perform a depth of investigation (DOI) analysis using the open-source library pyBERT (Günther et al., 2006; Rücker et al., 2006), and was also used to display the final inversion models. The maximum DOI was obtained setting a threshold of 0.04 to the ERT coverage vector computed considering the logarithmic transformation of the Res2Dinv model results.
3.2 Ground penetrating radar (GPR)
Ground penetrating radar was used to characterise the structure of near-surface features, specifically to recognize sectors with ice or frozen ground and sectors with solid rock (Annan and Davis, 1976). The GPR surveys were conducted using PulseEKKO Pro DVL equipment (Sensors and Software Inc., Canada) mounted with bistatic unshielded 50 MHz frequency antennae. Profiles 0–114 m, 240–335 m and 375–670 m correspond to common-offset surveys following the same track as the 2021 ERT lines. Here antennas were oriented perpendicular to the line with a separation of 2 m and an intended step size of 0.5 m (Table 2). The rough and chaotic topography between 115–200 m and 670–715 m made it impossible to obtain good antenna coupling with the ground and so no measurements were completed in those sectors. Each acquired GPR trace was the result of 64 stacks to increase the signal-to-noise ratio. Details of each GPR profile are given in Table 2. Additionally, two common mid-point (CMP) surveys were completed on flat, accessible surfaces on the debris-covered (CMP1 on Figure 2) and rock glaciers (CMP2 on Figure 2).
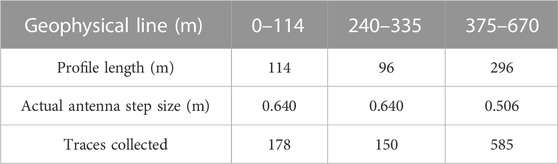
TABLE 2. Acquisition settings for GPR profiles during 2021 for the ice-debris landforms.
The data were processed using EKKO Project v5 (Sensors and Software Inc., Canada), using the following sequence: correction of first arrivals and correction of time zero, application of dewow filter, bandpass filter (for 0–114 m profile), background removal, application of spreading for exponential compensation gain, f-k migration (for 375–670 m profile), topography correction and time to depth conversion. The CMP data were analysed to calculate the electromagnetic velocity of 240–335 m and 375–670 m profiles to convert to depth, while diffraction hyperbolae analysis was used to estimate electromagnetic velocity using the hyperbola-fitting method for the 0–114 m profile.
3.3 Refraction seismic tomography (RST)
Refraction seismic tomography was used to delineate the top of permafrost body, and to qualitatively validate interpretations of internal structure. We recorded the RST with a Geode Exploration Seismograph device (Geometrics, United States) along the same 2022 ERT profile with a survey line length of 475 m (220–695* m). The setup consisted of a linear array of 24-vertical geophones cable with an inter-geophone spacing of 5 m and shots every 10 m between geophone positions. Each shot recorded for a length of two seconds and a sample interval of 1.25 milliseconds was used to stack shots. This set-up was moved four times downglacier to the east. We also used offline shots to link the different acquisitions 5 m apart, until the farthest geophone no longer recorded the shot (up to 25 m). In total, we implemented 96 different geophone positions and 75 shots, resulting in 1776 travel time detections and a final P-wave velocity model ∼520 m long (200–720* m). The energy source was a 15 kg sledgehammer on a high-density plastic plate, repeating each shot three times for offline shots and two times for inline ones to improve the signal-to-noise ratio.
The identification of first arrival travel times on each trace was done manually using Seisimager software (Geometrics, United States), totalling 1,253 picks (71% of the total) with an absolute error of 0.002 s (±0.001 s), estimated from the average variability in the first arrival picking process. This first arrival travel time registers were used as input for inversion processing using pyGIMLi, an open-source library developed in Python (Rücker et al., 2017). A discretization mesh with a maximum cell size of 50 m2 and boundary conditions set to four times the span of the sensors was implemented. For the inversion itself, a regularization weight of λ=50 was used, from a gradient seismic wave velocity model starting with 100 ms−1 at the top of the tomogram and gradually increasing up to 10,000 ms−1 at the bottom. The inverted P-wave velocity model performance to explain the field observations is analysed using the error-weighted chi-squared fit, where χ2=1 corresponds to a perfect fit.
4 Results
4.1 Electrical resistivity tomography
4.1.1 Data collected 2021
Figure 3A displays the resistivity models obtained from the 2021 dataset on the ice-debris landforms (see Supplementary Figure S3A for ERT section alone). After three iterations the combined dipole-dipole and Wenner-Schlumberger section had a RMSE of 17.5% (0–340 m) and the entire Wenner-Schlumberger section (375–715 m) had a RMSE of 9.4%. All resistivity models show their corresponding depth of investigation, which indicate the limit of reliable interpretations. Shallow intermediate resistivity bodies (50–100 kΩm) of <5 m thick are present along the entire extent of the 0–340 m tomogram except in the topographical depressions, where very low resistivity values (<1 kΩm) are found near the start (40–80 m) and central part (140–180 m), followed by intermediate resistivities below. These values are contrasted with much more resistive values at depth (>100 kΩm) between 80–140 m and 210–330 m. The higher resistivities are found at depth at around 210–280 m, with values >300 kΩm.
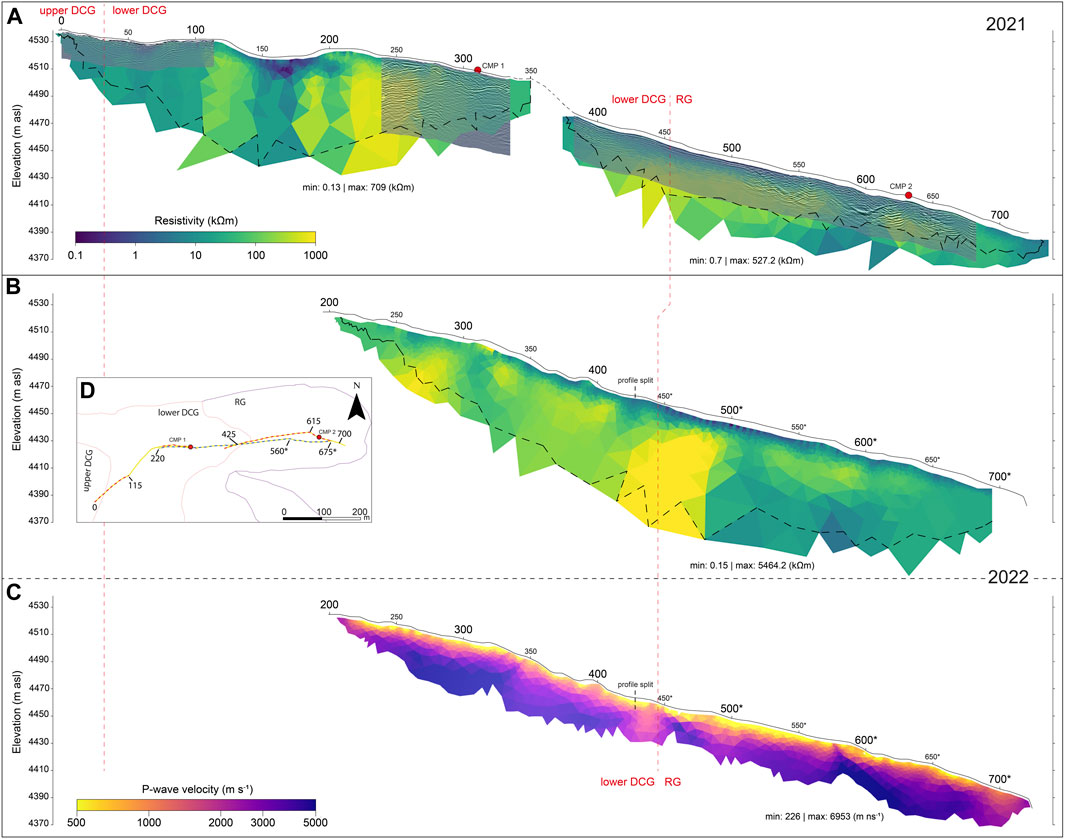
FIGURE 3. Geophysical models for ERT (A,B), GPR (A) and RST (C) for the studied ice-debris landform assemblage based on observations from 2021 (A) and 2022 (B,C). (D) Profile locations on the Tapado glacier complex, see symbology in Figure 2. Upper debris-covered glacier (DCG)—lower DCG—rock glacier (RG) geomorophological limits (Dirección General de Aguas, 2022) are displayed as dashed red lines. Resistivity and P-wave velocity colour bars are in logarithmic scale. Dashed black lines correspond to the depth of investigation for ERT. CMP: common midpoint survey.
The 375–715 m tomogram starts in the geomorphologically expected final meters of the lower debris-covered glacier and then extends to the rock glacier section. This profile shows a superficial layer of low resistivity (<10 kΩm) of ∼7–10 m thick, with even lower values (<1 kΩm) between 450–550 m. An elongated horizontal zone of high resistivity values (100–527 kΩm) is seen at depth from the beginning of the model up to ∼580 m. This zone transitions into a subvertical area of intermediate values (5–30 kΩm) that extends through the entire thickness of the tomogram. The horizontal highly resistive zone reappears at ∼610 m, but smaller in both dimensions (length and thickness) and resistivity (100–300 kΩm). Below this zone and the DOI limit, at the bottom end of the profile (570–630 m), is observed a horizontal area of low resistivity values (<1 kΩm).
4.1.2 Data collected 2022
The resistivity model derived from data gathered during 2022 is shown in Figure 3B. The model has a RMSE of 21.6%, obtained after three iterations. This continuous profile starts at the lower debris-covered glacier and at around 440* m transitions to the inventoried rock glacier. The longitudinal line shows a continuous and shallow layer of about 5 m thick consisting of intermediate resistivity values (30–100 kΩm) in most of the tomogram (340 m downwards), similar to the 2021 resistivity model. Even lower values (<2 kΩm) are encountered in the superficial zone between 350–400 m and 400-570* m. High resistivity values (>100 kΩm) are found at depth, from the beginning of the model up to ∼500* m, with the highest ones concentrated between 420 and 500* m (>1,000 kΩm). Downglacier from that feature, the subvertical zone of lower resistivities (5–50 kΩm, between 510*-530* m) recognized in 2021 dataset is subtly repeated, followed by the horizontal not so resistive core (100–300 kΩm, from 520* m onwards). Towards the end of the complex, low resistivity values (<1 kΩm) are present at the bottom of the profile end (∼560*-600* m).
4.2 Ground penetrating radar
Three separated GPR profiles were collected on the ice-debris landform assemblage, consequence of the rugged and steep topography in between (Figure 3A) (see Supplementary Figure S3B for GPR section alone). Between 0–140 m a radar velocity of 0.05 m ns−1 was used to convert time to depth based on an average velocity obtained from 40 diffraction hyperbola analysis, while two different CMP analysis were used to retrieve an average velocity of 0.142 m ns−1 (at CMP1, Figure 3) for the 240–335 m section and 0.079 m ns−1 (at CMP2, Figure 3) for 375–670 m. This results in a depth of penetration of ca. 24, 55 and 30 m for each respective section.
The uppermost radargram section (0–114 m) is characterised by clear and dense reflectors (i.e., high-scatter facies) in the first ∼3 m in depth (Figure 3A). Despite the gain, with depth the radargram becomes more diffuse and blurrier (i.e., low-scatter facies), with some prominent point reflectors centred in the topographic depression (60–80 m). One clear and strong reflector in this profile has a wedge form, spanning almost the entire length of the profile (∼20 m onwards), with its deepest location at ∼50 m. Prominent horizontal and periodic reflections at the start and end of the radargram, and in the bottom at 50–70 m, do not correspond to the main signal but instead to ringing, which is likely due to imperfection in the impedance match between the antennas and the heterogenous ground surface (e.g., Daniels et al., 2008).
The radargram between 240–335 m shows overall low-scatter facies, especially at depths >10 m (Figure 3A). Despite this, some strong continuous reflections are present in the shallow meters of the profile, in a zone of high-scatter facies, particularly one with strong polarity that runs the entire horizontal extent of the radargram within the first 5–10 m below the surface. The same type of dipping pattern reflections observed in the upper radargram is seen in between the low-scatter medium from 240 to 290 m.
The lowermost radargram section (375–670 m) shows predominant low-scatter facies for all depths between 375–515 m, with some horizontal continuous reflectors in the first 7–10 m in depth (Figure 3A). The rest of the radargram (515 m onward) exhibits a thicker section of high-scatter facies, in the form of point reflectors that generate several diffraction hyperbolas (which have been almost completely collapsed after migration), forming a ∼20–25 m thick body from the surface. Below, and to a lesser extent in between, this section there are also present low-scatter facies responses, showing a continuity of the low-scatter facies characterising the first half of this radargram into the deepest part up to the end of the profile. Additionally, few dipping reflectors pointing towards the east can be recognized at ∼570–580 m, and a continuous strong west dipping-concave reflector, with high polarity, stands out between 600–630 m.
4.3 Refraction seismic tomography
A P-wave velocity model from measurements collected during 2022 on a longitudinal profile spanning both ice-debris landforms is displayed in Figure 3C. After six iterations we obtained a χ2 of 2 for the modelled travel time. Empty cells are due to the absence of ray paths through them and therefore have no P-wave velocity inverted data to show. Additionally, a shallower inversion model is obtained compared to ERT due to the poor signal-to-noise ratio for larger offsets. Overall, the model shows relatively low velocities near the surface (<1,000 ms−1) which then gradually increase, at different rates, reaching higher velocities at depth (>4,000 ms−1). The upper section (200–300 m) of the model shows a ∼5 m thick superficial layer of low velocity (<500 ms−1) that then thickens to about 10 m (320–410 m). Below this layer, velocity increase sharply in depth between 250 and 410 m, where the highest values are found (>5,000 ms−1), and more gradually from 440* m downwards. From 440* m downwards the shallow low velocity layer is about 15 m thick, and gradually increase in velocity in depth to values no higher than 2,500 ms−1, except between 570*-640* m where values of ∼4,000 ms−1 are reached.
5 Discussion
5.1 Internal structures
According to the ERT, GPR, and RST model results several important features of the internal structure of the ice-debris landforms are obtained, which are highlighted in Figures 4A, B. In the first meters of the surveyed area, the very low resistivities (40–80 and 140–180 m) and point reflectors near the surface in depressions (60–80 m) correlate with field observations of nearby supraglacial lakes. The wedge-shaped strong reflector is embedded in an intermediate resistive medium and is interpreted as an ancient depression (e.g., supraglacial lake) that collapsed following unstable conditions, currently observed as large elevation changes (>2 ma−1) in the debris-covered glacier as showed in previous data of Robson et al. (2022) (Figure 4C).
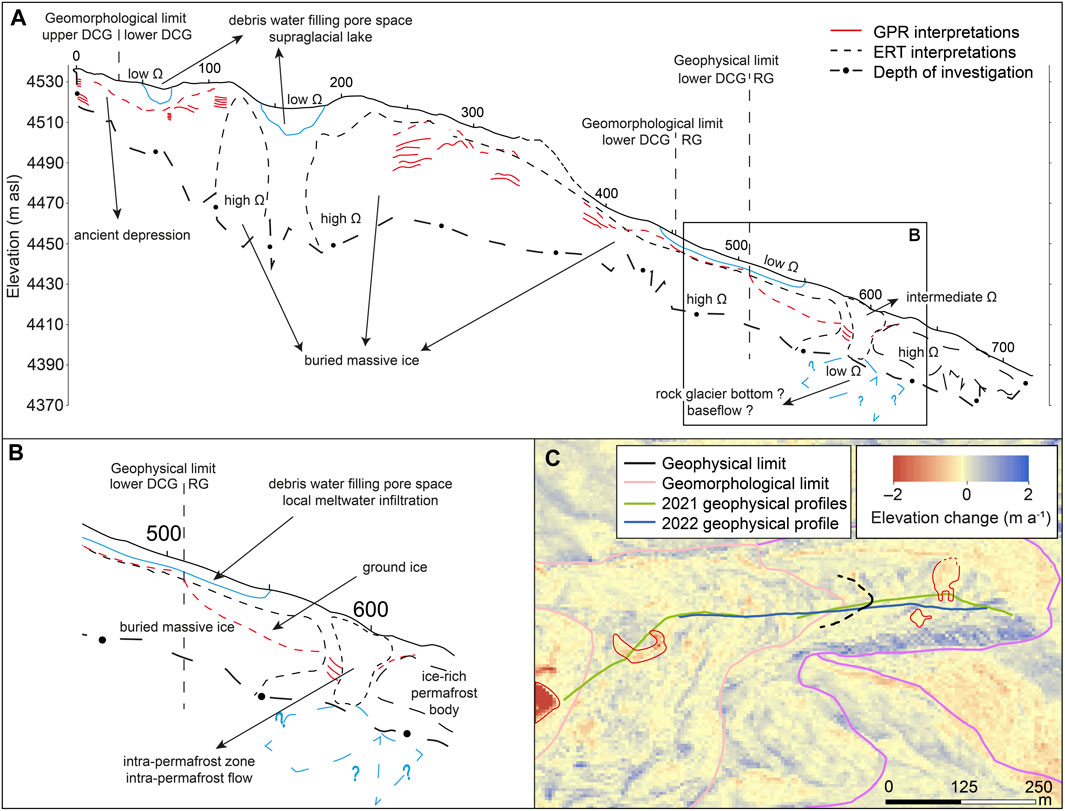
FIGURE 4. (A) Scheme of the interpreted Tapado ice-debris landform assemblage geophysics results (ERT and GPR) from 2021 to 2022 surveys. Panel (B) corresponds to a close-up of the transition between the ice-debris landforms. (C) Geomorphological and geophysical limits between debris-covered and rock glaciers. The background shows the elevation change (m a−1) between 2015–2020 from Robson et al. (2022). Large elevation changes mentioned in the text are marked with red polygons.
Low resistive values are also related to flat surfaces in both surveys (450–550 m for 2021 and 450*-550* m for 2022), where seasonal snow was present in both measurement periods, therefore likely corresponding to debris with percolated meltwater in its pore space. Intermediate resistivities near the surface (80–140 m, 230–280 m and 290 m downwards) are consistent with both low P-wave velocities (2022) and high-scatter facies from the radargram (2021), related to the scattering effect generated by a heterogenous medium with high dry debris concentration, with air filling its pore space. This layer comprises the whole ice-debris landform assemblage and shows thickness variation from ∼3–5 m in the upper part (up to 580 m) to ∼10 m near the end of the landform (600 m onwards).
At depth, more resistive values are well correlated with high seismic velocities and either low- or high-scatter facies of the radargram. The association of high resistivity with low-scatter facies indicates a high resistive medium with relatively homogenous and cohesive composition. In addition, the sharp increase in P-wave velocity from near-surface values to deeper sites state a significant change in composition, revealing the presence of buried massive ice between 80–140 m, 210–510 m and in the deepest part between 515–580 m (Figure 4B). The observed maximum thickness of the massive ice is ca. 66 m, as indicated in the resistivity model at 440 m in 2022 profile (the thicker part with this geophysical signature), however, its actual thickness is uncertain given the subglacial topography was not reached. This finding is in concordance with previous observations by Monnier et al. (2014), who estimated a thickness of ∼30 m in the central depressed part of the debris-covered glacier (∼1 km uphill from the uppermost point of this study), and ∼80 m at the upper part of the debris-covered glacier (close to the snout of the Tapado Glacier).
Otherwise, the concordance of high resistivity with high seismic wave velocity, gradually increasing in depth, and zones with high-scatter facies point towards the presence of debris with lower porosity due to gradual increase in compaction or, more likely, presence of ice in its pore space. This geophysical signal is present in a discontinuous form at 20–30 m depth between 515–580 m (Figure 4B) and more cohesively from 610 m onwards (at 20–35 m depth). The upper western limit of this cohesive body coincides with a strong continuous dipping-concave reflector, marking the upper ice-rich sediment limit that contrasts strongly with the surrounding dry debris. The subvertical feature with intermediate resistivity values at 580 m, repeated at 510* m for 2022 model, is associated with high-scattered facies and intermediate P-wave velocities (1,000–2,500 ms−1), respectively, implying the existence of debris without ice but with higher degree of compaction (e.g., increase in fine-grained debris within the larger-sized materials), followed by an ice-rich permafrost body downglacier. Finally, low resistivity and low electromagnetic velocity (see Supplementary Figure S4) at the bottom end of the rock glacier is interpreted as debris with water filling the inter-pore space, located beneath the ice-rich sediment and at the interface with the basement. Therefore, this feature could serve as a good indicator of the thickness of the rock glacier of ca. 37 m.
The analysed internal structure of the surveyed landforms points towards two distinct arrangements with a gradual transition from one to the other. The debris-covered glacier is characterised by the presence of a superficial debris layer of about 3 m in the upper section to ∼5–8 m in its lower part, with associated supraglacial lakes in the upper part, and the presence of a buried massive ice in depth. The low-scatter facies that characterise this body also presents several short continuous and dipping reflectors in between, indicative of thin debris layers inclusions along thrust planes in the ice, verified by field observations in ice cliffs located on the upper debris-covered glacier.
The near-surface internal structure is quite homogenous in the entire ice-debris assemblage extent, composed by debris with air filling the pore space, comprising the debris-cover layer in the debris-covered glacier and the active layer of the rock glacier. At depth, this transition is marked at about 515 m by the progressive segregation of the massive ice of the debris-covered glacier into ground ice at the top of it (i.e., ice lenses and/or interstitial ice), as indicated by the different geophysical signal associations before and after that mark (Figure 4B). We interpret this as the internal transition from the debris-covered glacier to the rock glacier, where the buried massive ice is no longer continuous and a major change in the ice volume contained in the subsurface is observed, giving way to the coexistence of ground ice above massive ice (Figure 4B). This geophysical limit is ca. 60 m downslope that the geomorphological limit delineated in the current National Glacier Inventory (Inventario Público de Glaciares, Dirección General de Aguas, 2022; Figure 4C). From this position, the internal structure of the ice-debris landform assemblage is not composed of massive, debris-covered ice. Instead, a mixture of debris with high ice content that forms the ice-rich permafrost body is found below the superficial active layer. Prior evidence has also found or concluded the presence of massive ice or ice lenses in the same rock glacier (Milana and Güell, 2008; Monnier et al., 2014; Robson et al., 2022). The active layer shows variable thickness, with typical values of ∼7 m and maximum of ∼10 m. Previously, a thickness of 4 m had been reported for this landform, some meters upglacier (Milana and Güell, 2008). The ice-rich permafrost body is discontinued by a subvertical area of debris without ice (intra-permafrost area) that goes through the entire thickness of the landform. This zone roughly coincides with the area of highest superficial elevation loss on the rock glacier according to previous data from Robson et al. (2022) (Figure 4C), a pattern that has been previously linked to higher ice losses and ridge collapses (Seppi et al., 2019). The different massive ice and ice-rich permafrost distribution observed in the different surveyed sections, showing a greater downglacier extent of massive ice and a clearer intra-permafrost zone in 2021 model, suggest that the geophysical limit of this ice-debris landform has a tongue-shape, resembling its geomorphological limit (Figure 4C). This implies that the extent of the massive ice, ice-rich and ice-poor ground varies spatially, being neither continuous nor homogenous.
5.2 Internal structure transition significances
The thickness of the superficial debris layer of the analysed ice-debris landform assemblage has been observed to gradually increase towards its termini and, hence, the debris layer thickness of the debris-covered glacier progressively approaches the active layer of the rock glacier. Similar findings have been made for other ice-debris assemblages (e.g., Monnier and Kinnard, 2015; Kellerer-Pirklbauer and Kaufmann, 2018), where a continuity between an upper debris-covered glacier towards a lower-elevation rock glacier was determined.
Internal structure transitions between glacial end members based on direct (i.e., boreholes) or indirect (e.g., geophysics) observations of the subsurface are sparse. The observed progress from massive ice to ground ice and ice-rich permafrost marks the transition from debris-covered glacier to rock glacier. For example, the coexistence and interactions between relict sedimentary ice with permafrost has been previously observed in the Tien Shan Mountains, related to a landform transition from partly debris-covered glacier to ice-rich permafrost debris rock glacier (Bolch et al., 2019; Zhou et al., 2022). However, the morphological continuum of ice-debris landforms has not always had the same genetic interpretation. The presence of debris-covered sedimentary ice and permafrost bodies with different ice contents, in the Maritime Alps, has been interpreted as a Little Ice Age glacier advance that overrode previous rock glaciers (Ribolini et al., 2007). Monnier et al., 2014 and Pourrier et al., 2014, based on geomorphological and GPR surveys, concluded that there is no genetical continuum between the debris-covered glaciers and the rock glaciers of Tapado glacier complex. Instead, they indicated that the latter were overlapped after the Little Ice Age advance by the formers and do not derive from them, however, the rock glacier materials may initially derive from former glacial deposits or a former debris-covered glacier. This is contrary to the suggestions of Milana and Güell (2008) and Robson et al. (2022), who interpreted, based on refraction seismic and geomorphological dynamics, that the rock glacier is derived from, or is advancing at expense of, the debris-covered glacier. Furthermore, Robson et al. (2022) observed that the geomorphological border between the debris-covered and rock glacier has moved approximately 150 m upglacier between 1956–1978 and 2015–2020. The change from massive ice beneath a debris layer towards segregated ice and interstitial ice structure, as recognized in this study, has been previously interpreted as a glacier-derived rock glacier (Monnier and Kinnard, 2017; Kellerer-Pirklbauer and Kaufmann, 2018; Bolch et al., 2019; Seppi et al., 2019; Robson et al., 2022; Zhou et al., 2022). This implies that the rock glacier develops upwards at the expenses of the debris-covered glacier, both in morphology and internal structure terms (Monnier and Kinnard, 2017). In addition, sediment transport to the glacier surface has been previously observed to be an important driver of glacier to rock glacier transition in the Himalayas (Jones et al., 2019a), which in the case of the rock glacier of Tapado glacier complex has been found to derive from the above debris-covered glacier and surroundings slopes (Monnier et al., 2014; Robson et al., 2022). Supraglacial lakes are typical features of degrading debris-covered glaciers representing areas of increased melt. Their dynamics could lead to the concertation of debris collapsing from ice cliffs into the depressions, as suggested in the geophysics presented here, causing a locally increase in debris thickness and enhanced isolation of the underneath glacial ice. Hence, these new findings based on multiple geophysical data supports the genetic continuum interpretation for this complex unit.
5.3 Water routing of ice-debris landforms
The recognized internal structures along the studied ice-debris landform assemblage concern different implications for its hydrology, in terms of storage and routing of water, as depicted in Figure 5. The debris-covered glacier represents not only a significant capacitive function, storing water in the form of massive ice, but also acts as a transmissive compartment in the debris layer above it. As a result of air filling the pore space of this layer, this unit would be capable to transmit water flows coming from upstream and those originated in situ by ice melt. This water flow is expected to continue horizontally above the massive ice, which plays the role of an aquiclude, with an additional temporary storage in form of supraglacial lakes (Figure 5) when in situ ice melt reaches shallow levels, causing a possible delay in water discharge (e.g., Irvine-Fynn et al., 2017).
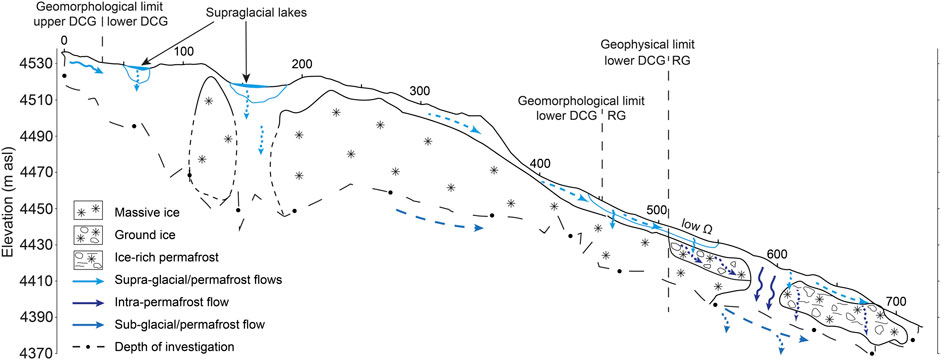
FIGURE 5. Scheme of hydrological flowpaths through the studied ice-debris landform assemblage.
The mentioned water flows are directed towards the rock glacier, that is located between the hydrological system of the debris-covered glacier and the outlet spring at the moraine. Thus, the rock glacier would have a role storing long-term water in form of ground ice and ice-rich permafrost, and routing short-term water flows. At the studied ice-debris landform transition, shallow water flow may be transferred from the debris-covered to the rock glacier (Figure 5), as similar hydrological features characterise the debris layer of the former and the active layer of the other. At depth, there is a progression from massive ice, which impedes vertical flows to occur, to a fragmented ice-rich permafrost body downstream. This structure enables the existence of intra-permafrost flow areas that prevents a long permanence of supra-permafrost waters, being infiltrated relatively rapidly compared to the existence of a continuous permafrost body (e.g., Rogger et al., 2017; Kellerer-Pirklbauer and Kaufmann, 2018; de Pasquale et al., 2022).
Therefore, the rock glacier is capable of routing flows from supra-permafrost regions, as intra-permafrost flow, to deeper sites, even reaching the interface with the basement where an unfrozen baselayer may allow it to progress in the form of sub-permafrost or baseflow (Wagner et al., 2020). This flow could correspond to the net outflow of the landform assemblage since no surface flow nor emergence is observed at the front or lateral margins of the rock glacier, which would be more likely if the ice distribution were heterogenous and internal subvertical pathways were blocked. Alternatively, water is probably being transferred subsuperficially to the contiguous moraine to emerge through the only spring visible in the glacier complex (see Figure 1).
Similar flow paths have been suggested for other intact rock glaciers worldwide. Supra-permafrost flow has been observed in other mountain permafrost landforms in the Canadian Rockies (e.g., Langston et al., 2011), the Andes (e.g., Trombotto-Liaudat et al., 2020; Villarroel et al., 2022) and the Alps (e.g., Rogger et al., 2017), as permafrost impedes its infiltration, evidencing a clear response in the hydrographs, even being heard when standing on it. Sub-permafrost flows have been also deduced to occur in the Argentinean Andes (Trombotto-Liaudat, et al., 2020; Villarroel et al., 2022) and the Alps (Krainer and Mostler, 2002; Ikeda et al., 2008), based on indirect outcomes from hydrochemical and geodetic studies. The existence of stratigraphical levels of unfrozen sediment below the permafrost body with the capacity to form a slow groundwater flow has been observed in borehole studies on rock glaciers in the Alps (i.e., Krainer et al., 2015), which may correlate with the observed geophysical association in the present study. Traditionally, a two-water path configuration has been proposed for the hydrological behaviour of rock glaciers, with a supra- and sub-permafrost component (i.e., Giardino et al., 1992; Rogger et al., 2017; Harrington et al., 2018; Wagner et al., 2020). However, a three different water path configuration have also been recently suggested, considering the intraflow, based on indirect hydrochemical investigations in the Alps (Krainer and Mostler, 2002; Ikeda et al., 2008) and the Argentinean Andes (Trombotto-Liaudat et al., 2020; Villarroel et al., 2022) for intact rock glaciers, an approach which would be useful at the studied site to confirm what has been observed in the geophysics at the rock glacier base.
Therefore, active layer dynamics and intra-permafrost pathways seems to control short-term water release, which has been observed to help to sustain baseflow during summer (Croce and Milana, 2002; Harrington et al., 2018; Wagner et al., 2021a; Arenson et al., 2022). Supra-permafrost water storage is also observed to be enhanced by furrow and ridge topography of the studied rock glacier, tending to higher water content in depressions as seen here, for example at 540 and 600 m, concordant with previous suggestions by Halla et al. (2021) and de Pasquale et al. (2022). Overall, we conclude that rock glaciers play an important role in the local catchment hydrology routing and moderating short-term discharge by enhancing infiltration processes during water availability periods, water retention and interaction with sub-permafrost compartment and, potentially, with underlying aquifers.
Research on rock glacier hydrology has suggested that rock glaciers contribution per unit area to annual streamflow is likely to be minimal compared to other glacier types, due to the efficient thermal insulation effect of the thick debris cover on permafrost thawing (Arenson et al., 2022). However, there is evidence of ground ice thawing due to recent climate warming in the semiarid Andes (de Pasquale et al., 2022; Robson et al., 2022) and an important contribution by the end of summer (Schaffer et al., 2019) and long-term reservoir function (Janke et al., 2017; Jones et al., 2018; Schaffer et al., 2019; Wagner et al., 2021b). Regardless, volumetric ice of Andean rock glaciers has just been recently assessed (Halla et al., 2021; de Pasquale et al., 2022; Hilbich et al., 2022; Mathys et al., 2022) and its three-dimensional spatial distribution is still poorly known, which is important to better visualise as permafrost acts as a barrier to water flow (e.g., Arenson et al., 2022). In this study, we have observed the existence of ground ice, likely segregated from the debris-covered glacier into the rock glacier. That ice distribution is not uniform across the landform, as seen here for slightly different subsurface sections, and therefore this assumption may lead to a misestimation of the amount of water stored or potential water production from these landforms.
5.4 Implications for water resources and future perspectives
The transition between ice-debris landforms has been previously discussed in geomorphological and evolutive terms, but the impact of the internal structure change involved in this process on the hydrology of deglaciating environments has not been widely considered. In the current warming climate scenario, with glaciers thinning and losing mass on a global scale, the Andes present some of the highest rates of glacier mass loss (Dussaillant et al., 2019; Masiokas et al., 2020). In addition, outputs from runoff contribution models in the Southern Andes show that most of these glaciers have already reached, or will soon, their peak water with a decrease in runoff thereafter (Huss and Hock, 2018; Burger et al., 2019; Ayala et al., 2020). Hence, as seasonal water availability decreases, ice-debris landforms will contribute a larger component of baseflow to rivers and streams (Janke et al., 2015; Schaffer and MacDonell, 2022).
In a warming climate, it is expected that in arid mountain regions debris-free glaciers and debris-covered glaciers may evolve towards rock glaciers (Janke et al., 2017; Anderson et al., 2018; Kellerer-Pirklbauer and Kaufmann, 2018; Schaffer and MacDonell, 2022; Navarro et al., 2023), thereby affecting water storage, production and transfer. The results of this study show that the debris-covered glacier has a different capacity to store and transfer water flow than the rock glacier. This is related to a high storage capacity and low possibility to infiltrate flows to subglacial areas for the former, and a higher capacity to transmit vertical and horizontal flows of the latter. Ice volumes will diminish in deglaciating mountain environments (Wagner et al., 2021b), but over time remaining ice may become more insulated by sediment (Schaffer and MacDonell, 2022). In parallel, there may be a potential enhancement of water being infiltrated to greater depths due to the fragmented or absence of impermeable bodies of the evolved landforms, causing higher groundwater flow and longer residence times since flows are more likely to deepen and transfer through the subsurface compartment. This could also cause poorer water quality and lower and delayed discharge as has been observed previously for periglacial landforms (Pourrier et al., 2014; Rogger et al., 2017; Harrington et al., 2018; Trombotto-Liaudat et al., 2020; Villarroel et al., 2022). Therefore, it is recommendable that studies focusing on the impact of cryospheric change on water availability also consider changes to storage and routing processes caused by the evolution of glacier types.
6 Conclusion
The hydrological significance of different internal structures of a ice-debris landform assemblage have been explored by studying a semiarid Andean glacier complex in northern Chile through multiple geophysical methods. The debris-covered glacier is characterised by a buried massive ice body below an air-filled debris layer that is sometimes impacted by topographic depressions with supraglacial lakes and potential related perched water levels. This internal structure implies a significant water storage capacity and a possibly highly transmissive medium linked to the superficial debris layer. Contrastingly, the rock glacier presents a heterogenous configuration consisting of debris with ground ice (ice lenses and/or interstitial ice) or water filling the voids, composed by a main ice-rich permafrost body that is discontinued by intra-permafrost areas with low to null ice content. This zone enables the existence of vertical pathways through the rock glacier. At depth, this intra-permafrost flows are connected to a zone of debris with water in the pore space, i.e., baseflow, both of which would help drain water from the landform assemblage to downstream by transferring it subsuperficially to the contiguous moraine and enhance the connectivity to deep groundwater systems. A gradual geomorphological transition exists between these ice-debris landforms, as the debris layer thickens downhill and progresses to form the active layer of the rock glacier. At depth, the massive ice is segregated into ground ice to constitute the ice-rich permafrost body of the downstream rock glacier.
In a warming climate, deglaciating environments will likely cause the evolution from glacial to periglacial landforms, impacting the hydrological system in not only terms of water storage but also in water routing, as rock glaciers modify water flow, enhancing infiltration and delaying streamflow. With the peak water of the majority of Andean glaciers already reached and decreasing precipitation trends, the expansion of periglacial area in expense of glacial ones will worsen water reserves and supplies from semiarid headwaters, and we consider that this impact should be included into modelling studies.
Data availability statement
The raw data supporting the conclusion of this article will be made available by the authors, without undue reservation.
Author contributions
GN, RV, and SM conceptualised the study and data collection design. GN led the study and conducted data collection, processing and analysis. RV, SM, GdP, and JPD participated in data analysis, and RV and SM perform project supervision. GN wrote the initial manuscript draft. All authors read, edited and approved the final version of the manuscript.
Funding
GN was financially supported by Agencia Nacional de Investigación y Desarrollo (ANID)/scholarship program/Doctorado Nacional/2021-21210918, Universidad de La Serena and Centro de Estudios Avanzados en Zonas Áridas (CEAZA). The study was additionally supported by ECOS-ANID project 210044/C21U02 and ANID-CENTROS REGIONALES R20F0008.
Acknowledgments
The authors would like to thank the CEAZA Glaciology group for logistical and fieldwork support, and Esteban Sáez, Gonzalo Yáñez and the Pontificia Universidad Católica de Chile for supplying the refraction seismic equipment. The authors also thank Benjamin Robson for providing the aerial image and the elevation change raster of their work. We also thank the University of Avignon and Waterways Centre at Canterbury and Lincoln universities for providing use of their facilities during the analysis and writing of this manuscript. Finally, we would like to thank the editor and the reviwers for their clarifying comments and observations that helped to improve this article.
Conflict of interest
The authors declare that the research was conducted in the absence of any commercial or financial relationships that could be construed as a potential conflict of interest.
Publisher’s note
All claims expressed in this article are solely those of the authors and do not necessarily represent those of their affiliated organizations, or those of the publisher, the editors and the reviewers. Any product that may be evaluated in this article, or claim that may be made by its manufacturer, is not guaranteed or endorsed by the publisher.
Supplementary material
The Supplementary Material for this article can be found online at: https://www.frontiersin.org/articles/10.3389/feart.2023.1102620/full#supplementary-material
Supplementary Figure S1 | Locations of geophysical survey profiles on Tapado glacier complex.
Supplementary Figure S2 | Geophysical models (ERT and RST) for cross-sections T1, T2, T3, and T4.
Supplementary Figure S3 | Geophysical models for ERT (A) and GPR (B) for the ice-debris landform assemblage from 2021 observations. Upper debris-covered glacier (DCG)—lower DCG—rock glacier boundaries are displayed as dashed red lines. Resistivity colour bar is in logarithmic scale. CMP, Common Mid-Point survey.
Supplementary Figure S4 | Electromagnetic wave velocity distribution from Common Mid-Point 2 (CMP2).
References
Anderson, R. S., Anderson, L. S., Armstrong, W. H., Rossi, M. W., and Crump, S. E. (2018). Glaciation of alpine valleys: The glacier–debris-covered glacier–rock glacier continuum. Geomorphology 311, 127–142. doi:10.1016/j.geomorph.2018.03.015
Annan, A. P., and Davis, J. L. (1976). Impulse radar sounding in permafrost. Radio Sci. 11, 383–394. doi:10.1029/RS011i004p00383
Arenson, L. U., Harrington, J. S., Koenig, C. E., and Wainstein, P. A. (2022). mountain permafrost hydrology—a practical review following studies from the Andes. Geosciences 12 (2), 48. doi:10.3390/geosciences12020048
Ayala, A., Pellicciotti, F., MacDonell, S., McPhee, J., Vivero, S., Campos, C., et al. (2016). Modelling the hydrological response of debris-free and debris-covered glaciers to present climatic conditions in the semiarid Andes of central Chile. Hydrol. Process. 30 (22), 4036–4058. doi:10.1002/hyp.10971
Ayala, Á., Farías-Barahona, D., Huss, M., Pellicciotti, F., McPhee, J., and Farinotti, D. (2020). Glacier runoff variations since 1955 in the Maipo River basin, in the semiarid Andes of central Chile. Cryosphere 14 (6), 2005–2027. doi:10.5194/tc-14-2005-2020
Azócar, G. F., and Brenning, A. (2010). Hydrological and geomorphological significance of rock glaciers in the dry Andes, Chile (27°–33° S). Permafr. Periglac. Process. 21 (1), 42–53. doi:10.1002/ppp.669
Barcaza, G., Nussbaumer, S. U., Tapia, G., Valdés, J., García, J. L., Videla, Y., et al. (2017). Glacier inventory and recent glacier variations in the Andes of Chile, South America. Ann. Glaciol. 58 (75), 166–180. doi:10.1017/aog.2017.28
Bolch, T., Rohrbach, N., Kutuzov, S., Robson, B. A., and Osmonov, A. (2019). Occurrence, evolution and ice content of ice-debris complexes in the Ak-Shiirak, Central Tien Shan revealed by geophysical and remotely-sensed investigations. Earth Surf. Process. landforms 44 (1), 129–143. doi:10.1002/esp.4487
Burger, F., Ayala, A., Farias, D., Shaw, T. E., MacDonell, S., Brock, B., et al. (2019). Interannual variability in glacier contribution to runoff from a high-elevation andean catchment: Understanding the role of debris cover in glacier hydrology. Hydrol. Process. 33 (2), 214–229. doi:10.1002/hyp.13354
Croce, F. A., and Milana, J. P. (2002). Internal structure and behaviour of a rock glacier in the arid Andes of Argentina. Permafr. Periglac. Process. 13 (4), 289–299. doi:10.1002/ppp.431
Daniels, J. J., Reza Ehsani, M., and Allred, B. J. (2008). “Ground-penetrating radar methods (GPR),” in Handbook of agricultural geophysics. Editors B. J. Allred, J. J. Daniels, and M. Reza Ehsani (New York: Taylor and Francis), 129–146.
de Pasquale, G., Valois, R., Schaffer, N., and MacDonell, S. (2022). Contrasting geophysical signatures of a relict and an intact Andean rock glacier. Cryosphere 16 (5), 1579–1596. doi:10.5194/tc-16-1579-2022
Dirección General de Aguas (2022). Inventario público de glaciares, actualización 2022. Available at: https://dga.mop.gob.cl/Paginas/InventarioGlaciares.aspx (Accessed September 15, 2022).
Dussaillant, I., Berthier, E., Brun, F., Masiokas, M., Hugonnet, R., Favier, V., et al. (2019). Two decades of glacier mass loss along the Andes. Nat. Geosci. 12 (10), 802–808. doi:10.1038/s41561-019-0432-5
Favier, V., Falvey, M., Rabatel, A., Praderio, E., and López, D. (2009). Interpreting discrepancies between discharge and precipitation in high-altitude area of Chile's Norte Chico region (26–32° S). Water Resour. Res. 45 (2). doi:10.1029/2008WR006802
Fernández-Fernández, J. M., Palacios, D., Andrés, N., Schimmelpfennig, I., Tanarro, L. M., Brynjólfsson, S., et al. (2020). Constraints on the timing of debris-covered and rock glaciers: An exploratory case study in the hólar area, northern Iceland. Geomorphology 361, 107196. doi:10.1016/j.geomorph.2020.107196
Fyffe, C. L., Brock, B. W., Kirkbride, M. P., Mair, D. W. F., Arnold, N. S., Smiraglia, C., et al. (2019). Do debris-covered glaciers demonstrate distinctive hydrological behaviour compared to clean glaciers? J. Hydrology 570, 584–597. doi:10.1016/j.jhydrol.2018.12.069
Giardino, J. R., Vitek, J. D., and Demorett, J. L. (1992). “A model of water movement in rock glaciers and associated water characteristics,” in Periglacial geomorphology: Proceedings of the 22nd annual binghamton symposium in geomorphology. Editors J. C. Dixon, and A. D Abrahams (Chichester, New York): Wiley), 159–184.
Ginot, P., Kull, C., Schotterer, U., Schwikowski, M., and Gäggeler, H. W. (2006). Glacier mass balance reconstruction by sublimation induced enrichment of chemical species on Cerro Tapado (Chilean Andes). Clim. Past 2 (1), 21–30. doi:10.5194/cp-2-21-2006
Günther, T., Rücker, C., and Spitzer, K. (2006). Three-dimensional modelling and inversion of DC resistivity data incorporating topography-II. Inversion. Geophys. J. Int. 166, 506–517. doi:10.1111/j.1365-246X.2006.03011.x
Halla, C., Blöthe, J. H., Tapia Baldis, C., Trombotto Liaudat, D., Hilbich, C., Hauck, C., et al. (2021). Ice content and interannual water storage changes of an active rock glacier in the dry Andes of Argentina. Cryosphere 15 (2), 1187–1213. doi:10.5194/tc-15-1187-2021
Harrington, J. S., Mozil, A., Hayashi, M., and Bentley, L. R. (2018). Groundwater flow and storage processes in an inactive rock glacier. Hydrol. Process. 32 (20), 3070–3088. doi:10.1002/hyp.13248
Hauck, C., and Kneisel, C. (2008). Applied geophysics in periglacial environments. Cambridge University Press.
Hilbich, C., Hauck, C., Mollaret, C., Wainstein, P., and Arenson, L. U. (2022). Towards accurate quantification of ice content in permafrost of the Central Andes–Part 1: Geophysics-based estimates from three different regions. Cryosphere 16 (5), 1845–1872. doi:10.5194/tc-16-1845-2022
Huss, M., and Hock, R. (2018). Global-scale hydrological response to future glacier mass loss. Nat. Clim. Change 8 (2), 135–140. doi:10.1038/s41558-017-0049-x
Ikeda, A., Matsuoka, N., and Kääb, A. (2008). Fast deformation of perennially frozen debris in a warm rock glacier in the Swiss Alps: An effect of liquid water. J. Geophys. Res. Earth Surf. 113 (F1), F01021. doi:10.1029/2007JF000859
Irvine-Fynn, T. D., Porter, P. R., Rowan, A. V., Quincey, D. J., Gibson, M. J., Bridge, J. W., et al. (2017). Supraglacial ponds regulate runoff from Himalayan debris-covered glaciers. Geophys. Res. Lett. 44 (23), 11,894–11,904. doi:10.1002/2017GL075398
Janke, J. R., Bellisario, A. C., and Ferrando, F. A. (2015). Classification of debris-covered glaciers and rock glaciers in the Andes of central Chile. Geomorphology 241, 98–121. doi:10.1016/j.geomorph.2015.03.034
Janke, J. R., Ng, S., and Bellisario, A. (2017). An inventory and estimate of water stored in firn fields, glaciers, debris-covered glaciers, and rock glaciers in the Aconcagua River Basin, Chile. Geomorphology 296, 142–152. doi:10.1016/j.geomorph.2017.09.002
Jones, D. B., Harrison, S., Anderson, K., and Betts, R. A. (2018). Mountain rock glaciers contain globally significant water stores. Sci. Rep. 8, 2834. doi:10.1038/s41598-018-21244-w
Jones, D. B., Harrison, S., and Anderson, K. (2019a). Mountain glacier-to-rock glacier transition. Glob. Planet. Change 181, 102999. doi:10.1016/j.gloplacha.2019.102999
Jones, D. B., Harrison, S., Anderson, K., and Whalley, W. B. (2019b). Rock glaciers and mountain hydrology: A review. Earth-Science Rev. 193, 66–90. doi:10.1016/j.earscirev.2019.04.001
Kellerer-Pirklbauer, A., and Kaufmann, V. (2018). Deglaciation and its impact on permafrost and rock glacier evolution: New insight from two adjacent cirques in Austria. Sci. Total Environ. 621, 1397–1414. doi:10.1016/j.scitotenv.2017.10.087
Krainer, K., Bressan, D., Dietre, B., Haas, J. N., Hajdas, I., Lang, K., et al. (2015). A 10,300-year-old permafrost core from the active rock glacier Lazaun, southern Ötztal Alps (South Tyrol, northern Italy). Quat. Res. 83 (2), 324–335. doi:10.1016/j.yqres.2014.12.005
Krainer, K., and Mostler, W. (2002). Hydrology of active rock glaciers: Examples from the Austrian Alps. Arct. Antarct. Alp. Res. 34 (2), 142–149. doi:10.1080/15230430.2002.12003478
Langston, G., Bentley, L. R., Hayashi, M., McClymont, A. F., and Pidlisecky, A. (2011). Internal structure and hydrological functions of an alpine proglacial moraine. Hydrol. Process. 25, 2967–2982. doi:10.1002/hyp.8144
Loke, M. H., and Barker, R. D. (1996). Rapid least-squares inversion of apparent resistivity pseudosections by a quasi-Newton method1. Geophys. Prospect. 44 (1), 131–152. doi:10.1111/j.1365-2478.1996.tb00142.x
Masiokas, M. H., Rabatel, A., Rivera, A., Ruiz, L., Pitte, P., Ceballos, J. L., et al. (2020). A review of the current state and recent changes of the Andean cryosphere. Front. Earth Sci. 8, 99. doi:10.3389/feart.2020.00099
Mathys, T., Hilbich, C., Arenson, L. U., Wainstein, P. A., and Hauck, C. (2022). Towards accurate quantification of ice content in permafrost of the Central Andes–Part 2: An upscaling strategy of geophysical measurements to the catchment scale at two study sites. Cryosphere 16 (6), 2595–2615. doi:10.5194/tc-16-2595-2022
Milana, J. P., and Güell, A. (2008). Diferencias mecánicas e hídricas del permafrost en glaciares de rocas glacigénicos y criogénicos, obtenidas de datos sísmicos en El Tapado, Chile. Rev. Asoc. Geol. Argent. 63 (3), 310–325.
Monnier, S., and Kinnard, C. (2017). Pluri-decadal (1955–2014) evolution of glacier–rock glacier transitional landforms in the central Andes of Chile (30–33° S). Earth Surf. Dyn. 5 (3), 493–509. doi:10.5194/esurf-5-493-2017
Monnier, S., and Kinnard, C. (2015). Reconsidering the glacier to rock glacier transformation problem: New insights from the central Andes of Chile. Geomorphology 238, 47–55. doi:10.1016/j.geomorph.2015.02.025
Monnier, S., Kinnard, C., Surazakov, A., and Bossy, W. (2014). Geomorphology, internal structure, and successive development of a glacier foreland in the semiarid Chilean Andes (Cerro Tapado, upper Elqui Valley, 30 08′ S., 69 55′ W.). Geomorphology 207, 126–140. doi:10.1016/j.geomorph.2013.10.031
Navarro, G., MacDonell, S., and Valois, R. (2023). A conceptual hydrological model of semiarid Andean headwater systems in Chile. Prog. Phys. Geogr. Earth Environ. 2023, 030913332211476. doi:10.1177/03091333221147649
Nicholson, L. I., McCarthy, M., Pritchard, H. D., and Willis, I. (2018). Supraglacial debris thickness variability: Impact on ablation and relation to terrain properties. Cryosphere 12 (12), 3719–3734. doi:10.5194/tc-12-3719-2018
Pourrier, J., Jourde, H., Kinnard, C., Gascoin, S., and Monnier, S. (2014). Glacier meltwater flow paths and storage in a geomorphologically complex glacial foreland: The case of the Tapado glacier, dry Andes of Chile (30° S). J. Hydrology 519, 1068–1083. doi:10.1016/j.jhydrol.2014.08.023
Ribolini, A., Chelli, A., Guglielmin, M., and Pappalardo, M. (2007). Relationships between glacier and rock glacier in the Maritime Alps, schiantala valley, Italy. Quat. Res. 68 (3), 353–363. doi:10.1016/j.yqres.2007.08.004
Robain, H., and Bobachev, A. (2017). X2IPI tool box for 2D electrical resistivity tomography and IP measurements user manual, 54.
Robson, B. A., MacDonell, S., Ayala, Á., Bolch, T., Nielsen, P. R., and Vivero, S. (2022). Glacier and rock glacier changes since the 1950s in the La Laguna catchment, Chile. Cryosphere 16 (2), 647–665. doi:10.5194/tc-16-647-2022
Rogger, M., Chirico, G. B., Hausmann, H., Krainer, K., Brückl, E., Stadler, P., et al. (2017). Impact of mountain permafrost on flow path and runoff response in a high alpine catchment. Water Resour. Res. 53, 1288–1308. doi:10.1002/2016WR019341
Rücker, C., Günther, T., and Spitzer, K. (2006). Three-dimensional modelling and inversion of dc resistivity data incorporating topography-I. Modelling. Geophys. J. Int. 166, 495–505. doi:10.1111/j.1365-246X.2006.03010.x
Rücker, C., Günther, T., and Wagner, F. M. (2017). pyGIMLi: An open-source library for modelling and inversion in geophysics. Comput. Geosciences 109, 106–123. doi:10.1016/j.cageo.2017.07.011
Schaffer, N., and MacDonell, S. (2022). Brief communication: A framework to classify glaciers for water resource evaluation and management in the southern Andes. Cryosphere 16 (5), 1779–1791. doi:10.5194/tc-16-1779-2022
Schaffer, N., MacDonell, S., Réveillet, M., Yáñez, E., and Valois, R. (2019). Rock glaciers as a water resource in a changing climate in the semiarid Chilean Andes. Reg. Environ. Change 19 (5), 1263–1279. doi:10.1007/s10113-018-01459-3
Seppi, R., Carturan, L., Carton, A., Zanoner, T., Zumiani, M., Cazorzi, F., et al. (2019). Decoupled kinematics of two neighbouring permafrost creeping landforms in the Eastern Italian Alps. Earth Surf. Process. Landforms 44 (13), 2703–2719. doi:10.1002/esp.4698
Sinclair, K. E., and MacDonell, S. (2016). Seasonal evolution of penitente glaciochemistry at Tapado Glacier, northern Chile. Hydrol. Process. 30 (2), 176–186. doi:10.1002/hyp.10531
Trombotto-Liaudat, D., Sileo, N., and Dapeña, C. (2020). Periglacial water paths within a rock glacier-dominated catchment in the Stepanek area, Central Andes, Mendoza, Argentina. Permafr. Periglac. Process. 31 (2), 311–323. doi:10.1002/ppp.2044
Valois, R., Araya Vargas, J., MacDonell, S., Guzmán Pinones, C., Fernandoy, F., Yánez Carrizo, G., et al. (2021). Improving the underground structural characterization and hydrological functioning of an Andean peatland using geoelectrics and water stable isotopes in semi-arid Chile. Environ. Earth Sci. 80 (1), 41–14. doi:10.1007/s12665-020-09331-6
Villarroel, C. D., Ortiz, D. A., Forte, A. P., Tamburini Beliveau, G., Ponce, D., Imhof, A., et al. (2022). Internal structure of a large, complex rock glacier and its significance in hydrological and dynamic behavior: A case study in the semi-arid Andes of Argentina. Permafr. Periglac. Process. 33 (1), 78–95. doi:10.1002/ppp.2132
Vivero, S., Bodin, X., Farías-Barahona, D., Robson, B. A., MacDonell, S., Schaffer, N., et al. (2021). Combination of aerial, satellite, and UAV photogrammetry for quantifying rock glacier kinematics in the dry Andes of Chile (30°S) since the 1950s. Front. Remote Sens. 42. doi:10.3389/frsen.2021.784015
Wagner, T., Brodacz, A., Krainer, K., and Winkler, G. (2020). Active rock glaciers as shallow groundwater reservoirs, Austrian Alps. Grundwasser 25 (3), 215–230. doi:10.1007/s00767-020-00455-x
Wagner, T., Kainz, S., Helfricht, K., Fischer, A., Avian, M., Krainer, K., et al. (2021b). Assessment of liquid and solid water storage in rock glaciers versus glacier ice in the Austrian Alps. Sci. Total Environ. 800, 149593. doi:10.1016/j.scitotenv.2021.149593
Wagner, T., Kainz, S., Krainer, K., and Winkler, G. (2021a). Storage-discharge characteristics of an active rock glacier catchment in the Innere Ölgrube, Austrian Alps. Hydrol. Process. 35 (5), e14210. doi:10.1002/hyp.14210
Keywords: applied geophysics, cryosphere, debris-covered glacier, mountain hydrology, rock glacier, water transfers
Citation: Navarro G, Valois R, MacDonell S, de Pasquale G and Díaz JP (2023) Internal structure and water routing of an ice-debris landform assemblage using multiple geophysical methods in the semiarid Andes. Front. Earth Sci. 11:1102620. doi: 10.3389/feart.2023.1102620
Received: 19 November 2022; Accepted: 30 March 2023;
Published: 18 April 2023.
Edited by:
Thomas Wagner, University of Graz, AustriaReviewed by:
Jan-Christoph Otto, University of Salzburg, AustriaMasaki Hayashi, University of Calgary, Canada
Copyright © 2023 Navarro, Valois, MacDonell, de Pasquale and Díaz. This is an open-access article distributed under the terms of the Creative Commons Attribution License (CC BY). The use, distribution or reproduction in other forums is permitted, provided the original author(s) and the copyright owner(s) are credited and that the original publication in this journal is cited, in accordance with accepted academic practice. No use, distribution or reproduction is permitted which does not comply with these terms.
*Correspondence: Gonzalo Navarro, Z29uemFsby5uYXZhcnJvQHVzZXJlbmEuY2w=