 Irfan Ullah1,2
 Xin-Min Zeng1,2*
 Saadia Hina3Sidra Syed4
 Xieyao Ma5,6*Vedaste Iyakaremye7Jun Yin5,6Vijay P. Singh8,9
- 1College of Hydrology and Water Resources, Hohai University, Nanjing, China
- 2CMA-HHU Joint Laboratory for Hydrometeorological Studies, Hohai University, Nanjing, China
- 3Department of Environmental Sciences and Engineering, Government College University Faisalabad, Faisalabad, Pakistan
- 4Institute of Peace and Conflicts Studies, University of Peshawar, Peshawar, Pakistan
- 5School of Hydrology and Water Resources, Nanjing University of Information Science and Technology, Nanjing, China
- 6Key Laboratory of Hydrometeorological Disaster Mechanism and Warning of Ministry of Water Resources, Nanjing University of Information Science and Technology, Nanjing, China
- 7Rwanda Meteorology Agency, Kigali, Rwanda
- 8Department of Biological and Agricultural Engineering, Texas A&M University, College Station, TX, United States
- 9Zachry Department of Civil Engineering, Texas A&M University, College Station, TX, United States
In recent decades, water scarcity is a significant constraint for socioeconomic development and threatens livelihood in an agriculture-based developing country like Pakistan. The water crisis in the country is projected to exacerbate in the coming years, especially in the southern parts. This dire situation calls for an investigation of major droughts, associated water scarcity, and changes in teleconnection patterns over Southern Pakistan. Moderate to low Southeastern monsoon (SEM) precipitation triggered the extreme drought episode (2017–2020) over Southern Pakistan and intensified the water scarcity. This study explored the severity of the respective drought event, underlying mechanisms, and changes in water scarcity over Southern Pakistan. To investigate the future changes (1980–2050) in water scarcity, coupling models (global hydrological models (GHMs)-global climate models (GCMs)) have been used to achieve the interannual performance of water availability and total water consumption. Besides, future scenarios used in this study are the combinations of SSPs and RCPs, including middle-of-the-road (SSP1-RCP4.5) and fossil-fueled development (SSP2-RCP8.5). The findings indicated a precipitation deficit of 45% during the 4-year (2017–2020), depicting the worst events in the past 50 years. South Pakistan observed the worst SEM droughts over the last 50 years, as 2000–2005 was the worst drought (precipitation deficit of 75%), followed by 2017–2020 with a 49% of precipitation deficit. Water scarcity was exacerbated by the extreme dry spells that developed over most of southern Pakistan between 2017 and 2020 as a result of moderate-to-exceptionally low SEM precipitation. Furthermore, this drought episode was accompanied by the cool phase in the Pacific and equatorial Indian Oceans. The future changes in water scarcity over the southern regions of Pakistan present a sharp increase under the SSP2-RCP8.5 scenario and are anticipated to be intensified in already stressed regions. This research is essential for environmentalists, and water resources managers, and provided crucial information to identify the hot spot areas in the target region so that water scarcity problems could be reduced in the future.
1 Introduction
Climate change is one of the most serious challenges that human-being faces in the twenty-first century, as global mean temperatures and carbon dioxide (CO2) levels rise (Kumar et al., 2021a). However, climatic disasters have amplified threefold in the last four decades (Wetter et al., 2014). Climate change agreements have highlighted the need for urgency on these worldwide natural phenomena (Mátyás et al., 2018). Droughts, floods, cyclones, and heatwaves are examples of climate-related extreme events that have a negative influence on water availability, morbidity and mortality, ecosystems, settlements, and infrastructure (Ali et al., 2019; Dahri et al., 2021).
Globally, about ∼1.7 billion individuals were afflicted only by droughts, and about 718 million were affected by storms in the last three decades (Reay et al., 2007; IPCC, 2021). Other than extreme disasters, increasing climate change is causing migrations (Warner et al., 2010). Natural disasters caused a migration of about 19 million individuals from 100 countries around the globe in 2014 and are expected to displace billions of refugees by 2050 (Neumann et al., 2015). Developing countries (e.g., India and China) are among the most affected and are likely to be the most at risk of the consequences of changing climate (Kumar et al., 2021a; 2021b).
Pakistan is a fast-growing world population and is highly susceptible to climate change impacts (Ahmed et al., 2016; Ullah et al., 2021a). Despite its minor contribution (0.8%) to global greenhouse gas (GHG) emissions, Pakistan is ranked 5th among the countries most affected by climate change (Eckstein and Kreft, 2020). Overpopulation, poor urban planning, and less technological development stress environmental sustainability (Ullah et al., 2022a). Over the past decades, several studies presented precipitation variability (Ullah et al., 2022b) and warming trend (0.1°C per decade) in Pakistan (Mahmood and Babel, 2014; Khan et al., 2019; Sajjad et al., 2022). Changes in precipitation patterns result in flash floods and flash droughts, causing human and economic loss together with many social and political effects (Xing et al., 2022). Future climatic changes in Pakistan, projected by different global climate models, highlighted the significant impacts on water availability that will subsequently influence food security, health, and the economy (Ullah et al., 2022a). These issues will most likely occur in the regions where water resources were previously under stress and possibly intensified by the abnormalities in the supply or demand related to changing climate (Ullah et al., 2022e; Iyakaremye et al., 2022; Lu et al., 2022).
Droughts are among the most serious threats, predominantly in Pakistan’s arid regions. Southern Pakistan is enormously prone to the effects of climate change (Ashraf & Routray, 2015a; Ahmed et al., 2016; Naz et al., 2020). Most of the country’s southern region has been greatly hit by droughts with a decrease in precipitation. Fluctuations in rainfall patterns caused by large-scale drivers (South Asian summer monsoon and ENSO) have caused severe dry/warm conditions in Pakistan as a result of the warmer climate (Ullah et al., 2022c). Over Pakistan, the monsoon currents flow divide into two branches: the Southeastern monsoon (SEM) and the Northeastern monsoon (NEM). NEM, on the other hand, refers to the glanced monsoon fluxes that originate in the Bay of Bengal (BoB) and travel along the Himalayans, causing precipitation in the country’s northeastern regions. Thus, the precipitation is lower in SEM-dominated southeastern regions, whereas NEM-dominated northern areas receive higher precipitation (Ahmed et al., 2018).
It is worth noting that there has been a declining trend in summer monsoon rainfall over southern Pakistan and an increasing trend over northern Pakistan in recent decades. This trend pattern may be caused by increased moisture transport together with warmer SSTs, southwesterly/southerly tide over the Arabian Sea (AS), and a westward movement of the South Asian monsoon trough (Preethi et al., 2017). As a result, the monsoon rainfall has augmented considerably in the northern regions of Pakistan, whereas a substantial decrease was noticed from western to southern areas that are declared drought-prone regions of the country (Hina et al., 2021; Ullah et al., 2022c). The drought episode of 1999–2002 is considered the most devastating that affected about 2,200,000 individuals across the country and in human and animal losses, crop failures, and large-scale migrations (Ahmad et al., 2018).
Droughts occur approximately four times every 10 years in Pakistan, with the southern region being the most exposed to hydrological threats due to its arid climatic conditions (Jamro et al., 2019). About 80% of the region’s orchards were devastated by these prolonged droughts, which also reduced food output and killed about 2 million animals (Ahmed et al., 2018). Furthermore, recurrent droughts and increased water withdrawal led to a substantial decline in the water table (Neumann et al., 2015). With the increase in evapotranspiration, decrease in precipitation, and surface water resources, Pakistan will be a water-scarce country soon will threaten the food security, job market, and economic state (Khan et al., 2019; Sein et al., 2022a).
Despite the severe influences of the droughts in Southern Pakistan, their links to water scarcity, and drivers remain unknown. This study emphasized the 2017–2020 drought, compute its severity, explore its associations with regional and global ocean-atmosphere variability, and calculate the water scarcity under historical and future scenarios. The current study is unprecedented in Pakistan and one of a kind. Therefore, this study is paramount for researchers and policymakers in water resource management.
2 Study area
South Pakistan is predominantly situated in the SEM region. The region, which comprises approximately 44% of Pakistan’s landmass and is home to about 8.5 million people, where one-fourth of the country’s total population, and spans an area of 348,000 km2 (Ahmed et al., 2018). Over 85% of the rural population in South Pakistan relies on crop growing for livelihood, making it the region’s agricultural heartland (Ahmed et al., 2016; Naz & Ansari, 2020). Therefore, the population largely depends on the dominant SEM for agriculture production and livestock. The diverse variation in climate severely pretentious the agriculture of the region in the recent past (Hussain et al., 2017). The precipitation fluctuates from <30 mm/year in the desert part (southwest) to >400 mm/year in the mountainous region. Since the region is largely categorized by an arid, hyper-arid, and semi-arid climate, most regions have less than 100 mm precipitation during both agricultural seasons (i.e., Rabi season: starting from November to April and Kharif season: starting from May to October) (Ullah et al., 2022d). The detailed in situ stations and selected target regions (South Pakistan) are presented in Figure 1.
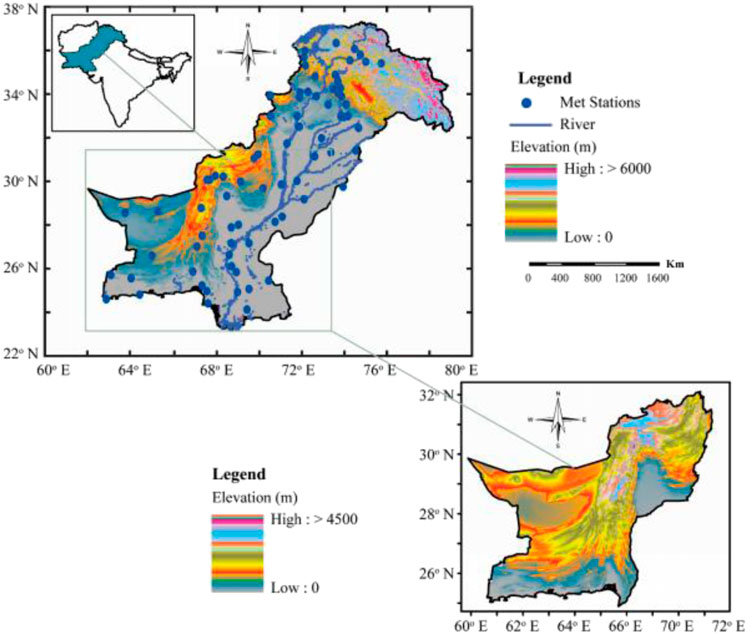
FIGURE 1. Study area map along with elevation and 75 meteorological stations obtained from Pakistan Meteorological Department (PMD).
3 Data and methods
3.1 Datasets
The present study uses a daily precipitation dataset of 75 meteorological stations obtained from the Pakistan Meteorological Department (PMD) from 1980 to 2020. The density of these in situ observatories changes from one region to another across the country; however, the datasets are reliable and used for many climate studies. These 75 meteorological stations are distributed across Pakistan, where 35 stations cover South Pakistan. The daily in situ observation dataset has been quality controlled and will be used in future PMD operations. A widely used statistical technique, the standardized normalized homogeneity test (SNHT) is used to ensure quality, consistency, homogeneity, and robust results. Ullah et al. (2021a) used station observations from PMD to evaluate the gridded precipitation and temperature datasets with reanalysis products for drought investigation over Pakistan. More details can be obtained from previous studies using in situ observation from PMD for different climatological and meteorological studies (Naz & Ansari, 2020; Sein et al., 2021; Ullah et al., 2022).
Total Water Storage (TWS) products from the Gravity Recovery and Climate Experiment (GRACE) and GRACE follow-on (GRACE-FO) missions between the years 2002 and 2020 were used in the study. GRACE satellite provides the TWS dataset from 2002 to 2017 (April-June), while the GRACE-FO mission has onward from June 2018 to till-date. Therefore, this study used the TWS dataset from both the GRACE and GRACE-FO missions. Note that, from 2017 to 2018 (July-May), the TWS data is not available. The GRACE mascon dataset (RL06-V2) consists of (at 0.5° spatial resolution) monthly gridded water storage anomalies relative to the mean. The seasonal cycle and monthly mean of each month were subtracted from the TWS dataset in this study using scale factors.
Following that, we used monthly data from the Extended Reconstructed SST dataset version-5 (with a spatial resolution of 0.1°) from 1980 to 2020 to explore the effect of sea surface temperatures (SSTs) on the recent past drought (2017–2020). We retrieved the monthly 2 m surface air temperature (SAT), sea level pressure (SLP), and wind speed (u; v) at 850 hPa for the 1980–2020 time period from the latest version of ERA–5, so that better understand the physical mechanism of the SEM. We brought all datasets into a common
The current study employs an ensemble of four integrated global hydrological models (GHMs) and four global climate models (GCMs) to achieve the decadal performance of water availability and total water consumption products from 1890 to 2050 to investigate future changes in water scarcity. The future scenarios are obtained considering different shared socioeconomic pathways (SSPs) corresponding to the global representative concentration pathways (RCPs) radiative forcing (Eyring et al., 2016; Meehl et al., 2020). Future scenarios used in the present study are the combinations of SSPs and RCPs, which include middle-of-the-road (SSP1-RCP4.5) and fossil-fueled development (SSP2-RCP8.5) (Jones and O’Neill, 2016), respectively. This study adopted different sources for collecting data due to the varied output of the models, i.e., Inter-sectoral Impact Model Inter-comparison Project (ISIMIP) and ISIMIP-2b fast-track for water availability and irrigation purposes (Frieler et al., 2017; Munia et al., 2020). SIMIP includes a broad range of GHMs that are aimed to record both human water use and water availability (Warszawski et al., 2014). The model’s data is available at
3.2 Methods
The present study uses a standarized precipitation index (SPI) to explore the drought events in the respective two epochs over the region. SPI makes it easier to analyze droughts over time by comparing the precipitation totals from a specific period to the recorded years (McKee et al., 1993). During SPI computation, monthly precipitation data of each station (in situ observation) were fitted with distribution functions. In the recent past, various drought indices have been developed for drought assessment and identification along with drought propagation tracking. The SPI (McKee et al., 1993) and the Standardized Precipitation Evapotranspiration Index (SPEI) are two widely used multi-timescale attributes of meteorological drought indices (Vicente-Serrano et al., 2010). Though the SPEI combines potential evapotranspiration and precipitation using SPI calculation methodology, the outcomes need to be more carefully and rigorously examined (Ullah et al., 2021b). The widely used SPI calculation; is indeed, endorsed by the World Meteorological Organization, as it is one of the most robust drought indices for monitoring meteorological drought worldwide.
Furthermore, the Kolmogorov-Smirnov (KS) test was used to assess the goodness of fit to a specific distribution. SPI provides positive/negative values, with positive/negative values defining wet/dry conditions. The SPI values in the final month of a season were used to calculate the season’s rainfall deficit. To compute droughts in late winter (October-December), for example, a 3-month SPI in December was used because it signifies the precipitation deficit from October to December. Thus, we prefer to use 3-month SPI values at each grid cell for the span of the corresponding SEM dominant region and the target period.
To comprehend the root causes of rainfall deficits, we employed SSTs and SAT to investigate the impacts of anomalous temperature conditions over SEM unprecedented droughts from 1980 to 2020, covering the worst drought events over South Pakistan, i.e., 2000–2005 and 2017–2020, respectively. Given that the SST product has a strong warming trend, the EEMD (ensemble empirical mode decomposition) method was adopted to exclude the secular tendency from the SST time series (Wu and Huang, 2009; Wu et al., 2011). Many previous studies adopted the EEMD approach (Mishra et al., 2021) to eliminate linear and non-linear trends over traditional de-trending. First, we assessed precipitation and SST anomalies for the SEM to explore the possible association between SST and precipitation. After that, we applied the MCA (maximum covariance analysis) technique to quantify the coupled variability of SST and precipitation across the SEM droughts target region (Bretherton et al., 1992). Additionally, when SST was not used, the secular EOF (empirical orthogonal function) was employed to determine the predominant modes of rainfall variability (Hannachi et al., 2007). At the same time, the performance of the MCA together on precipitation and SST, both leading modes of variability, appeared with a strong coupling of both fields’ variations (Mishra et al., 2021b). Therefore, to explore the possible atmospheric drivers during SEM droughts, the SLP and wind speed at 850 hPa anomalies are used from 1980 to 2020.
Next, the secular univariate and multivariate approaches to overcome the predictability of SEM precipitation were used in this study. Hence, we employ the lagged associated anomalies between precipitation and SST over the South Asia (SAS) sub-continent during the SEM to predict October–December (OND) precipitation. The Niño3.4 region SST anomaly was used over the Northern Indian Ocean (Northern IO; 6o–24oN, 40o–100oE) to predict monthly SEM precipitation. The mathematical equations are expressed as:
whereas
Finally, the present study uses total water consumption (TWC) under the SSP1-RCP4.5 and SSP2-RCP8.5 scenarios to estimate the future changes in water scarcity over the target region. The TWC domestic and irrigation sectors are summed up separately, and then the decadal ensemble median is obtained for GHMs and GCMs. The same process was adopted for water availability (combined GHMs and GCMs) by taking the decadal ensemble median across Pakistan. The water availability for South Pakistan was gained by adding the local water availability and water discharge rate and then deducting the discharge water consumption (Kummu et al., 2014; Munia et al., 2020). Further, we compute the water scarcity by using the ratio of local water consumption
To calculate the historical and future changes in water scarcity, we adopt a simple way by subtracting one time period from another for historical and future scenarios. The present study uses the 1980–2050 time period to investigate the change in water scarcity over the study region, just to compare historical and future changes. It can be noted that we look over historical change from 1980 to 2020 (i.e., past (1980–2000) and present (2001–2020)) and future change period 2021–2050 under both SSP1-RCP4.5 and SSP2-RCP8.5 scenarios, respectively. Thus, the below equation represents the change in water scarcity in two consecutive time steps:
4 Results
4.1 Monsoon precipitation variability and unprecedented drought events
Anomalies in area-averaged precipitation linked to SEM show that most of Southern Pakistan witnessed exceptionally low precipitation (>40%) from 2000 to 2005 and from 2017 to 2020 (Figure 2). Besides, annual spatial patterns exhibit higher precipitation during OND over northern foot-hills Hamalyan around 70%, while low annual precipitation at the rate of 25% appeared over SEM dominated region of Southern Pakistan (Supplementary Figure S1). Precipitation anomalies in the SEM from 1980 to 2020 have been calculated to estimate the anomalous deficit years in the historical record (Figures 2, 3 and Supplementary Figures S2, S3). Results showed six pronounced droughts (precipitation anomalies −40 to −60 mm) for the years 1987, 2000, 2001, 2002, 2003, and 2005 in the historical record (see Supplementary Figure S2). In contrast, four severe drought years (i.e., 2017, 2018, 2019, and 2020) have been spotted with precipitation anomalies ranging from −60 to −90 mm during the recent past (Supplementary Figure S3). Similar drought years in Pakistan had also been presented in previous studies (Ullah et al., 2021a; Mie Sein Z. et al., 2021; Hina et al., 2021). The Asian regions observed a long-term drought episode from 1999 to 2002 (Ummenhofer et al., 2013; Miyan, 2015; Shahzaman et al., 2021a; Liu et al., 2021). The strong multivariate ENSO triggered a five-year-long drought episode from 1998 to 2002 in Pakistan, which is categorized as the most devastating drought of the last few decades (Hina et al., 2021; Ullah et al., 2022d).
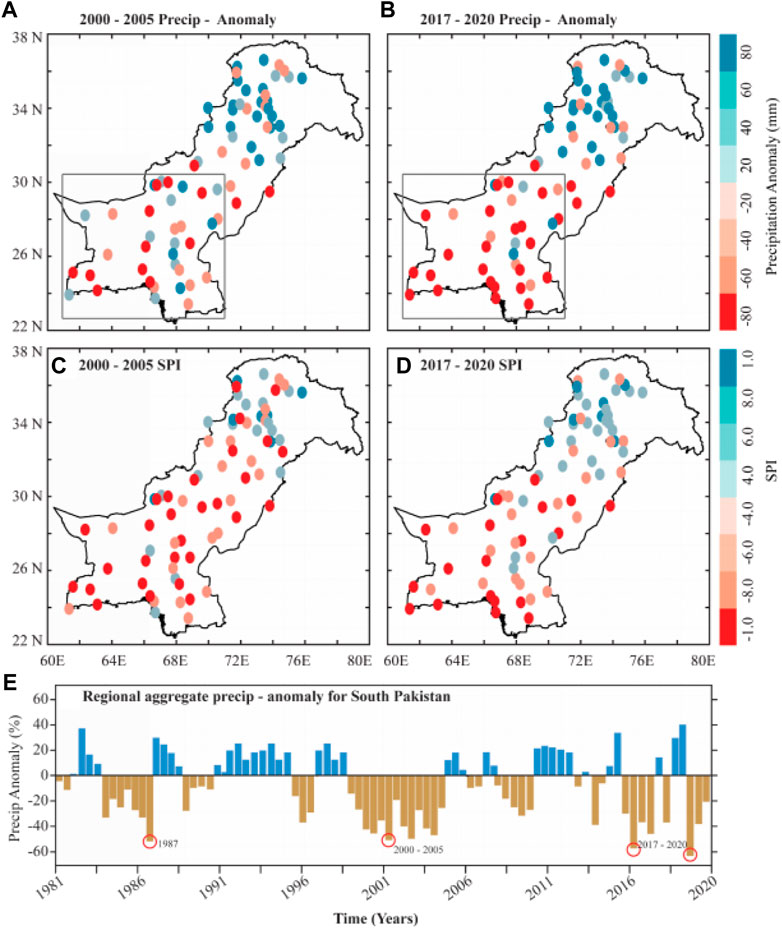
FIGURE 2. Spatial and temporal changes of four-year aggregated precipitation anomalies (mm) during the SEM (October–December; OND). The spatial distribution of 4-year aggregated precipitation anomalies during the recent past (A), 2000–2005) and present (B), 2017–2020) period, respectively, whereas South Pakistan, is represented by the light grey boxes (for the detailed study area and synoptic stations see Figure 1). Similarly, (C, D) represent the drought events using SPI in the respective two epochs over the region. (E) indicated the area-averaged (shown in light grey boxes) of South Pakistan’s 4-year moving mean of the precipitation anomalies (%) spanning from 1981 to 2020. Red circles in (E) delineate the target study region with an interest in two periods of the worst drought in the last 40 years in Pakistan, whereas 2000–2005 was the 1st and 2017–2020 was the 2nd worst drought epoch.
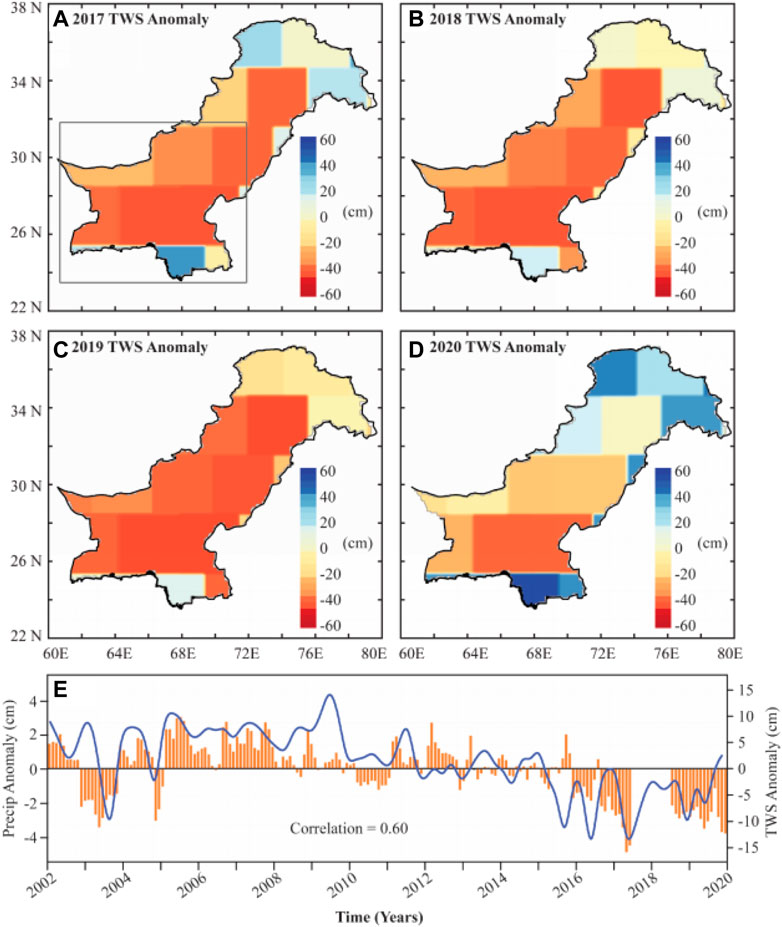
FIGURE 3. Spatial and temporal anomalies of the Total Water Storage (TWS) for the recent-past period 2017–2020 (OND) over Southern Pakistan, i.e., (A) 2017 TWS anomaly, (B) 2018 TWS anomaly, (C) 2019 TWS anomaly, and (D) 2020 TWS anomaly, respectively. The monthly accumulated TWS (12-month moving average precipitation) anomalies presented with an orange bar (blue line) over South Pakistan are shown in (E). The blank space between July 2017 and May 2018 in TWS data indicates missing values, as the GRACE-FO product is available after June 2018.
Results indicate that the drought during 2000–2005 and 2017–2020 are the gravest (see Figures 2A, B). During 2017–2020, South Pakistan experienced the worst SEM droughts, as 2000–2005 was the worst drought (precipitation deficit of 75%) and 2017–2020 was also worse (precipitation deficit of 49%) (Table 1). It should be noted that the eastern and southern parts captured the largest increase in drought severity from −0.8 to −0.6 over a few dominant stations situated in arid and semi-arid areas (Figure 2C). However, most stations exhibit a noteworthy upsurge in drought severity (Figure 2D), excluding the stations positioned in the northern, while larger stations show a substantial decline in SPI with a rate of −0.6 to −0.4, respectively. Additionally, annual precipitation anomalies show dry conditions in 2016 and 2020 (Supplementary Figure S3). Hence, we determine that the 2017–2020 drought episode affected by the catastrophe of SEM shows an enormous precipitation deficit in Southern Pakistan. Overall, the four-year SEM drought of 2017–2020 is more severe than the infamous drought episode of 2000–2005 that gave rise to famine and triggered millions of people deaths. The outcomes suggest that drought severity will upsurge in the target area as a result of recent global warming, with arid and semiarid regions bearing the greatest risk. The more recent 2017–2020 SEM droughts were unprecedented in the previous 50 years, significantly impacted water availability across the study region, and triggered a water calamity in two provinces (Sindh and Baluchistan) in Pakistan.
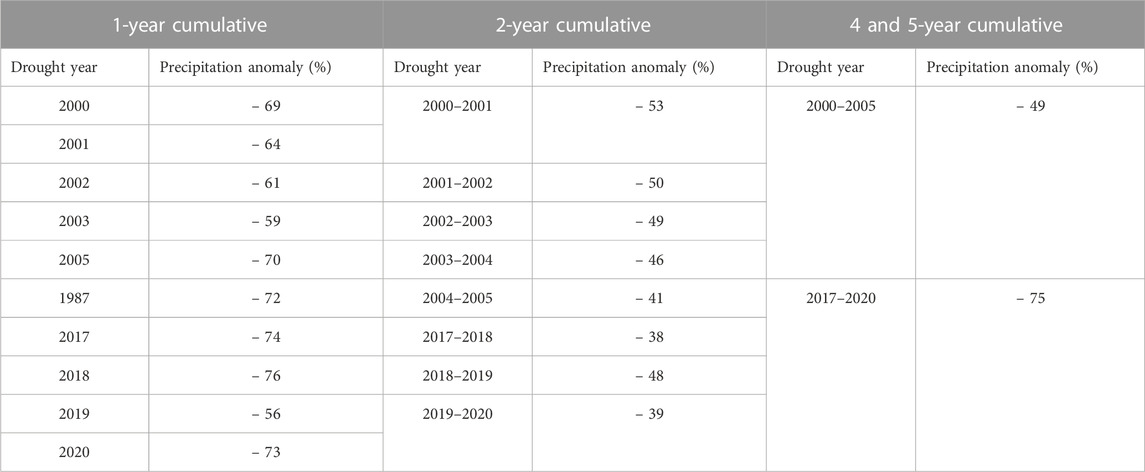
TABLE 1. Illustrates the top four-present and five-past driest years for one, two, and 5-year cumulative SEM (OND).
Figure 3 depicts the spatial and temporal anomalies of TWS for the recent past period 2017–2020 (OND). The results showed a considerable decline in both of the provinces (Sindh and Balochistan) in the Southern region of Pakistan. The 12-month moving average precipitation anomalies present the inception of South Pakistan’s drought during March 2017 and sustained till December 2020 (Figure 3E). Though there was a slow reclamation from the drought for a few months, the precipitation totals were insufficient to negate the overall impact of the event (2017–2020). They can only be a lesson learned from stronger SEM precipitation later than that year. It is also observed that TWS anomalies and 12-month precipitation anomalies (r = 0.60) are well correlated, indicating that precipitation is the primary contributor to TWS (Mishra et al., 2021b). As a result, we aspect the tendency in regional TWS to a four-year drought, which was exacerbated by a deficiency of SEM precipitation.
The 2017–2020 drought triggered a substantial loss in TWS, leading to significant groundwater depletion across the Southern region. It is worth mentioning that we have not estimated the overall groundwater loss while considering the ambiguity in soil moisture (Warner et al., 2010). While this estimate is beyond the range of this study, we are unsure that groundwater reduction was caused by both the drought and amplified groundwater withdrawal (Lehner et al., 2017). Notwithstanding the ambiguity in assessing total water loss by GRACE satellites, the combined effect of surface and groundwater depletion during this event was directed toward anomalous water scarcity in the study region.
4.2 Physical mechanism deficit during southeast monsoon
To better understand the mechanisms behind SEM precipitation variability, we examined the circulation patterns (wind fields at 850 hPa) together with the SAT, SST, and SLP during the OND season for both of the drought phases (2000–2005 and 2017–2020) presented in Figures 4, 5. The annual mean climatology of SAT pattern shows a warm pool (increasing trend) all over Pakistan except in northern areas (see Figure 4A). The warming tendency is also evident in the AS and the BoB. This proposes that the enlargement of convection in the AS might be responsible for the precipitation deficit over the study region (Preethi et al., 2017). The anomalous pattern of SATs reported here also agrees with other studies (Almazroui et al., 2021; Hina et al., 2021). The spatial distribution of annually averaged sea level pressure depicts a high-pressure system (anticyclonic pattern) over northern Pakistan (Himalayan region) whereas a low-pressure system (cyclonic pattern) over southern Pakistan (Figure 4B). The substantial increase in SLP from southwest India up to the BoB and the AS indicates a failure of the monsoon, resulting in passive precipitation in the region (Preethi et al., 2017; Sein et al., 2022b). Moreover, it is anticipated that the circulation patterns may also play an essential role in weakening the processes that ought to yield reduced SEM precipitation.
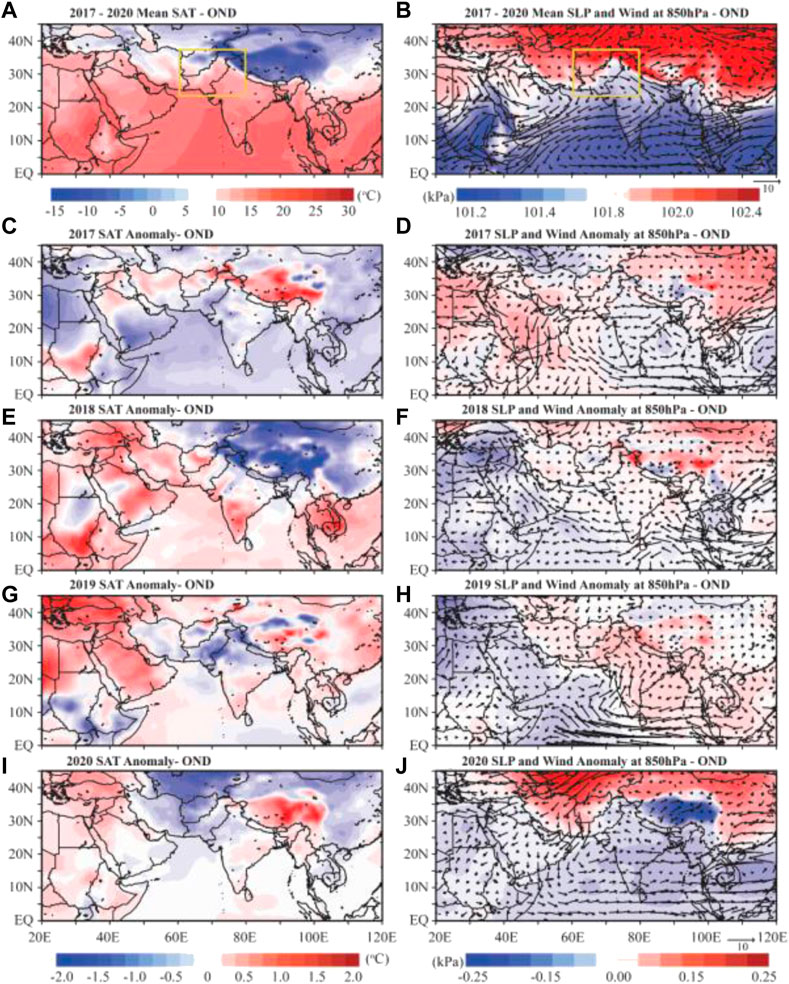
FIGURE 4. Composite anomalies patterns for surface air temperature (SAT, oC), mean sea level pressure (SLP, Pa), and wind speed at 850 hPa during the recent past (2017–2020) drought in South Pakistan. (A) Indicates the climatological mean of SST and SAT, while (B) represents SLP and wind. From Figs. c–j, SAT, SST, SLP, and wind are the associated anomalies with the SEM during the OND season (i.e., 2017(C,D), 2018(E,F), 2019(G,H), and 2020 (I,J), respectively.
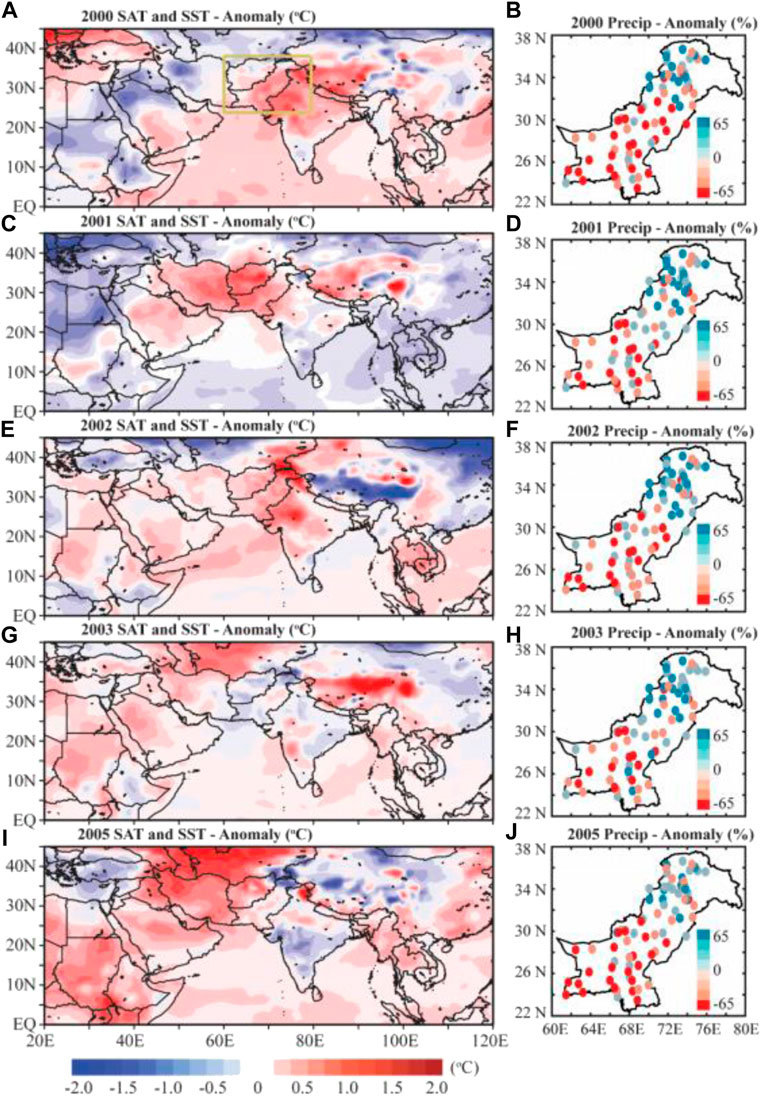
FIGURE 5. Spatial distribution of SAT, SSTs (i.e., (A) 2000, (C) 2001, (E) 2002, (G) 2003, (I) 2005), and the same as for precipitation anomalies for the past six worst droughts that occurred in South Pakistan during the SEM monsoon for 1980–2020 period.
To better understand the reasons for precipitation deficits, we have examined the anomalous patterns of SAT and SLP during SEM for the 4 years (2017, 2018, 2019, and 2020) of the recent drought phase (Figures 4C–J). Cooler SST anomalies were linked with La Niña in the central Pacific and negative IOD in the IO from 2016 to 2019 (Figures 4C–H). These 3 years, however, have seen cooling SST trends in the eastern tropical IO and western tropical Pacific, along with warming SST distributions in the western IO and central Pacific (Supplementary Figure S4). Together with SLP and SAT patterns, such trends produce unusual westerlies in the IO, reducing moisture carrying from the AS and BoB during the SEM season (Figures 4C–H). During the SEM season, weaker winds developed over southern Pakistan. Stronger converging winds can be seen over the AS, indicating enlarged moisture fluxes from the AS to the study area. The enhanced SLP further clarifies the role of the sub-tropical and Somali jet streams, suggesting that the primary drivers of oceanic water transport to continental landmasses exaggerate the precipitation pattern across the SEM dominant regions. Nevertheless, higher temperatures with no/fewer changes in precipitation and increased SLP further highlight the drier conditions over the target area. According to Van Oldenborgh et al. (2018), recent changes in SST may alter cyclone activity over the target region. Our results support the finding of a previous study using a similar theory, claiming that ENSO influences cyclone frequency in the various oceanic basins (Barbero et al., 2019). It can be concluded that the convergence of the SLP contents and increase in relative SAT from both south-westerlies and easterlies altogether results in drier composites, which are increased when the easterlies through the BoB are stronger.
Furthermore, abnormally low SLP and SAT were observed across the Indian subcontinent and BoB during these 3 years and associated with anticyclonic patterns that inhibited the moisture transport to the Southern regions of Pakistan. Precipitation deficits were slightly reduced in 2020 as a result of favorable warming in the western tropical IO and a cooling trend in the eastern part, as well as the change phase of El-Niño in the Pacific (Figures 4I, J). Nonetheless, warming in the western IO was not noticeable in that year (2020), and cooler temperatures in the northern IO caused an overall SEM precipitation deficit in that year (Supplementary Figure S5). The large-scale oceanic indicators have less/non-significant influence on precipitation variability over southern Pakistan. Thus, the observed relationships are somewhat weaker and cannot be related to precipitation variability in the target region. Nonetheless, as a result of regional precipitation reliance on moisture/mass water vapor contents for precipitation, it was noted that the anomalous wind pattern is leading to precipitation variability during the composite analysis.
We have also analyzed the SAT, SSTs, and precipitation anomalies for the past six worst drought years in South Pakistan during the SEM monsoon for the 1980–2020 period (Figure 5). According to the severity, the major drought years in Southern Pakistan occurred in 1987, 2000, 2001, 2002, 2003, and 2005, respectively. All of these six drought years were under the effect of ENSO conditions. Literature reported that the variations in SST anomalies could change the forte and positioning of Walker circulation, which consequently alters the spatial patterns of precipitation anomalies over Southeast Asia (Roxy et al., 2015; Mishra et al., 2021b). However, the most severely dry and wet SEM years’ SAT and SLP anomaly composites show a trend toward cooler SSTs in the Indo-Pacific, which is linked to a precipitation deficit over South Pakistan (Supplementary Figures S5, S6). In contrast, the warming pattern in the central Pacific and IOs is allied with a strong SEM and increased precipitation. Cooling in the central Pacific and the IOs caused lower SLP and weak wind fields, resulting in a precipitation deficit in South Pakistan.
4.3 Changes in SST during southeast monsoon
Possible linkages between SST and South Pakistan precipitation during the SEM (OND) were also investigated. Figures 6A, B depict the spatial patterns of the correlation estimated from the first leading mode of MCA between South Pakistan precipitation and SSTs (OND season) from 1980 to 2020. The above (c) and (d) panels show a similar pattern when using the second leading mode of MCA.
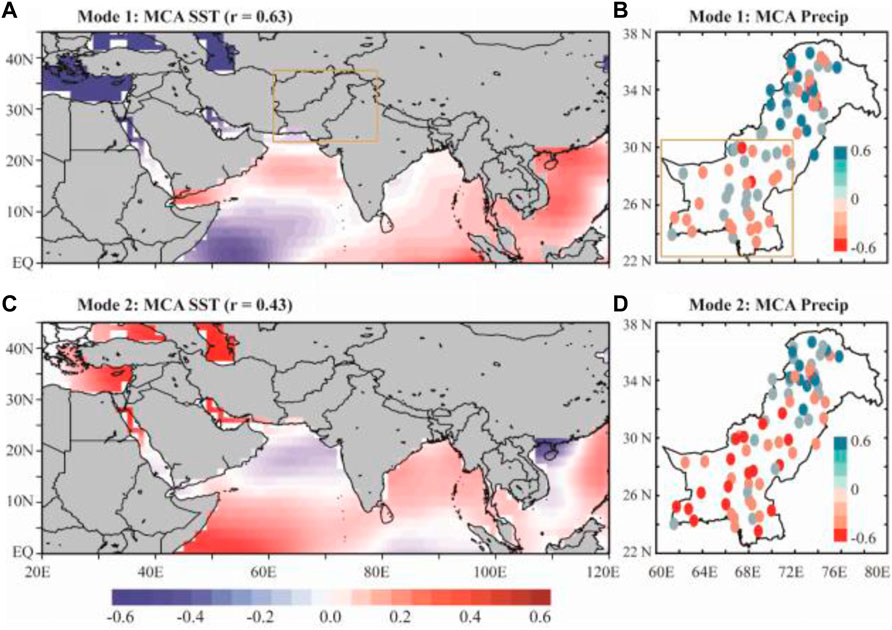
FIGURE 6. Possible linkages between SST and South Pakistan precipitation during the SEM (OND). (A,B) show the spatial patterns of the correlation attained from the first leading mode of MCA estimated between South Pakistan precipitation and SSTs (OND season) during 1980–2020. A similar pattern can be seen for the above (C,D) panels, but using the second leading mode of MCA.
To highlight the association between precipitation anomalies and SST during SEM, a Maximum covariance analysis has been carried out that defines the patterns of co-variability among SSTs and southeastern SEM precipitation. The first leading mode depicts the ENSO pattern of variance and presents 62% of the total variance (Figure 6A). MCA confirms that negative SST anomalies over the central Pacific (La Niña) cause below-normal SEM precipitation over South Pakistan (Figure 6B), which is consistent with the distributions of the aforementioned major droughts in Figure 5. The second leading mode during the SEM shows a relatively weak relationship between SST and precipitation anomalies (Figures 6C, D). The second mode depicts SST warming in the AS and BoB as a physical driver of SEM precipitation in Southern Pakistan (Hina et al., 2021), with an apparent contradiction between northern and southern parts of the country where SEM precipitation is strongly linked with ENSO (Figure 6). Precipitation variability and SST mode during SEM show that Indo-Pacific SST anomalies cause drought conditions in South Pakistan.
In addition to the MCA, we have also accomplished the EOF analysis to detect the leading patterns of SEM precipitation in Southern Pakistan (Figure 7). The first leading mode of EOF detected precipitation variability throughout south Pakistan, accounting for 62% of the total variance (Figure 7A). The second mode explained 48% of the total variance and depicted a dipolar pattern of SEM precipitation over the study region’s southern and northern parts (Figure 7B). It is worth noting that the precipitation variability characteristics obtained from the EOF analysis (the first and second modes) agree with the leading modes of MCA (Figure 6).
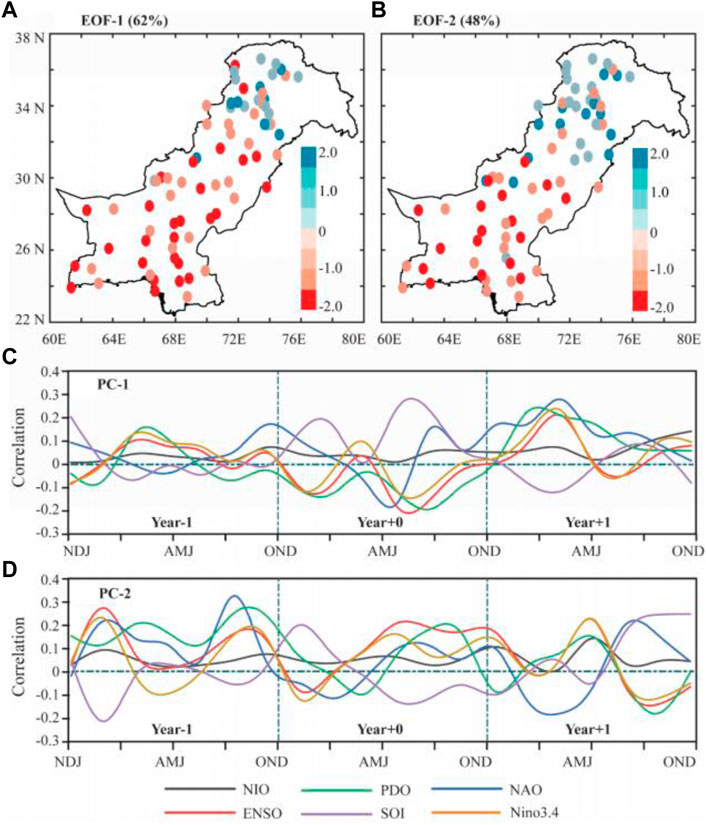
FIGURE 7. The two leading modes were estimated by using Empirical Orthogonal Function (EOF-1 and EOF-2) analysis of precipitation during the SEM from 1980 to 2020. The EOF-1 of SEM (A) shows 62% of the total variance in SEM precipitation for South Pakistan. The corresponding lagged correlation (B) between the first leading principal component (PC-1) and SST (3-month mean) anomalies presented over distinct regions, which include Northern Indian Ocean (NIO), Niño3.4, Pacific Decadal Oscillation (PDO), North Atlantic Ocean (NAO), multivariate El Niño Southern Oscillation (ENSO), and Southern Oscillation Index (SOI), respectively. Same pattern as for (C,D), but using EOF-2 and PC-2. In addition, Year −1, Year +0, and Year +1 indicate the past, present, and next year of the SEM, respectively.
To summarize, the principal component analysis has been conducted to examine the SEM precipitation predictability using SST anomalies (Supplementary Figure S6). Additionally, the link between PC1 and SST anomalies and oceanic indices has been calculated. From the results, it is inferred that PC1 is strongly correlated with SST in OND (r= 0.53) to NAO (Figure 7C). However, the PC2 is more defined by (r =0.46) OND SST anomalies with PDO and ENSO (Figure 7D). We created a predictive model for SEM precipitation using the lag between SST and oceanic indices anomalies with PCs (Chen et al., 2019). Overall, our findings show that SST anomalies at Nino3.4 and over IO can be used to forecast precipitation over South Pakistan during the SEM, albeit with limited accuracy (see Supplementary Figure S7).
4.4 Future changes in water scarcity over south Pakistan
At present, almost one-third of the human population faces water scarcity around the globe (Omer et al., 2020a). Like many other developing countries, Pakistan’s agricultural economy has also been threatened by water scarcity in the recent past. As a result, the current study focuses on water stress as well as water-use and availability ratio. It is a widely used indicator that captures a simple perception of how water use, and availability relate (Omer et al., 2020a). Total water consumption (TWC) was used to estimate future changes in water scarcity over the target region under the SSP1-RCP4.5 and SSP2-RCP8.5 scenarios.
Figure 8 shows the changes in water scarcity over the Southern region of Pakistan for the past (1980–2000), present (2001–2020), and the future (2021–2050) under the SSP1-RCP4.5 and SSP2-RCP8.5 scenarios. Our findings showed moderate to extreme stress in some parts of Southern Pakistan under the past scenario (1980–2000), and this water stress is amplified in the present scenario (Figures 8A, B). Moreover, under future scenarios, water scarcity is projected to be intensified in areas already under stress. The changes in future water scarcity over the southern regions of Pakistan depict a higher increase in water scarcity with an amount of 0.6–0.8 under the SSP1-RCP4.5 scenario, whereas a bit decrease in water scarcity appeared at the rate of 0.4–0.6 under the SSP2-RCP8.5 scenario (Figures 8C, D). Reduced water use (population stabilization or efficiency gains) and increased water availability (wet climate, more storage in water reservoirs) may play an important role in decreasing stress levels. For the historical and future SSP1-RCP4.5 scenarios, changes in stress levels (increase or decrease) are mostly observed in the southeastern parts of the region (Figures 8E–G).
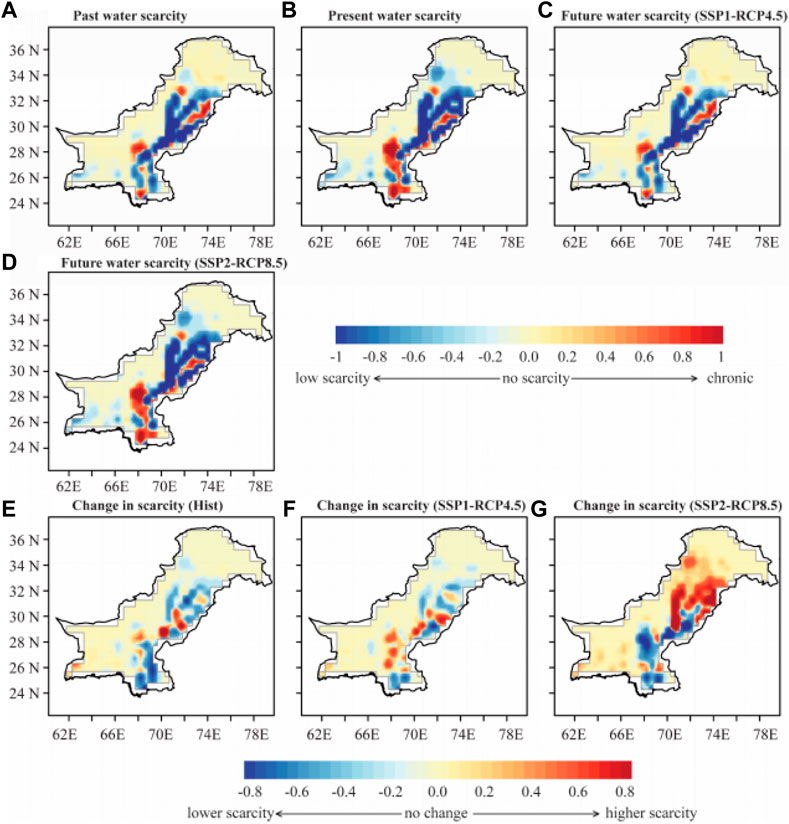
FIGURE 8. Changes in future water scarcity over the Southern region of Pakistan during the SEM (OND) for past (1980–2000) (A), present (2001–2020) (B), and future (2021–2050) (C,D) under the RCP4.5 and RCP8.5 scenarios. Relative changes in historical water scarcity levels from 1980 to 2020 are shown in (E), and future changes from 2021 to 2050 are presented in (F,G), respectively.
5 Discussion
In the wake of rapid climate change, extreme events like droughts have intensified globally. The recent decade witnessed many extreme events, including droughts, floods, heatwaves, and cyclones of different intensities in Asia–Pacific (Ashraf and Routray, 2015). Generally, most South Asian countries are categorized as developing and have an agriculture-based economy (Bandara & Cai, 2014; Liu et al., 2021; Ma & Yuan, 2021). Therefore, abrupt changes in climatic conditions threaten their social and economic security (Ahmed Nomman & Schmitz, 2011).
Droughts in SAS are predominantly driven by the summer monsoon precipitation deficit that provides almost 80% of total precipitation in the region (Aadhar, et al., 2021). The monsoon precipitation variability over SAS is connected to the large-scale oceanic and atmospheric phenomenon, predominantly multivariate ENSO and IOD (Mishra & Singh, 2010; Roxy et al., 2015; Aadhar, et al., 2021). As a result, SAS has witnessed numerous major droughts during the past decades that led to devastating famines of the 19th and 20th centuries (Mishra et al., 2021b; Hina et al., 2021; Ullah et al., 2022a). Furthermore, the temperature increase in the post-monsoon months (October to December) poses further challenges by depleting the soil moisture next to the dry monsoon season (Mishra et al., 2021b). In addition, anthropogenic warming has also contributed to the occurrence, frequency, and severity of recent droughts (Omer et al., 2020a), which were amplified by variations in the water and energy budgets governed by land-atmospheric interactions (Trenberth et al., 2014).
In this study, first, we estimated the anomalous deficit years by calculating the SEM Precipitation anomalies from 1980 to 2020 (Figures 1, 2 and Supplementary Figures S3, S4) and the two most severe drought episodes (2001–2005 and 2017–2020) have been spotted in historical records with a precipitation deficit of −47% and −75%, respectively. Previous studies have also identified many of these drought years in Pakistan (Adnan et al., 2015; Hina et al., 2021; Ullah et al., 2022d). However, in the present study, we focused on the most recent and severe drought episode of 2017–2020. Hence, calculated spatial and temporal anomalies of the TWS from the GRACE and GRACE-FO satellites for the recent-past period 2017–2020 are presented in Figure 2. The results showed a considerable decline in TWS over Southern Pakistan.
The spatial pattern of annual averaged SLP depicts a high-pressure system in northern Pakistan whereas a low-pressure system over southern Pakistan. From 2016 to 2019, the La Niña conditions across the central Pacific and the negative IOD in the IO were associated with the cooler SST anomalies. In the past 3 years, there have been increasing SST trends in the western IO and central Pacific as well as cooling SST trends in the eastern tropical IO and western tropical Pacific (Aadhar, et al., 2021). Afterward, the association between precipitation anomalies and SST during SEM has been highlighted by calculating the MCA. The first leading mode presented 62% of the total variance and depicts the ENSO pattern of variance. Similar to the patterns of above mentioned key droughts, MCA also confirms that the negative SST anomalies over the central Pacific (La Niña) result in below-normal SEM precipitation over South Pakistan. Collectively, precipitation variability and the mode of SST during SEM display that the SST anomalies over the Indo-Pacific cause dry conditions over Southern Pakistan (Thirumalai, et al., 2021; Ullah et al., 2022).
In addition to the MCA, the EOF analysis has also been carried out to detect the trends of SEM precipitation in Southern Pakistan. The first mode of EOF spotted the precipitation variability across south Pakistan and presented 62% of the total variance. In contrast, the second mode revealed 48% of the total variance and depicted a bipolar pattern of SEM precipitation over the southern and northern parts of the study region. We used this lagged relationship to make a predictive model for SEM precipitation (Gong et al., 2018; Zhou et al., 2021). Our results show that SST anomalies over Nino3.4 and NIO can predict precipitation patterns during the SEM over South Pakistan.
Finally, to estimate the future changes in water scarcity over the target region, we used TWC under the SSP1-RCP4.5 and SSP2-RCP8.5 scenarios. Our findings showed moderate to extreme stress in some parts of Southern Pakistan under the past scenario (1980–2000), and this water stress is amplified in the present scenario. The previous studies suggest that most of the basins are overused in Baluchistan (southwestern province). Henceforth, the water table is declining rapidly (Hussain et al., 2017). With the current water usage rate for the coming 50 years, the southern province will utilize more than 90% of all available water resources together with the province’s share of Indus water and the groundwater reserves (Arshad et al., 2021).
Pakistan is ranked 17th among the most-scarce countries in the world, and 79% of potable water is not safe for drinking purposes (Ashraf et al., 2021). Water availability in Pakistan has been decreased from 1,300 m3/person (1996–1997) to 1,100 m3/person (2006) and expected to decrease further to less than 700 m3/person in 2025 (Roxy et al., 2015). Pakistan was once an abundant country in water resources but now becomes water-stressed as it failed to develop proper human resources and infrastructure. There is an urgent need for investment in this sector (Arnell and Lloyd-Hughes, 2014; Miao et al., 2020). According to the estimates, 60% of the fresh water in the country is wasted because of poor water management, while only 40% is used. The National Bureau of Statistics stated that approximately 56% of the country’s total population has access to safe drinking water (Miralles et al., 2019; Thirumalai, et al., 2021). Hence, the government should move beyond speaking on water issues due to climate change, national water policy, and environmental sustainability to address the water crisis faced by the country.
6 Conclusion
The current study presents a detailed view of the droughts in Southern Pakistan and associated water scarcity under historical and future scenarios. The results showed that the recent extreme water deficit resulted from one of the extreme droughts of the last 100 years. The recent drought of 2017–2020 was worse than the well-known 1999–2002 drought episode. During the 2017–2020 event, South Pakistan experienced the worst SEM drought with a precipitation deficit of 45%, compared to the second-worst drought of 2000–2005 with a deficit of 37%, respectively. It should be noted that the eastern and southern parts captured the largest increase in drought severity from −0.8 to −0.6 over a few dominant stations situated in arid and semi-arid areas. Conversely, most stations exhibit a noteworthy upsurge in drought severity, excluding the stations positioned in the northern, while larger stations show a significant decline in SPI with a rate of −0.6 to −0.4, respectively. Moreover, the findings of this study depicted moderate to extreme stress in Southern Pakistan under the past scenario that is amplified in the present scenario. Under future scenarios, water scarcity is projected to be intensified in the areas already under stress. Dynamically, our study implies that the multivariate ENSO conditions are responsible for SEM precipitation deficit by inhibiting the landward transport of moisture from the AS and the BoB. This kind of precipitation deficit spanning over successive years may result in a long-term drought that will have detrimental impacts on the region’s water availability, agriculture, and socio-economical settings. The outcomes of this study will be helpful for the environmentalist, water resources planners and managers, and policymakers to identify the hot spot areas in the target region so that stratic mitigation measures could be implemented in advance to dimmish the water scarcity problems.
Data availability statement
The original contributions presented in the study are included in the article/Supplementary Material, further inquiries can be directed to the corresponding authors.
Author contributions
IU: Conceptualization, Methodology, Formal analysis, Data curation, Writing–original draft preparation. XM and X-MZ: Conceptualization, Supervision, Funding acquisition, Writing-review and editing. SH: Writing–original draft preparation. Jun Yin: Supervision, Writing-review and editing. VI: VS: Writing-review and editing. SS: Writing–original draft preparation. All authors listed have made a substantial, direct, and intellectual contribution to the work and approved it for publication.
Funding
This research was supported by the National Natural Science Foundation of China Grant Nos.: 41675007, 41775087, 41877158, and 42350410438, the National Key R&D Program of China under Grant No. 6882018YFA0606004, and the China Postdoctoral Science Foundation (2023M730928). The authors would like to express their gratitude for the financial support, which played a crucial role in conducting the study.
Acknowledgments
We also acknowledge the Pakistan Meteorological Department (PMD) for providing updated precipitation data. This work was partially supported by the National Key Scientific and Technological Infrastructure project “Earth System Numerical Simulation Facility”.
Conflict of interest
The authors declare that the research was conducted in the absence of any commercial or financial relationships that could be construed as a potential conflict of interest.
Publisher’s note
All claims expressed in this article are solely those of the authors and do not necessarily represent those of their affiliated organizations, or those of the publisher, the editors and the reviewers. Any product that may be evaluated in this article, or claim that may be made by its manufacturer, is not guaranteed or endorsed by the publisher.
Supplementary material
The Supplementary Material for this article can be found online at: https://www.frontiersin.org/articles/10.3389/feart.2023.1113554/full#supplementary-material
References
Adnan, S., Ullah, K., and Gao, S. (2015). Characterization of drought and its assessment over Sindh, Pakistan during 1951-2010. J. Meteorol. Res. 29, 837–857. doi:10.1007/s13351-015-4113-z
Ahmad, I., Zhang, F., Tayyab, M., Anjum, M., Zaman, M., Liu, J., et al. (2018). Spatiotemporal analysis of precipitation variability in annual, seasonal and extreme values over upper Indus River basin. Atmos. Res. 213, 346–360. doi:10.1016/j.atmosres.2018.06.019
Ahmed, K., Shahid, S., Harun, S. B., and Wangjun, X. (2016). Characterization of seasonal droughts in balochistan province, Pakistan. Stoch. Environ. Res. Risk Assess. 30, 747–762. doi:10.1007/s00477-015-1117-2
Ahmed, K., Shahid, S., and Nawaz, N. (2018). Impacts of climate variability and change on seasonal drought characteristics of Pakistan. Atmos. Res. 214, 364–374. doi:10.1016/j.atmosres.2018.08.020
Ahmed Nomman, M., and Schmitz, M. (2011). Economic assessment of the impact of climate change on the agriculture of Pakistan. Bus. Econ. Horizons 4, 1–12. doi:10.15208/beh.2011.1
Ali, S., Tong, D., Xu, Z., Henchiri, M., Wilson, K., Siqi, S., et al. (2019). Characterization of drought monitoring events through MODIS- and TRMM-based DSI and TVDI over South Asia during 2001–2017. Environ. Sci. Pollut. Res. 26, 33568–33581. doi:10.1007/s11356-019-06500-4
Almazroui, M., Islam, M. N., Saeed, F., Saeed, S., Ismail, M., Ehsan, M. A., et al. (2021). Projected changes in temperature and precipitation over the United States, central America, and the caribbean in CMIP6 GCMs. Earth Syst. Environ. 5, 1–24. doi:10.1007/s41748-021-00199-5
Arnell, N. W., and Lloyd-Hughes, B. (2014). The global-scale impacts of climate change on water resources and flooding under new climate and socio-economic scenarios. Clim. Change 122, 127–140. doi:10.1007/s10584-013-0948-4
Arshad, M., Ma, X., Yin, J., Ullah, W., Liu, M., and Ullah, I. (2021). Performance evaluation of ERA-5, JRA-55, MERRA-2, and CFS-2 reanalysis datasets, over diverse climate regions of Pakistan. Weather Clim. Extrem. 33, 100373. doi:10.1016/j.wace.2021.100373
Ashraf, M., Arshad, A., Patel, P. M., Khan, A., Qamar, H., Siti-Sundari, R., et al. (2021). Quantifying climate-induced drought risk to livelihood and mitigation actions in Balochistan. Nat. Hazards 9, 2127–2151. doi:10.1007/s11069-021-04913-4
Ashraf, M., and Routray, J. K. (2015). Spatio-temporal characteristics of precipitation and drought in Balochistan Province, Pakistan. Nat. Hazards 77, 229–254. doi:10.1007/s11069-015-1593-1
Bandara, J. S., and Cai, Y. (2014). The impact of climate change on food crop productivity, food prices and food security in South Asia. Econ. Anal. Policy 44, 451–465. doi:10.1016/j.eap.2014.09.005
Barbero, R., Fowler, H. J., Blenkinsop, S., Westra, S., Moron, V., Lewis, E., et al. (2019). A synthesis of hourly and daily precipitation extremes in different climatic regions. Weather Clim. Extrem. 26, 100219. doi:10.1016/j.wace.2019.100219
Bretherton, C. S., Smith, C., and Wallace, J. M. (1992). An intercomparison of methods for finding coupled patterns in climate data. J. Clim. 5, 541–560. doi:10.1175/1520-0442(1992)005<0541:aiomff>2.0.co;2
Chen, F., Chen, J., Huang, W., Chen, S., Huang, X., Jin, L., et al. (2019). Westerlies Asia and monsoonal Asia: Spatiotemporal differences in climate change and possible mechanisms on decadal to sub-orbital timescales. Earth-Science Rev. 192, 337–354. doi:10.1016/j.earscirev.2019.03.005
Dahri, Z. H., Ludwig, F., Moors, E., Ahmad, S. S. S. S., Ahmad, B., Ahmad, S. S. S. S., et al. (2021). Climate change and hydrological regime of the high-altitude Indus basin under extreme climate scenarios. Sci. Total Environ. 768, 144467. doi:10.1016/j.scitotenv.2020.144467
Eckstein, D., and Kreft, S. (2020). Global climate risk index 2021 Who suffers most from extreme weather events? Germany: Germanwatch Nord-Süd Initiative.
Eyring, V., Bony, S., Meehl, G., Senior, C., Stevens, B., Stouffer, R., et al. (2016). Overview of the coupled model intercomparison Project phase 6 (CMIP6) experimental design and organization. Geosci. Model Dev. 9, 1937–1958. doi:10.5194/gmd-9-1937-2016
Frieler, K., Lange, S., Piontek, F., Reyer, C. P. O., Schewe, J., Warszawski, L., et al. (2017). Assessing the impacts of 1.5 °C global warming – simulation protocol of the inter-sectoral impact model intercomparison Project (ISIMIP2b). Geosci. Model Dev. 10, 4321–4345. doi:10.5194/gmd-10-4321-2017
Gong, H., Wang, L., Zhou, W., Chen, W., Wu, R., Liu, L., et al. (2018). Revisiting the northern mode of east asian winter monsoon variation and its response to global warming. J. Clim. 31, 9001–9014. doi:10.1175/JCLI-D-18-0136.1
Hannachi, A., Jolliffe, I. T., and Stephenson, D. B. (2007). Empirical orthogonal functions and related techniques in atmospheric science: A review. Int. J. Climatol. 27, 1119–1152. doi:10.1002/joc.1499
Hina, S., Saleem, F., Arshad, A., Hina, A., and Ullah, I. (2021). Droughts over Pakistan: Possible cycles, precursors and associated mechanisms. Geomatics, Nat. Hazards Risk 12, 1638–1668. doi:10.1080/19475705.2021.1938703
Hussain, M., Kim, S., and Lee, S. (2017). On the relationship between Indian Ocean Dipole events and the precipitation of Pakistan. Theor. Appl. Climatol. 130, 673–685. doi:10.1007/s00704-016-1902-y
Ipcc, , Masson-Delmotte, V., Zhai, P., Pirani, A., Connors, S. L., Péan, C., et al. (2021). “Climate change 2021: The physical science basis. Contribution of working group I to the sixth assessment report of the intergovernmental panel on climate change,”. IPCC-54 (Geneva, Switzerland: Intergovernmental Panel on Climate Change).
Iyakaremye, V., Zeng, G., Ullah, I., Gahigi, A., Mumo, R., and Ayugi, B. (2022). Recent observed changes in extreme high-temperature events and associated meteorological conditions over africa. Int. J. Climatol. 42, 4522–4537. doi:10.1002/joc.7485
Jamro, S., Dars, G. H., Ansari, K., and Krakauer, N. Y. (2019). Spatio-temporal variability of drought in Pakistan using standardized precipitation evapotranspiration index. Appl. Sci. 9, 4588. doi:10.3390/app9214588
Jones, B., and O’Neill, B. (2016). Spatially explicit global population scenarios consistent with the Shared Socioeconomic Pathways. Environ. Res. Lett. 11, 084003. doi:10.1088/1748-9326/11/8/084003
Khan, N., Shahid, S., Ismail, T., and Wang, X. (2019). Spatial distribution of unidirectional trends in temperature and temperature extremes in Pakistan. Theor. Appl. Climatol. 136, 899–913. doi:10.1007/s00704-018-2520-7
Kumar, A., Kumar, M., Pandey, R., ZhiGuo, Y., and Cabral-Pinto, M. (2021a). Forest soil nutrient stocks along altitudinal range of uttarakhand himalayas: An aid to nature based climate solutions. CATENA 207, 105667. doi:10.1016/j.catena.2021.105667
Kumar, A., Yu, Z.-G., Klemeš, J. J., and Bokhari, A. (2021b). A state-of-the-art review of greenhouse gas emissions from Indian hydropower reservoirs. J. Clean. Prod. 320, 128806. doi:10.1016/j.jclepro.2021.128806
Kummu, M., Gerten, D., Heinke, J., Konzmann, M., and Varis, O. (2014). Climate-driven interannual variability of water scarcity in food production potential: A global analysis. Hydrol. Earth Syst. Sci. 18, 447–461. doi:10.5194/hess-18-447-2014
Lehner, F., Coats, S., Stocker, T., Pendergrass, A., Sanderson, B., Raible, C., et al. (2017). Projected drought risk in 1.5°C and 2°C warmer climates. Geophys. Res. Lett. 44, 7419–7428. doi:10.1002/2017GL074117
Liu, M., Ma, X., Yin, Y., Zhang, Z., Yin, J., Ullah, I., et al. (2021a). Non-stationary frequency analysis of extreme streamflow disturbance in a typical ecological function reserve of China under a changing climate. Ecohydrology 23, 1–20. doi:10.1002/eco.2323
Liu, Y., Liu, Y., Wang, W., and Zhou, H. (2021b). Propagation of soil moisture droughts in a hotspot region: Spatial pattern and temporal trajectory. J. Hydrol. 593, 125906. doi:10.1016/j.jhydrol.2020.125906
Lu, K., Arshad, M., Ma, X., Ullah, I., Wang, J., and Shao, W. (2022). Evaluating observed and future spatiotemporal changes in precipitation and temperature across China based on <scp>CMIP6-GCMs</scp>. Int. J. Climatol. 42, 7703–7729. doi:10.1002/joc.7673
Ma, F., and Yuan, X. (2021). Impact of climate and population changes on the increasing exposure to summertime compound hot extremes. Sci. Total Environ. 772, 145004. doi:10.1016/j.scitotenv.2021.145004
Mahmood, R., and Babel, M. S. (2014). Future changes in extreme temperature events using the statistical downscaling model (SDSM) in the trans-boundary region of the Jhelum river basin. Weather Clim. Extrem. 5, 56–66. doi:10.1016/j.wace.2014.09.001
Mátyás, C., Berki, I., Bidló, A., Csóka, G., Czimber, K., Führer, E., et al. (2018). Sustainability of forest cover under climate change on the temperate-continental xeric limits. Forests 9, 489. doi:10.3390/f9080489
McKee, T. B., Nolan, J., and Kleist, J. “The relationship of drought frequency and duration to time scales,” in Proceedings of the. Eighth Conf. Appl. Climatol. Amer. Meteor, Soc, Anaheim, CA, United States, January 1993.
McSweeney, C. F., and Jones, R. G. (2016). How representative is the spread of climate projections from the 5 CMIP5 GCMs used in ISI-MIP? Clim. Serv. 1, 24–29. doi:10.1016/j.cliser.2016.02.001
Meehl, G. A., Senior, C. A., Eyring, V., Flato, G., Lamarque, J.-F., Stouffer, R. J., et al. (2020). Context for interpreting equilibrium climate sensitivity and transient climate response from the CMIP6 Earth system models. Sci. Adv. 6, eaba1981. doi:10.1126/sciadv.aba1981
Miao, L., Li, S., Zhang, F., Chen, T., Shan, Y., and Zhang, Y. (2020). Future drought in the dry lands of Asia under the 1.5 and 2.0 °C warming scenarios. Earth’s Futur 8, 0–13. doi:10.1029/2019EF001337
Mie Sein, Z. M., Ullah, I., Saleem, F., Zhi, X., Syed, S., and Azam, K. (2021a). Interdecadal variability in Myanmar rainfall in the monsoon season (May–October) using eigen methods. Water 13, 729. doi:10.3390/w13050729
Mie Sein, Z., Ullah, I., Syed, S., Zhi, X., Azam, K., and Rasool, G. (2021b). Interannual variability of air temperature over Myanmar: The influence of ENSO and IOD. Climate 9, 35. doi:10.3390/cli9020035
Miralles, D., Gentine, P., Seneviratne, S., and Teuling, A. (2019). Land–atmospheric feedbacks during droughts and heatwaves: State of the science and current challenges. Ann. N. Y. Acad. Sci. 1436, 19–35. doi:10.1111/nyas.13912
Mishra, A., and Singh, V. (2010). A review of drought concepts. J. Hydrol. 391, 202–216. doi:10.1016/j.jhydrol.2010.07.012
Mishra, V., Aadhar, S., and Mahto, S. (2021a). Anthropogenic warming and intraseasonal summer monsoon variability amplify the risk of future flash droughts in India. npj Clim. Atmos. Sci. 4, 1. doi:10.1038/s41612-020-00158-3
Mishra, V., Thirumalai, K., Jain, S., and Aadhar, S. (2021b). Unprecedented drought in South India and recent water scarcity. Environ. Res. Lett. 16, 054007. doi:10.1088/1748-9326/abf289
Miyan, M. (2015). Droughts in asian least developed countries: Vulnerability and sustainability. Weather Clim. Extrem. 7, 8–23. doi:10.1016/j.wace.2014.06.003
Munia, H. A., Guillaume, J. H. A., Wada, Y., Veldkamp, T., Virkki, V., and Kummu, M. (2020). Future transboundary water stress and its drivers under climate change: A global study. Earth’s Futur 8, e2019EF001321–21. doi:10.1029/2019EF001321
Naz, D., Ansari, K., Jamro, S., and Krakauer, N. (2020). Drought trends in balochistan. Water 12, 470. doi:10.3390/w12020470
Naz, F., Dars, G. H., Ansari, K., Jamro, S., and Krakauer, N. Y. (2020). Drought trends in balochistan. WaterSwitzerl. 12. doi:10.3390/w12020470
Neumann, B., Vafeidis, A. T., Zimmermann, J., and Nicholls, R. J. (2015). Future coastal population growth and exposure to sea-level rise and coastal flooding - a global assessment. PLoS One 10, e0118571. doi:10.1371/journal.pone.0118571
Omer, A., Elagib, N. A., Zhuguo, M., Saleem, F., and Mohammed, A. (2020a). Water scarcity in the Yellow River Basin under future climate change and human activities. Sci. Total Environ. 749, 141446. doi:10.1016/j.scitotenv.2020.141446
Preethi, B., Mujumdar, M., Kripalani, R. H., Prabhu, A., and Krishnan, R. (2017). Recent trends and tele-connections among South and East Asian summer monsoons in a warming environment. Clim. Dyn. 48, 2489–2505. doi:10.1007/s00382-016-3218-0
Reay, D., Sabine, C., Smith, P., and Hymus, G. (2007). Climate change 2007: Spring-time for sinks. Nature 446, 727–728. doi:10.1038/446727a
Roxy, M. K., Ritika, K., Terray, P., Murtugudde, R., Ashok, K., and Goswami, B. N. (2015). Drying of Indian subcontinent by rapid Indian Ocean warming and a weakening land-sea thermal gradient. Nat. Commun. 6, 7423. doi:10.1038/ncomms8423
Sajjad, M. M., Wang, J., Abbas, H., Ullah, I., Khan, R., and Ali, F. (2022). Impact of climate and land-use change on groundwater resources, study of Faisalabad district, Pakistan. Atmos. (Basel) 13, 1097. doi:10.3390/atmos13071097
Sein, Z. M. M., Ullah, I., Iyakaremye, V., Azam, K., Ma, X., Syed, S., et al. (2022a). Observed spatiotemporal changes in air temperature, dew point temperature and relative humidity over Myanmar during 2001–2019. Meteorol. Atmos. Phys. 134, 7. doi:10.1007/s00703-021-00837-7
Sein, Z. M. M., Zhi, X., Ullah, I., Azam, K., Ngoma, H., Saleem, F., et al. (2022b). Recent variability of sub-seasonal monsoon precipitation and its potential drivers in Myanmar using in-situ observation during 1981–2020. Int. J. Climatol. 42, 3341–3359. doi:10.1002/joc.7419
Shahzaman, M., Zhu, W., Bilal, M., Habtemicheal, B., Mustafa, F., Arshad, M., et al. (2021). Remote sensing indices for spatial monitoring of agricultural drought in SouthSouth Asian countries. Remote Sens. 13, 2059. doi:10.3390/rs13112059
Trenberth, K., Dai, A., Van Der Schrier, G., Jones, P., Barichivich, J., Briffa, K., et al. (2014). Global warming and changes in drought. Nat. Clim. Chang. 4, 17–22. doi:10.1038/nclimate2067
Ullah, I., Ma, X., Asfaw, T. G., Yin, J., Iyakaremye, V., Saleem, F., et al. (2022a). Projected changes in increased drought risks over South Asia under a warmer climate. Earth’s Futur 10, 1–21. doi:10.1029/2022EF002830
Ullah, I., Ma, X., Ren, G., Yin, J., Iyakaremye, V., Syed, S., et al. (2022b). Recent changes in drought events over SouthSouth Asia and their possible linkages with climatic and dynamic factors. Remote Sens. 14, 3219. doi:10.3390/rs14133219
Ullah, I., Ma, X., Yin, J., Asfaw, T. G., Azam, K., Syed, S., et al. (2021a). Evaluating the meteorological drought characteristics over Pakistan using in situ observations and reanalysis products. Int. J. Climatol. 41, joc.7063–4459. doi:10.1002/joc.7063
Ullah, I., Ma, X., Yin, J., Omer, A., Habtemicheal, B. A., Saleem, F., et al. (2022c). Spatiotemporal characteristics of meteorological drought variability and trends (1981–2020) over South Asia and the associated large-scale circulation patterns. Clim. Dyn. 60, 2261–2284. doi:10.1007/s00382-022-06443-6
Ullah, I., Ma, X., Yin, J., Saleem, F., Syed, S., Omer, A., et al. (2022d). Observed changes in seasonal drought characteristics and their possible potential drivers over Pakistan. Int. J. Climatol. 42, 1576–1596. doi:10.1002/joc.7321
Ullah, I., Saleem, F., Iyakaremye, V., Yin, J., Ma, X., Syed, S., et al. (2022e). Projected changes in socioeconomic exposure to heatwaves in South Asia under changing climate. Earth’s Futur 10, 1–19. doi:10.1029/2021EF002240
Ummenhofer, C., D’Arrigo, R., Anchukaitis, K., Buckley, B., and Cook, E. (2013). Links between indo-pacific climate variability and drought in the monsoon Asia drought atlas. Clim. Dyn. 40, 1319–1334. doi:10.1007/s00382-012-1458-1
Van Oldenborgh, G. J., Philip, S., Kew, S., Van Weele, M., Uhe, P., Otto, F., et al. (2018). Extreme heat in India and anthropogenic climate change. Nat. Hazards Earth Syst. Sci. 18, 365–381. doi:10.5194/nhess-18-365-2018
Vicente-Serrano, S., Beguería, S., and López-Moreno, J. (2010). A multiscalar drought index sensitive to global warming: The standardized precipitation evapotranspiration index. J. Clim. 23, 1696–1718. doi:10.1175/2009JCLI2909.1
Warner, K., Hamza, M., Oliver-Smith, A., Renaud, F., and Julca, A. (2010). Climate change, environmental degradation and migration. Nat. Hazards 55, 689–715. doi:10.1007/s11069-009-9419-7
Warszawski, L., Frieler, K., Huber, V., Piontek, F., Serdeczny, O., and Schewe, J. (2014). The inter-sectoral impact model intercomparison Project (ISI–mip): Project framework. Proc. Natl. Acad. Sci. 111, 3228–3232. doi:10.1073/pnas.1312330110
Wetter, O., Pfister, C., Werner, J. P., Zorita, E., Wagner, S., Seneviratne, S. I., et al. (2014). Erratum to: The year-long unprecedented European heat and drought of 1540 – A worst case. Clim. Change 125, 365–367. doi:10.1007/s10584-014-1193-1
Wu, Z., and Huang, N. E. (2009). Ensemble empirical mode decomposition: A noise-assisted data analysis method. Adv. Adapt. Data Anal. 01, 1–41. doi:10.1142/S1793536909000047
Wu, Z., Huang, N. E., Wallace, J. M., Smoliak, B. V., and Chen, X. (2011). On the time-varying trend in global-mean surface temperature. Clim. Dyn. 37, 759. doi:10.1007/s00382-011-1128-8
Xing, Y., Shao, D., Liang, Q., Chen, H., Ma, X., and Ullah, I. (2022). Investigation of the drainage loss effects with a street view based drainage calculation method in hydrodynamic modelling of pluvial floods in urbanized area. J. Hydrol. 605, 127365. doi:10.1016/j.jhydrol.2021.127365
Keywords: projections, drought, water scarcity, climate variability, climate drivers, south Pakistan
Citation: Ullah I, Zeng X-M, Hina S, Syed S, Ma X, Iyakaremye V, Yin J and Singh VP (2023) Recent and projected changes in water scarcity and unprecedented drought events over Southern Pakistan. Front. Earth Sci. 11:1113554. doi: 10.3389/feart.2023.1113554
Received: 01 December 2022; Accepted: 02 May 2023;
Published: 11 May 2023.
Edited by:
Hakki Baltaci, Gebze Technical University, TürkiyeReviewed by:
Fabrício Daniel Dos Santos Silva, Federal University of Alagoas, BrazilLincoln Muniz Alves, National Institute of Space Research (INPE), Brazil
Copyright © 2023 Ullah, Zeng, Hina, Syed, Ma, Iyakaremye, Yin and Singh. This is an open-access article distributed under the terms of the Creative Commons Attribution License (CC BY). The use, distribution or reproduction in other forums is permitted, provided the original author(s) and the copyright owner(s) are credited and that the original publication in this journal is cited, in accordance with accepted academic practice. No use, distribution or reproduction is permitted which does not comply with these terms.
*Correspondence: Xin-Min Zeng, eGlubWluLnplbmdAaGh1LmVkdS5jbg==; Xieyao Ma, eHltYUBudWlzdC5lZHUuY24=