 Rouxian Pan
 Zhiyong Han
 Qi Su
Qi Su Guangwei Li
 Xusheng Li
 Yalin Li1
 Xianyan Wang
- 1School of Geography and Ocean Science, Nanjing University, Nanjing, China
- 2Department of Geographic Science, Faculty of Arts and Sciences, Beijing Normal University, Zhuhai, China
- 3School of Earth Sciences and Engineering, Nanjing University, Nanjing, China
The Jinsha River, upstream of the Yangtze River, flows through the southeastern margin of the plateau, providing an opportunity to study the plateau uplift relative to the Sichuan basin through fluvial geomorphology. Eight tributaries of the Jinsha River located at the transition boundary from the plateau to the basin were analyzed for the feature of longitudinal profile and its evolution. The spatial distribution of slope-break knickpoints in the catchment was determined by slope-area analysis and integration analysis. Further, the magnitude and timing of the base level lowering (i.e., uplift of the Tibetan Plateau) were estimated by reconstructing the river longitudinal profile. The results show that there are two levels of slope-break knickpoints, with average elevations of 2865 m and 1523 m, corresponding to base levels relatively lowering of 1400 m and 1100 m, respectively. With reference to the long-term downcutting rate of the Jinsha River, the timings of these two phases base level lowering and uplifts are estimated to be ∼21–24 and ∼7–13 Ma, respectively. These are close to the timing of two uplifts revealed by inversion modeling of river longitudinal profiles. Therefore, the uplift of the studied region on the Tibetan Plateau can be divided into two stages, the early stage (∼20 Ma) uplift from 1500 to 2900 m and the late stage (∼10 Ma) uplift from 2900 to 4000 m, which further supports the staged outside uplift of the Tibetan Plateau.
1 Introduction
In the Cenozoic, a collision of the Eurasian and Indian plates formed the Tibetan Plateau (Figure 1), known as the third pole of the Earth, whose uplift has shaped the current geomorphic pattern of Asia, influencing the material cycle among the Earth’s spheres, and having a profound impact on regional and global climate and environmental changes (Berner et al., 1983; An et al., 2001; Chen et al., 2021). Reconstructing the uplift process of the Tibetan Plateau facilitates elucidating the uplift and deformation mechanisms of the plateau and its environmental effects. Previous studies have shown that the uplift of the plateau is a multi-staged process, rather than a simple event (Ding et al., 2017; Cao et al., 2022). The timing and magnitude of the plateau uplift are still highly controversial, which is generally associated with different methods and study areas. For example, studies based on ancient pollens, palaeontological fossils, and a series of paleolandform from the plateau margins suggest a cumulative uplift of 3500–4000 m since the late Pliocene (Xu et al., 1973; Li et al., 1979; Deng et al., 2012; Chen et al., 2020), whereas other studies based on tectonic and thermal history suggest that the plateau initiated to uplift significantly earlier in the central plateau during the Eocene (Royden et al., 2008; Ding et al., 2017), and margins mainly started in Miocene (Wang et al., 2012a; Li et al., 2019). In addition, the debate on the uplift mechanism of the Tibetan Plateau has also mainly focused on two models: tectonic extrusion (Tapponnier et al., 1982; Tapponnier et al., 2001) and the lower crustal flow (Clark and Royden, 2000).
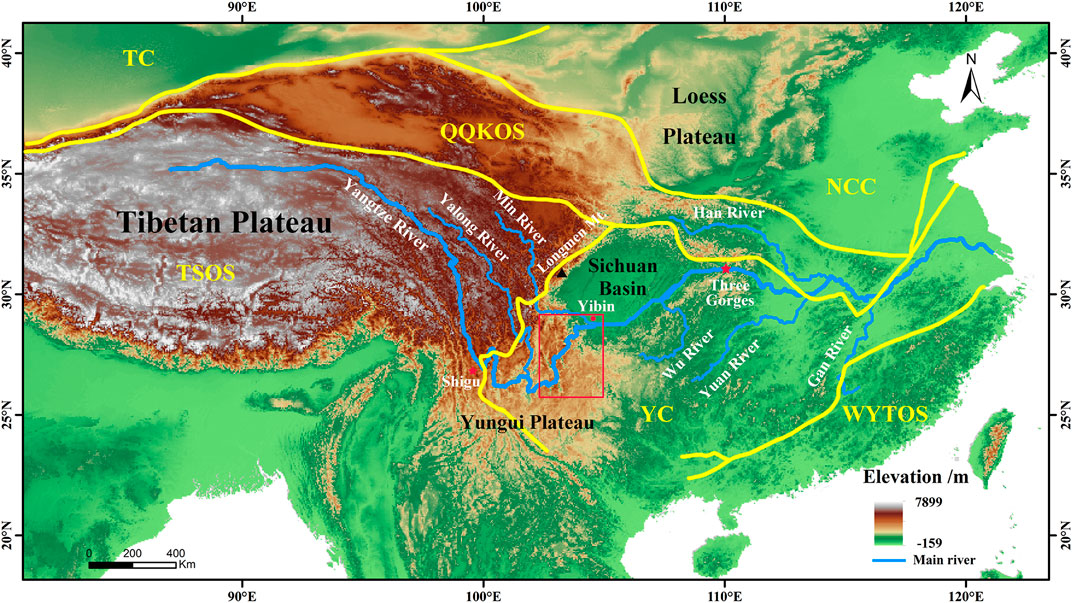
FIGURE 1. Terrain of the Yangtze River baisn. The yellow lines are tectonic unit boundaries (Pan et al., 2009). NCC, North China Craton; QQKOS, Qinling-Qilian-Kunlun Orogenic System; TC, Tarim Craton; TSOS, Tibet-Sanjiang Orogenic System; WYTOS, Wuyi-Yunkai-Taiwan Orogenic System; YC, Yangtze Craton. The red box indicates the study area (Figure 2).
As a zone of steep topographic change in the transition from the plateau to the surrounding basin, the southeastern margin of the Tibetan Plateau was suggested to be the key for the study of plateau uplift. A range of evidence from tectonic deformation, topographic relief, sedimentary records, and isotope palaeoaltimetries indicate that the eastern edge of the plateau reached to high elevation during the Eocene (∼45–40 Ma) (Wang et al., 2012a; Cao et al., 2019; Su et al., 2019; Xiong et al., 2020), while deformation at the eastern margin of the plateau shows another more widely recorded period (∼15–10 Ma) of its uplift (Clark et al., 2005; Ouimet et al., 2010; Tao et al., 2020). On the southeastern edge of the Tibetan Plateau, the palaeo-elevation reconstructed by stable isotopes shows that the plateau existed in the area during the Eocene-Oligocene, while the southernmost part of the region was uplifted to its present elevation during the Miocene (Cook et al., 2013; Hoke et al., 2014; Li et al., 2015; Tang et al., 2021). Furthermore, some researchers consider the time when large rivers incised deeply into the plateau as the timing of plateau uplift. For instance, thermochronology studies on the Dadu River and Yalong River constrain the uplift of the southeastern plateau at ∼9–13 Ma by river incision histories (Clark et al., 2005; Ahmed, 2019).
Therefore, the results obtained by different methods in this area are inconsistent, probably due to the limitations and uncertainties of these methods. For example, low-temperature thermochronological methods have been widely applied for constraining the timing of the plateau uplift by the denudation rate, but cannot estimate the detailed magnitude of uplift. Stable isotope palaeoaltimetries can calculate the magnitude of uplift, but they are always influenced by the “inverse altitude effect” due to temperature and other effects (Jing et al., 2022). The deformation analysis can also be probably affected by activities in the local domains. Hence, the uplift process on the southeastern edge of the plateau requires to be further investigated through diversified evidence.
In recent years, fluvial geomorphology has been successfully applied to study tectonic uplift, with channel steepness becoming a good proxy for differential uplift at the active edge of the plateau (Kirby et al., 2003). In the southeastern Tibetan Plateau, the Yangtze River and its tributaries, one of the largest drainage systems in the world, originate and flow through the region.
It is an ideal place for studying structural geomorphology concerning the uplift and expansion of the Tibetan Plateau since the Cenozoic, especially the Miocene. Therefore, we target the upper reaches of the Yangtze River (Jinsha River and its tributaries) within the plateau-basin transition zone of the southeastern Tibetan Plateau (Figure 1) and utilize the fluvial geomorphology analysis methods (e.g., mobile knickpoint analysis, longitudinal river profile reconstruction and inversion simulation of the river bedrock channel) to constrain the uplift history of the southeastern margin of the Tibetan Plateau.
2 Background of the study area
2.1 Geological background
The study area, located in the southeastern Tibetan Plateau, falls within the Kangding-Xichang sub-region of the Qiangtang-Sanjiang tectonic zone, which is one of the major tectonic units of the Tibetan Plateau, tectonically belonging to the north-south extending Sichuan-Yunnan tectonic belt. The northern section of the left strike-slip Xiaojiang Fault (Figure 2) cuts through the region as the regional main controlling fault, which was strongly active since Miocene (Chen et al., 2011). The Palaeozoic-Cenozoic sedimentary/metasedimentary rocks, dominated by sandstones, shales, limestones, marls, dolomites, and bioclastic rocks, are exposed in the majority of the study area, as well as several Precambrian basement outcrops. The large Permian basalt (E’meishan basalt) is widely distributed in the area, with a few intrusive rocks only scattered in the western part of the study area. Quaternary sediments are mainly distributed in faulted basins and river valleys (Figure 2).
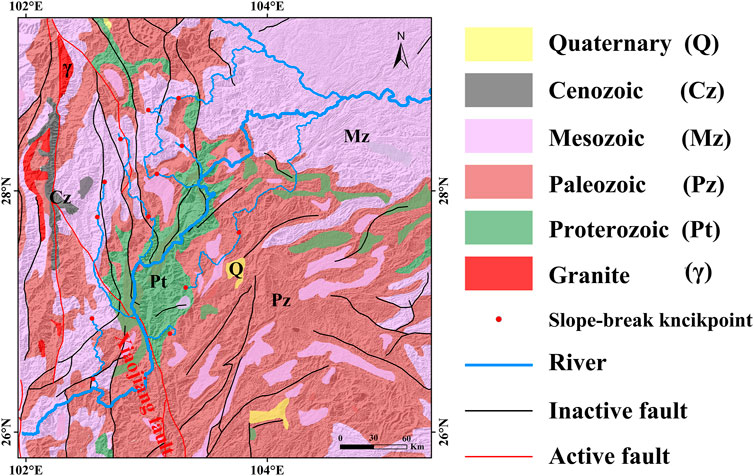
FIGURE 2. Simplified geological map of the study area.
To the east, the Sichuan Basin, a superimposed basin, has undergone multiple phases of tectonic evolution and sedimentary infilling. The southwestern part of the Sichuan Basin was mainly characterized as an intra-land depressional basin during the Cenozoic (Li et al., 1995; Chen et al., 2008; He et al., 2011). The basin during Paleogene mainly received river-lake deposits, with a gradually decreasing sedimentation. The enhanced tectonic uplift at the end of the Paleogene caused widespread interruption of deposition, and deposition along the piedmont belt began to develop in the Pliocene (Huang and He, 2016).
Large sutures (Wang et al., 2012b) or regional fault zones (Li et al., 2018) along the southwest boundary of the Sichuan basin have been suggested. The north segment was identified as a thrust fault (Wang et al., 2012b). Hence, it is reasonable to deduce the uplift of studied region is caused by the movement of this thrust fault (basin boundary fault).
2.2 Morphological setting
The study area, located at the boundary between Sichuan Province and Yunnan Province of China, is situated at the intersection of three geographic units, i.e., the Western Sichuan Plateau, the Yunnan-Guizhou Plateau, and the Sichuan Basin, and exhibits a sharp decline in topography from southwest to northeast (Figure 3). The geographical coordinates are 26.5°–29.5°N and 102.5°-105.5°E, with a total area of 144,700 km2. Within this territory, the highest elevation is 5877 m and the lowest is 219 m, with an elevation difference of 5658 m. The swath profile shows there is a relic plateau surface situated at ∼2500 m, which is separated by river valleys incised into the plateau. The Jinsha River has the maximum incision depth, up to ∼1500 m. The transition zone between the plateau and the Sichuan Basin is approximately 100 km wide, with a decreasing altitude from ∼2500 to ∼600 m (Figure 3). This region is dominated by terrain with elevations of 1000–2500 m. The proportion of moderately undulating topography with a relief of 500–1000 m is the highest, accounting for 42.26% of the total area. Daily precipitation data in the region show that rainfall is concentrated from May to October, with a mean annual rainfall of 812 mm (Li et al., 2014). The mean annual temperature is 16°C–18°C and the water-heat combination is generally consistent across the region, belonging to the same subtropical monsoon climate.
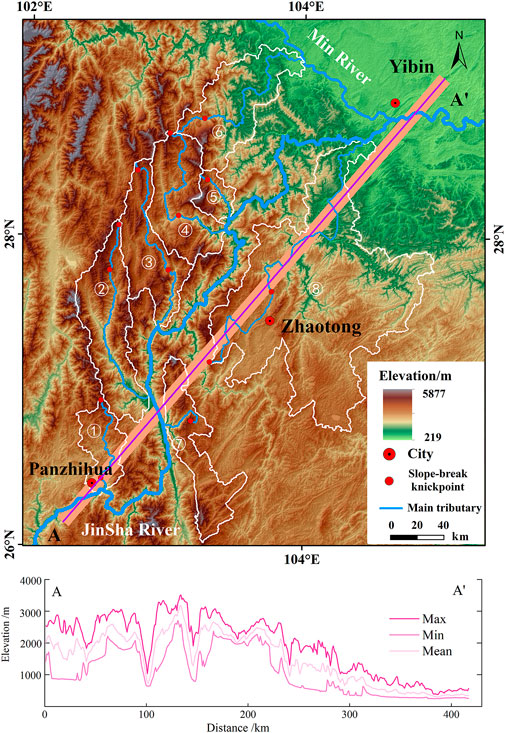
FIGURE 3. Topography of the study area and the range of each catchment.
In the region, the Jinsha River, the upper reaches of the Yangtze River, spans Sichuan, Tibetan, and Yunnan provinces, with the largest tributary, the Yalong River, and the Min River. The Min River joins the Jinsha River in Yibin, Sichuan Province (Figure 1 and Figure 2), and the main river starts to be called the Yangtze River. In the study area, there are eight tributaries of the Jinsha River and their catchments distributed between Panzhihua and Yibin, namely, Cha River, Heishui River, Xixi River, Yiutong River, Xisujiao River, Mabian River, Mashu River, and Heng River (Figure 3). These eight rivers all originate from the plateau surface and share the Sichuan basin as the base level. The Mabian River and Heng River flow into the Sichuan basin and then join the Jinsha River, while the other six rivers join the Jinsha River directly within the plateau. The detailed information on the rivers (Table 1) shows that these eight rivers all have a high relief, up to >2000 m. The length of the rivers varies significantly, with the longest Heng River of ∼290 km. The Mashu River is the shortest (32 km) one, and the others are between 100 and 200 km long. Further, the Xisujiao River has the smallest basin area of 707 km2 and the Heng River gives the largest basin of 15016 km2. According to the classification scheme of the geomorphic stages of evolution (Strahler, 1952), the eight catchments are mainly in the mature stage. The longitudinal profiles cannot generally be fitted with an exponential function, indicating that the longitudinal profiles have not yet reached the equilibrium state. The hypsometric integral (HI) of eight catchments is found to be 0.31–0.60 with an average of 0.51 based on elevation-relief ratio method, which indicates the most watersheds are at mature stage.

TABLE 1. Geomorphological characteristics of the eight rivers in the study area.
In the upper panel, the purple line represents the southwest-northeast topographic line in the study area, with a 5 km buffer zone to obtain the swath profile shown in orange-pink. The white lines represent the boundaries of the river basin.➀ Cha River; ➁ Heishui River; ➂ Xixi River; ➃ Liutong River; ➄ Xisujiao River; ➅Mabian River; ➆ Mashu River; ➇ Heng River. The lower panel shows the swath profile.
3 Data and methods
The DEM data were downloaded using the software of 91 Map Assistant. This software implements the download of reprocessed data of ALOS PALSAR 12.5 m resolution DEM, provided by NASA. The initial resolution is 18.6 m, so we resampled it to 20 m resolution to facilitate calculation and simulation.
3.1 Migrating knickpoints
Using the stream power incision model can obtain the Slope-area plots where the slope of the fitted line is the concavity of the channel and the intercept of the line is the steepness of the channel (Kirby et al., 2003). Two types of knickpoints can be identified on the Slope-area plots, i.e., vertical-step knickpoint and slope-break knickpoint (Kirby and Whipple, 2012). The channel slope increases sharply near the knickpoint, and the steepness index above and below the point remains unchanged, which is called a vertical-step knickpoint, also known as an immobile knickpoint, and its formation is related to the high erosion resistance of the local bedrock. The slope-breaking knickpoint is also known as a mobile knickpoint, and its formation is related to the decline of the base level. When the base level of a river drops, a slope-breaking knickpoint will form, and migrate upstream as the headward incision of the river, and its vertical migration distance is only time-dependent, resulting in the knickpoint being located at the same elevation in all tributaries of the catchment (Niemann et al., 2001).
Since information may be lost when the original topographic data are smoothed and resampled during the production of the Slope-area plot, Perron and Royden (2013) proposed the integration analysis method, where the catchment area is integrated over the distance from the river source, converting the river longitudinal profile into a straight line with the slope indicating the channel steepness. The uncertainties of the resulting steepness indices are extremely small, due to avoid the errors introduced repeatedly when differentiating the elevation. Slope-area analysis can only determine the distribution of knickpoints for one channel at a time, whereas the integration analysis can determine the distribution of knickpoints for all channels in a catchment simultaneously. Here, we combined both methods for comparison to determine the knickpoints.
Knickpoints form and migrate upstream when the base level drop. The location of the knickpoint records the timing of the relative decline of erosional basis, while the downstream steepness index reflects the lowering rate. Thus, the complete uplift history of the region can be inferred from the migrating knickpoints on the longitudinal profile of the river. At present, the inversion of uplift history is based on the linear hypothesis (Fox et al., 2014; Rudge et al., 2015; Pedersen et al., 2018).
3.2 Analysis of knickpoints
Slope-area analysis was implemented using the ArcGIS stream profiler toolbox and MATLAB programs, with a smoothing window of 250 m (Whipple et al., 2007). Differently, Chi analysis was performed in Matlab using the Topotoolbox (Schwanghart and Scherier, 2014). By comparing the results calculated with different parameters, a minimum area of the catchment of 105 m2, and a smoothing window of 100 m in the integration method were adopted.
3.3 Reconstruction of longitudinal profile
There is a proportional relationship between the channel slope and the basin area above the knickpoint, and the principle of the channel profile reconstruction is to project this proportional relationship below the knickpoint to obtain the palaeochannel (Kirby and Whipple, 2012). In general, directly using the steepness index (ks) and concavity index (θ) of the river above the knickpoints will produce a large error in the projected paleochannel, so we adopted the method proposed by Forte and Whipple (2019), in which, the original chi and elevation values were preprocessed by unsupervised learning. The difference in elevation between the paleochannel and the modern channel is the downcutting depth, which is the lowering amplitude of the base level near the start point of headward erosion in this study.
3.4 Modelling of river uplift history
Under conditions of homogeneous watershed lithology, uniform rainfall distribution (K is a constant), and a linear relationship between erosion and channel slope (n = 1), from the start point, the elapsed time of a knickpoint migration can be expressed as:
The temporal information of knickpoint migration is transformed to be represented by the river Chi(χ), and the solution obtained using the characteristic linear method, given that the rate of watershed uplift is spatially uniform, is
where the unit of t* is the same as Chi and U* is the dimensionless uplift rate (Goren et al., 2014). The present elevation (t=0) of the river can be expressed as the integral of the uplift rate over the response time:
Differentiation of the Chi values gives the river uplift history as:
where U* (t*) is the dimensionless uplift history, which can be transformed into the dimensioned uplift history U(t) by Eq. 3. The erosion coefficient K is a key parameter in the inversion of the uplift history of a river, and the lower the erosion rate, the longer the uplift history obtained. Considering the size of the studied watershed, we adopt the measured erosion coefficient (K = 1.11 ± 0.10 10−6 m 0.1/a) of the neighboring Dadu River for the calculation (Ma et al., 2020), which has a similar geological, geomorphological and climatic conditions to studied rivers.
Further, Goren et al. (2014) suggested that the best inversion results exist at intervals with time nodes of 10, 20, and 40. It was calculated that the uplift signals were similar at different time intervals and a time node of 40 is chosen in this study. We use a set of open-source codes, RiverProAnalysis, which was based on the Matlab platform and integrated all of these functions (Wang et al., 2022).
4 Results
4.1 Quantitative analysis of river headward erosion
Slope-area analysis has been conducted to obtain the slope-break knickpoints for each river and the ksn values for the different river reaches (Table 2). Most of the rivers can be divided into three reaches for linear fitting. The ksn values tend to increase downstream, indicating that there are slope-break knickpoints in the rivers (Figure 4). For example, two knickpoints in the Heng River locate at 1767 and 2801 m; only one knickpoint in the Mashu River, Mabian River, and Xisujiao River, which are located at 2742, 1543, and 2134 m, respectively (Table 2).
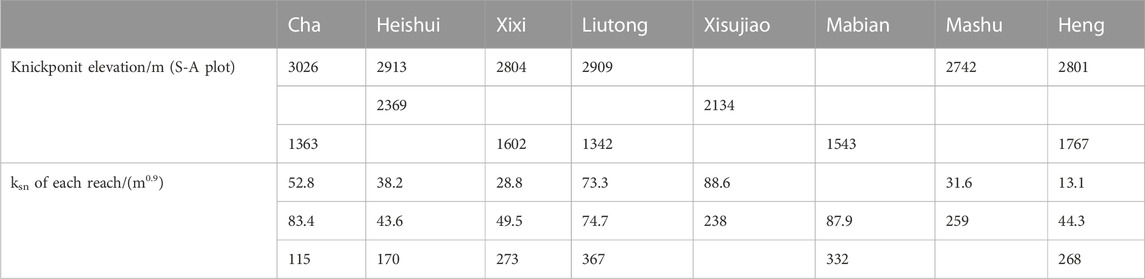
TABLE 2. Elevation of mobile knickpoints determined in S-A plot.
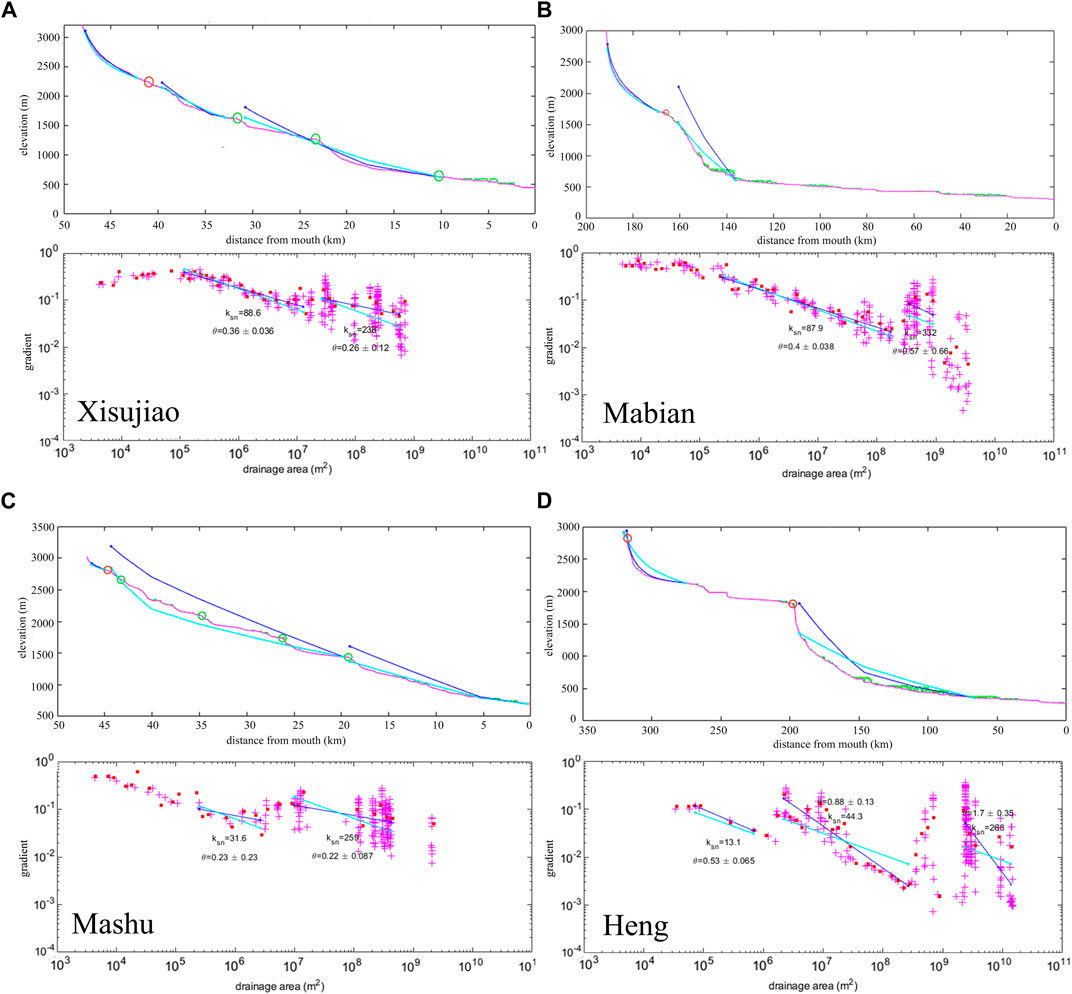
FIGURE 4. River longitudinal profile (upper) and S-A plot (lower) of representative rivers. (A) Xisujiao River; (B) Mabian River; (C) Mashu River; (D) Heng River. The red circles indicate the location of the slope-break knickpoints, the green circles show the location of the vertical-step knickpoint, the green line is the original profile given by DEM data, the red line represents the smoothed profile with a smoothing window of 250, and a 10 m vertical distance to calculate the channel slope. The dark blue line represents the predicted profile fitted by regression of the river concavity, and the light blue line represents the predicted profile fitted by regression of reference concavity (θref = 0.45).
The slope-break knickpoints of these eight rivers are concentrated at three zones with similar elevations, with six at high elevation (2742–3026 m), two at middle elevation (2134–2369 m), and five at low elevation (1342–1767 m). The average elevation of each zone is 2865, 2251, and 1523 m, respectively (Table 2).
Integration analysis is able to identify the distribution of knickpoints on the mainstem and tributaries of each river. The obvious turning points on the χ-z plot indicate that the slope-break knickpoints, which are generated by the base level lower when they concentrate at the same elevation. Using a threshold of 300 m to find slope break knickpoints, it is possible to determine the location of main mobile knickpoints (Figure 5). The frequency histogram plot shows that the knickpoints of each river are not concentrated, but that of all rivers exhibits a unimodal distribution with a peak at ∼1750 m, which is close to the clustering at 1525 m given by the slope-area analysis.
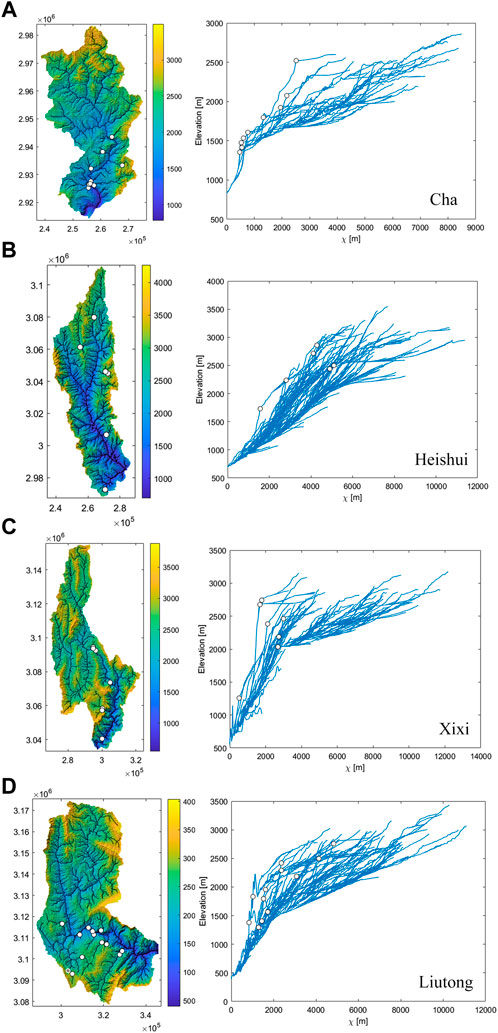
FIGURE 5. Chi plot (right) and the distribution of knickpoints of representative rivers (left). (A) Cha River; (B) Heishui River; (C) Xixi River; (D) Liutong River. The white dots represent knickpoints.
4.2 Amplitude and timing of base level lowering
We choose the Mabian River and Heng River, which take the Sichuan Basin as the base level, to reconstruct the longitudinal profile, and use the bottom edge of the Sichuan Basin as the reference point to calculate the elevation difference between the reconstructed and modern channels as the amplitude of the base level lowering. The results show that the elevation difference below the knickpoint increases rapidly with distance, reaching a maximum at the reference point. Below the reference point, the elevation difference of the Mabian River decreases slightly with distance, while the elevation difference of the Heng River remains almost constant (Figure 6).
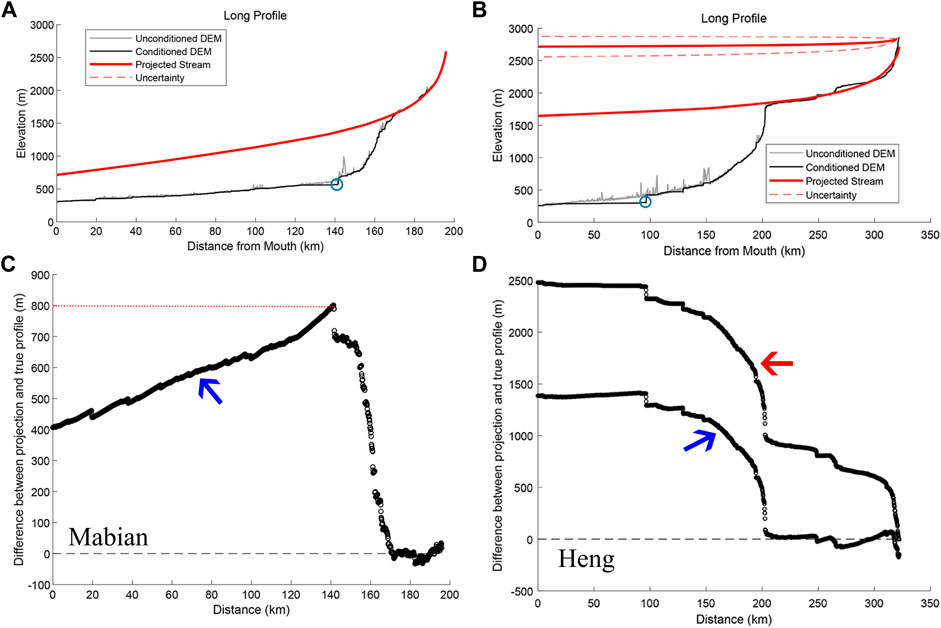
FIGURE 6. Reconstructed longitudinal profiles of the Mabian River and Heng River (A,B) and estimated river downcutting and base level lowering (C,D). The black lines represent the river longitudinal profiles, the red lines represent the reconstructed longitudinal profiles, dotted lines represent the elevation difference between the actual and predicted river longitudinal profiles. The blue circles indicate the location of the edge of the basin bottom. The blue arrow points to the line is calculated using projection from the low knickpoint, while the red arrow points to, that is, calculated using projection from the high knickpoint. The uncertainty is given in a 95% confidence interval.
The reconstructed longitudinal profile based on the upstream above a slope-break knickpoint (1543 m) in the Mabian River indicates an 800 m base level lowering. There are two slope-break knickpoints in the Heng River (2801 and 1767 m), and the results indicate corresponding 2500 ± 150 and 1400 m base level lowering, respectively (Table 3). However, the former datum may be subject to some error due to the short river length above the 2801 m knickpoint.
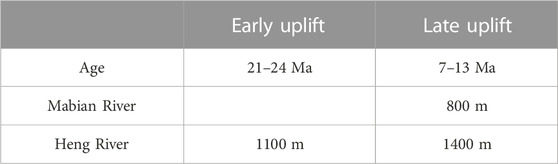
TABLE 3. Amplitude and timing of base level lowering.
Alluvial deposits are present in caves at different elevations on the valley slope near Shigu of the Jinsha River, and burial ages indicate that the river incised ∼1 km between 18 and 9 Ma, corresponding to a downcutting rate of ∼0.11 mm/a (McPhillips et al., 2016). In addition, near Weixi on the right bank of the Jinsha River, Liu-Zeng et al. (2018) collected thermochronology samples along the valley slope and obtained a denudation rate of ∼0.08 mm/a since ∼18 Ma in the area by river incision. These two rates are generally consistent. Hence, assuming a long-term river incision rate of ∼0.11 mm/a in the lower Jinsha River allows calculating the age of base level lowering based on the estimated amplitude of base level lowering. The base level lowering of 2500 ± 150 m yields an approximate age of 21–24 Ma, while the lowering of 800–1400 m gives an approximate age of 7–13 Ma.
4.3 River uplift history inversion
Our inversion modeling result (Figure 7) shows there are differences in uplift histories between the Mabian River and Heng River. The uplift rate of the Mabian River decreases with fluctuation over time, with the larger uplift rate (∼0.34 mm/a) occurring at ∼17–20 Ma, then dropping to ∼0.18 mm/a at ∼16.3 Ma, with insignificant fluctuations thereafter, and then declines again to ∼0.07 mm/a at ∼6.8 Ma. Finally, this low uplift rate has been maintained to the present (Figure 7A). The uplift rate of the Heng River fluctuates over the whole period, with the first peak (∼0.28 mm/a) occurring in the Early Miocene (∼19–22.7 Ma), reaching a second peak (∼0.42 mm/a) in the Late Miocene (∼5.8–7 Ma) (Figure 7B), indicating that two significant uplifts occurred in the region. Both rivers display a quick uplift at ∼20 Ma. However, the Mabian River does not exhibit the quick uplift at ∼5.8–7 Ma, which is seen for the Heng River.
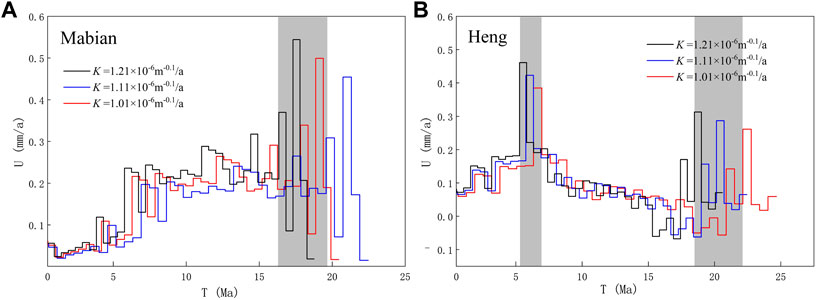
FIGURE 7. Uplift history simulated by the inversion method for the Mabian River (A) and the Hengjiang River (B). The grey bars indicate the period with an increasing uplift rate.
5 Discussion
5.1 Geological influence
The studied eight rivers flow across the southeastern margin of the plateau where Paleozoic and Mesozoic sedimentary rocks are widely exposed in a masaic pattern (Figure 2), which implies this region has a relative homogenous bedrock on a large scale. Generally, the slope-break knickpoints in the first-order tributaries of the lower Jinsha River obtained from the stream power incision model are mainly distributed in sediments (Figure 2), which may be conducive to the preservation of mobile knickpoints.
However, the erodibilities of sandstones, shales, limestones, marls, dolomites, and bioclastic rocks are usually different, hence the lithologic difference may produce lithologically controlled knickpoints. Except the strike-slip faults, no normal or reverse fault in a large scale has been reported (Wang et al., 2014). Even so, the undefined faults or undiscovered faults may produce tectonically controlled knickpoints.
Lithologically controlled and tectonically controlled knickpoints will blend with those knickpoints originated from base level lowering. The observed knickpoints that do not cluster at an altitude may be influenced by local factors. Due to only two slope-break knickpoints at the middle elevation are obtained by the slope-area analysis, they are probably not related to the base level lowering. Projecting knickpoints on the geological map, it can be found that most of the slope-break knickpoints do not have a clear correspondence with stratigraphic boundaries or faults (Figure 2), further suggesting that the formation of these knickpoints is related to the base level lowering.
The fitting of upstream data points of the Xisujiao River and Mabian River is good, while the fitting of downstream data points which exhibit a large scatter is poor (Figure 4). The main reason why the downstream data points do not show an ideal linear distribution is probably that these two rivers have a smaller catchment area and a weaker stream power than other rivers. After the potential slope-break knickpoints migrate into these tributaries, they are more affected by the river substrate.
5.2 Two-stage plateau uplift revealed by changes in base level
The base level reconstructed on mobile knickpoints indicates that the lowering of the Sichuan Basin relative to the southeastern margin of the Tibetan Plateau can be divided into two stages, with the late stage (7–13 Ma) showing a relative lowering of ∼1100 m and the early stage (21–24 Ma) showing a relative lowering of ∼1400 m. The changes in the base level may be attributed to 1) the uplift of the Tibetan Plateau, 2) the graben subsidence of the Sichuan Basin, and 3) the intense denudation of the Sichuan Basin. It has been shown that the Sichuan Basin is mainly surrounded by reverse faults, rather than a graben basin (Xiong et al., 2015). Therefore, the base level lowering cannot be attributed to basin subsidence. Quantitative thermal history simulations of fission tracks in apatite samples indicate that the Sichuan Basin has suffered denudation with a thickness generally greater than 1 km during the Neogene (Deng et al., 2009). This indicates that Miocene denudation did occur, with a denudation rate of approximately 0.056 mm/a, which is significantly lower than the long-term downcutting rate of the river valley (0.11 mm/a). Further, based on a simple isostatic calculation, denudation only results in an elevation loss of only about 1/5 of the denudation thickness. It is difficult to form a large knickpoint due to pure denudation. Considering that the denudation also occurs in the plateau, we infer that the basin denudation is not the main cause of the base level lowering.
There is also the possibility that the Sichuan Basin did not subside relative to the plateau, but that a mobile knickpoint crossed the Sichuan Basin and entered the plateau. For example, it is shown that the tributary (Yuan River) flowing into the Jianghan Basin has maintained a low erosion rate (<0.04 km/Ma) since ∼30 Ma, whereas the tributary (Wu River) flowing into the Sichuan Basin has experienced a sudden increase in downcutting rate to 0.07 km/Ma at 21–16 Ma. This difference is thought to reflect a decrease in the base level of erosion due to the Yangtze River cutting through the Three Gorges (Figure 1; Jiao et al., 2022). However, the altitude difference between the Sichuan Basin and Jianghan Basin is approximately 300 m, meaning that the base level change due to the Three Gorges cutting-through is approximately equal to the altitude difference, which is obviously smaller than the approximate 1 km base level lowering estimated for the Jinsha River. This suggests that the observed large lowering of the Sichuan Basin relative to the plateau is not related to cutting through the Three Gorges.
Further, there is another possibility that the sudden increase in the incision rate of the Wu River at 21–16 Ma indicates the uplift of the Yungui Plateau, further southeast to the Tibetan Plateau, where the catchment of the Wu River is located (Figure 1). Because the timing of increase incision rate of the Wu River is close to the early change stage (21–24 Ma) of the Mabian and Heng rivers in this study. The Tibetan Plateau gradually declines in height towards the southeast, and gradually transits to the Yungui Plateau. When a tectonic uplift occurs on the Tibetan Plateau, it is logical that the YunGui Plateau also rises correspondingly.
Therefore, the two stages of relative lowering of the base level (Sichuan Basin), as derived from the mobile knickpoints, should be a result of plateau uplift. At least two tectonic uplifts should have occurred in the studied region on the southeastern margin of the Tibetan Plateau, with ∼1400 m uplift in the early stage (∼21–24 Ma) and ∼1100 m uplift in the late stage (∼7–12 Ma). This is also generally supported by the results of inversion modeling of river longitudinal profiles. The change in channel uplift rate by inversion modeling occurred at 20 and ∼5.8–7 Ma, respectively, which is comparable with those of the base level lowering method. The change in base level is slightly earlier than the change in channel uplift rate, which may be related to the uncertainty in the erosion coefficient (1.11 × 10⁻⁶ m 0.1/a) or the long-term incision rate of the valley (0.11 mm/a). Generally, the similarity of the two results indicates that they are controlled by the same geological process, that is, the process of regional uplift.
Furthermore, although the modeled uplift histories of Heng River and Mabian River differ somewhat, both show high uplift rates at ∼20 Ma, which is consistent with the early stage of uplift (21–24 Ma) of the plateau (Figure 8). The different uplift histories of the two rivers in the late stage may be due to the influence of local fault activity, requiring further work.
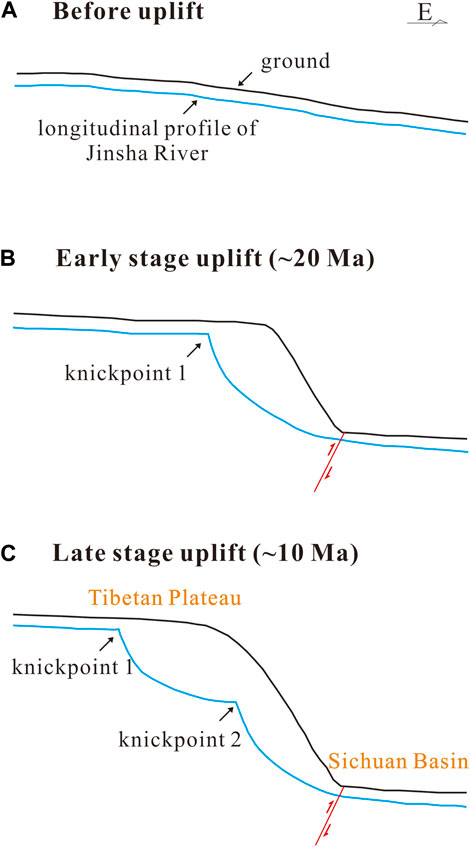
FIGURE 8. Sketch diagram showing the relation between the formation of mobile knickpoints and the uplift of the Tibetan Plateau at three stages (A–C).
5.3 Comparison with other uplift records
Our study on the river longitudinal profile shows that the studied region on southeastern Tibetan Plateau underwent two rapid and large uplifts phases relative to the Sichuan Basin during the Miocene, which are generally consistent with previous studies on the eastern margin of the Tibetan Plateau. For example, in the Longmen Mountains, a transition region between the Sichuan Basin and the Tibetan Plateau, Kirby et al. (2003) first used the biotite 40Ar/39Ar of and zircon/apatite (U-Th)/He to confine the rapid denudation of the central Longmen Mountain at ∼5–12 Ma. Subsequently, Godard et al. (2009) used thermochronological forward modeling of vertical section data to update the age to 8–11 Ma. In the southern of Longmen Mountain, thermochronological studies suggest that the timing of regional rapid denudation events was confined to 8–10 Ma (Guenthner et al., 2014; Tian et al., 2014). Based on thermal data from the western margin of the Sichuan basin and from along the Xianshuihe fault, the counterclockwise bending/rotation of the Sichuan basin was initiated in late Cenozoic time (∼13 Ma) (Wang et al., 2014). In addition, Wang et al. (2012a) identified two events of rapid denudation in the central Longmen Mountain, one occurring at the Late Oligocene to Early Miocene (20–30 Ma) and the other occurring at 10–15 Ma; both events in this area were mainly controlled by the activity of Longmen Mountain Fault. Similarly, Zhang et al. (2016) reported two rapid exhumation events in the adjacent Jiulong area during the Early Oligocene (∼30 Ma) and Late Miocene (∼7–8 Ma), indicating a correlation with the regional activity of the Jiulong Fault. Thermochronological data from the Deqin area of northern Yunnan show two rapid cooling during the Early Cenozoic and Miocene (<∼20 Ma), which was mainly influenced by fault activity and river incision in the area (Liu-Zeng et al., 2018). A recent study suggests that rises in the east and west parts of the Northern TP during 15 to 7 Ma reached a high elevation close to that of today, which can be correlated to the second-stage uplift in the lower reach of Jinsha River (Miao et al., 2022).
Additionally, Clark et al. (2005) suggest that the timing of major rivers incising into the plateau at the southeastern margin can be considered as the onset of plateau uplift. Rapid erosion of the Dadu River occurred at ∼10 Ma, with an erosion rate of 0.33 ± 0.04 km/Ma. Results from the Yalong River’s transect indicate that rapid erosion occurred earlier than 14 Ma, with an erosion rate of 0.34 ± 0.02 km/Ma. All these correspond with the Rapid erosion of the Yangtze River beginning at ∼10 Ma (Ouimet et al., 2010). The riverbed profile of the middle Mekong River also records a rapid denudation event that also occurred at 17 Ma, although this incision signal was interpreted as a climate-driven event (Nie et al., 2018).
The above findings all point to rapid regional denudation and river incision since the Early Miocene. The timing is generally comparable with our results. Based on our knickpoint studies, we believe that this event should be more tectonically related, i.e., the tectonic uplift at the southeastern edge of the plateau in the Miocene led to strong river incision due to the relative lowering of base level of erosion. Clark et al. (2005) recovered the palaeo-topography of the southeastern margin of the plateau using planation surfaces and suggest the plateau surface had uplifted ∼3 km since the late Miocene by the isostatic rebound.
Furthermore, this Miocene tectonic uplift on the southeastern plateau margin is also widespread through the Tibetan Plateau margin. For example, previous studies suggest that the uplift of the northeastern, northwestern and central Tibetan Plateau and the Pamir Plateau occurred at 25–20 Ma (George et al., 2001) and the West Kunlun since Early Miocene (Jiang and Li, 2014; Li et al., 2019). The plateau expanded to the east and north and reached a height and width close to its current state due to a significant uplift at 15–10 Ma (Hough et al., 2011; Wang et al., 2012a). The low-temperature thermochronology, sedimentary, and tectonic deformation records show that main tectonic uplifts and denudations in different parts of the plateau are quasi-simultaneous and can be divided into four stages, respectively 60–35, 25–17, 12–8 (17–12 Ma in southern Tibetan), and 5 Ma (Wang et al., 2011). Another comprehensive study also shows that the uplift of the Tibetan Plateau was episodic and can be divided into five stages, reaching an average altitude of ∼500 m at 60–50 Ma, ∼1000 m at 45–34 Ma, ∼3500 m at 25–17 Ma, and a maximum height at 12–8 Ma (Zhang et al., 2013; Cao et al., 2022). All of the above studies indicate that the plateau margins have experienced two-staged tectonic uplifts since the Miocene (Wang et al., 2011; Zhang et al., 2013), roughly corresponding to the early uplift (21–24 Ma) and late uplift (7–13 Ma) revealed by our study. The magnitude of the two uplifts estimated by previous studies is about 3000 m (Zhang et al., 2013), which is close to that estimated in this study (2500 m). The above comparison suggests that the two-staged uplifts on the southeastern margin of the Tibetan Plateau can roughly represent the uplift process of the entire plateau margins.
This result is also corroborated by paleoclimate studies of the evolution of the East Asian summer monsoon which is sensitive to the uplift of the Tibetan Plateau. The monsoon did not exist in northern East Asia until the plateau reached half of its present height, and was continually strengthened with plateau uplifting, and the aridity to the north of the plateau was simultaneously intensified (Liu, 2000). Intensified aridity will lead to an increase in dust release and a corresponding increase in dust deposition in the downwind region. Studies show that dust deposition experienced a stepwise expansion in the Loess Plateau, from the west at ∼25 Ma to the center at ∼20 Ma, and to the east at ∼7 Ma (Meijer et al., 2021). The episodic expansion can generally be correlated with the two-staged uplifts found in our previous study. The ∼20 Ma expansion was once associated with the uplift of the Tibetan Plateau (Guo et al., 2008), and the ∼7 Ma expansion was thought to be due to the establishment of winter monsoon circulation and inland aridification, both of which are associated with the uplift of the Tibetan Plateau (An et al., 2001).
6 Conclusion
The eight tributaries of the lower Jinsha River are located in the transition zone between the Tibetan Plateau and the Sichuan Basin and take the Sichuan Basin as their erosion base. Slope-area and integration analysis shows that there are two levels of slope-break knickpoints associated with changes in the erosion base on these rivers, with an average elevation of 2865 and 1523 m, respectively. The reconstruction of the longitudinal profiles of the rivers shows a drop in the erosion base of 1400 and 1100 m, respectively. The two-staged uplift events in the studied region on the Tibetan Plateau are estimated to be 21–24 and 7–13 Ma, respectively, with reference to the long-term downcutting rates of the Jinsha River obtained by previous studies. In addition, the numerically inverted river longitudinal profiles also reveal two similar uplift events. Thus, the uplift of the studied region is divided into two stages, the early stage (∼20 Ma) when the plateau uplifts from 1500 to 2900 m, and the late stage (∼10 Ma) when the plateau uplifts from 2900 to 4000 m. This finding confirms that the stepwise uplift of the Tibetan Plateau proposed by previous studies also occurs at the southeastern edge of the plateau.
Data availability statement
Publicly available datasets were analyzed in this study. This data can be found here: https://search.asf.alaska.edu/.
Author contributions
RP: collected DEM data, made calculation and simulation and prepared the draft. ZH: designed this study and revised the draft. QS: revised the draft and contributed some calculation methods. GL: contributed some ideas and revised the draft. YL: collected the geological data and drew the geological map. XL: contributed some ideas and revised the draft. XW: contributed some ideas and revised the draft.
Funding
This study was funded by the National Natural Science Foundation of China (Grant No. 42021001).
Conflict of interest
The authors declare that the research was conducted in the absence of any commercial or financial relationships that could be construed as a potential conflict of interest.
Publisher’s note
All claims expressed in this article are solely those of the authors and do not necessarily represent those of their affiliated organizations, or those of the publisher, the editors and the reviewers. Any product that may be evaluated in this article, or claim that may be made by its manufacturer, is not guaranteed or endorsed by the publisher.
Supplementary material
The Supplementary Material for this article can be found online at: https://www.frontiersin.org/articles/10.3389/feart.2023.1124362/full#supplementary-material
References
Ahmed, S. (2019). Uplift of the eastern margin of Tibetan plateau and its impact on river network pattern and landscape formation[D]. Hangzhou, China: Zhejiang University.
An, Z., Kutzbach, J., Prell, W., and Porter, S. C. (2001). Evolution of Asian monsoons and phased uplift of the Himalaya–Tibetan plateau since Late Miocene times. Nature 411 (6833), 62–66. doi:10.1038/35075035
Berner, R., Lasaga, A., and Garrels, R. (1983). The carbonate-silicate geochemical cycle and its effect on atmospheric carbon dioxide over the past 100 million years. Am. J. Sci. 283, 641–683. doi:10.2475/ajs.283.7.641
Cao, K., Wang, G., Leloup, P., Maheo, G., Xu, Y., van der Beek, P. A., et al. (2019). Oligocene-Early Miocene topographic relief generation of southeastern Tibet triggered by thrusting. Tectonics 38 (1), 374–391. doi:10.1029/2017tc004832
Cao, K., Tian, Y., van der Beek, P., Wang, G., Shen, T., Reiners, P., et al. (2022). Southwestward growth of plateau surfaces in eastern Tibet. Earth-Science Rev. 232, 104160. doi:10.1016/j.earscirev.2022.104160
Chen, X., Jia, D., Wei, G., Li, B., and Lei, Y. (2008). Meso-Cenozoic sediment transport and tectonic in the Western Sichuan foreland basin [J]. China Geol. 35 (3), 472–481
Chen, H., Hu, J., Qu, H., and Wu, G. (2011). Early mesozoic structural deformation in the chuandian N-S tectonic belt, China. Sci. China Earth Sci. 54, 1651–1664. doi:10.1007/s11430-011-4261-7
Chen, C., Bai, Y., Fang, X., Xu, Q., Zhang, T., Deng, T., et al. (2020). Lower-altitude of the Himalayas before the mid-Pliocene as constrained by hydrological and thermal conditions. Earth Planet. Sci. Lett. 545, 116422. doi:10.1016/j.epsl.2020.116422
Chen, F., Ding, L., Piao, S., Zhou, T., Xu, B., Yao, T., et al. (2021). The Tibetan plateau as the engine for asian environmental change: The Tibetan plateau Earth system research into a new era. Sci. Bull. 66, 1263–1266. doi:10.1016/j.scib.2021.04.017
Clark, M., and Royden, L. (2000). Topographic ooze: Building the eastern margin of Tibet by lower crustal flow. Geology 28 (8), 703–706. doi:10.1130/0091-7613(2000)028<0703:tobtem>2.3.co;2
Clark, M., House, M., Royden, L., Whipple, K., Burchfiel, B., Zhang, X., et al. (2005). Late cenozoic uplift of southeastern Tibet. Geology 33 (6), 525–528. doi:10.1130/g21265.1
Cook, K., Royden, L., Burchfiel, B., Lee, Y. H., and Tan, X. (2013). Constraints on Cenozoic tectonics in the southwestern Longmen Shan from low-temperature thermochronology. Lithosphere 5 (4), 393–406. doi:10.1130/l263.1
Deng, B., Liu, S., Liu, S., Li, Z., and Zhao, J. C. (2009). Restoration of exhumation thickness and its significance in Sichuan Basin, China. J. Chengdu Univ. Technol. Nat. Sci. Ed. 36 (6), 675–686. doi:10.3969/j.issn.1671-9727.2009.06.013
Deng, T., Li, Q., Tseng, Z., Takeuchi, G. T., Wang, Y., Xie, G., et al. (2012). Locomotive implication of a Pliocene three-toed horse skeleton from Tibet and its paleo-altimetry significance. Proc. Natl. Acad. Sci. 109 (19), 7374–7378. doi:10.1073/pnas.1201052109
Ding, L., Spicer, R., Yang, J., Xu, Q., Cai, F., Li, S., et al. (2017). Quantifying the rise of the Himalaya orogen and implications for the South Asian monsoon. Geology 45 (3), 215–218. doi:10.1130/g38583.1
Forte, A., and Whipple, K. (2019). Short communication: The topographic analysis kit (TAK) for TopoToolbox. Earth Surf. Dyn. 7 (1), 87–95. doi:10.5194/esurf-7-87-2019
Fox, M., Goren, L., May, D., and Willett, S. D. (2014). Inversion of fluvial channels for paleorock uplift rates in Taiwan. J. Geophys. Res. Earth Surf. 119 (9), 1853–1875. doi:10.1002/2014jf003196
George, A., Marshallsea, S., Wyrwoll, K., Jie, C., and Yanchou, L. (2001). Miocene cooling in the northern Qilian Shan, northeastern margin of the Tibetan Plateau, revealed by apatite fission-track and vitrinite-reflectance analysis. Geology 29 (10), 939–942. doi:10.1130/0091-7613(2001)029<0939:mci>2.0.co;2
Godard, V., Pik, R., Lavé, J., Cattin, R., Tibari, B., de Sigoyer, J., et al. (2009). Late cenozoic evolution of the central longmen Shan, eastern Tibet: Insight from (U-Th)/He thermochronometry. Tectonics 28 (5). doi:10.1029/2008tc002407
Goren, L., Fox, M., and Willett, S. (2014). Tectonics from fluvial topography using formal linear inversion: Theory and applications to the Inyo Mountains, California. J. Geophys. Res. Earth Surf. 119 (8), 1651–1681. doi:10.1002/2014jf003079
Guenthner, W., Reiners, P., and Tian, Y. (2014). Interpreting date–eU correlations in zircon (U-Th)/He datasets: A case study from the longmen Shan, China. Earth Planet. Sci. Lett. 403, 328–339. doi:10.1016/j.epsl.2014.06.050
Guo, Z., Sun, B., Zhang, Z., Peng, S. Z., Xiao, G. Q., Ge, J. Y., et al. (2008). A major reorganization of Asian climate by the early Miocene. Clim. Past 4 (3), 153–174. doi:10.5194/cp-4-153-2008
He, D., Li, D., Zhang, G., Zhao, L., Fan, C., Lu, R., et al. (2011). Formation and evolution of multi-cycle superposed Sichuan Basin, China [J]. Geol. Sci. 46 (3), 589–606. doi:10.3969/j.issn.0563-5020.2011.03.001
Hoke, G., Liu-Zeng, J., Hren, M., Wissink, G. K., and Garzione, C. N. (2014). Stable isotopes reveal high southeast Tibetan Plateau margin since the Paleogene. Earth Planet. Sci. Lett. 394, 270–278. doi:10.1016/j.epsl.2014.03.007
Hough, B., Garzione, C., Wang, Z., Lease, R. O., Burbank, D. W., and Yuan, D. (2011). Stable isotope evidence for topographic growth and basin segmentation: Implications for the evolution of the NE Tibetan Plateau. Bulletin 123 (1-2), 168–185. doi:10.1130/b30090.1
Huang, H., and He, D. (2016). The prototype and its evolution of the southwestern Sichuan Basin in Tertiary. Geol. Sci. 51 (2), 30. doi:10.12017/dzkx.2016.003
Jiang, X., and Li, Z. (2014). Seismic reflection data support episodic and simultaneous growth of the Tibetan Plateau since 25Myr. Nat. Commun. 5, 5453–5457. doi:10.1038/ncomms6453
Jiao, R., Fox, M., and Yang, R. (2022). Late cenozoic erosion pattern of the eastern margin of the Sichuan Basin: Implications for the drainage evolution of the Yangtze River. Geomorphology 398, 108025. doi:10.1016/j.geomorph.2021.108025
Jing, Z., Yu, W., Lewis, S., Thompson, L. G., Xu, J., Zhang, J., et al. (2022). Inverse altitude effect disputes the theoretical foundation of stable isotope paleoaltimetry. Nat. Commun. 13, 4371. doi:10.1038/s41467-022-32172-9
Kirby, E., and Whipple, K. (2012). Expression of active tectonics in erosional landscapes. J. Struct. Geol. 44, 54–75. doi:10.1016/j.jsg.2012.07.009
Kirby, E., Whipple, K., Tang, W., and Chen, Z. (2003). Distribution of active rock uplift along the eastern margin of the Tibetan Plateau: Inferences from bedrock channel longitudinal profiles. J. Geophys. Res. Solid Earth 108 (B4). doi:10.1029/2001jb000861
Li, J., Wen, S., Zhang, Q., Wang, B., Zheng, B., Li, B., et al. (1979). An exploration of the age, magnitude, and form of the Tibetan Plateau uplift. Chin. Sci. (06), 608–616. (in Chinese).
Li, Y., Zeng, Y., and Yi, H. (1995). Deposition and tectonic evolution of Longmenshan foreland Basin [M]. Chengdu, China: Chengdu University of Science and Technology Press.
Li, W., Wang, J., Guo, Y., and Jin, Q. (2014). Analysis on characteristics of areal precipitation in the middle and lower reaches of the Jinsha River basin [J]. Resour. Environ. Yangtze Basin 23 (006), 846–853. doi:10.11870/cjlyzyyhj201406015
Li, S., Currie, B., Rowley, D., and Ingalls, M. (2015). Cenozoic paleoaltimetry of the SE margin of the Tibetan Plateau: Constraints on the tectonic evolution of the region. Earth Planet. Sci. Lett. 432, 415–424. doi:10.1016/j.epsl.2015.09.044
Li, B., Song, Y., Wang, Q., Wang, Z., Guo, L., Jiang, J., et al. (2018). Magnetic field characteristics and geological significance of Sichuan basin. Geophys. Geochem. Explor. (5), 937–945. doi:10.11720/wtyht.2018.1527
Li, G., Sandiford, M., Fang, A., Kohn, B., Sandiford, D., Fu, B., et al. (2019). Multi-stage exhumation history of the West Kunlun orogen and the amalgamation of the Tibetan Plateau. Earth Planet. Sci. Lett. 528, 115833. doi:10.1016/j.epsl.2019.115833
Liu, X., and Yin, Z. Y. (2000). Sensitivity of East Asian monsoon climate to the uplift of the Tibetan plateau. Palaeogeogr. Palaeoclimatol. Palaeoecol. 183 (3–4), 223–245. doi:10.1016/s0031-0182(01)00488-6
Liu-Zeng, J., Zhang, J., Mcphillips, D., Reiners, P., Wang, W., Pik, R., et al. (2018). Multiple episodes of fast exhumation since Cretaceous in southeast Tibet, revealed by low-temperature thermochronology. Earth Planet. Sci. Lett. 490, 62–76. doi:10.1016/j.epsl.2018.03.011
Ma, Z., Zhang, H., Wang, Y., Tao, Y., and Li, X. (2020). Inversion of Dadu River bedrock channels for the late cenozoic uplift history of the eastern Tibetan plateau. Geophys. Res. Lett. 47 (4), e2019GL086882. doi:10.1029/2019gl086882
Mcphillips, D., Hoke, G., Liu-Zeng, J., Bierman, P. R., Rood, D. H., and Niedermann, S. (2016). Dating the incision of the Yangtze River gorge at the First Bend using three-nuclide burial ages. Geophys. Res. Lett. 43 (1), 101–110. doi:10.1002/2015gl066780
Meijer, N., Dupont-Nivet, G., Barbolini, N., Woutersen, A., Rohrmann, A., Zhang, Y., et al. (2021). Loess-like dust appearance at 40 Ma in central China. Paleoceanogr. paleoclimatology 36 (3), e2020PA003993. doi:10.1029/2020pa003993
Miao, Y., Fang, X., Sun, J., Xiao, W., Yang, Y., Wang, X., et al. (2022). A new biologic paleoaltimetry indicating Late Miocene rapid uplift of northern Tibet Plateau. Science 378 (6624), 1074–1079. doi:10.1126/science.abo2475
Nie, J., Ruetenik, J., Gallagher, K., Hoke, G., Garzione, C. N., Wang, W., et al. (2018). Rapid incision of the Mekong River in the middle Miocene linked to monsoonal precipitation [J]. Nat. Geosci. 11 (12), 944–948
Niemann, J., Gasparini, N., Tucker, G., and Bras, R. L. (2001). A quantitative evaluation of Playfair's law and its use in testing long-term stream erosion models. Earth Surf. Process. Landforms J. Br. Geomorphol. Res. Group 26 (12), 1317–1332. doi:10.1002/esp.272
Ouimet, W., Whipple, K., Royden, L., Reiners, P., Hodges, K., and Pringle, M. (2010). Regional incision of the eastern margin of the Tibetan Plateau. Lithosphere 2 (1), 50–63. doi:10.1130/l57.1
Pan, G., Xiao, Q., Lu, S., Den, J., Feng, Y., Zhang, K., et al. (2009). Subdivision of tectonic units in China [J]. Geol. China 36 (1), 1–28. doi:10.3969/j.issn.1000-3657.2009.01.001
Pedersen, V., Braun, J., and Huismans, R. (2018). Eocene to mid-Pliocene landscape evolution in Scandinavia inferred from offshore sediment volumes and pre-glacial topography using inverse modelling. Geomorphology 303, 467–485. doi:10.1016/j.geomorph.2017.11.025
Perron, J., and Royden, L. (2013). An integral approach to bedrock river profile analysis. Earth Surf. Process. Landforms 38 (6), 570–576. doi:10.1002/esp.3302
Royden, L., Burchfiel, B., and van der Hilst, R. (2008). The geological evolution of the Tibetan Plateau. science 321 (5892), 1054–1058. doi:10.1126/science.1155371
Rudge, J., Roberts, G., White, N., and Richardson, C. N. (2015). Uplift histories of Africa and Australia from linear inverse modeling of drainage inventories. J. Geophys. Res. Earth Surf. 120 (5), 894–914. doi:10.1002/2014jf003297
Schwanghart, W., and Scherler, D. (2014). Short communication: TopoToolbox 2 – MATLAB-based software for topographic analysis and modeling in earth surface sciences. Earth Surf. Dyn. 2 (1), 1–7. doi:10.5194/esurf-2-1-2014
Strahler, A. (1952). Hypsometric (area-altitude) analysis of erosional topography. Geol. Soc. Am. Bull. 63 (11), 1117–1142. doi:10.1130/0016-7606(1952)63[1117:haaoet]2.0.co;2
Su, T., Spicer, R., Li, S., Xu, H., Huang, J., Sherlock, S., et al. (2019). Uplift, climate and biotic changes at the Eocene–Oligocene transition in south-eastern Tibet. Natl. Sci. Rev. 6 (3), 495–504. doi:10.1093/nsr/nwy062
Tang, M., Liu-Zeng, J., Li, C., Wang, W., Zhang, J., and Xu, Q. (2021). Progress and research of paleoaltitude reconstruction of Cenozoic basins in the southeastern Tibet Plateau. Seismol. Geol. 43 (3), 576–599. doi:10.3969/j.issn.0253-4967.2021.03.007
Tao, Y., Zhang, H., Ge, Y., Pang, J. Z., and Yu, J. X. (2020). Cenozoic exhumation and fault activities across the eastern Tibet: Constraints from low-temperature thermochronological data. Chin. J. Geophys. 63 (11), 4154–4167. doi:10.6038/cjg2020O0300
Tapponnier, P., Peltzer, G., Le Dain, A., Armijo, R., and Cobbold, P. (1982). Propagating extrusion tectonics in Asia: New insights from simple experiments with plasticine. Geology 10 (12), 611–616. doi:10.1130/0091-7613(1982)10<611:petian>2.0.co;2
Tapponnier, P., Zhiqin, X., Roger, F., Meyer, B., Arnaud, N., Wittlinger, G., et al. (2001). Oblique stepwise rise and growth of the Tibet Plateau. science 294 (5547), 1671–1677. doi:10.1126/science.105978
Tian, Y., Kohn, B., Gleadow, A., and Hu, S. (2014). A thermochronological perspective on the morphotectonic evolution of the southeastern Tibetan Plateau. J. Geophys. Res. Solid Earth 119 (1), 676–698. doi:10.1002/2013jb010429
Wang, G., Cao, K., Zhang, K., Wang, A., Liu, C., Meng, Y., et al. (2011). Spatial and temporal patterns of Cenozoic tectonic uplift in the Tibetan Plateau [J]. Sci. China Earth Sci. 41 (003), 332. doi:10.1007/s11430-010-4110-0
Wang, E., Kirby, E., Furlong, K., van Soest, M., Xu, G., Shi, X., et al. (2012a). Two-phase growth of high topography in eastern Tibet during the Cenozoic. Nat. Geosci. 5 (9), 640–645. doi:10.1038/ngeo1538
Wang, Z., Wang, X., Huang, R., and Huang, W. (2012b). Structural heterogeneities in southeast Tibet: Implications for regional flow in the lower crust and upper mantle. Int. J. Geophys. 2012, 1–12. doi:10.1155/2012/975497
Wang, E., Meng, K., Su, Z., Meng, Q., Chu, J. J., Chen, Z., et al. (2014). Block rotation: Tectonic response of the Sichuan basin to the southeastward growth of the Tibetan Plateau along the Xianshuihe-Xiaojiang fault. Tectonics 33 (5), 686–718. doi:10.1002/2013tc003337
Wang, Y., Zheng, D., and Zhang, H. (2022). Method and program implementation of river elevation profile analysis: An open-source function set RiverProAnalysis based on the Matlab platform. Sci. China Earth Sci. 52 (10), 2039–2060. doi:10.1360/SSTe-2021-0261
Whipple, K., Wobus, C., Crosby, B., Kirby, E., and Sheehan, D. (2007). New tools for quantitative geomorphology: Extraction and interpretation of stream profiles from digital topographic data. GSA Short. course 506, 1–26.
Xiong, X., Gao, R., Zhang, J., Wang, H., and Guo, L. (2015). Differences of structure in mid-lower crust between the eastern and Western blocks of the Sichuan basin. Chin. J. Geophys. 58 (7), 2413–2423. doi:10.6038/cjg20150718
Xiong, Z., Ding, L., Spicer, R. A., Farnsworth, A., Wang, X., Valdes, P. J., et al. (2020). The early Eocene rise of the Gonjo Basin, SE Tibet: From low desert to high forest. Earth Planet. Sci. Lett. 543, 116312. doi:10.1016/j.epsl.2020.116312
Xu, R., Tao, J., and Sun, X. (1973). On the discovery of a Quercus semicarpifolia bed in mount Shisha Panama and its significance in botany and geology. J. Integr. Plant Biol. 1.
Zhang, H., Oskin, M. E., Liu-Zeng, J., Zhang, P., Reiners, P. W., and Xiao, P. (2016). Pulsed exhumation of interior eastern Tibet: Implications for relief generation mechanisms and the origin of high-elevation planation surfaces [J]. Earth Planet. Sci. Lett. 449, 176–185
Keywords: Tibetan Plateau (TP), uplift, Jinsha River, longitudinal profile, knickpoint
Citation: Pan R, Han Z, Su Q, Li G, Li X, Li Y and Wang X (2023) Two-staged uplift of the southeast margin of the Tibetan plateau revealed by river longitudinal profiles. Front. Earth Sci. 11:1124362. doi: 10.3389/feart.2023.1124362
Received: 15 December 2022; Accepted: 27 February 2023;
Published: 10 March 2023.
Edited by:
Daniele Spatola, Faculty of Mathematics, Physics, and Natural Sciences, Sapienza University of Rome, ItalyReviewed by:
Maurizio Gasparo Morticelli, University of Palermo, ItalyMarta Della Seta, Sapienza University of Rome, Italy
Copyright © 2023 Pan, Han, Su, Li, Li, Li and Wang. This is an open-access article distributed under the terms of the Creative Commons Attribution License (CC BY). The use, distribution or reproduction in other forums is permitted, provided the original author(s) and the copyright owner(s) are credited and that the original publication in this journal is cited, in accordance with accepted academic practice. No use, distribution or reproduction is permitted which does not comply with these terms.
*Correspondence: Zhiyong Han, enloYW5Abmp1LmVkdS5jbg==; Xusheng Li, bGl4dXNoZW5nQG5qdS5lZHUuY24=