 Ruikang Chen
 Da Zhang
 Ying Nan
 Hengdong Feng
- College of Geography and Ocean Sciences, Yanbian University, Yanji, China
Introduction: An assessment of the potential impacts of future urban expansion on multiple ecosystem services (ESs) represents an essential contribution to the sustainable development of the transnational area of Changbai Mountain (TACM). However, the potential ES losses attributed to future urban expansion have been assessed in few studies.
Methods: In this study, we evaluated the potential ES losses attributable to urban expansion in the TACM over the period from 2015 to 2050. To achieve this objective, we initially quantified multiple ESs (namely, food production (FP), carbon storage (CS), water retention (WR), and air purification (AP)) based on 1992 data, and subsequently simulated urban expansion from 2015 to 2050 by coupling Shared Socioeconomic Pathways scenarios (SSPs) with the zoned Land Use Scenario Dynamics-urban model. Finally, the potential impacts of future urban expansion on ESs were evaluated on multiple scales.
Results: The results indicated that during the period from 2015 to 2050, the extent of urban land will grow by between 157.59 and 517.77 km2, resulting in FP, CS, WR, and AP losses of 193.76–684.39 thousand tons, 1.47–5.24 million tons, 8.74–30.00 million tons, and 0.34–1.18 thousand tons, respectively.
Discussion: The subregion falling within the Democratic People’s Republic of Korea (DPRK) will experience the most severe future losses of ESs, with losses of FP, CS, WR, and AP being 1.06–3.77-fold, 1.15–3.46-fold, 1.10–3.54-fold, and 1.08–3.21-fold higher, respectively than those that occurred in this subregion the period of 1992–2015. Specifically, the encroachment of new urban land onto cropland and woodland will be the main contributing factor in these future declines in ESs. Furthermore, the reductions in ESs attributable to urban expansion in this subregion will have serious effects on human wellbeing. By 2050, the loss of FP will affect approximately 9.58%–30.00% of the population. Moreover, among the residents of this subregion, the loss of AP will contribute to the need for additional expenditures of 6.63–19.81 million euros on air purification measures. On the basis of these findings, we suggest that effective policies and regulations should be implemented to promote the sustainable development of the TACM.
1 Introduction
The term “ecosystem services” (ESs) refers to the collective benefits that humans derive from ecosystems (MEA, 2005). Urban expansion is a process of land-use change whereby non-urban land is transformed into urban land (Bai et al., 2012; He et al., 2016). As a consequence of the spread of impermeable surfaces and the reduction in natural vegetation, urban expansion contributes to either a reduction and degradation of ESs or to alteration of ecosystem processes, functions, and services through modification of water cycling and atmospheric circulation (Wade et al., 2009; Fu and Zhang, 2014; He et al., 2014; Delphin et al., 2016; Zhang et al., 2017). Currently, urbanization is proceeding at an unprecedented rate, and globally, the urban land area coverage is projected to increase by 1.2 million km2 by 2030 (Seto et al., 2012). This process will cause further reductions in natural habitats and a more significant loss of ESs (Evers et al., 2018; Huang et al., 2019; Hasan et al., 2020). It is therefore crucial to assess the potential impact of future urban expansion on multiple ESs; such an assessment could potentially contribute to the promotion of sustainable development (Zhang et al., 2019).
Transnational area of Changbai Mountain (TACM) is a cross-boundary area that encompasses neighboring regions of China, the Democratic People’s Republic of Korea (DPRK), and Russia, and represents an important intersection of the “Silk Road on Land” and the “Silk Road on Ice.” Within this transnational area lie Changbai Mountain National Nature Reserve and the Northeast Tiger and Leopard National Park, which were established by the Chinese government; this region is considered to be the core ecological region of northeast Asia (Fang, 2017; Nan et al., 2020). During the past several decades, the TACM has experienced accelerated urban expansion fueled by economic cooperation, trade, and population mobility across China, the DPRK, and Russia. This urban growth has had a substantial detrimental impacts on regional ESs, not only in reducing the value of ecosystem services but also in contributing to a significant loss of biodiversity, land degradation, and general environmental deterioration (Xiang et al., 2018; Yi, 2020). Moreover, this rapid urban expansion is expected to continue in the near future, particularly in the subregion of the DPRK (Yang et al., 2019). Consequently, it is deemed essential to undertake an effective evaluation of the potential impact of future urbanization on ESs in this transnational area.
In recent years, many studies have been conducted to evaluate the impact of urban expansion on ESs at the global, national, and regional scales. At the global scale, Chung et al. (2021) revealed the interrelationships between global urban land and freshwater ESs. Huang et al. (2021) analyzed urban expansion from 1992 to 2016 in terms of global endorheic and exoreic watersheds. At the national scale, Liu et al. (2022) analyzed urban expansion and evaluated the relationships between supply of and demand for ESs in China. Zhou et al. (2023) measured the relationships between urbanization and vegetation cover in China. At the regional scale, Xiang et al. (2022) assessed the relationships between supply and demand relating to four ESs in Northeast China and analyzed the effects of urban expansion on these ESs. Meanwhile, several studies have also been conducted to assess the impact of future urbanization on ESs in the TACM. For example, Zhang et al. (2012) estimated the variation in the value of ESs in the TACM over the period from 2000 to 2010, while Tao et al. (2017) assessed the dynamics of the effects of urbanization of forest landscape and its impact on the natural habitat in this area from 1977 to 2015. Furthermore, Xia et al. (2018) simulated land-use changes in the Chinese subregion of the TACM from 2000 to 2050 and evaluated the impact of these changes on the value of ES, while Mao et al. (2019) assessed the consequences of food security protection policies for changes in land coverage and ESs in Northeast China during the period from 2000 to 2015. However, the studies conducted to date have been deficient in certain respects. First, most research has concentrated on variation in ESs that is attributable to historical urban expansion and has tended to pay little attention to the impact of future urbanization on ESs. Second, studies have mostly focused on the loss of ESs under the influence of urban expansion in the Chinese subregion of the TACM, with comparatively few similar studies having been conducted in the DPRK and Russian subregions.
Given these deficiencies, our objective in this study was to assess the potential impact of future urban expansion on multiple ESs in the TACM during the period from 2015 to 2050, based on Shared Socioeconomic Pathways (SSPs) and the zoned Land Use Scenario Dynamics-urban (LUSD-urban) model. We quantified multiple ESs in the TACM using data for the year 1992, and on the basis of these data, we simulated urban expansion from 2015 to 2050 by coupling each of SSPs with the zoned LUSD-urban model. Finally, the potential effects of future urban expansion on ESs were evaluated on multiple scales. The findings constitute useful information for the facilitation of sustainable development in the TACM.
2 Study area and data
2.1 Study area
The TACM is located between 125°49′–132°25′E and 39°29′–44°41′N, covering an area of 130.8 thousand km2 straddling the borders of China, the DPRK, and Russia (Figure 1). Of this total area, 76.24 thousand km2 lies within the Chinese subregion, accounting for 58.28% of the land area of the TACM and encompassing the cities of Baishan, Tonghua, and Yanbian Korean Autonomous Prefecture in Jilin Province. The area of the DPRK subregion is 47.50 thousand km2, covering 36.32% of the TACM, within which lie the provinces of Jagang, Yanggang, and Hambuk. Somewhat smaller, at 7,068.54 km2, is the area comprising the Russian subregion, representing 5.40% of the total area of the TACM; this area includes Hassan and Vladivostok in Primorsky Krai. The TACM has a temperate continental montane climate. Under the influence of moist maritime air masses from the Japan Sea, this region receives relatively abundant precipitation, contributing to a climate characterized by short summers and long winters (Wang et al., 2020). The average annual temperature in the area ranges from 3°C to 7°C, and mean precipitation ranges from 700 to 1,400 mm. During the period from 1992 to 2015, urban land coverage in this transnational area grew from 463.32 km2 to 868.23 km2, which equates to an expansion of 87.39% (Yang et al., 2019), and this urbanization is set to continue, at least into the near future (Yang et al., 2020). Thus, to ensure the sustainable development of this region, it is of considerable importance to assess the impact of future urban expansion on ESs in a timely and effective manner.
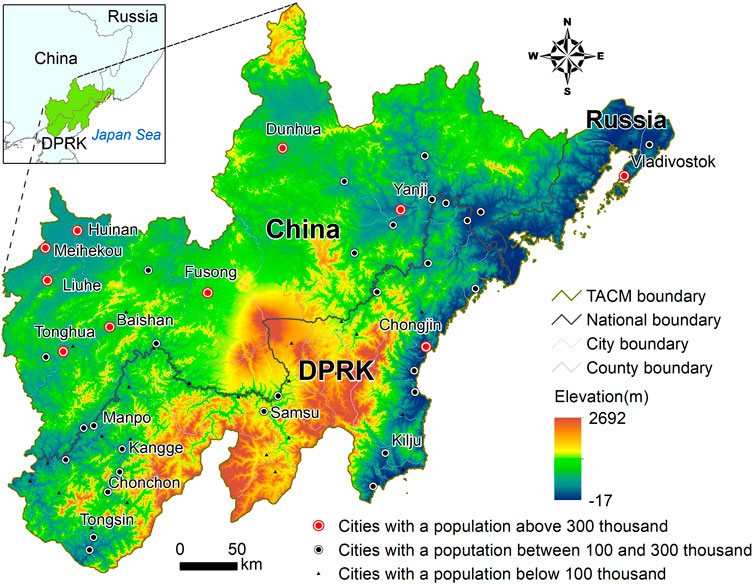
FIGURE 1. The study area.
2.2 Data
Several different kinds of data were used in this study, including land-use data, meteorological data, and auxiliary geographical information system (GIS) data (Table 1). Following He et al. (2014), land was re-classified into seven land-use types, namely, cropland, woodland, grassland, water bodies, urban land, wetland, and unused land. Population data for the period 2015–2050 under each of SSPs were downloaded from the History Database of the Global Environment (the HYDE database) from the Netherlands Environmental Assessment Agency (ftp://ftp.pbl.nl/hyde). Additionally, precipitation data for the period 1992–2015 were obtained from the Jilin Meteorological Service (http://jl.cma.gov.cn/), the Korea Meteorological Administration (https://www.weather.go.kr), and global meteorological station observation data (https://gis.ncdc.noaa.gov). GIS auxiliary data included vector data on global administrative boundaries, administrative centers, national roads, provincial roads, township roads, and railroads. The Gauss–Kruger coordinate projection was uniformly used for all data, re-sampled at a spatial resolution of 300 m.
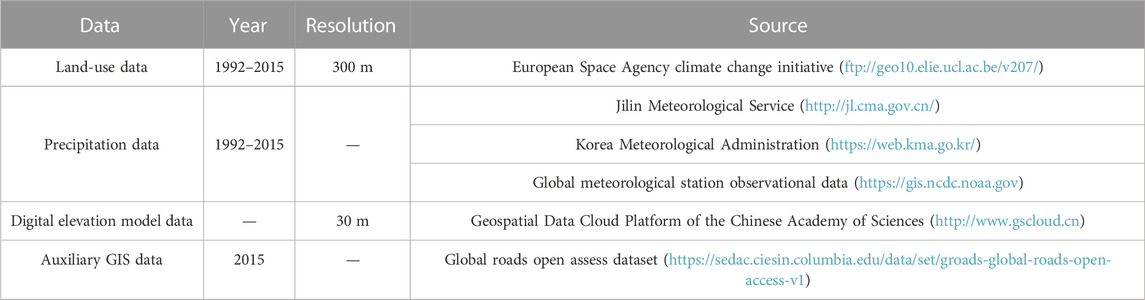
TABLE 1. Datasets used in this study.
3 Methods
3.1 Mapping ESs in the TACM in 1992
Based on work by Zhang et al. (2017), Xiang et al. (2018, 2022), and Mao et al. (2019), we selected four ESs as the key ESs in this transnational area: food production (FP), carbon storage (CS), water retention (WR), and air purification (AP). All of these are highly relevant to human wellbeing (e.g., the fundamental material basis for a good life, a pleasant climate, the basic need for water, and human health). Furthermore, due to data availability and the applicability of mapping methods, these ESs could be quantified for the transnational area investigated using remote sensing data, and they have also all been heavily affected by urban expansion. These ESs were quantified on the basis of land-use data obtained for the year 1992 (Figure 2). In addition, to eliminate the effects of climate change, we used mean annual precipitation during the period 1992–2015 in quantification of these four ESs, according to Milesi et al. (2003) and Zhang et al. (2017).
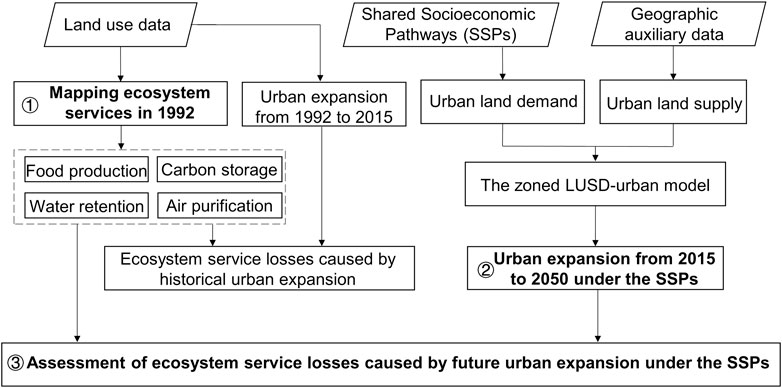
FIGURE 2. Flowchart.
Specifically, following Li (2014) and Zhang et al. (2017), cropland was assessed in terms of the production of maize, cereals, soybeans, potatoes, and rice. By considering grain production data in the three subregions, FP was quantified for each of the subregions (Chinese, the DPRK’s, and Russian) using the following formula:
where Ac represents the capacity of cropland to produce food of type c (i.e., the area of food type c production from cropland) and Pc represents the average yield of cropland producing food of type c. In addition, the Carbon Storage and Sequestration module of the Integrated Valuation of Environmental Services and Tradeoffs (InVEST) model was adopted for calculation of the regional CS, as follows:
where
In addition, following the studies of Yang et al. (2015) and Zhang et al. (2017), the capacity of natural vegetation to intercept surface runoff originating from rainfall was considered to be represented by WR, defined as follows:
where WRk,x,y represents the volume of water retention in land-use and land cover (LULC) type K for cell (x, y); A refers to the actual area of each given cell (in this study, A was 0.09 km2); Px,y refers to the annual precipitation volume for cell (x, y) (obtained from the precipitation data); C is surface runoff as a proportion of total rainfall (with reference to the study by Zhang et al. (2017), the value of C for the TACM was set to 0.6); and RK,x,y is intercepted surface runoff as a percentage of the total rainfall for a given cell (x, y) in LULC type K. Finally, following Landuyt et al. (2016) and Zhang et al. (2017), the value of PM10 captured by natural vegetation was used to calculate the AP, as follows:
where APK,x,y represents the capacity of natural vegetation to capture PM10 (i.e., the volume of PM10 captured by cell (x, y) in LULC type K); A refers to the actual area of each given cell (and the value was 0.09 km2 in this study); and PMK,x,y denotes the volume of captured PM10 for cell (x, y) in LULC type K. The values for all LULC types were obtained from Landuyt et al. (2016) and Zhang et al. (2017).
3.2 Simulating urban expansion in the TACM from 2015 to 2050 under the SSPs
In this study, we coupled SSPs with the zoned LUSD-urban model to simulate urban expansion in the TACM from 2015 to 2050. Initially, with reference to Yang et al. (2019), we developed regression models for the Chinese, the DPRK’s, and the Russian subregions. For these regression models, the urban population was an independent variable, and urban land area was a dependent variable. Next, the future urban land area was calculated using the urban population data for the period of 2015–2050, as obtained from the SSPs. According to Jiang and O’Neill (2017) and Bruno et al. (2021), future population levels will show a decreasing trend, especially in China. However, according to Liu et al. (2012), He et al. (2019), Huang et al. (2019), and Chen et al. (2020), urban land will not be reduced in the future; i.e., urban land will not be converted to other land-use types. In this study, we assumed that if the population does not increase or decrease in a particular year, urban land area will remain the same as in the previous year. Finally, the urban expansion of the Chinese, the DPRK’s, and the Russian subregions was simulated separately for each subregion using the zoned LUSD-urban model. The simulation results for the entire transnational area were then merged based on the simulation results for the three subregions.
Model calibration was carried out to ensure a solid basis for simulation of future urban expansion. In this study, we used the adaptive Monte Carlo method to perform model calibration for the subregions of China, the DPRK, and Russia, in accordance with Yang et al. (2019, 2020). We first simulated historical urban expansion from 1992 to 2015 in the three subregions. Subsequently, by applying the kappa index as an evaluation criterion, we selected the simulation result that was closest to the actual result. The highest kappa indices were 0.78, 0.88, and 0.85 for the subregions of China, the DPRK, and Russia, respectively. These results suggest that the zoned LUSD-urban model can reliably simulate urban expansion in the TACM. Finally, the combination of weights with the highest kappa index was selected for use as the parameter set for simulations of the future.
In addition to these measures, we cross-validated this result with those of other studies to verify the reliability of the future urban land data used in this study. Specifically, we selected Yanji, Tonghua, Baishan, and Vladivostok for comparison of the urban land data used in this study with those of other studies published by Chen et al. (2020), He et al. (2019), Huang K. et al. (2019), and Li S. et al. (2021). We found that the data on future urban land used in this study have a certain degree of reliability and can be used in assessing the impact of urban expansion on ESs (Supplementary Figures S1–S5).
3.3 Assessing the impacts of urban expansion on ESs in the TACM from 2015 to 2050 under the SSPs
The impact of urban expansion on a given ES, ES i, can be represented as follows:
where
4 Results
4.1 ESs in the TACM in 1992
In 1992, total FP in the TACM was 45.65 million tons, and CS, WR, and PM10 capture volume were 3.11 billion tons, 10.41 billion tons, and 0.68 million tons, respectively (Figure 3). In terms of spatial distribution, FP was high in the northeastern and western regions, as well as the northern region of the China–DPRK border, whereas production was low in the central and southern regions of the China–DPRK border. Geographically, CS was high in the central and southern regions of the China–DPRK border and low in the western and northeastern regions. The spatial distribution pattern for WR was characterized by a gradual reduction from the northwestern to the northern region, whereas AP was high in the central and southern regions of the China–DPRK border and low in the western and northeastern regions.
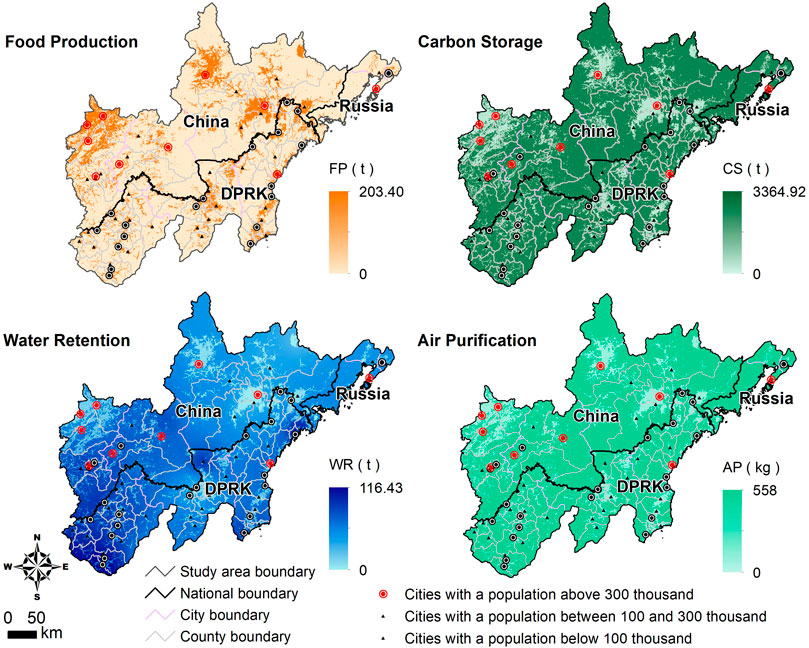
FIGURE 3. ESs in the TACM in 1992.
Among the three subregions, the highest value for FP (28.87 million tons) was recorded for the Chinese subregion, accounting for 63.24% of the total FP volume of the TACM, followed by that of the DPRK’s subregion (15.92 million tons; 34.88%) and the Russian subregion (0.86 million tons; 1.88%). The Chinese subregion was also found to have the highest CS volume (1.81 billion tons), representing 58.15% of total CS in the TACM. In comparison, the CS volumes recorded for the DPRK’s and Russian subregions were 1.12 and 0.18 billion tons, representing 36.10% and 5.75% of the total CS volume in the TACM, respectively. WR and PM10 capture volume in the Chinese subregion were 5.82 billion tons and 0.40 million tons, respectively, representing 55.92% and 58.06% of the entire ES volumes in the TACM; WR and PM10 capture volume in the DPRK’s subregion were 4.08 billion tons and 0.25 million tons, respectively, accounting for 39.21% and 36.12% of the total; and WR and PM10 capture volume in the Russian subregion were 0.51 billion tons and 39.28 thousand tons, respectively, representing only 4.87% and 5.76% of the entire volume.
Among all the cities examined, three cities in China (namely, Dunhua, Mehekou, and Liuhe) exhibited the highest FP volume, with FP values of 4.95 million tons, 3.03 million tons, and 2.91 million tons, respectively, accounting for a total of 23.83% of FP in the TACM. Additionally, three cities in China (namely, Dunhua, Wangqing, and Antu) exhibited the highest volumes in terms of the three regulating ESs. Across these three cities, the volumes for CS, AP, and WR were 0.69 billion tons, 0.15 million tons, and 1.97 billion tons, respectively, accounting for 22.14%, 22.09%, and 18.91% of the total volume across the entire transnational area.
4.2 Impacts of urban expansion on ESs in the TACM from 1992 to 2015
The period from 1992 to 2015 saw a pronounced phase of urbanization in the TACM, during which the coverage of urban land grew from 464.04 km2 to 867.87 km2, representing 87.02% growth, with an average annual growth rate of 2.77%. At the subregional scale, urban land coverage grew most rapidly in the Chinese subregion, followed by the DPRK’s subregion, with the least growth taking place in the Russian subregion. During 1992 to 2015, urban land area in the Chinese subregion increased from 280.53 km2 to 603.36 km2, with this new urban area accounting for 79.04% of the total new urban land across the TACM during this period. In comparison, urban land coverage in the Russian and the DPRK’s subregions increased by 22.05 and 58.95 km2, respectively, representing 5.46% and 14.60% of the new urban land in this transnational area.
This rapid urbanization led to a range of losses in the four key ESs surveyed in the present study, namely FP, CS, WR, and AP (Table 2). Among these, FP suffered the largest loss, whereas the storage of carbon was least affected. For the year 1992, the FP loss attributable to urban expansion was estimated at 451.79 thousand tons, representing 0.99% of total annual FP; in contrast, in the same year, CS was reduced by 3.71 million tons, representing a loss of only 0.11% of total annual CS. Furthermore, WR was estimated to have declined by 2.02 million tons, equivalent to 0.19% of total WR in 1992, and urban expansion was associated with a reduction in PM10 capture of 859.30 t, corresponding to 0.13% of the total AP volume in 1992. Specifically, the losses of FP in the Chinese, the DPRK’s, and Russian subregions was 378.67, 60.71, and 12.41 thousand tons, respectively, representing 83.82%, 13.44%, and 2.75% of the total loss across the TACM. Similarly, losses relating to the other three ESs monitored were all greatest in the Chinese subregion and lowest in the Russian subregion. Specifically, in the Chinese subregion, reductions of 2.80 million tons, 15.83 million tons, and 0.65 thousand tons were recorded for CS, WR, and PM10 capture volume, respectively, accounting for 75.65%, 78.20%, and 74.86% of total losses, whereas in the Russian subregion, CS, WR, and AP declined as a consequence of urban expansion by 0.44 million tons, 1.41 million tons, and 0.86 thousand tons, respectively, representing 11.92%, 6.98%, and 12.02% of the total losses. In comparison, within the DPRK sector, reductions of 0.46 million tons, 3.00 million tons, and 0.11 thousand tons were recorded for CS, WR, and PM10 capture volume, respectively, corresponding to 12.43%, 14.81%, and 13.13% of the total losses.
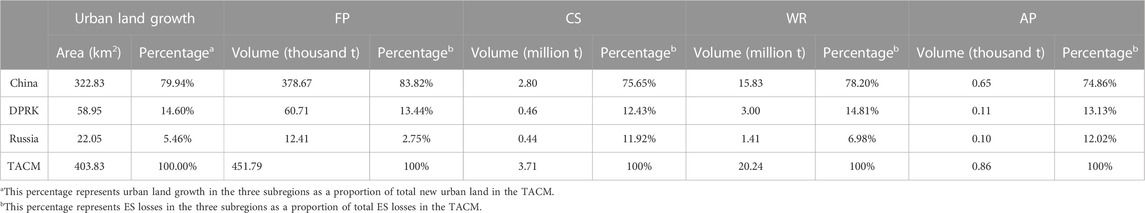
TABLE 2. Impacts of urban expansion on ESs in the TACM from 1992 to 2015.
Among all the cities examined, Dunhua, Yanji, and Liuhe in China experienced the greatest decrease in FP due to urban expansion. Across these three cities, urban expansion resulted in a decrease in FP of 0.13 million tons from 1992 to 2015, which accounted for 28.24% of the total FP loss in the TACM. Additionally, Dunhua, Baishan, and Mehekou in China were the cities that experienced the greatest decreases in CS and AP under the influence of historical urban expansion. Urban expansion in these cities resulted in a decrease in CS of 0.99 million tons in CS and a decrease in AP of 0.16 thousand tons, representing 26.63% and 18.14%, respectively, of the total loss of these ESs across the entire transnational area. Finally, Dunhua, Baishan, and Liuhe in China were the cities that experienced the greatest decrease in WR. Across these three cities, urban expansion resulted in a total loss of WR of 5.06 million tons, accounting for 25.01% of the total loss across the entire region.
4.3 Potential impacts of urban expansion on ESs from 2015 to 2050 under the SSPs
Under the different SSPs, it is estimated that the coverage of urban land in the TACM will continue to grow from 867.87 km2 in 2015 to between 1,025.37 and 1,385.46 km2 in 2050, representing an increase of 6.64%–18.15% (Figure 4). This growth in urban land is projected to occur mainly within the Chinese subregion, in which urbanized land area will grow from 603.36 km2 in 2015 to between 703.26 and 914.76 km2 in 2050, representing an increase of 99.90–311.40 km2 at a growth rate of 16.56%–51.61%; this new urban land will account for 60.06%–63.45% of new urban land across the TACM. In the DPRK’s region, urban land will expand from 174.78 km2 in 2015 to between 232.47 and 357.57 km2 in 2050, representing an increase of 57.69–182.79 km2 at a growth rate of 33.01%–104.58%, with the new urban land representing 36.61% of all new urban land in the TACM. A somewhat less pronounced growth in urbanization is projected for the Russian subregion, with the urban land area anticipated to grow from 89.73 km2 in 2015 to between 96.84 and 113.76 km2 in 2050, representing a growth of 24.03 km2 at a growth rate of 26.78%. This new urban land will account for only 4.64% of all new urban land across the entire transnational area.
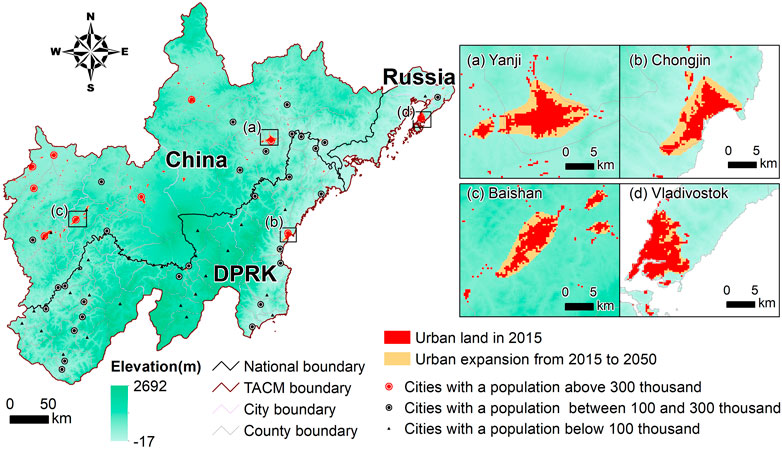
FIGURE 4. Urban expansion in the TACM from 2015 to 2050 under the SSP5.
The trend in loss of ESs attributable to urbanization in the TACM is expected to continue throughout the period under assessment (Table 3). Among these services, FP will be most seriously impacted by continued urban expansion, with a projected loss of between 193.76 and 684.39 thousand tons, representing 0.42%–1.50% of FP in 1992. In contrast, PM10 capture volume is expected to be the least influenced by future urban expansion, with a loss of between 0.34 and 1.18 thousand tons, representing 0.05%–0.17% of the total AP in 1992. In addition, future urban expansion will result in reductions in WR and CS of between 8.74 and 30.00 million tons and between 1.47 and 5.24 million tons, respectively, corresponding to 0.08%–0.29% and 0.05%–0.17% of the corresponding 1992 values. In terms of subregional losses, ESs in the Chinese subregion are estimated to be the most severely affected, followed by those in the DPRK, with the Russian subregion experiencing the lowest ES losses. It is predicted that, by 2050, FP in the Chinese subregion will have declined by between 129.34 and 444.12 thousand tons, representing 64.87%–66.87% of the total FP loss within the TACM. Comparatively, FP losses of between 64.42 and 229.08 thousand tons and of 11.19 thousand tons are estimated for the DPRK’s and Russian subregions, respectively, accounting for 30.83%–33.69% and 1.64% of the total FP loss in the TACM. With respect to CS, reductions of between 0.94 and 3.14 million tons are estimated for the Chinese subregion, accounting for 59.92%–66.20% of the total loss across the TACM. In the DPRK subregion, CS losses of between 0.53 and 1.59 million tons were anticipated, accounting for 30.38%–35.96% of the total loss across this transnational area, whereas in the Russian subregion, CS was predicted to decline by 0.51 million tons, representing 9.70% of the total loss within the TACM. In the case of WR, reductions in volume of between 5.43 and 17.83 million tons were estimated for the Chinese subregion, accounting for 59.38%–64.17% of the entire loss of WR over the entire transnational area. Additionally, WR reductions amounting to between 3.31 and 10.61 million tons are estimated for the DPRK’s subregion, representing 34.01%–37.86% of the total regional loss, whereas in the Russian subregion, a loss of 1.57 million tons is anticipated, representing 5.22% of total loss in the TACM. In terms of AP, a loss of between 0.22 and 0.70 thousand tons of PM10 capture is estimated for the Chinese subregion, accounting for 59.63%–65.61% of the total loss across the entire TACM, whereas for the DPRK’s and Russian, the corresponding losses are predicted to account for 31.04%–36.09% and 9.43% of total loss across the entire transnational area, respectively.
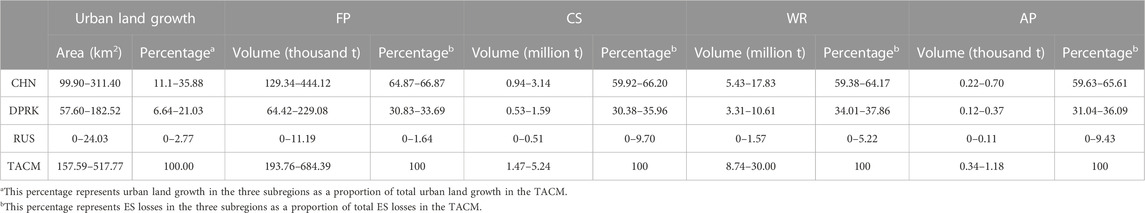
TABLE 3. Urban expansion and ES losses in the TACM from 2015 to 2050 under the SSPs.
Among all the cities examined, Yanji, Dunhua, and Liuhe in China are forecast to experience the greatest decrease in FP during the process of future urban expansion. Urban expansion in these cities will result in a decrease of FP by 54.90–199.88 thousand tons, accounting for 28.33%–30.04% of the total future FP loss. In addition, Baishan and Tonghua in China, as well as Kanggye in the DPRK, will be the cities with the greatest decreases in CS, WR, and AP. Urban expansion in these cities will result in reductions in CS, WR, and AP of 0.60–1.92 million tons, 3.07–9.40 million tons, and 0.13–0.42 thousand tons, respectively, accounting for 36.72%–41.00%, 30.23%–35.17%, and 35.35%–39.31% of the total loss across the TACM.
5 Discussion
5.1 The subregion of the DPRK will be the foremost region experiencing ES loss across the entire TACM
Among the three subregions of the TACM, the DPRK’s subregion will experience the most pronounced expansion of urban land during the period from 2015 to 2050. During these years, it is estimated that coverage of urban land in this transnational area will continue to increase from 867.87 km2 in 2015 to between 1,025.46 and 1,385.73 km2 in 2050, with an average annual growth rate of 0.48%–1.35%. In the DPRK's subregion, urban land coverage will increase to between 232.47 and 357.57 km2, with an average annual growth of 1.65–5.22 km2 and an average annual growth rate of 0.82%–2.07%. In comparison, average annual growth rates of 0.44%–1.20% and 0.05%–0.68% are projected for the Chinese and Russian subregions, respectively. To put these figures into perspective, the average annual growth rate of urban land in the DPRK’s subregion is expected to be between 1.53- and 1.71-fold higher than that the rate in the TACM as a whole, 1.72- to 1.86-fold higher than that in the Chinese subregion, and 3.04- to 30.75-fold higher than that in the Russian subregion.
It is accordingly anticipated that, within the TACM, the DPRK’s subregion will be the zone in which future urban expansion will have the most severe impact on regional ESs. We found that future urbanization in this subregion will have more serious effects than those that have occurred historically. In the years between 1992 and 2015, urban expansion in the DPRK resulted in losses of 60.71 thousand tons, 0.46 million tons, 3.00 million tons, and 0.11 thousand tons in terms of FP, CS, WR, and AP, respectively, whereas our projections for the period from 2015 to 2050 estimated anticipated losses of 64.42–229.08 thousand tons, 0.53–1.59 million tons, 3.31–10.61 million tons, and 0.12–0.37 thousand tons, respectively; these represent losses between 1.06- and 3.77-fold, between 1.15- and 3.46-fold, between 1.10- and 3.54-fold, and between 1.08- and 3.21-fold higher than those recorded in the past (Figure 5). In comparison, historical losses of FP, CS, WR, and AP in the Chinese subregion have been 378.67 thousand tons, 2.80 million tons, 15.83 million tons, and 0.65 thousand tons, respectively, with corresponding estimated future losses of 129.34–444.12 thousand tons, 0.94–3.14 million tons, 5.43–17.83 million tons, and 0.22–0.70 thousand tons as a consequence of urban expansion. These future ES losses will be between 0.34- and 1.17-fold, between 0.34- and 1.12-fold, between 0.34- and 1.13-fold, and between 0.34- and 1.08-fold higher than those recorded historically, respectively. Finally, in the Russian subregion, historical losses of 12.41 thousand tons, 0.44 million tons, 1.41 million tons, and 0.10 thousand tons have been recorded for FP, CS, WR, and AP, respectively. Future urban expansion will lead to losses of 11.19 thousand tons, 0.51 million tons, 1.57 million tons, and 0.11 thousand tons, respectively; these losses are 0.90-, 1.16-, 1.11-, and 1.10-fold higher than the recorded historical losses, respectively.
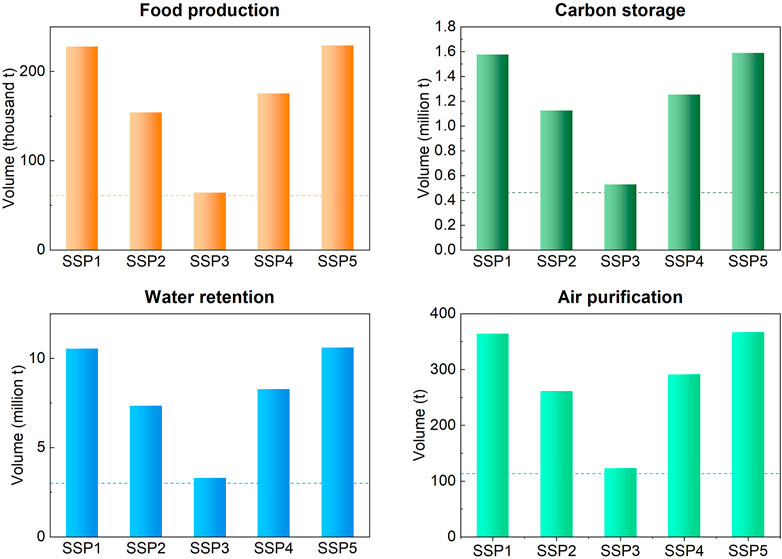
FIGURE 5. Comparison of the loss of ESs resulting from urban expansion in the subregion of the DPRK under the SSPs. Colored dashed lines indicate the loss of ESs caused by historical urban expansion; solid bars represent the loss of ESs caused by future urban expansion.
In the DPRK subregion, the primary cause of future ES losses will be the loss of cropland and woodland to urban development, with encroachment onto cropland accounting for most of the urban expansion in this area (Table 4). During 2015–2050, it is estimated that an area of cropland of between 32.85 and 116.82 km2 will be lost to urban spread, accounting for 55.64%–63.61% of all new urban land area in the DPRK’s subregion. This represents a 1.06- to 3.78-fold greater loss than the historical loss of 30.96 km2 that occurred between 1992 and 2015. With respect to CS, WR, and AP, this loss of cropland will result in losses of 0.13–0.45 million tons, 1.79–6.40 million tons, and 0.03–0.11 thousand tons, respectively, in this subregion, representing 24.13%–28.64%, 54.17%–60.40%, and 24.61%–29.39% of the total losses, respectively. Future urban expansion will come at the expense of 13.14–37.35 km2 of woodland, which will contribute to reductions of 0.37–1.06 million tons, 1.32–3.71 million tons, and 0.08–0.23 thousand tons of CS, WR, and AP, respectively, corresponding to 66.30%–70.21%, 34.91%–39.79%, and 63.34%–66.70% of total ES losses. This future loss of woodland will be 0.28- to 2.64-fold higher than that recorded between 1992 and 2015. In comparison, future urban expansion across areas of grassland will have a less pronounced impact on ESs. It is estimated that between 3.87 and 9.54 km2 of grassland will be lost to urban development, which is 0.56- to 1.38-fold higher than the historical loss of 6.93 km2. Encroachment onto areas of grassland will contribute to losses of 0.02–0.05 million tons, 0.20–0.51 million tons, and 0.01–0.03 thousand tons of CS, WR, and AP, respectively, accounting for 3.26%–3.97%, 4.80%–6.03%, and 7.06%–8.56% of all losses across the TACM.
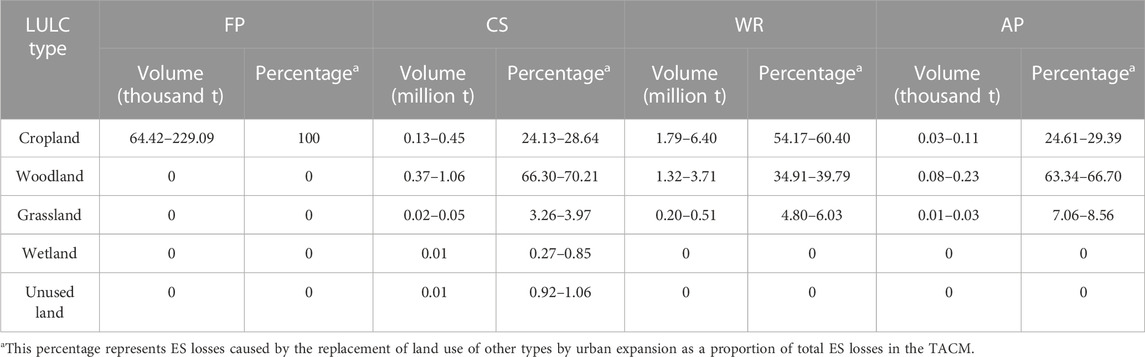
TABLE 4. ES losses caused by replacement of land use of other types by urban expansion from 2015 to 2050 under the SSPs in the subregion of the DPRK.
5.2 Losses of ESs will have detrimental effects on human well-being in the DPRK's subregion
It can be anticipated that the continued loss of ESs attributable to future urban expansion will have detrimental repercussions for human welfare in the DPRK’s subregion. Food, in particular, is the fundamental material basis for a good life, and is closely linked to human wellbeing (Wu, 2013). On the basis of FAO data on food consumption per capita in the DPRK (FAO, 2022), urban expansion in the DPRK’s subregion will contribute to a reduction in FP of 64.42 to 229.08 thousand tons under different SSPs; this is estimated to affect between 0.31 and 1.09 million people, corresponding to approximately 9.58%–30.00% of the total population projected for 2050 in the subregion (Figure 6).
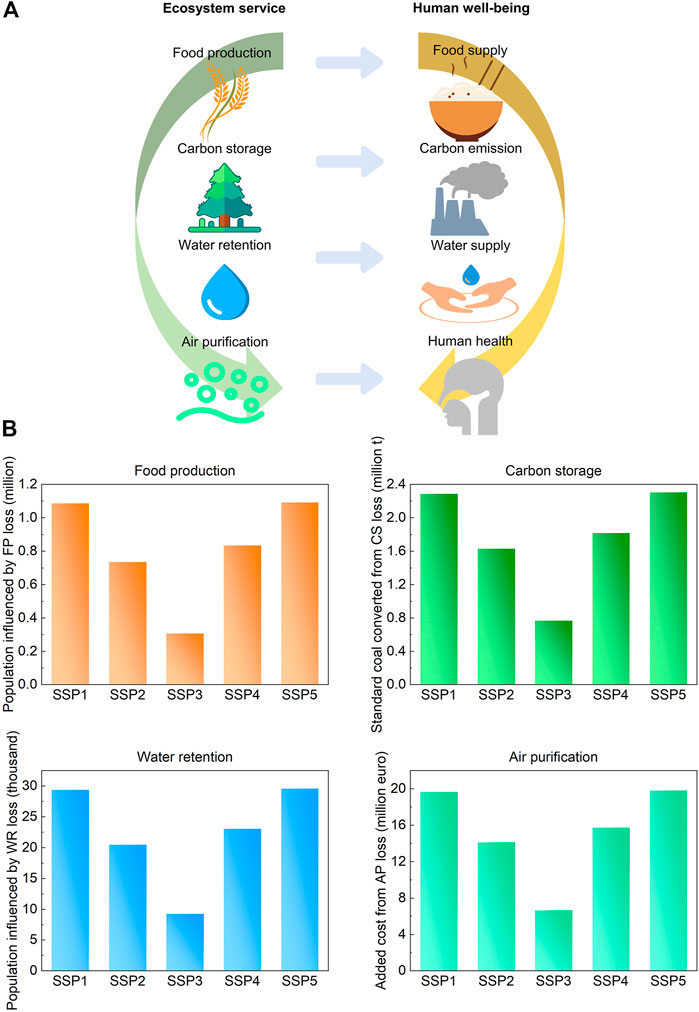
FIGURE 6. Impact of ES losses on human well-being in the DPRK subregion. (A) The relationship between ESs and human well-being; (B) impacts of ES losses on human well-being.
The storage of carbon plays a key role in regulating climate change and maintaining carbon neutrality, which is clearly closely associated with human wellbeing (Zhang et al., 2017; Li et al., 2021). Consequently, it might be anticipated that a reduction in CS due to urban expansion will contribute to diminishing human wellbeing in the DPRK’s subregion, at least to a certain extent. Owing to limitations in the relevant data, for the purposes of the present study, we used a standard coal conversion coefficient of 0.68 for the DPRK's subregion, following Tu and Liu (2014) and Zhang et al. (2012). Our simulations indicate that future urban expansion in this subregion will contribute to CS losses of between approximately 0.53 and 1.59 million tons, which is equivalent to the consumption of 0.77–2.30 million tons of standard coal (Figure 6).
Water typically affects human wellbeing from the twin perspectives of provisioning and regulating service (Liu et al., 2021), and it is an important factor influencing human welfare during urbanization (MEA, 2005; Zhang et al., 2017). Our projections indicate that future urban expansion in the DPRK’s subregion under different SSPs will lead to a decline in WR of between 3.31 and 10.61 million tons. Given that annual water consumption per capita in the DPRK’s is approximately 359.1 t (FAO, 2022), the future loss of WR attributable to urban expansion would be equivalent to the annual total water consumption of 9.21–29.56 thousand people, which would represent 0.28%–0.80% of the total projected population of the DPRK’s subregion in 2050 (Figure 6).
The quality of the air we breathe is particularly relevant to human health and welfare (Zhang et al., 2017). Atmospheric quality is determined to a large extent by PM10 concentration; excessive levels will cause environmental pollution, with potentially detrimental effects on human health. It has been estimated that each 1 kg increment in atmospheric PM10 equates to an extra 54-euro expenditure necessary to protect human health (Landuyt et al., 2016). Our simulations indicated that future urban expansion in the DPRK’s subregion will contribute to a decline in PM10 capture of between 0.12 and 0.37 thousand tons, thereby further reducing the wellbeing of residents in this region. Moreover, this would mean that these residents could potentially spend an additional 6.63–19.81 million euros for the purposes of ensuring sufficiently high air quality (Figure 6).
To date, the DPRK has adopted a set of initiatives designed to moderate the adverse impact of urban expansion, optimize the use of land resources, and mitigate serious food crises. In this regard, the Land Law issued by the DPRK government in 1999 proposed the improvement of land-use efficiency, with the aim of increasing grain production, and also stipulated that cropland should be protected (Yang et al., 2020). In 2004, the DPRK passed the Land Planning Law of the Democratic People’s Republic of Korea, which proposed “protecting cropland as well as controlling urban development level” as the principle of land planning within the country. In addition, the DPRK has formulated an array of land policies designed to protect high-quality cropland. The Environmental Protection Law of the Democratic People’s Republic of Korea, enacted in 2014, proposed further improvement to land-use efficiency and protection of the natural environment (Nan et al., 2020). However, despite this raft of legislation, existing laws have made only a limited contribution to mitigation of the serious effects of urbanization on ESs. Given the current situation, we therefore suggest that it is necessary to develop spatial planning for land resources in order to protect natural resources in this transnational area (and particularly in the DPRK’s subregion), and additionally to scientifically delineate urban boundaries to limit the rate at which urban growth proceeds. In addition, more stringent policies should be formulated to afford a greater degree of protection to cropland. Finally, international trade and commerce among China, the DPRK, and Russia should be strengthened as a means of addressing food security problems. Specifically, food aid and trade could be considered as measures aiming to alleviate food shortages, thereby promoting the sustainable development of the transnational area.
5.3 Future perspectives
Despite the valuable insight gained, this study does have certain limitations. First, urban expansion can influence various kinds of ESs, among which (for reasons of the applicability of ES measurement tools and data availability) we focused on only four ESs (Peng et al., 2015; 2016). Specifically, FP was predicted to be influenced by future science and technology under all scenarios. However, cropland area has remained an essential basis for maintenance of food production in the TACM. In particular, food cultivation technology has remained at a relatively backward stage in the DPRK; for this reason, maintaining and increasing cropland area is still an important way to increase food self-sufficiency and food production. Therefore, we calculated FP using average annual grain yield and cropland area in this study. However, due to a lack of appropriate quantifying methods and data, it was difficult to consider the impact of science and technology on FP in this region. Second, urban areas with green spaces and water bodies also supply certain types of ESs, particularly cultural services (Shwartz et al., 2014; Wu et al., 2014). However, owing to the coarse spatial resolution of the relevant data, we were unable to quantify the ESs provided by urban areas. Finally, as a transnational area encompassing regions in China, the DPRK, and Russia, substantial flows of material (e.g., food trade), energy, and ESs occur within the region as a whole. However, due to data and methodological limitations, we were unable to assess the relative contributions of ES-related flows in this study.
In the future, we anticipate examining a wider range of indicators to assess several other kinds of ESs, such as water yield and recreational services (Andersson et al., 2015). Additionally, we will consider the impact of future climate change, science, and technology on ESs. We will also attempt to use high-resolution remote sensing data to quantify ESs within cities, particularly those ESs provided by green spaces and water bodies (Santos et al., 2017). Finally, we will combine multiple methods, such as remote sensing and modeling simulations, to quantify ES flows within the TACM (Sun et al., 2022; Sun et al., 2023; Zhang et al., 2023).
6 Conclusion
During the period from 1992 to 2015, urban land in the TACM grew from 464.04 km2 to 867.87 km2, representing growth of 403.83 km2. This urban expansion contributed to the loss of 451.79 thousand tons of CS, 3.71 million tons of CS, 20.24 million tons of WR, and 0.86 thousand tons of AP. On the basis of our simulated projections for the period from 2015 to 2050, we predict that urban land will continue grow by between 157.59 and 517.77 km2, resulting in losses of 193.76–684.39 thousand tons of FP, 1.47–5.24 million tons of CS, 8.74–30.00 million tons of WR, and 0.34–1.18 thousand tons of AP. These future ES losses will occur primarily in the Chinese subregion, within which these four key ESs will decline by 129.34–444.12 thousand tons, 0.94–3.14 million tons, 5.43–17.83 million tons, and 0.22–0.70 thousand tons, respectively, accounting for 64.87%–66.87%, 59.92%–66.20%, 59.38%–64.17%, and 59.63%–65.61% of all losses across the entire transnational area.
In the near- to mid-term future, the DPRK’s subregion will be the region experiencing the most severe ES losses; these are projected to exceed historical ES losses. During the period from 2015 to 2050, losses of 64.42–229.08 thousand tons, 0.53–1.59 million tons, 3.31–10.61 million tons, and 0.12–0.37 thousand tons are projected for FP, CS, WR, and AP, respectively; these are 1.06- to 3.77-fold, 1.15- to 3.46-fold, 1.10- to 3.54-fold, and 1.08- to 3.21-fold higher than those recorded historically. In terms of land use, encroachment of urban sprawl onto cropland and woodland will be the key driver of the future decline in ESs in the DPRK’s subregion. This reduction in cropland and woodland coverage, as a cost of urban expansion, will cause declines of 64.42–229.08 thousand tons, 0.50–1.51 million tons, 3.11–10.11 million tons, and 0.11–0.34 thousand tons in the four key ESs of FP, CS, WR, and AP, respectively, representing 90.96%–99.98% of all ES losses in the DPRK’s subregion.
These declines in ESs, as a consequence of continued urbanization, will have negative repercussions with respect to the wellbeing of the inhabitants of the DPRK’s subregion. In particular, the reduction in the production of food will adversely affect 0.31–1.09 million people, which is approximately 9.58%–30.00% of the entire projected population of the DPRK’s subregion in 2050. The projected future loss of stored carbon is equivalent to the consumption of approximately 0.77–2.30 million tons of standard coal, while the future reduction in water retention capacity is equivalent to the annual water consumption of 9.21–29.56 thousand people, representing approximately 0.28%–0.80% of the projected population of the DPRK’s subregion in 2050. In addition, the reduction in air quality in this subregion will contribute to the requirement for additional expenditures of 6.63–19.81 million euros to ensure the maintenance of reasonable air quality. On the basis of these findings, we suggest that the rate at which urbanization proceeds in this transnational area, and particularly the DPRK’s subregion, should be restricted based on a scientifically determined delimitation of urban boundaries. In addition, more stringent policies stipulating protections for cropland should be formulated. Finally, international trade among China, the DPRK, and Russia should be strengthened to promote the sustainable development of the TACM.
Data availability statement
The original contributions presented in the study are included in the article/Supplementary Material; further inquiries can be directed to the corresponding author.
Author contributions
RC performed the experiments and analyzed the data. YN and HF designed the study and planned the analysis. RC and DZ drafted the manuscript. DZ and YN contributed to revision of the manuscript. XG contributed to collection and downloading of the data. All authors contributed to the interpretation of findings, provided revisions to the manuscript, and approved the manuscript.
Funding
This research was supported by the National Natural Science Foundation of China (Grant Nos. 42271314, 41771094, and 41801184) and the Jilin Science and Technology Development Program (Grant No. 20210203138SF).
Conflict of interest
The authors declare that the research was conducted in the absence of any commercial or financial relationships that could be construed as a potential conflict of interest.
Publisher’s note
All claims expressed in this article are solely those of the authors and do not necessarily represent those of their affiliated organizations, or those of the publisher, the editors, and the reviewers. Any product that may be evaluated in this article, or claim that may be made by its manufacturer, is not guaranteed or endorsed by the publisher.
Supplementary material
The Supplementary Material for this article can be found online at: https://www.frontiersin.org/articles/10.3389/feart.2023.1163224/full#supplementary-material
References
Andersson, E., Tengö, M., McPhearson, T., and Kremer, P. (2015). Cultural ecosystem services as a gateway for improving urban sustainability. Ecosyst. Serv. 12, 165–168. doi:10.1016/j.ecoser.2014.08.002
Bai, X., Chen, J., and Shi, P. (2012). Landscape urbanization and economic growth in China: Positive feedbacks and sustainability dilemmas. Environ. Sci. Technol. 46 (1), 132–139. doi:10.1021/es202329f
Bruno, D., Sorando, R., Álvarez-Farizo, B., Castellano, C., Céspedes, V., Gallardo, B., et al. (2021). Depopulation impacts on ecosystem services in Mediterranean rural areas. Ecosyst. Serv. 52, 101369. doi:10.1016/j.ecoser.2021.101369
Chen, G., Li, X., Liu, X., Chen, Y., Liang, X., Leng, J., et al. (2020). Global projections of future urban land expansion under shared socioeconomic pathways. Nat. Commun. 11 (1), 537. doi:10.1038/s41467-020-14386-x
Chung, M. G., Frank, K. A., Pokhrel, Y., Dietz, T., and Liu, J. (2021). Natural infrastructure in sustaining global urban freshwater ecosystem services. Nat. Sustain. 4 (12), 1068–1075. doi:10.1038/s41893-021-00786-4
Delphin, S., Escobedo, F. J., Abd-Elrahman, A., and Cropper, W. P. (2016). Urbanization as a land use change driver of forest ecosystem services. Land Use Policy 54, 188–199. doi:10.1016/j.landusepol.2016.02.006
Evers, C. R., Wardropper, C. B., Branoff, B., Granek, E. F., Hirsch, S. L., Link, T. E., et al. (2018). The ecosystem services and biodiversity of novel ecosystems: A literature review. Glob. Ecol. Conservation 13, e00362. doi:10.1016/j.gecco.2017.e00362
Fang, C. (2017). The strategy and pattern of international economic cooperation in tumen river area of China under the background of “the belt and road”. Northeast Asia Econ. Res. 1 (01), 5–14.
FAO (2022). (Food and Agriculture Organization of the United Nations) FAOSTAT. Available at: www.fao.org/faostat/en/#data (Accessed October 18, 2022).
Fu, B., and Zhang, L. (2014). Land-use change and ecosystem services: Concepts, methods and progress. Prog. Geogr. 33 (04), 441–446.
Hasan, S. S., Zhen, L., Miah, M. G., Ahamed, T., and Samie, A. (2020). Impact of land use change on ecosystem services: A review. Environ. Dev. 34, 100527. doi:10.1016/j.envdev.2020.100527
He, C., Liu, Z., Gou, S., Zhang, Q., Zhang, J., and Xu, L. (2019). Detecting global urban expansion over the last three decades using a fully convolutional network. Environ. Res. Lett. 14 (3), 034008. doi:10.1088/1748-9326/aaf936
He, C., Liu, Z., Tian, J., and Ma, Q. (2014). Urban expansion dynamics and natural habitat loss in China: A multiscale landscape perspective. Glob. Change Biol. 20 (9), 2886–2902. doi:10.1111/gcb.12553
He, C., Zhang, D., Huang, Q., and Zhao, Y. (2016). Assessing the potential impacts of urban expansion on regional carbon storage by linking the LUSD-urban and InVEST models. Environ. Model. Softw. 75, 44–58. doi:10.1016/j.envsoft.2015.09.015
Huang, K., Li, X., Liu, X., and Seto, K. C. (2019a). Projecting global urban land expansion and heat island intensification through 2050. Environ. Res. Lett. 14 (11), 114037. doi:10.1088/1748-9326/ab4b71
Huang, Q., Zhang, H., van Vliet, J., Ren, Q., Wang, R. Y., Du, S., et al. (2021). Patterns and distributions of urban expansion in global watersheds. Earth’s Future 9 (8), e2021E–e2062E.
Huang, Q., Zhao, X., He, C., Yin, D., and Meng, S. (2019b). Impacts of urban expansion on wetland ecosystem services in the context of hosting the winter olympics: A scenario simulation in the guanting reservoir basin, China. Reg. Environ. Change 19, 2365–2379. doi:10.1007/s10113-019-01552-1
Jiang, L., and O Neill, B. C. (2017). Global urbanization projections for the shared socioeconomic pathways. Glob. Environ. Change 42, 193–199. doi:10.1016/j.gloenvcha.2015.03.008
Landuyt, D., Broekx, S., Engelen, G., Uljee, I., Van der Meulen, M., and Goethals, P. L. M. (2016). The importance of uncertainties in scenario analyses – a study on future ecosystem service delivery in Flanders. Sci. Total Environ. 553, 504–518. doi:10.1016/j.scitotenv.2016.02.098
Li, S., He, Y., Xu, H., Zhu, C., Dong, B., Lin, Y., et al. (2021a). Impacts of urban expansion forms on ecosystem services in urban agglomerations: A case study of shanghai-hangzhou bay urban agglomeration. Remote Sens. 13 (10), 1908. doi:10.3390/rs13101908
Li, X., Zhou, Y., Hejazi, M., Wise, M., Vernon, C., Iyer, G., et al. (2021b). Global urban growth between 1870 and 2100 from integrated high resolution mapped data and urban dynamic modeling. Commun. Earth Environ. 2 (1), 201. doi:10.1038/s43247-021-00273-w
Liu, H., Xing, L., Wang, C., and Zhang, H. (2022). Sustainability assessment of coupled human and natural systems from the perspective of the supply and demand of ecosystem services. Front. Earth Sci. 10, 1025787. doi:10.3389/feart.2022.1025787
Liu, Y., Fu, B., Wang, S., Li, Y., Zhao, W., and Li, C. (2021). Review and prospect of the water-food-ecosystem nexus in dryland's Coupled Human-Earth System. Geogr. Res. 40 (2), 541–555.
Liu, Z., He, C., Zhang, Q., Huang, Q., and Yang, Y. (2012). Extracting the dynamics of urban expansion in China using DMSP-OLS nighttime light data from 1992 to 2008. Landsc. Urban Plan. 106 (1), 62–72. doi:10.1016/j.landurbplan.2012.02.013
Mao, D., He, X., Wang, Z., Tian, Y., Xiang, H., Yu, H., et al. (2019). Diverse policies leading to contrasting impacts on land cover and ecosystem services in Northeast China. J. Clean. Prod. 240, 117961. doi:10.1016/j.jclepro.2019.117961
Milesi, C., Elvidge, C. D., Nemani, R. R., and Running, S. W. (2003). Assessing the impact of urban land development on net primary productivity in the southeastern United States. Remote Sens. Environ. 86 (3), 401–410. doi:10.1016/s0034-4257(03)00081-6
Millennium Ecosystem Assessment (MEA) (2005). Ecosystems and human well-being: Current state and trends. Washington DC: Island Press.
Nan, Y., Wang, B., Zhang, D., Liu, Z., Qi, D., and Zhou, H. (2020). Spatial patterns of LULC and driving forces in the transnational area of tumen river: A comparative analysis of the sub-regions of China, the DPRK, and Russia. Chin. Geogr. Sci. 30 (4), 588–599. doi:10.1007/s11769-020-1136-x
Peng, J., Chen, X., Liu, Y., Lü, H., and Hu, X. (2016). Spatial identification of multifunctional landscapes and associated influencing factors in the Beijing-Tianjin-Hebei region, China. Appl. Geogr. 74, 170–181. doi:10.1016/j.apgeog.2016.07.007
Peng, J., Liu, Z., Liu, Y., Hu, X., and Wang, A. (2015). Multifunctionality assessment of urban agriculture in Beijing City, China. Sci. Total Environ. 537, 343–351. doi:10.1016/j.scitotenv.2015.07.136
Santos, J., Flintsch, G., and Ferreira, A. (2017). Environmental and economic assessment of pavement construction and management practices for enhancing pavement sustainability. Resour. Conservation Recycl. 116, 15–31. doi:10.1016/j.resconrec.2016.08.025
Seto, K. C., Guneralp, B., and Hutyra, L. R. (2012). Global forecasts of urban expansion to 2030 and direct impacts on biodiversity and carbon pools. Proc. Natl. Acad. Sci. 109 (40), 16083–16088. doi:10.1073/pnas.1211658109
Shwartz, A., Turbé, A., Julliard, R., Simon, L., and Prévot, A. (2014). Outstanding challenges for urban conservation research and action. Glob. Environ. Change 28, 39–49. doi:10.1016/j.gloenvcha.2014.06.002
Sun, S., Lü, Y., and Fu, B. (2023). Relations between physical and ecosystem service flows of freshwater are critical for water resource security in large dryland river basin. Sci. Total Environ. 857, 159549. doi:10.1016/j.scitotenv.2022.159549
Sun, Y., Nan, Y., Zhang, D., Yang, Y., Gan, X., and Piao, L. (2022). Environmental degradation in the transnational area of Changbai Mountain based on multiple remote sensing data. Land Degrad. Dev. 33, 1–15. doi:10.1002/ldr.4360
Tao, H., Nan, Y., and Liu, Z. (2017). Spatiotemporal patterns of forest in the transnational area of Changbai Mountain from 1977 to 2015: A comparative analysis of the Chinese and DPRK sub-regions. Sustainability 9 (6), 1054. doi:10.3390/su9061054
Tu, H., and Liu, C. (2014). Calculation of CO2 emission of standard coal. Coal Qual. Technol. 2, 57–60.
Wade, T. G., Wickham, J. D., Zacarelli, N., and Riitters, K. H. (2009). A multi-scale method of mapping urban influence. Environ. Model. Softw. 24 (10), 1252–1256. doi:10.1016/j.envsoft.2009.03.006
Wang, J., Zhang, D., Nan, Y., Liu, Z., and Qi, D. (2020). Spatial patterns of net primary productivity and its driving forces: A multi-scale analysis in the transnational area of the tumen river. Front. Earth Sci. 14, 124–139. doi:10.1007/s11707-019-0759-7
Wu, C., Lin, Y., Chiang, L., and Huang, T. (2014). Assessing highway's impacts on landscape patterns and ecosystem services: A case study in puli township, taiwan. Landsc. Urban Plan. 128, 60–71. doi:10.1016/j.landurbplan.2014.04.020
Wu, J. (2013). Landscape sustainability science: Ecosystem services and human well-being in changing landscapes. Landsc. Ecol. 28 (6), 999–1023. doi:10.1007/s10980-013-9894-9
Xia, T., Wu, W., Zhou, Q., Tan, W., Verburg, P. H., Yang, P., et al. (2018). Modeling the spatio-temporal changes in land uses and its impacts on ecosystem services in Northeast China over 2000–2050. J. Geogr. Sci. 28 (11), 1611–1625. doi:10.1007/s11442-018-1532-7
Xiang, H., Jia, M., Wang, Z., Li, L., Mao, D., Zhang, D., et al. (2018). Impacts of land cover changes on ecosystem carbon stocks over the transboundary tumen river basin in Northeast Asia. Chin. Geogr. Sci. 28 (6), 973–985. doi:10.1007/s11769-018-1006-y
Xiang, H., Zhang, J., Mao, D., Wang, Z., Qiu, Z., and Yan, H. (2022). Identifying spatial similarities and mismatches between supply and demand of ecosystem services for sustainable Northeast China. Ecol. Indic. 134, 108501. doi:10.1016/j.ecolind.2021.108501
Yang, G., Ge, Y., Xue, H., Yang, W., Shi, Y., Peng, C., et al. (2015). Using ecosystem service bundles to detect trade-offs and synergies across urban–rural complexes. Landsc. Urban Plan. 136, 110–121. doi:10.1016/j.landurbplan.2014.12.006
Yang, Y., Nan, Y., Liu, Z., Zhang, D., and Sun, Y. (2020). Direct and indirect losses of natural habitat caused by future urban expansion in the transnational area of Changbai Mountain. Sustain. Cities Soc. 63, 102487. doi:10.1016/j.scs.2020.102487
Yang, Y., Zhang, D., Nan, Y., Liu, Z., and Zheng, W. (2019). Modeling urban expansion in the transnational area of Changbai Mountain: A scenario analysis based on the zoned land use scenario dynamics-urban model. Sustain. Cities Soc. 50, 101622. doi:10.1016/j.scs.2019.101622
Yi, H. (2020). Impacts of land change on ecosystem service values and environmental sustainability in North Korea (Democratic People's Republic of Korea) through the 2030s. J. Korean Geogr. Soc. 55 (2), 97–121.
Zhang, D., Huang, Q., He, C., and Wu, J. (2017). Impacts of urban expansion on ecosystem services in the beijing-tianjin-hebei urban agglomeration, China: A scenario analysis based on the shared socioeconomic pathways. Resour. Conservation Recycl. 125, 115–130. doi:10.1016/j.resconrec.2017.06.003
Zhang, D., Huang, Q., He, C., Yin, D., and Liu, Z. (2019). Planning urban landscape to maintain key ecosystem services in a rapidly urbanizing area: A scenario analysis in the beijing-tianjin-hebei urban agglomeration, China. Ecol. Indic. 96, 559–571. doi:10.1016/j.ecolind.2018.09.030
Zhang, D., Nan, Y., Zhu, W., He, C., Liu, Z., and Yang, Y. (2023). Indirect impacts of future urban expansion on ecosystem services in the transnational area of China, North Korea, and Russia. Land Degrad. Dev. 2023. 10.1002/ldr.4611.
Zhang, H., Du, H., Wang, S., and Lei, J. (2012a). Study on the land use change and ecosystem services value in Changbai Mountain. Res. Soil Water Conservation 19 (06), 242–246.
Zhang, X., Xiang, X., Liu, H., and Wu, G. (2012b). Practical research on carbon dioxide emission calculation in iron and steel industry. Industrial Saf. Environ. Prot. 38, 86–88.
Keywords: ecosystem service, urban expansion, SSPs, LUSD-urban model, transnational area
Citation: Chen R, Zhang D, Nan Y, Feng H and Geng X (2023) Assessing the impacts of future urban expansion on multiple ecosystem services in the transnational area of Changbai Mountain. Front. Earth Sci. 11:1163224. doi: 10.3389/feart.2023.1163224
Received: 10 February 2023; Accepted: 14 April 2023;
Published: 09 May 2023.
Edited by:
Qingxu Huang, Beijing Normal University, ChinaReviewed by:
Haimeng Liu, Chinese Academy of Sciences (CAS), ChinaJianmin Qiao, Shandong Normal University, China
Jingwei Li, Shanghai Normal University, China
Copyright © 2023 Chen, Zhang, Nan, Feng and Geng. This is an open-access article distributed under the terms of the Creative Commons Attribution License (CC BY). The use, distribution or reproduction in other forums is permitted, provided the original author(s) and the copyright owner(s) are credited and that the original publication in this journal is cited, in accordance with accepted academic practice. No use, distribution or reproduction is permitted which does not comply with these terms.
*Correspondence: Hengdong Feng, aGRmZW5nQHlidS5lZHUuY24=; Da Zhang, emhhbmdkYUB5YnUuZWR1LmNu