 Yoshihisa Mino
 Chiho Sukigara
 Hajime Kawakami
 Masahide Wakita
 Makio C. Honda
- 1Institute for Space-Earth Environmental Research, Nagoya University, Furo-cho, Chikusa-ku, Nagoya, Japan
- 2Japan Agency for Marine-Earth Science and Technology (JAMSTEC), Yokosuka, Japan
- 3Mutsu Institute for Oceanography, JAMSTEC, Mutsu, Japan
Recently, new spatiotemporal-scale particle observations by autonomous profiling floats equipped with bio-optical sensors have revealed that, in addition to gravitational particle sinking, the downward transport of surface particles by physical mixing events, which has been overlooked, contributes to particulate organic carbon export. However, the subsequent behavior of these exported particles in the mesopelagic zone (e.g., particle fragmentation and degradation) remains unclear, although it may influence the efficiency of carbon transport to further depths. This study successfully depicted the new annual mean mesopelagic particulate nitrogen (PN) dynamics with multi-layer, steady-state suspended PN pools by reanalyzing seasonal data on the stable nitrogen isotopic compositions of both suspended and sinking particles, each with different profiles, from subarctic station K2 and subtropical station S1 in the North Pacific, which are both CO2 sinks but in different oceanic settings. As analytical conditions, we assumed that the net loss of sinking PN was entirely due to abiotic fragmentation of particle aggregates to non-sinking particles and that the apparent 15N enrichment associated with heterotrophic degradation in the suspended PN pools was vertically constant. The 15N mass balance for the PN supply to the uppermost mesopelagic pool, derived from such constraints, allowed estimating the PN export by the mixed-layer pump, which was 1.6 times greater at K2 than at S1. However, its contribution to the total export (including gravitational PN sinking) from the surface layer was approximately 20% at both stations. Moreover, the ratio of PN supplied to the uppermost pool by the mixed-layer pump and by the fragmentation of particle aggregates was also similar at both stations, approximately 1:1. Using these ratios, together with separate observations of the mixed-layer pump-driven flux, it may be possible to estimate the efficiency of the particulate organic carbon transport due to the biological gravitational pump responsible for carbon sequestration in the deep sea.
1 Introduction
The downward transport of particulate organic carbon (POC) is the primary process in biological carbon pumps. Traditionally observed by sediment traps that tend to capture relatively large, fast sinking marine snow and fecal pellets (Buesseler et al., 2007a), the POC gravitational sinking flux decreases nonlinearly with depth and is often approximated by the “Martin curve,” a power law relationship with depth (Martin et al., 1987), with the greatest rate at shallow depths. According to previous studies, the attenuation rate with depth, expressed as the exponent b of the equation, differs significantly among oceanic regions (Berelson, 2001; Buesseler et al., 2007b; Honda et al., 2020). The smaller the flux attenuation, the more efficiently carbon is sequestered in the deep ocean. Therefore, determining or appropriately modeling an area-specific exponent b is essential for estimating the global oceanic POC export from the upper waters via a biological gravitational pump (BGP), and hence the potential for atmospheric CO2 sequestration.
Nevertheless, the main processes that reduce particle fluxes at depths below the particle-producing layer down to several hundred meters, hereafter referred to as the “mesopelagic zone,” are still under discussion. Relatively low organic matter fractions and modified organic matter composition (e.g., the lipid fraction of the organic flux becomes smaller) of trapped particles at depth (Wakeham et al., 1980; 1984) suggest that sinking aggregates (i.e., marine snow) are important sites of heterotrophic activity in the deep sea (Alldredge et al., 1986). However, Karl et al. (1988) suggested that consumption by microbes attached to fast-sinking aggregates alone cannot quantitatively explain POC flux attenuation, especially in shallow layers; instead, fragmentation into smaller non-sinking particles is primarily responsible for the net loss of sinking POC. Various fragmentation processes have been proposed, related to microbial degradation (Pomeroy and Deibel, 1980; Biddanda and Pomeroy, 1988), zooplankton feeding (Lampitt et al., 1990; Banse, 1995; Steinberg et al., 1997; Dilling and Alldredge, 2000; Goldthwait et al., 2004), and ocean turbulence (Jackson, 1995; Ruiz, 1997). In recent years, particle fragmentation (based on particle size distribution) in natural environments has also been quantified using optical particle measurement techniques (Briggs et al., 2020; Clements et al., 2022).
Observations using optical particle sensors equipped with autonomous instruments (e.g., Biogeochemical (BGC)-Argo: Claustre et al., 2020) have revealed pathways through which non-sinking particles in the surface layer are directly exported to the mesopelagic zone via vertical water mixing dynamics, known as the mixed-layer (ML) pump (Dall'Olmo et al., 2016). The contribution of small-sized POC export associated with physical water subductions, including the ML pump, which had been overlooked in sediment trap experiments, is now being eagerly discussed. For example, the POC export using the seasonal ML pump is equivalent to 13%–23% of the POC flux from the BGP in high-latitude regions (Dall'Olmo et al., 2016) because the POC supplied to the mesopelagic zone by these processes has the potential to resolve the carbon imbalance (Burd et al., 2010), whereby the carbon demand of the mesopelagic ecosystem exceeds the BGP-driven POC export (Boyd et al., 2019). Furthermore, microbial organic matter degradation and mineralization in this ecosystem determine the vertical distribution of nutrients and CO2, affecting the open ocean primary productivity regulated by nutrient supply from below and, thereby, the strength of the BGP. Thus, with the expected accumulation of knowledge on the fragmentation of particle aggregates and particle export by physical subductions based on new optical particle data, there is a need to revisit particle dynamics with conversions between sinking particles and non-sinking, suspended particles, such as how surface layer-origin particles are transported to the mesopelagic zone and what happens to them.
The conversion from sinking aggregates to suspended particles by fragmentation has also been supported by observations that the stable nitrogen isotopic composition (δ15N), which can record the heterotrophic modifications of sinking particles, is vertically constant (Altabet, 1988; Altabet, 1989). More recently, Mino et al. (2016) and (2020) showed that at time-series stations in the subarctic gyre (K2) and the subtropical region (S1) (Figure 1), the δ15N of particulate nitrogen (PN) collected by sediment traps changed little, vertically at 100–200 m, and they inferred that the reduction in the flux of sinking PN, PN(SINK), by 43%–61% within the upper mesopelagic column of both stations was primarily attributed to the conversion from sinking to suspended particles by “physical” fragmentation, probably without 15N fractionation, rather than degradative PN removal, including peptide hydrolysis with 15N fractionation (Bada et al., 1989; Silfer et al., 1992). Figure 2, based on particle observation data at K2 and S1 over four seasons between 2010 and 2011, shows the contrasting vertical distributions of annual mean δ15N for suspended PN, PN(SUS), and PN(SINK), with a 5‰–6‰ increase in δ15N of PN(SUS) between 100 and 500 m and almost no change in δ15N of PN(SINK) in both stations. This difference further suggests that, at least for PN, even if there was an aggregation-related conversion from suspended to sinking particles (which likely increases the δ15N of PN(SINK) at depth), its contribution would be small. Thus, the PN-δ15N properties provide a key to understanding the particle dynamics in the water column. In this study, we propose a new picture of the mesopelagic PN dynamics (including gravitational sinking, fragmentation, mixing and diffusive transport, and microbial degradation) by revisiting the vertical distributions of the PN(SINK) flux, PN(SUS) concentration, and their PN-δ15N for both particles at K2 and S1, using a simple concept that assumes an annual-scale steady state. The abiotic conversion from PN(SINK) to PN(SUS), implied by the observed vertical constancy of the δ15N of PN(SINK), is the cornerstone of the mesopelagic PN dynamics. In addition, this analysis assumes that the apparent 15N enrichment associated with heterotrophic degradation of PN(SUS) is constant at each station and uses the 15N mass balance of the PN supply to the pool to calculate the ML pump-driven PN transport. Finally, we discuss its validity and impact on biogeochemical cycling.
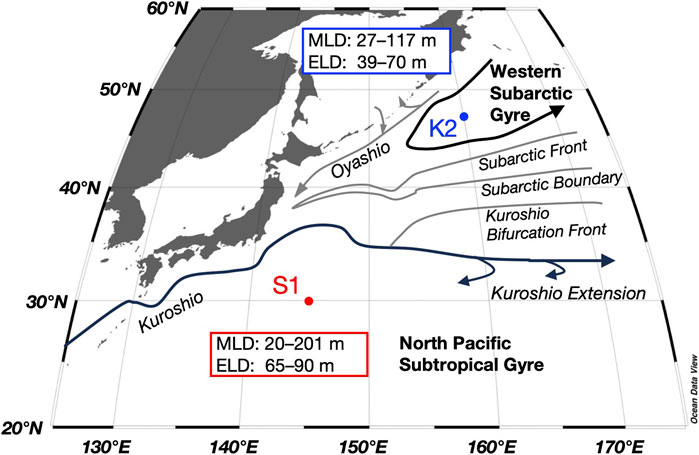
FIGURE 1. Time-series stations in the subarctic (K2) and subtropical (S1) regions and main currents in the western North Pacific, with the ranges of the mixed layer depth (MLD) and euphotic layer depth (ELD) for both stations obtained during seasonal cruises between 2010 and 2011 from Honda et al. (2016) and Matsumoto et al. (2016).
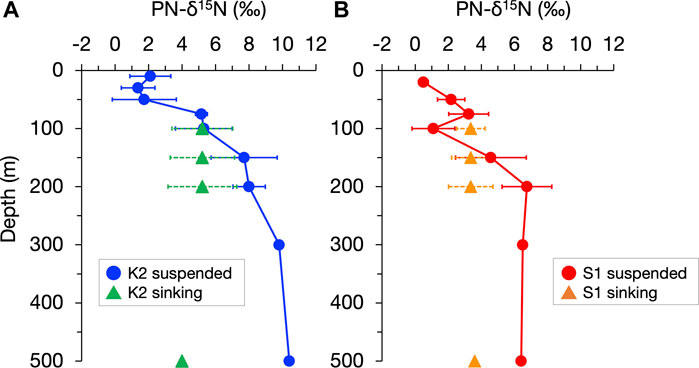
FIGURE 2. Vertical profiles of the annual mean of the stable nitrogen isotopic composition of particulate nitrogen (PN-δ15N) in suspended and sinking particles (indicated by circles and triangles, respectively) in the upper 500 m at stations K2 (A) and S1 (B). The horizontal bars indicate standard deviations corresponding to seasonal changes. The original seasonal data for annual mean values are shown in Supplementary Figure S1 and Supplementary Figure S2. It should be noted that for sinking particles at 500 m collected by moored sediment traps, the PN flux-weighted average δ15N for the mooring periods in 2010–2014 are shown.
2 Materials and methods
2.1 Data used
The PN-δ15N data at two time-series stations K2 and S1 obtained under the K2S1 project (Honda et al., 2017) were used here, much of which were published elsewhere: K2 and S1 data from Mino et al. (2016) and Mino et al. (2020), respectively. Here, both datasets were reanalyzed with the aim of addressing the regional differences in the particle dynamics in the mesopelagic zone. In this analysis, we assumed that marine particles exist in two forms: non-sinking suspended particles collected by water sampling and sinking particles collected by sediment traps. As previously mentioned, we refer to particulate nitrogen as PN(SUS) or PN(SINK) (Table 1). Briefly describing the data collection, during five scientific cruises on board R/V Mirai, conducted by the Japan Agency for Marine-Earth Science and Technology (JAMSTEC) between 2010 and 2012 (these were seasonal, doi:10.17596/0001829, 10.17596/0001830, 10.17596/0001831, 10.17596/0001832, 10.17596/0001833, 10.17596/0001841, and 10.17596/0001842), water samplings for collecting suspended particles from the surface to 200 m (500 m during the cruise in 2012) and 3–4 days drifting sediment trap (DST) experiments for sinking particles (hereafter referred to as DST particles) at 60, 100, 150, and 200 m were conducted (Honda et al., 2016). In addition, semi-continuous collections (sampling interval: 12–20 days) of sinking particles at 500 m at both stations were conducted via moored sediment trap (MST) deployments in the period 2010–2014 (Honda et al., 2020). These particles δ15N, as well as the PN mass fraction, were measured using an elemental analyzer coupled to a continuous-flow isotope ratio mass spectrometer with an accuracy of 0.2‰ for δ15N and 3% for PN mass abundance in the onshore laboratory (see Mino et al., 2016 for details).
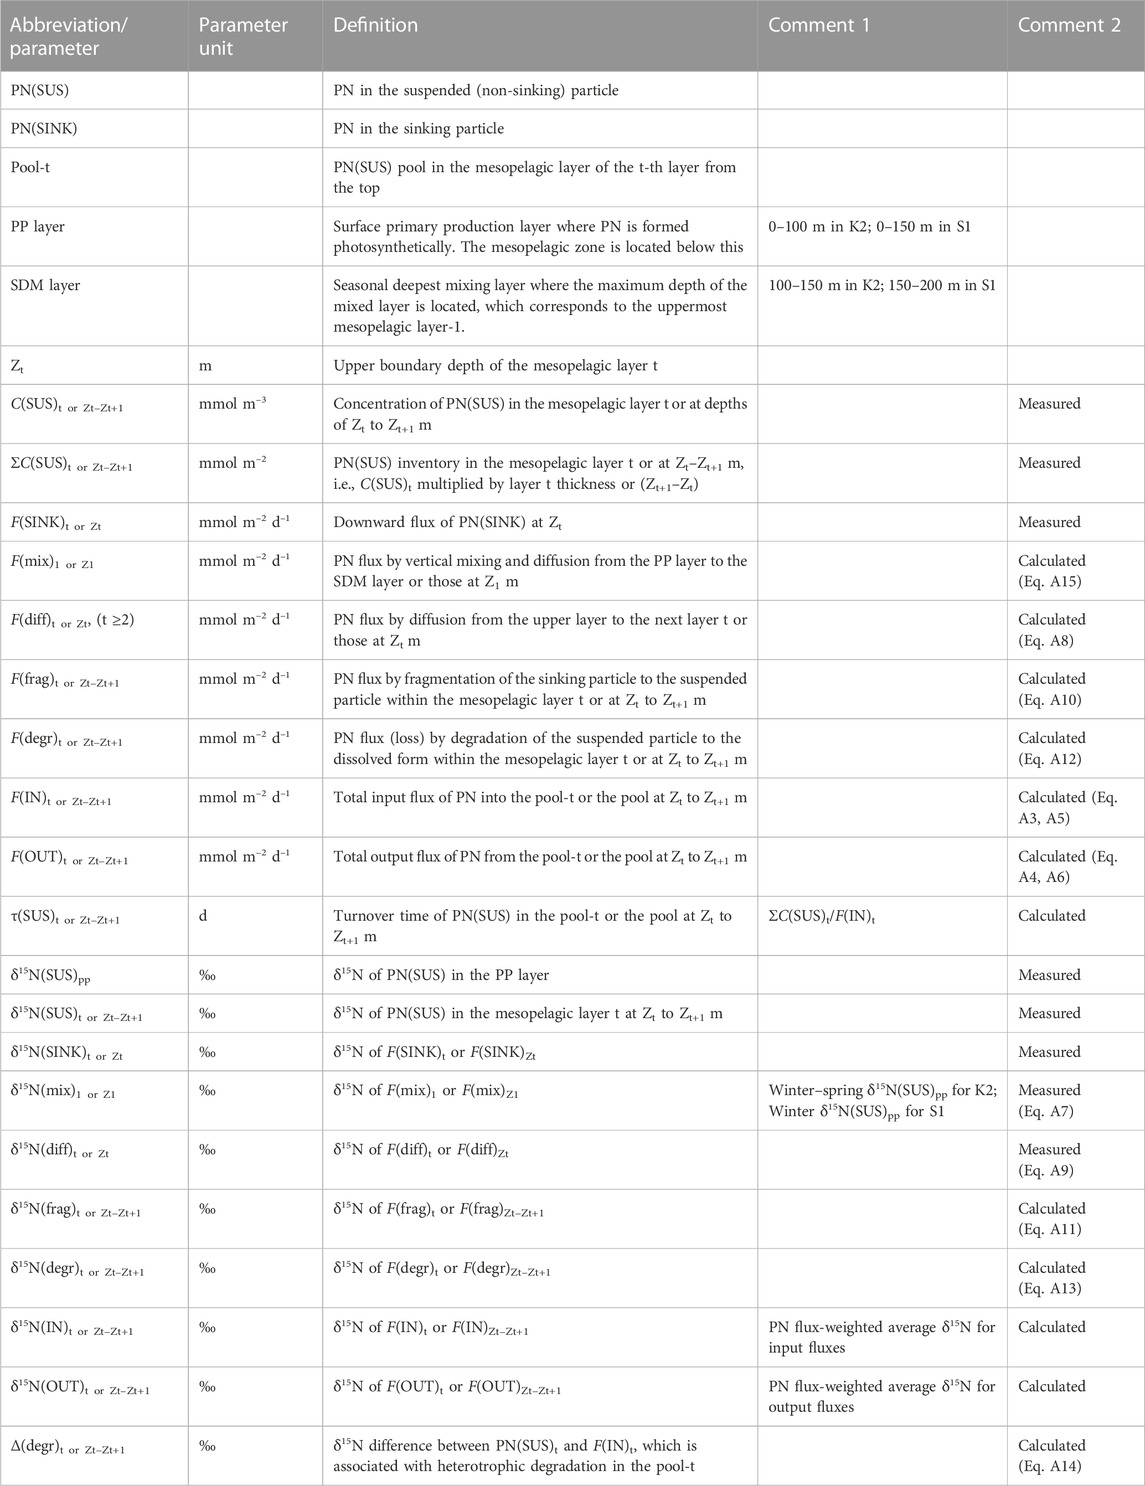
TABLE 1. Definitions of abbreviations and parameters.
2.2 Particle δ15N data and treatments
The δ15N of PN(SUS) and PN(SINK), hereafter denoted as δ15N(SUS) and δ15N(SINK), respectively, for each seasonal cruise (original data for the annual mean values in Figure 2) are shown in Supplementary Figures S1, S2, together with the suspended PN concentration C(SUS) and PN sinking flux F(SINK). Although there was a seasonal variation of data in surface water shallower than 50 m, there was an increase in δ15N(SUS) with a vertical decrease in C(SUS) from the surface to 200 m for all seasons: a 5.6‰–8.4‰ increase in δ15N(SUS) and 76%–89% decrease in C(SUS) for K2 and a 3.1‰–5.8‰ increase and 71%–85% decrease for S1. In contrast, sinking particles at 100–200 m depth at both sites always showed a vertical constancy (<0.5‰ change) in δ15N(SINK), independent of the vertical decay of F(SINK) (38%–65% decrease at K2 and 28%–59% decrease at S1) (Figure S1).
These data were processed seasonally in the following depth order so they could be used in the analysis, assuming a steady state of annual PN dynamics, as shown in Figure 3. First, the annual mean C(SUS) and δ15N(SUS) at 100, 150, and 200 m (using four seasonal cruise datasets from 2010 to 2011) was calculated (Supplementary Table S2). However, the 300 and 500 m data were only obtained during the cruise in the summer of 2012; these were used to calculate the sizes of the mesopelagic PN(SUS) pools and their δ15N(SUS) values (Table 2). For δ15N(SUS) in the surface layer, defined here as 10–50 m at K2 and 20–75 m at S1, with reference to the depth of the euphotic zone (Figure 1), the values were calculated as means for the season of deep convective mixing (winter and spring of 2011 at K2 and winter of 2011 at S1) instead of annual means (Supplementary Table S2). This accounted for surface particles that could be transported to the mesopelagic layer using the ML pump (see Section 2.3).
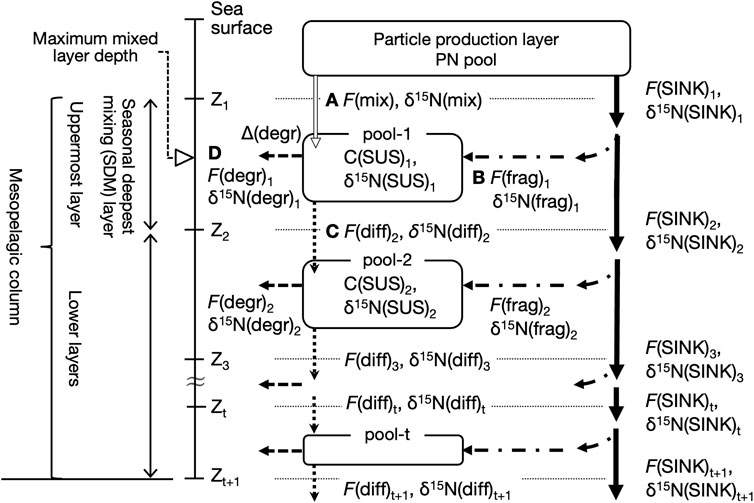
FIGURE 3. Conceptual diagram of PN dynamics in the mesopelagic column. The column is below the particle production (PP) layer and down to a depth of several hundred meters and divided into t layers by the boundaries (horizontal dashed lines) at depths of Z1, Z2, …, and Z(t+1). The uppermost layer, which contains the depth at which the deepest vertical mixing is reached during the year, is referred to here as the seasonal deepest mixing (SDM) layer. A suspended PN pool, denoted as pool-t, exists at each layer with a PN concentration, C(SUS)t. The arrows indicate the nitrogen fluxes: particle aggregates sinking, F(SINK), and the physical fragmentation, F(frag), net downward transport of the PP layer suspended particles by mixing, F(mix), and by diffusion, F(diff), and heterotrophic PN degradation to dissolved forms in the pool, F(degr). The δ15N of the pool and fluxes are denoted as δ15N(SUS), δ15N(SINK), δ15N(frag), δ15N(mix), δ15N(diff), and δ15N(degr). The Δ(degr) indicates an apparent δ15N increase in suspended PN in the pool relative to the total PN supply, which is associated with F(degr) (see text). The F(mix)1, F(frag)1, F(diff)2, and F(degr)1 are alphabetized as (A–D). Assuming a steady state in the uppermost pool-1, it holds that A + B = C + D.
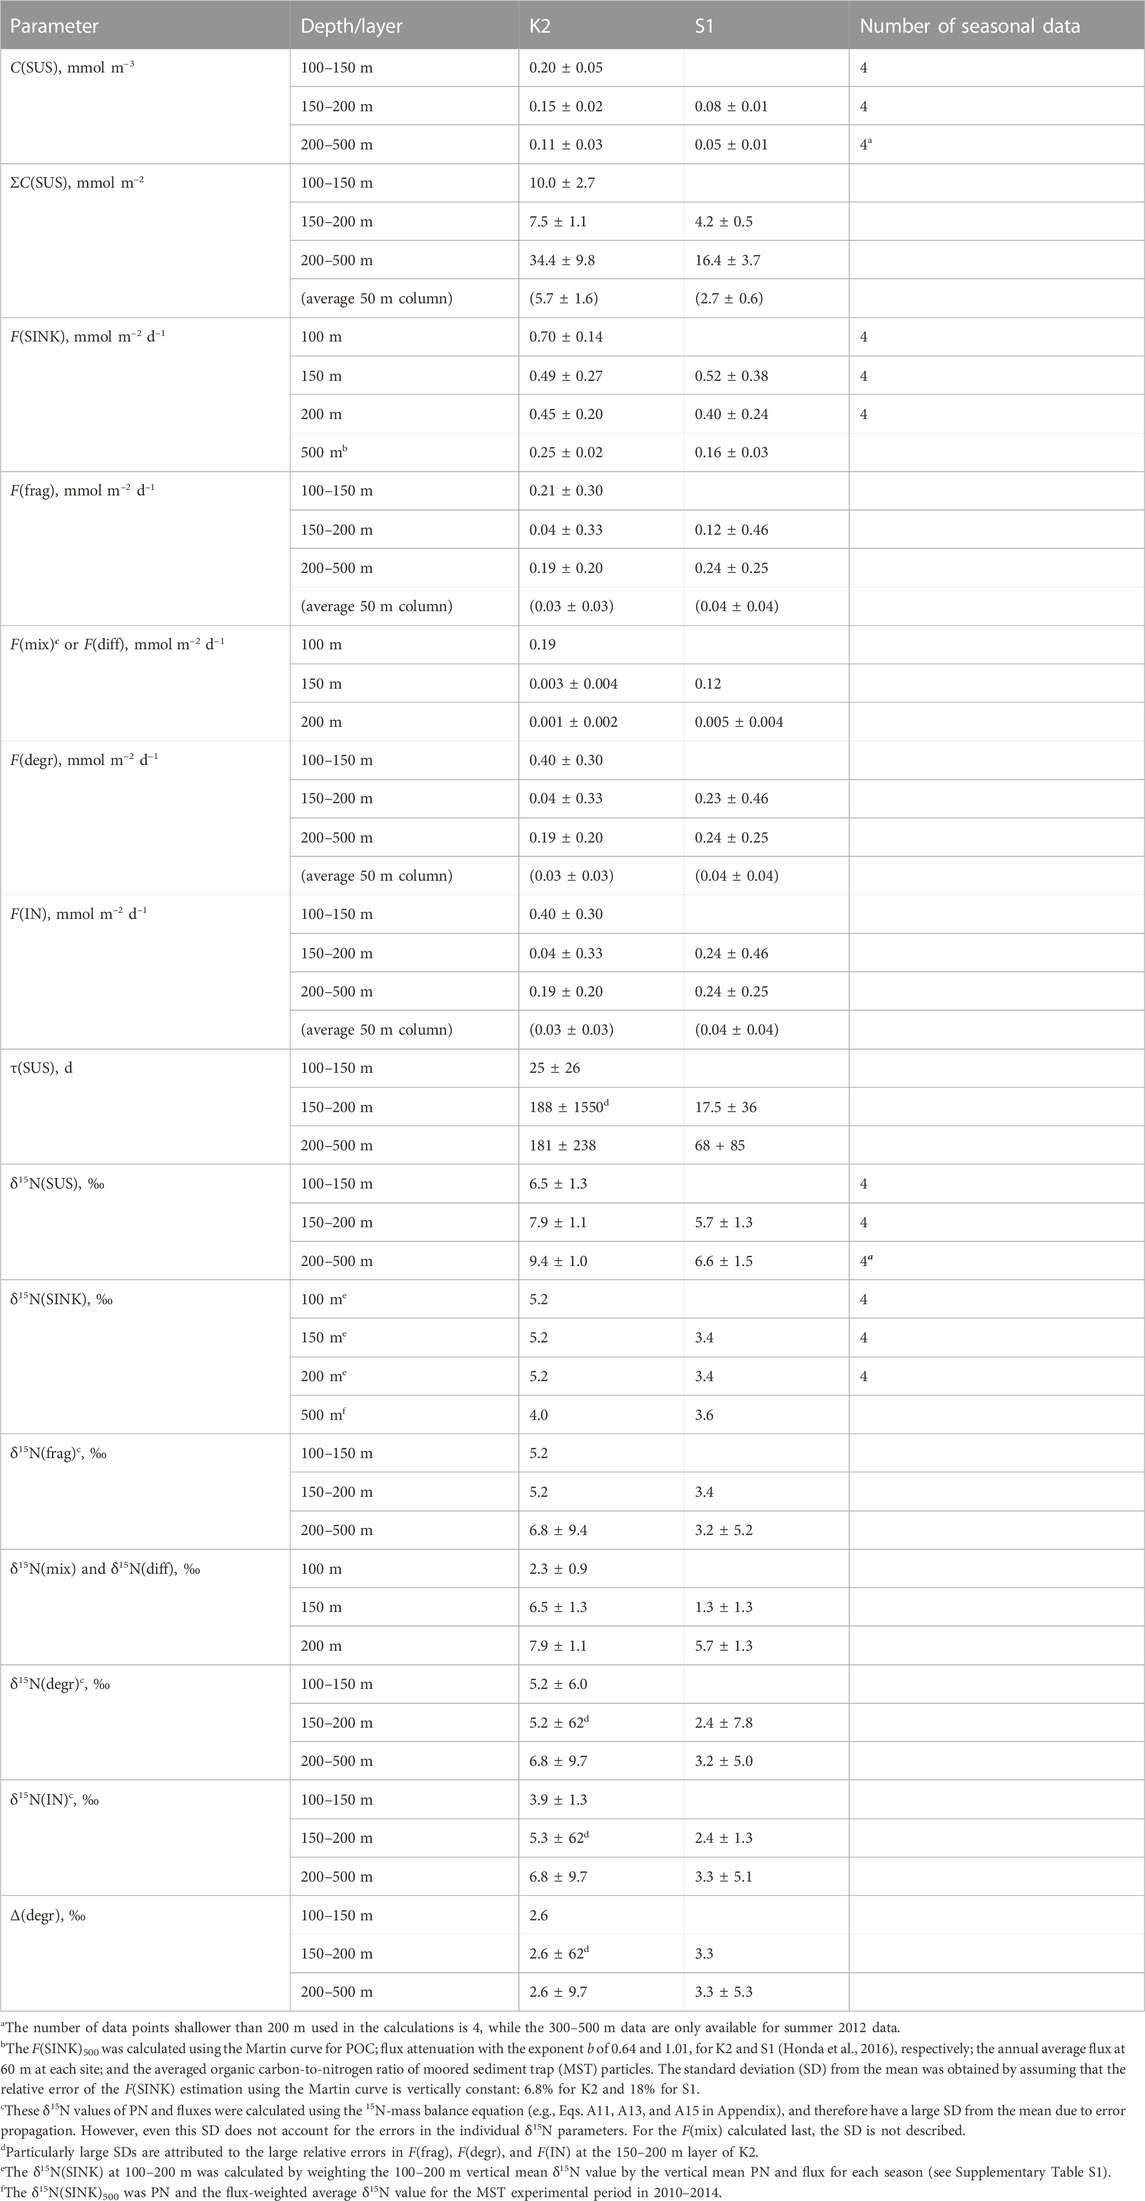
TABLE 2. Calculation results of annual values (mean ± standard deviation) for each parameter in K2 and S1.
For F(SINK), annual means were calculated for 100, 150, and 200 m, based on seasonal DST data (Table 2). On the other hand, its annual δ15N was obtained by weighted averaging of the vertical mean of the original δ15N(SINK) for each season with the 100–200 m mean F(SINK) (Supplementary Table S1). This calculation was based on the assumption that the annual δ15N(SINK) is constant at 100–200 m. The annual mean F(SINK) at 500 m was estimated using the respective annual mean Martin curves for K2 and S1 for the POC flux, with exponents b of 0.64 and 1.01, at K2 and S1, respectively (Honda et al., 2015), obtained from seasonal DST-derived flux data and the mean organic carbon-to-nitrogen ratio (C:N) of MST particles (Supplementary Table S3). The reason for not using the MST-derived annual mean F(SINK) is that our MSTs have been noted to have a lower particle trapping efficiency than the DSTs (Honda et al., 2015). However, assuming that the trapping efficiency of MSTs does not vary seasonally, we calculated the F(SINK)-weighted average δ15N for the MST mooring period of 2010–2014 as the annual δ15N(SINK) at 500 m.
2.3 Concept of mesopelagic PN dynamics and calculation of PN fluxes and their PN-δ15N
Using the K2 and S1 data described previously, we considered the mesopelagic PN dynamics with an annual steady state, as shown in Figure 3. The equations for calculating the PN fluxes and their δ15N are provided in the Appendix. The mesopelagic column is below the particle production (PP) layer, down to a depth of several hundred meters (Zt+1 in Figure 3), and is divided into multiple t layers at given boundaries. The deepest convective mixing of the year reached the uppermost layer, called the seasonal deepest mixing (SDM) layer. In each layer t, there is a PN(SUS) pool, the size of which is the layer thickness-integrated C(SUS)t, or ΣC(SUS)t, which does not change on an annual scale, i.e., the total annual PN fluxes of the inputs and outputs to each pool t, F(IN)t and F(OUT)t, respectively, are equal (Eq. A1). The δ15N of both fluxes are also equal (Eq. A2) because the δ15N(SUS) in the pool also assumes a steady state.
There are two PN supply routes for each layer t (Eqs A3, A5). Some of the sinking particles exported from the PP layer are fragmented while sinking in layer t, thereby providing a new PN to the pool. This flux is denoted as F(frag)t. The other process is different for the SDM layer and its deeper layers; for the SDM layer, the surface PN(SUS) is input directly from the PP layer owing to seasonal and intra-seasonal mixing dynamics (i.e., the ML pump), the flux of which is indicated as F(mix)1. In the deeper layers, the downward transport of PN(SUS) from the layer immediately above occurs mainly by passive diffusion, indicated as F(diff)t. As shown in Supplementary Table S2, these net fluxes were downward at all depths because the annual PN(SUS) concentration consistently decreased vertically. However, as output fluxes, the PN entering the mesopelagic PN(SUS) pool was either removed from the pool by heterotrophic microbial degradation/remineralization, F(degr)t, in which it was converted to dissolved organic or inorganic matter, or diffusively transported further down (Eqs A4, A6). Because F(IN)t = F(OUT)t, as described previously, F(mix)1 + F(frag)1 = F(diff)2 + F(degr)1 for the SDM layer (t = 1). In Figure 3, the arrows indicating the respective fluxes are labeled A, B, C, and D.
The F(mix) to the SDM layer was calculated last, after the other fluxes and their PN-δ15N were determined. Because F(mix) did not involve 15N alternation, the PN-δ15N transported by F(mix) to the SDM layer, δ15N(mix), was regarded as the surface δ15N(SUS) of the season with active convective mixing (Eq. A7). The F(diff) between the mesopelagic PN(SUS) pools was calculated as the product of the annual mean C(SUS) gradient and the diffusion coefficient, whose PN-δ15N, δ15N(diff), was the δ15N(SUS) of the upper pool (Eqs A8, A9). The F(frag) was calculated from the vertical attenuation of F(SINK) at the upper and lower boundary depths of the target layer (Eq. A10). This was based on the hypothesis that all of the loss of PN(SINK) is due to the conversion of sinking aggregates into suspended particles by physical fragmentation, as suggested by the observed constancy of δ15N(SINK) at 100–200 m (Figure 2, Supplementary Figure S2, Supplementary Table S1). Thus, we set δ15N(frag) = δ15N(SINK) within this depth range. However, if δ15N(SINK) was not constant at depths below 200 m, δ15N(frag) was calculated using the mass and isotope balance (Eq. A11). The F(degr) is calculated from the difference between F(IN) and another output flux due to diffusion (Eq. A12), and its PN-δ15N, δ15N(degr), was also calculated using the 15N mass balance (Eq. A12). However, because this process involves the partial consumption of PN(SUS) in the pool by microorganisms, 15N fractionation (i.e., preferential degradation of 14N) should occur, resulting in an increase of δ15N in the remaining organic matter (Mobius, 2013). Here, the magnitude of the 15N enrichment of PN(SUS) in the pool relative to the PN supplied by F(IN) is expressed as Δ(degr) (Eq. A14), which was assumed to be vertically constant at each site. Once this Δ(degr) was determined, δ15N(IN) to the SDM layer at each site could be calculated, which was equivalent to the flux-weighted average of δ15N(mix) and δ15N(frag) in this layer, so that F(mix) can finally be calculated (Eq. A15).
3 Results
In this study, the mesopelagic zone at K2 and S1 is defined below the PP layer to a depth of 500 m. Although the depth of the euphotic layer (defined as 0.1% of the surface photosynthetic photon flux density level: 39–70 m at K2 and 65–90 m at S1; Figure 1) was shallower than 100 m at both stations, the subsurface chlorophyll a maximum was present across 100 m during the stratified period at S1 (Fujiki et al., 2016; Mino et al., 2020), and thus, the PP layer (whose lower boundary is denoted as Z1 in Figure 3) was defined as 0–100 m and 0–150 m at K2 and S1, respectively (Figure 4). The maximum of the surface mixed-layer depth (MLD) at K2 and S1, found between winter and spring, was approximately 120 m and 200 m, respectively (Figure 1; Wakita et al., 2016). We then divided the mesopelagic water column into three groups (t = 3; SDM layer: 100–150 m; deeper layers: 150–200 m and 200–500 m) at K2 and two groups (t = 2; SDM layer: 150–200 m; deeper layer: 200–500 m) at S1.
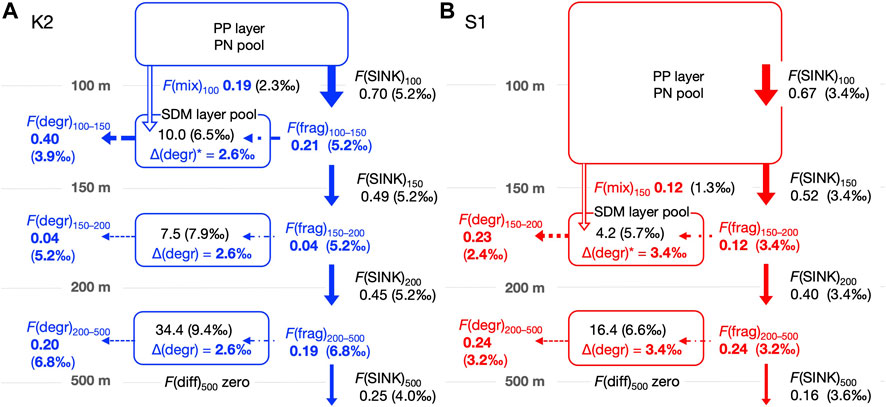
FIGURE 4. Schematic of the annual mean PN dynamics with fluxes (mmol m–2 d–1) and δ15N (‰) in the mesopelagic column for K2 (A) and S1 (B) based on seasonal cruise datasets. The column is divided into three groups (SDM layer: 100–150 m, deeper layers: 150–200 m and 200–500 m) at K2 and two groups (SDM layer: 150–200 m and deeper layer: 200–500 m) at S1. Symbols for each flux follow Table 1 and Figure 3, with flux values and the δ15N value (enclosed in parentheses) marked together. The PN(SUS) inventory, ΣC(SUS), (mmol m–2) and δ15N values are also noted within each mesopelagic pool. See the text and Appendix for the calculation of each flux and δ15N. The calculated values are shown in bold (blue or red) to distinguish them from observed values. For these calculations, we assumed the following: first, a steady state is established for each PN pool (i.e., the sum of input fluxes into the pool is balanced by the sum of output fluxes); second, the mass balance of 15N is also established, and finally Δ(degr) associated with heterotrophic PN degradation is vertically uniform at each station. That is, Δ(degr)* in the SDM layer is assigned to the same magnitude as those in the deeper layers. It should be noted that the other PN fluxes do not involve a δ15N alternation. The F(diff) to depths below 500 m was set to 0. The F(diff) at 150 m and 200 m in K2 and 200 m in S1 was non-zero but was more than an order of magnitude smaller than the other fluxes (Table 2), so the values and arrows were not described. Eventually, the F(mix) was estimated using the 15N mass balance in the SDM layer at both sites.
The calculated results of the PN parameters in each mesopelagic layer are listed in Table 2. A schematic of the annual mean PN dynamics with fluxes, including fluxes and their δ15N is shown in Figure 4. The annual mean C(SUS) in the mesopelagic layers was 0.20, 0.15, and 0.11 mmol m–3 from the top (SDM) to bottom layers at K2 and 0.08 and 0.05 mmol m−3 at S1. The downward F(diff) was 150 and 200 m at K2; hereafter the depth or boundary depths are added to the flux symbol F in subscripts to indicate the target depth (m) and layer; i.e., F(diff)150 and F(diff)200 were calculated to be 0.001–0.003 mmol m−2 d−1 (Table 2), when assuming the diffusion coefficient at those depths at K2 was 3.5 × 10⁻⁵ m2 s−1 (Andreev et al., 2002). The F(diff)200 at S1 was 0.005 mmol m−2 d−1, given the coefficient of 2.0 × 10⁻⁴ m2 s−1 (Sukigara et al., 2011). It should be noted that these F(diff) values were more than one order of magnitude lower than those of the other fluxes; therefore, they are not shown in Figure 4. F(diff)500 was set to 0 because it would be even smaller, given the smaller gradient of C(SUS) with depth. The annual F(SINK)100 exported from the PP layer at K2 was 0.70 mmol m−2 d−1, and F(SINK) decreased with depth: 0.49, 0.45, and 0.25 mmol m−2 d−1 at 150 m, 200 m, and 500 m, respectively. The F(SINK)150 exported from the PP layer, F(SINK)200, and F(SINK)500 at S1 was 0.52, 0.40, and 0.16 mmol m−2 d−1, respectively (Table 2; Figure 4, Supplementary Table S3). Consequently, the F(frag) into a PN pool per 50 m mesopelagic column, which was calculated as the attenuation of F(SINK), ranged from 0.03 to 0.21 mmol m−2 d−1 at K2 and from 0.04 to 0.12 mmol m−2 d−1 at S1 (Table 2).
The δ15N(SUS) values for the three mesopelagic layers of K2 were calculated to be 6.5‰, 7.9‰, and 9.4‰ from the top and 5.7‰ and 6.6‰ for the two layers at S1 (Table 2; Figure 4). These were all higher than the surface layer δ15N(SUS), which could be transported to the SDM layer using the ML pump, i.e., δ15N(mix): 2.3‰ at K2 and 1.3‰ at S1 (Supplementary Table S2). Meanwhile, these PN-δ15N signals could be transported to the deeper layers by F(diff) at the boundary depth of mesopelagic layers, although the flux was quite small. The annual δ15N(SINK) at 100–200 m, assumed to be vertically constant, was calculated to be 5.2‰ at K2 and 3.4‰ at S1 (Supplementary Table S1) and was set as δ15N(frag) in the mesopelagic PN(SUS) pool shallower than 200 m. Conversely, δ15N(SINK) at 500 m was 4.0‰ and 3.6‰ at K2 and S1, respectively, and δ15N(SINK)500 at K2 was approximately 1‰ lower than δ15N(SINK)100–200 (Table 2; Figure 4, and Supplementary Table S3). Therefore, δ15N(frag)200–500, calculated using Eq. A13, was 6.8‰ at K2 and 3.2‰ at S1 (Table 2; Figure 4).
Ultimately, δ15N(IN)150–200 and δ15N(IN)200–500 were completely supplied to the deeper two mesopelagic PN(SUS) pools at K2 and were calculated to be 5.3‰ and 6.8‰, respectively, while δ15N(IN)200–500 at S1 was 3.3‰, using two input fluxes and their respective PN-δ15N (Table 2). These δ15N of PN sources to the pools were lower than the δ15N(SUS) of 7.9‰–9.4‰ at K2 and 6.6% at S1, indicating 15N enrichment in these PN(SUS) pools. We attributed this to heterotrophic degradation to which particles are subjected, where 14N is preferentially consumed and converted to dissolved forms such as ammonium, NH4+, resulting in an increase in the PN-δ15N in particles that remain undegraded (Saino and Hattori, 1980; Macko and Estep, 1984; Saino and Hattori, 1987; Bada et al., 1989; Silfer et al., 1992; Aguiñiga et al., 2010) and then calculated the δ15N difference between δ15N(IN) and δ15N(SUS) as Δ(degr) (Eq. A14), which was 2.6‰ for both Δ(degr)150–200 and Δ(degr)200–500 at K2 and 3.3‰ for Δ(degr)200–500 at S1 (Table 2). Assuming that similar particle degradation with a similar degree of Δ(degr) would also occur in the upper pool at the respective sites, we then calculated δ15N(IN) for the mesopelagic SDM pool as δ15N(SUS)1—Δ(degr): δ15N(IN)100–150 at K2 was 3.9‰ and δ15N(IN)150–200 at S1 was 2.4‰. Substituting these, together with δ15N(mix), δ15N(frag), and F(frag), into Eq. A15 to calculate F(mix), the F(mix)100–150 at K2 was 0.19 mmol m–2 d–1 and the F(mix)150–200 at S1 was 0.12 mmol m–2 d–1 (Table 2; Figure 4). They were comparable to the F(frag) of 0.21 and 0.12 mmol m–2 d–1 for the respective SDM pools.
4 Discussion
4.1 Overview of mesopelagic PN dynamics
We used measurements of the suspended PN concentration and the PN sinking flux for each season (n = 4) to derive a schematic of the annual mean PN budget within the mesopelagic column at K2 and S1 (Figure 4), where the surface particle export by the ML pump was estimated using a mass balance of 15N. It should be noted, however, that the mean values of C(SUS) and F(SINK) are accompanied by the standard deviations (SD) of more than 13%–75% of their values, and the propagation of these errors results in even larger variations in the estimates such as δ15N(IN) and F(mix) (see the footnotes in Table 2). Our PN balance shows that the degree of the vertical attenuation of annual F(sink) at both stations was larger at shallower depths, consistent with the Martin equation, suggesting larger F(frag) by particle fragmentation (per unit volume) to the upper SDM layer than to the deeper layers (Table 2; Figure 4). In addition to this, the SDM layer was supplied with PN by F(mix) comparable to F(frag). Under the steady-state assumption, a PN removal from the layer equivalent to these total supplies occurred. Most of the removal was likely attributed to microbial F(degr) since the other output flux F(diff) was two orders of magnitude smaller. The quite small F(diff) in turn suggested that the PN supply to the deeper layers was mostly due to F(frag). In other words, while F(frag) was the main PN supply pathway in the deeper layers, for the SDM layer, F(mix) made an additional contribution, resulting in greater fluxes than those explained by the Martin curve alone.
The F(mix)100 of 0.19 mmol m−2 d−1 for K2 corresponds to 27% of F(SINK)100 of 0.70 mmol m-2 d-1, while F(mix)150 of 0.12 mmol m−2 d−1 for S1 corresponds to 23% of F(SINK)150 of 0.52 mmol m-2 d-1. Thus, although the ML pump-driven export of surface particles to the mesopelagic layer was 1.6 times greater in K2 than in S1, their contribution to the total PN export into the mesopelagic zone, i.e., F(SINK)Z1 + F(mix)Z1 of 0.89 and 0.64 mmol m−2 d−1, respectively, was 21% in K2 and 19% in S1, which were comparable.
The magnitude of F(mix) is strongly influenced by the mixing layer dynamics. Time-series conductivity, temperature, and depth (CTD) measurements, obtained from the underwater profiling buoy system at S1 from January to March 2013, indicated that the MLD repeatedly shoaled and deepened within 6 days from a depth of 40 m to at least 130 m (Fujiki et al., 2020; Mino et al., 2020). Given the intense surface disturbances in S1, we expected a larger F(mix) than that at K2; however, this was not the case. Our calculated F(mix) may in part be contributed by the particle export due to physical subduction other than mixing dynamics (e.g., eddy-subduction pump: Boyd et al., 2019). However, because S1 is frequently passed by mesoscale eddies originating from both the Kuroshio Extension and the central subtropical gyre (Inoue and Kouketsu, 2016), a larger eddy-subduction pump was expected in S1, which is also the opposite to the calculated results. Perhaps, the 1.2-fold higher surface layer C(SUS) during the mixed season at K2 compared to S1 would make F(mix) more efficient.
The POC flux (in terms of carbon weight) via the ML pump was calculated to be 13.7 mg m−2 d−1 at K2 and 8.5 mg m−2 d−1 at S1 because the mean C:N of the particulate organic matter in the surface layer for seasons with deep mixed layers was found to be 6.0 and 5.9, respectively. The ML pump-driven POC export at K2 is comparable to those estimated for high-latitude oceans using high-resolution particle backscattering (bbp)-based POC data acquired using the BGC-Argo float. The average annual transport of POC by ML pumps (which possibly includes slow-sinking particle fluxes) at 150 m in the western North Pacific subarctic gyre, where K2 is located, was 8.3 mg m−2 d−1, as estimated from the annual amplitude of the POC inventory at depths between 150 and 1,000 m, and up to 20 mg m−2 d−1, depending on the bbp/POC conversion factor used (Honda et al. submitted to the same special issue). In the North Atlantic subpolar region during the winter–spring transition period, when the surface ML develops to deeper than 300 m, the basin-averaged ML pump-driven POC export to the remnant layer was estimated to reach up to 55 mg m−2 d−1 (Lacour et al., 2019). Furthermore, Dall'Olmo et al. (2016) reported that in global high-latitude waters, the POC export by the ML pump averaged 23% of the export via fast-sinking particles (i.e., the particles collected by sediment traps), which is also in close agreement with our calculation at K2 (27%). These results support the validity of the F(mix) estimated in this study.
As mentioned previously, F(mix), together with F(frag), supplied PN to the SDM layer: the total PN supply, F(IN)1, for K2 and S1 was 0.40 (0.19 + 0.21) mmol m−2 d−1 and 0.24 (0.12 + 0.12) mmol m−2 d−1, respectively (Figure 4), to which the F(mix) contributed 47.5% and 50%, which are comparable. The 1.7-fold larger F(IN)1 at K2 than that at S1 possibly explains the 2.4-fold larger PN pool size in the SDM layer at K2 than at S1 (ΣC(SUS)1:10.0 vs. 4.2 mmol m−2, respectively, Table 2). As for the PN output flux from the layer, F(diff) contribution is only negligible at both stations, so most of the total removal (99% and 98% of F(OUT) at K2 and S1, respectively) is allocated to PN degradation. These F(degr) of 0.40 and 0.23 mmol m−2 d−1, respectively, correspond to 10 and 5.8 times larger than those in the layer just below (both 0.04 mmol m−2 d−1, per 50 m column). Conversely, the SDM layer C(SUS)1 was only 1.3–1.5 times the deeper layer at both sites. Consequently, the turnover time of PN, τ(SUS), in the SDM layer was calculated to be 25 days for K2 and 17.5 days for S1 (Table 2), which is extremely short compared to τ(SUS) for deeper pools (188 and 68 days, respectively). This turnover of PN(SUS) in the SDM layer within one month is consistent with the seasonal change of 3‰ in δ15N(SUS) seen at 150 and 200 m of both stations (Figure 2, Supplementary Figure S2) even with little change in C(SUS). In other words, they probably reflected a seasonal δ15N signal of supplied PN via F(frag) and F(mix). Meanwhile, it is also clear that the τ(SUS) of S1 is shorter than that of K2 for both the upper and deeper mesopelagic layers. This is mainly attributed to the smaller pool size at S1 than at K2; the whole mesopelagic mean ΣC(SUS) in the 50-m column is 6.5 mmol m−2 for K2 and 2.9 mmol m−2 for S1. However, the mesopelagic concentration of dissolved organic carbon, which has an order of magnitude larger concentration than POC, is higher at S1 than at K2 (Wakita et al., 2016; Uchimiya et al., 2018). Therefore, the discussion of the regional differences in the microbial degradation of organic matter in the mesopelagic zone should also consider the behavior of dissolved forms, which, however, is outside the scope of this study.
However, if we assume that all degraded PN(SUS) is regenerated to nitrate (NO3−) on an annual scale and that the NO3− pool is also in a steady state, our calculated F(degr) in the mesopelagic column below the SDM layer may be evaluated by comparing it with the NO3− diffusion flux, F(NO3, diff), at the top and bottom of this column. Wakita et al. (2016) estimated that the annual mean upward F(NO3, diff) is 0.21 mmol m–2 d–1 at 150 m at K2 and 0.49 mmol m–2 d–1 at 200 m at S1, based on quasi-monthly biogeochemical observations from 2004 to 2013. For the NO3− diffusion at 500 m, F(NO3, diff) at K2 would almost be 0 because the vertical difference in the NO3− concentration, ΔC(NO3), between 400 and 600 m was negligible (Supplementary Figure S3). The F(NO3, diff)500 at S1 was calculated to be 0.27 mmol m–2 d–1, given the annual mean ΔC(NO3)400–600 of 12.7 mmol m–3 (per 200 m) and the diffusion coefficient in the permanent thermocline of 0.5 × 10⁻⁴ m2 s–1 (Ledwell et al., 1993). When these upper and deeper diffusive fluxes were taken as the output and input of NO3− from/into the column, respectively, the total inputs of F(degr) + F(NO3, diff)500 were 0.24 mmol m–2 d–1 (0.24 + zero) at K2 and 0.51 mmol m–2 d–1 (0.24 + 0.27) at S1, and these were nearly identical to the respective output, F(NO3, diff)150 at K2 and F(NO3, diff)200 at S1. We believe that the agreement between the total NO3− input and output at both stations supports the validity of the steady-state hypothesis and our estimate of F(degr) on an annual scale.
4.2 Assumptions used in the analysis
First, based on the vertical constancy of δ15N(SINK) in the upper 200 m (Supplementary Figure S2; Supplementary Table S1), we assumed that the loss of PN(SINK) in that layer is entirely due to physical fragmentation (i.e., conversion to non-sinking particles). However, “solubilization” (conversion to dissolved components) associated with the microorganisms attached to aggregates (Ploug and Grossart, 1999; Ploug, 2001) likely also contributes to it. The high concentrations of the dissolved organic matter (DOM) inside the aggregates compared to the surrounding seawater have been reported (Alldredge, 2000; Antia, 2005), and this conversion to the DOM has been primarily attributed to the hydrolytic activity of bacterial exogenous enzymes (Cho and Azam, 1988; Urban-Rich, 1999). In the Buesseler and Boyd (2009) model, solubilization was incorporated as a POC flux loss of 0.2% per meter (or 20% loss per 100 m). Assuming that the solubilization rate is the same for C and N, and by employing this, 32%–46% of the trapped PN loss at 100–200 m for K2 and S1 would be attributed to solubilization. If, despite such contributions, it has no effect on the δ15N(SINK), it may be because peptide-bond hydrolysis with 15N fractionation was not the primary reaction in PN solubilization. This should be discussed once the specific reactions involved in the solubilization are determined. If solubilization (which does not supply PN to the mesopelagic PN(SUS) pool) occurs in sinking aggregates, our calculated F(frag) would overestimate the actual PN supply flux due to fragmentation by the extent of solubilization. Consequently, that would lead to an overestimation of F(mix) in our PN balance. However, the PN supply ratio of F(mix) to F(frag) remains the same. The validity of our estimated F(mix) was discussed previously, but further validation using other measurements of the particle flux by the ML pump in the same area would allow us to examine, albeit indirectly, the contribution by solubilization to the flux attenuation of PN(SINK).
Second, our analysis assumed that the value of Δ(degr) in the mesopelagic PN(SUS) pools is the same vertically at each station. Consequently, this implies that the vertical increase of mesopelagic δ15N(SUS) with depth reflects that of the δ15N(IN) supplied to the pool. Ultimately, the SDM layer δ15N(SUS) is lower than those in the deeper layers because the δ15N(mix) of 2.3‰ and 1.3‰, which is supplied only to the SDM layer for K2 and S1, respectively, was lower than the δ15N(frag) supplied to all the other deeper layers (Table 2; Figure 4). In contrast, the vertical increase in δ15N(SUS) in the deeper two layers from 7.9‰ in the 150–200 m layer to 9.4‰ in the 200–500 m layer at K2 reflects an increase in δ15N(frag) from 5.2‰ to 6.8‰. This preferential removal of the 15N-enriched organic matter from sinking aggregates was derived from the observation of a lower δ15N(SINK) at 500 m compared to that at 200 m, and a further vertical decrease in δ15N(SINK) at K2 was also found for MST particles collected at 1,000 m and 4,800 m (Yoshikawa et al., 2022). Similar decreases in the meso- and bathypelagic δ15N(SINK) have been reported in other regions: the subtropical Atlantic (Bermuda station OFP, Altabet et al., 1991) and the equatorial and subpolar areas in the western North Pacific (Nakatsuka et al., 1997). They suggested the possibility of selective degradation/solubilization of higher δ15N such as amino acids; however, another possibility that would be considered is the addition of low PN-δ15N materials by microbial de novo synthesis inside sinking aggregates (Yoshikawa et al., 2022) in the long time these aggregates take to reach the deep sea.
The mesopelagic Δ(degr) was calculated as the increase in δ15N(SUS) relative to δ15N(IN); however, Δ(degr) = δ15N(SUS)–δ15N(OUT) because δ15N(IN) is the same as δ15N(OUT) in this analysis under the steady state for 15N. Furthermore, the output due to F(diff) was negligibly small, so Δ(degr) ≈ δ15N(SUS)–δ15N(degr). This can be viewed as the δ15N difference between the substrate PN(SUS) and the product dissolved nitrogen (DON and/or DIN) of the PN degradation reaction in the mesopelagic pool, that is, the apparent 15N fractionation associated with heterotrophic degradation. Our estimated degradative 15N fractionations of 2.6‰ at K2 and 3.4‰ at S1 are within the range reported in previous studies: 0‰–2‰ (from PON to NH4+, Miyake and Wada, 1971) and 0‰–5‰ (from PON to DON, Robinson, 2001). However, the reason for the difference in mesopelagic Δ(degr) between the two sites is not well-understood. Although a discussion on errors is needed, if this difference is significant, the following deduction can be made: Yamaguchi et al. (2018) found that the δ15N of total hydrolyzable amino acids (a representative proteinaceous material) in the PN pool in the North Pacific subtropical gyre increased from the surface to the mesopelagic depth, while the δ15N of other-N fractions (e.g., amino sugars) did not change vertically, suggesting that the latter is substantially less affected by heterotrophic alternation. Therefore, the smaller Δ(degr) at K2 compared to S1 may suggest that its PN pool contains more “other N” compounds that are degraded without 15N fractionation. This hypothesis should be tested in the future, based on the amino acid composition and their δ15N analyses.
The steady-state assumption we used for the mesopelagic PN pool requires that the PN supply and degradative removal are approximately balanced, but there are no data directly justifying this assumption. However, Uchimiya et al. (2018) found that POC supply to the 200–500 m water column of K2 and S1 (equivalent to F(frag) in this study) generally exceeded or equaled the heterotrophic prokaryotic carbon demand in the column. This is partially consistent with our assumption. Our analysis also assumed that all suspended particles collected using Niskin bottles were intrinsically non-sinking (i.e., not collected by DST), which could limit the PN removal from the pool in each mesopelagic layer, another factor requiring large degradation fluxes. Although there have been recent studies on slow-sinking particles using new instruments, such as Marine Snow Catchers (i.e., a large volume water sampler, Riley et al., 2012), it is still challenging to determine whether these particles (presumably defined as suspended particles in this study) actually sink in dynamic seawater rather than in static water conditions. For sinking particles at 100–200 m in K2 and S1, Sukigara et al. (2019) conducted elutriation experiments on these samples and determined the average sinking velocity of these POCs to be 31 ± 17 and 64 ± 30 m d–1, respectively. If all suspended particles sink at 1–2 m d–1 (only approximately 1/30th of the velocity of the sinking particles, but they would inevitably be collected in the sediment trap), their sinking PN flux at 200 m would be 0.14–0.28 mmol m−2 d−1 at K2 and 0.07–0.14 mmol m−2 d−1 at S1, which is equivalent to 31%–62% and 18%–36% of the F(SINK), respectively. However, this is inconsistent with the observation of significantly different distributions between δ15N(SUS) and δ15N(SINK) (Figure 2), at least at K2, where a larger contribution from suspended particles is expected. Of course, it is possible that only some of the suspended particles sank and were trapped, but if so, this would imply only a small contribution to the downward PN transport between the mesopelagic layers. In other words, we believe that the sinking velocity of the suspended particles equal to 0 is not that far off.
4.3 Implications of the particle export by the ML pump for oceanic carbon sequestration
The F(mix) contributed approximately 20% to the total PN export from the PP layer of both K2 and S1. Such a downward transport of the surface suspended particles, which probably occurred frequently and episodically during the winter–spring transition, would have been overlooked in previous observations, which focused on the collection of sinking particles. Lacour et al. (2019) stressed that the ML pump supplies fresh organic matter to the mesopelagic ecosystem with overwintering zooplankton before the spring bloom period, and it could influence the forthcoming spring phytoplankton bloom. Meanwhile, as mentioned previously, most of the PN supplied to the SDM layer may be degraded within this layer because only a small amount was removed downward by F(diff). This suggests that POC transport by F(mix) would not directly contribute to deep-sea carbon sequestration (Giering et al., 2016; Kheireddine et al., 2020). Sukigara et al. (in prep.) used the BGC-Argo float bbp data obtained in the subtropical region, south of the Kuroshio Extension, to estimate POC fluxes from the euphotic layer to the subsurface layer by physical processes (convective deep mixing beyond 300 m as well as vertical circulation at the edge of the cyclonic eddy) from January to April 2018, but concluded that most of them were quickly decomposed at depths shallower than 300 m. This observation strongly supports our PN dynamics concept and flux calculations. Eventually, determining the efficiency of the downward POC transport of gravitationally sinking particles rather than suspended particles would be essential for evaluating the magnitude of the biological pump in the open ocean, even if suspended particles can sink very slowly.
Honda et al. (2016) found greater attenuation in the sinking POC flux at 60–200 m at S1 than at K2. Honda (2020) also evaluated the flux attenuation in the water column at both stations up to 5000 m depth by adding bathypelagic MST data to the upper layer DST data, and found that it was still greater for S1, inferring that this was due to the higher water temperatures and oxygen concentrations in the twilight zone at S1, which positively affected microbial POC degradation. However, Sukigara et al. (2019) concluded that it was ultimately attributable to the enhanced physical fragmentation of sinking particle aggregates, at least above 200 m, due to active turbulence in the upper layer during the mixing phase, when primary production and POC export were high in oligotrophic S1. As in the present study, their argument was based, in part, on the vertical constancy of δ15N(SINK), suggesting that heterotrophic degradation with 15N fractionation contributes little to the loss of PN(SINK). Specifically, at S1 in winter, such turbulent mixing enhances F(frag), while at the same time, the mixing dynamics involving deeper and fluctuating MLDs generates F(mix), both of which provide much fresh organic matter to the upper mesopelagic ecosystem. The annual F(frag):F(mix) supply ratio at S1 was 50:50, and interestingly, the ratio was almost the same (52:48) at K2, a very different environment. No reasonable explanation could be provided for this agreement. The shallower depth of the SDM layer at K2 (100–150 m) than at S1 (150–200 m) would also need to be considered. The determination of this F(frag):F(mix) ratio may, in fact, be important for assessing carbon sequestration to depths in the future as the F(mix) measurements by the BGC Argo floats (which have been increasingly deployed in recent years) continue to accumulate. This is because from the two, we can estimate the upper-layer attenuation of the POC sinking flux, which corresponds to F(frag), and consequently, the efficiency of the BGP. Further validation of the agreement between K2 and S1 for the F(frag):F(mix) ratio we derived is needed, but if it does not vary much within and between regions, it will simplify the estimates of the POC export efficiency to the deep ocean and greatly help in elucidating the factors causing its spatial variation.
5 Conclusion
The annual mean mesopelagic PN dynamics, including steady-state PN pools at the subarctic K2 and the subtropical S1, were depicted using seasonal PN-δ15N data for suspended and sinking particles. Although F(mix) associated with the upper layer mixing dynamics was 1.6 times larger in K2 than in S1, the contribution to total PN export from the surface productive layer was approximately 20% in both sites. In addition to ML pump, the fragmentation of sinking particle aggregates also supplied PN to the upper mesopelagic layer, as a source of energy to the mesopelagic ecosystem, with F(frag) and F(mix) contributions at both sites being comparable. These estimated supply ratios require further validation; however, the combination of these and the separate observations of the ML pump-driven POC export will allow estimating the upper layer attenuation of the POC sinking flux, which will further our understanding of carbon sequestration in the open ocean.
Data availability statement
The raw data supporting the conclusions of this article will be made available by the authors, without undue reservation.
Author contributions
YM conceived the study, analyzed the data, and wrote the manuscript. CS measured δ15N of particle samples. HK and MH conducted the DST deployments during seasonal cruises. MW conducted chemical analysis of water samples. MH is the PI of the K2S1 project with hydrographic observations. All authors contributed to the article and approved the submitted version.
Funding
This work was supported by the JAMSTEC K2S1 project and the KAKENHI–OMIX (Grant-in-Aid for Scientific Research, JP15H05822).
Acknowledgments
The authors are grateful to the officers and crew of the R/V Mirai for their support during the cruise and to the participants from Marine Works Japan Ltd. and Global Ocean Development Inc., for their onboard analysis and deck work. They thank Toshiro Saino, the initiator of the JAMSTEC K2S1 project, for his excellent leadership. They appreciate the reviewers’ constructive and insightful comments.
Conflict of interest
The authors declare that the research was conducted in the absence of any commercial or financial relationships that could be construed as a potential conflict of interest.
Publisher’s note
All claims expressed in this article are solely those of the authors and do not necessarily represent those of their affiliated organizations, or those of the publisher, the editors, and the reviewers. Any product that may be evaluated in this article, or claim that may be made by its manufacturer, is not guaranteed or endorsed by the publisher.
Supplementary material
The Supplementary Material for this article can be found online at: https://www.frontiersin.org/articles/10.3389/feart.2023.1176889/full#supplementary-material
References
Aguíñiga, S., Sánchez, A., and Silverberg, N. (2010). Temporal variations of C, N, δ13C and δ15N in organic matter collected by a sediment trap in Cuenca Alfonso, Bahía de La Paz, SW Gulf of California. Cont. Shelf Res. 30, 1692–1700. doi:10.1016/j.csr.2010.07.005
Alldredge, A. L., Cole, J. J., and Caron, D. A. (1986). Production of heterotrophic bacteria inhabiting macroscopic organic aggregates (marine snow) from surface waters. Limnol. Oceanogr. 31, 68–78. doi:10.4319/lo.1986.31.1.0068
Alldredge, A. L. (2000). Interstitial dissolved organic carbon (DOC) concentrations within sinking marine aggregates and their potential contribution to carbon flux. Limnol. Oceanogr. 45, 1245–1253. doi:10.4319/lo.2000.45.6.1245
Altabet, M. A. (1989). A time-series study of the vertical structure of nitrogen and particle dynamics in the Sargasso Sea. Limnol. Oceanogr. 24, 1185–1201. doi:10.4319/lo.1989.34.7.1185
Altabet, M. A., Deuser, W. G., Honjo, S., and Stienen, C. (1991). Seasonal and depth-related changes in the source of sinking particles in the North Atlantic. Nature 354, 136–139. doi:10.1038/354136a0
Altabet, M. A. (1988). Variations in nitrogen isotopic composition between sinking and suspended particles: implications for nitrogen cycling and particle transformation in the open ocean. Deep Sea Res. A 35, 535–554. doi:10.1016/0198-0149(88)90130-6
Andreev, A., Kusakabe, M., Honda, M., Murata, A., and Saito, C. (2002). Vertical fluxes of nutrients and carbon through the halocline in the western subarctic gyre calculated by mass balance. Deep-Sea Res. II 49, 5577–5593. doi:10.1016/S0967-0645(02)00200-X
Antia, A. N. (2005). Solubilization of particles in sediment traps: revising the stoichiometry of mixed layer export. Biogeosciences 2, 189–204. doi:10.5194/bg-2-189-2005
Bada, J. L., Schoeninger, M. J., and Schimmelmann, A. (1989). Isotopic fractionation during peptide bond hydrolysis. Geochim. Cosmochim. Acta 53, 3337–3341. doi:10.1016/0016-7037(89)90114-2
Banse, K. (1995). Zooplankton: pivotal role in the control of ocean production. ICES J. Mar. Sci. 52, 265–277. doi:10.1016/1054-3139(95)80043-3
Berelson, W. M. (2001). The flux of particulate organic carbon into the ocean interior: A comparison of four U.S. JGOFS regional studies. Oceanography 14 (4), 59–67. doi:10.5670/oceanog.2001.07
Biddanda, B. A., and Pomeroy, L. R. (1988). Microbial aggregation and degradation of phytoplankton-derived detritus in seawater. I. Microbial succession. Mar. Ecol. Prog. Ser. 42, 79–88. doi:10.3354/meps042079
Boyd, P. W., Claustre, H., Levy, M., Siegel, D. A., and Weber, T. (2019). Multi-faceted particle pumps drive carbon sequestration in the ocean. Nature 568, 327–335. doi:10.1038/s41586-019-1098-2
Briggs, N., Dall’Olmo, G., and Claustre, H. (2020). Major role of particle fragmentation in regulating biological sequestration of CO2 by the oceans. Science 367, 791–793. doi:10.1126/science.aay1790
Buesseler, K. O., Antia, A. N., Chen, M., Fowler, S. W., Gardner, W. D., Gustafsson, O., et al. (2007a). An assessment of the use of sediment traps for estimating upper ocean particle fluxes. J. Mar. Res. 65, 345–416. doi:10.1357/002224007781567621
Buesseler, K. O., and Boyd, P. W. (2009). Shedding light on processes that control particle export and flux attenuation in the twilight zone of the open ocean. Limnol. Oceanogr. 54, 1210–1232. doi:10.4319/lo.2009.54.4.1210
Buesseler, K. O., Lamborg, C. H., Boyd, P. W., Lam, P. J., Trull, T. W., Bidigare, R., et al. (2007b). Revisiting carbon flux through the ocean’s twilight zone. Science 316, 567–570. doi:10.1126/science.1137959
Burd, A. B., Hansell, D. A., Steinberg, D. K., Anderson, T. R., Arístegui, J., Baltar, F., et al. (2010). Assessing the apparent imbalance between geochemical and biochemical indicators of meso- and bathypelagic biological activity: what the @$♯! Is wrong with present calculations of carbon budgets? Deep Sea Res. II 57, 1557–1571. doi:10.1016/j.dsr2.2010.02.022
Cho, B., and Azam, F. (1988). Major role of bacteria in biogeochemical fluxes in the ocean's interior. Nature 332, 441–443. doi:10.1038/332441a0
Claustre, H., Johnson, K. S., and Takeshita, Y. (2020). Observing the Global Ocean with biogeochemical-argo. Ann. Rev. Mar. Sci. 12, 23–48. doi:10.1146/annurev-marine-010419-010956
Clements, D. J., Yang, S., Weber, T., McDonnell, A. M. P., Kiko, R., Stemmann, L., et al. (2022). Constraining the particle size distribution of large marine particles in the global ocean with in situ optical observations and supervised learning. Glob. Biogeochem. Cycles 36, e2021GB007276. doi:10.1029/2021GB007276
Dall’Olmo, G., Dingle, J., Polimene, L., Brewin, R. J. W., and Claustre, H. (2016). Substantial energy input to the mesopelagic ecosystem from the seasonal mixed-layer pump. Nat. Geosci. 9, 820–823. doi:10.1038/ngeo2818
Dilling, L., and Alldredge, A. L. (2000). Fragmentation of marine snow by swimming macrozooplankton: A new process impacting carbon cycling in the sea. Deep-Sea Res. I 47, 1227–1245. doi:10.1016/S0967-0637(99)00105-3
Fujiki, T., Inoue, R., Matsumoto, K., Honda, M. C., Wakita, M., Mino, Y., et al. (2020). Time-series observations of photosynthetic oxygen production in the subtropical western North Pacific by an underwater profiling buoy system. Limnol. Oceanogr. 65, 1072–1084. doi:10.1002/lno.11372
Fujiki, T., Sasaoka, K., Matsumoto, K., Wakita, M., and Mino, Y. (2016). Seasonal variability of phytoplankton community structure in the subtropical western North Pacific. J. Oceanogr. 72, 343–358. doi:10.1007/s10872-015-0346-9
Giering, S. L. C., Sanders, R., Martin, A. P., Lindemann, C., Möller, K. O., Daniels, C. J., et al. (2016). High export via small particles before the onset of the North Atlantic spring bloom. J. Geophys. Res. Oceans 121, 6929–6945. doi:10.1002/2016JC012048
Goldthwait, S., Yen, J., Brown, J., and Alldredge, A. (2004). Quantification of marine snow fragmentation by swimming euphausiids. Limnol. Oceanogr. 49, 940–952. doi:10.4319/lo.2004.49.4.0940
Honda, M. C. (2020). Effective vertical transport of particulate organic carbon in the western North Pacific subarctic region. Front. Earth Sci. 8, 366. doi:10.3389/feart.2020.00366
Honda, M. C., Kawakami, H., Matsumoto, K., Wakita, M., Fujiki, T., Mino, Y., et al. (2016). Comparison of sinking particles in the upper 200 m between subarctic station K2 and subtropical station S1 based on drifting sediment trap experiments. J. Oceanogr. 72, 373–386. doi:10.1007/s10872-015-0280-x
Honda, M. C., Wakita, M., Matsumoto, K., Fujiki, T., Siswanto, E., Sasaoka, K., et al. (2017). Comparison of carbon cycle between the western pacific subarctic and subtropical time-series stations: highlights of the K2S1 project. J. Oceanogr. 73, 647–667. doi:10.1007/s10872-017-0423-3
Inoue, R., and Kouketsu, S. (2016). Physical oceanographic conditions around the S1 mooring site. J. Oceanogr. 72, 453–464. doi:10.1007/s10872-015-0342-0
Jackson, G. A. (1995). Comparing observed changes in particle size spectra with those predicted using coagulation theory. Deep-Sea Res. II 42, 159–184. doi:10.1016/0967-0645(95)00010-N
Karl, D. M., Knauer, G. A., and Martin, J. H. (1988). Downward flux of particulate organic matter in the ocean: A particle decomposition paradox. Nature 332, 438–441. doi:10.1038/332438a0
Kheireddine, M., Dall'Olmo, G., Ouhssain, M., Krokos, G., Claustre, H., Schmechtig, C., et al. (2020). Organic carbon export and loss rates in the Red Sea. Glob. Biogeochem. Cycles 34, e2020GB006650. doi:10.1029/2020GB006650
Lacour, L., Briggs, N., Claustre, H., Ardyna, M., and Dall'Olmo, G. (2019). The intraseasonal dynamics of the mixed layer pump in the subpolar North Atlantic ocean: A biogeochemical-argo float approach. Glob. Biogeochem. Cycles 33, 266–281. doi:10.1029/2018GB005997
Lampitt, R. S., Noji, T., and von Bodungen, B. (1990). What happens to zooplankton fecal pellets? Implications for material flux. Mar. Biol. 104, 15–23. doi:10.1007/BF01313152
Ledwell, J. R., Watson, A. J., and Law, C. S. (1993). Evidence for slow mixing across the pycnocline from an open-ocean tracer-release experiment. Nature 364, 701–703. doi:10.1038/364701a0
Macko, S. A., and Estep, M. L. F. (1984). Microbial alteration of stable nitrogen and carbon isotopic compositions of organic matter. Org. Geochem. 6, 787–790. doi:10.1016/0146-6380(84)90100-1
Martin, J. H., Knauer, G. G., Karl, D. M., and Broenkow, W. W. (1987). Vertex: carbon cycling in the northeast pacific. Deep-Sea Res. A 34, 267–285. doi:10.1016/0198-0149(87)90086-0
Matsumoto, K., Abe, O., Fujiki, T., Sukigara, C., and Mino, Y. (2016). Primary productivity at the time-series stations in the northwestern pacific ocean: is the subtropical station unproductive? J. Oceanogr. 72, 359–371. doi:10.1007/s10872-016-0354-4
Mino, Y., Sukigara, C., Honda, M. C., Kawakami, H., Wakita, M., Sasaoka, K., et al. (2020). Seasonal and interannual variations in nitrogen availability and particle export in the northwestern North Pacific subtropical gyre. J. Geophys. Res. Oceans 125, e2019JC015600. doi:10.1029/2019JC015600
Mino, Y., Sukigara, C., Kawakami, H., Honda, M. C., Matsumoto, K., Wakita, M., et al. (2016). Seasonal variations in the nitrogen isotopic composition of settling particles at station K2 in the western subarctic North Pacific. J. Oceanogr. 72, 819–836. doi:10.1007/s10872-016-0381-1
Miyake, Y., and Wada, E. (1971). The isotope effect on the nitrogen in biochemical, oxidation–reduction reactions. Rec. Oceanogr. Works Jpn. 11, 1–6.
Mobius, J. (2013). Isotope fractionation during nitrogen remineralization (ammonification): implications for nitrogen isotope biogeochemistry. Geochim. Cosmochim. Acta 105, 422–432. doi:10.1016/j.gca.2012.11.048
Nakatsuka, T., Handa, N., Harada, N., Sugimoto, T., and Imaizumi, S. (1997). Origin and decomposition of sinking particulate organic matter in the deep water column inferred from the vertical distributions of its δ15N, δ13C and δ14C. Deep-Sea Res. I 44, 1957–1979. doi:10.1016/S0967-0637(97)00051-4
Ploug, H., and Grossart, H.-P. (1999). Bacterial production and respiration in suspended aggregates - a matter of the incubation method. Aquat. Microb. Ecol. 20, 21–29. doi:10.3354/ame020021
Ploug, H. (2001). Small-scale oxygen fluxes and remineralization in sinking aggregates. Limnol. Oceanogr. 46, 1624–1631. doi:10.4319/lo.2001.46.7.1624
Pomeroy, L. R., and Deibel, D. (1980). Aggregation of organic matter by pelagic tunicates. Limnol. Oceanogr. 25, 643–652. doi:10.4319/lo.1980.25.4.0643
Riley, J. S., Sanders, R., Marsay, C., Le Moigne, F. A. C., Achterberg, E. P., and Poulton, A. J. (2012). The relative contribution of fast and slow sinking particles to ocean carbon export. Glob. Biogeochem. Cycles 26, GB1026. doi:10.1029/2011GB004085
Robinson, D. (2001). δ15N as an integrator of the nitrogen cycle. Trends Ecol. Evol. 16, 153–162. doi:10.1016/S0169-5347(00)02098-X
Ruiz, J. (1997). What generates daily cycles of marine snow? Deep-Sea Res. I 44, 1105–1126. doi:10.1016/S0967-0637(97)00012-5
Saino, T., and Hattori, A. (1980). 15N natural abundance in oceanic suspended particulate matter. Nature 283, 752–754. doi:10.1038/283752a0
Saino, T., and Hattori, A. (1987). Geographical variation of the water column distribution of suspended particulate organic nitrogen and its 15N natural abundance in the Pacific and its marginal seas. Deep-Sea Res. 34, 807–827. doi:10.1016/0198-0149(87)90038-0
Silfer, J. A., Engel, M. H., and Macko, S. A. (1992). Kinetic fractionation of stable carbon and nitrogen isotopes during peptide bond hydrolysis: experimental evidence and geochemical implications. Chem. Geol. 101, 211–221. doi:10.1016/0009-2541(92)90003-N
Steinberg, D. K., Silver, M. W., and Pilskaln, C. H. (1997). Role of mesopelagic zooplankton in the community metabolism of giant larvacean house detritus in Monterey Bay, California, USA. Mar. Ecol. Prog. Ser. 147, 167–179. doi:10.3354/meps147167
Sukigara, C., Mino, Y., Kawakami, H., Honda, M. C., Fujiki, T., Matsumoto, K., et al. (2019). Sinking dynamics of particulate matter in the subarctic and subtropical regions of the western North Pacific. Deep-Sea Res. I 144, 17–27. doi:10.1016/j.dsr.2018.11.004
Sukigara, C., Suga, T., Saino, T., Toyama, K., Yanagimoto, D., Hanawa, K., et al. (2011). Biogeochemical evidence of large diapycnal diffusivity associated with the subtropical mode water of the North Pacific. J. Oceanogr. 67, 77–85. doi:10.1007/s10872-011-0008-5
Uchimiya, M., Fukuda, H., Wakita, M., Kitamura, M., Kawakami, H., Honda, M. C., et al. (2018). Balancing organic carbon supply and consumption in the ocean’s interior: evidence from repeated biogeochemical observations conducted in the subarctic and subtropical western North Pacific. Limnol. Oceanogr. 63, 2015–2027. doi:10.1002/lno.10821
Urban-Rich, J. (1999). Release of dissolved organic carbon from copepod fecal pellets in the Greenland Sea. J. Environ. Mar. Biol. Ecol. 232, 107–124. doi:10.1016/S0022-0981(98)00104-X
Wakeham, S., Farrington, J., Gagosian, R., Lee, C., DeBaar, H., Nigrelli, G. E., et al. (1980). Organic matter fluxes from sediment traps in the equatorial Atlantic Ocean. Nature 286, 798–800. doi:10.1038/286798a0
Wakeham, S. G., Lee, C., Farrington, J. W., and Gagosian, R. B. (1984). Biogeochemistry of particulate organic matter in the oceans: results from sediment trap experiments. Deep-Sea Res. A 31, 509–528. doi:10.1016/0198-0149(84)90099-2
Wakita, M., Honda, M. C., Matsumoto, K., Fujiki, T., Kawakami, H., Yasunaka, S., et al. (2016). Biological organic carbon export estimated from the annual carbon budget observed in the surface waters of the western subarctic and subtropical North Pacific Ocean from 2004 to 2013. J. Oceanogr. 72, 665–685. doi:10.1007/s10872-016-0379-8
Yamaguchi, Y. T., and McCarthy, M. D. (2018). Sources and transformation of dissolved and particulate organic nitrogen in the North Pacific Subtropical Gyre indicated by compound-specific δ15N analysis of amino acids. Geochim. Cosmochim. Acta. 220, 329–347. doi:10.1016/j.gca.2017.07.036
Yoshikawa, C., Ogawa, N. O., Chikaraishi, Y., Makabe, A., Matsui, Y., Sasai, Y., et al. (2022). Nitrogen isotopes of sinking particles reveal the seasonal transition of the nitrogen source for phytoplankton. Geophys. Res. Lett. 49, e2022GL098670. doi:10.1029/2022GL098670
Appendix
On an annual scale, the steady state of the PN(SUS) pool in the mesopelagic zone was assumed, and thus the following holds,
Each PN(SUS) pool has two input and two output fluxes (see Figure 3).
For pool-1 (i.e., the pool in the SDM layer),
For pool-t (t ≥2),
The PN-δ15N of total input and output flux, δ15N(IN) and δ15N(OUT), respectively, are calculated by the 15N mass balance after each flux and its δ15N are determined.
The PN fluxes and their δ15N values are described/calculated as follows:
A. Mixing flux, F(mix)1:
The F(mix)1 is calculated last after other fluxes, and their PN-δ15N are determined. Because this process transports surface particles into the SDM layer without δ15N alteration, the following holds,
It should be noted that δ15N(SUS)pp should represent the suspended particles during the season of deep convective mixing.
B. Diffusive flux, F(diff)t:
where vertical diffusivity, Kv, is 3.5×10⁻⁵ m2 s−1 at 150 and 200 m of K2 (Andreev et al. 2002) and 2.0×10⁻⁴ m2 s−1 at 200 m of S1 (Sukigara et al. 2011). The F(diff)t is also without δ15N alteration, then
C. Fragmentation flux, F(frag)t:
We assume that all vertical attenuation in the PN sinking flux is due to the particle fragmentation, which supplies PN to the suspended pool. Therefore, δ15N(frag) is calculated by the 15N mass balance as follows,
It should be noted that δ15N(SINK) is assumed to be vertically constant at depths shallower than 200 m (see text).
D. Degradation flux, F(degr)t:
Here, the δ15N increase in PN remaining in the suspended pool relative to the total PN supplied, Δ(degr)t, is associated with heterotrophic degradation with an 15N fractionation, which is assumed to be vertically uniform at each station:
where it is calculated to be 2.6‰ at K2 (t = 2, 3) and 3.4‰ at S1 (t = 2).
Using the Δ(degr), PN-δ15N of the total input flux into the SDM layer, δ15N(IN)1, at each site is calculated as follows and is also described as a weighted average of PN-δ15N of the two input fluxes:
By solving Eq. A15 using the Δ(degr) of 2.6‰ or 3.4‰ (see Eq. A13) and other observation-based values, F(mix)1 at each site can be estimated.
Keywords: mesopelagic particle dynamics, mixed-layer pump, particle fragmentation, suspended and sinking particles, stable nitrogen isotopes, biological carbon pump, western North Pacific, K2S1 project
Citation: Mino Y, Sukigara C, Kawakami H, Wakita M and Honda MC (2023) Mesopelagic particulate nitrogen dynamics in the subarctic and subtropical regions of the western North Pacific. Front. Earth Sci. 11:1176889. doi: 10.3389/feart.2023.1176889
Received: 01 March 2023; Accepted: 04 September 2023;
Published: 21 September 2023.
Edited by:
Alexandra Gogou, Hellenic Centre for Marine Research (HCMR), GreeceReviewed by:
Travis Blake Meador, Academy of Sciences of the Czech Republic (ASCR), CzechiaAlberto Sánchez-González, National Polytechnic Institute (IPN), Mexico
Copyright © 2023 Mino, Sukigara, Kawakami, Wakita and Honda. This is an open-access article distributed under the terms of the Creative Commons Attribution License (CC BY). The use, distribution or reproduction in other forums is permitted, provided the original author(s) and the copyright owner(s) are credited and that the original publication in this journal is cited, in accordance with accepted academic practice. No use, distribution or reproduction is permitted which does not comply with these terms.
*Correspondence: Yoshihisa Mino, a3Vyb0BoeWFyYy5uYWdveWEtdS5hYy5qcA==