 Yuan-Hsi Lee1*
 Kristen L. Cook2,3†
 Xi-Bin Tan4,5
 Mei-Fei Chu2Han-Yi Chiu2
 Qui-Li Li6
 J. Gregory Shellnutt7
 Xi-Wei Xu4
- 1Department of Earth and Environmental Sciences, National Chung-Cheng University, Minxiong, Taiwan
- 2Department of Geosciences, National Taiwan University, Taipei, Taiwan
- 3German Research Center for Geosciences, GFZ Potsdam, Potsdam, Germany
- 4Institute of Geology, China Earthquake Administration, Beijing, China
- 5State Key Laboratory of Earthquake Dynamics, Institute of Geology, China Earthquake Administration, Beijing, China
- 6Institute of Geology and Geophysics, Chinese Academy of Sciences, Beijing, China
- 7Department of Earth Sciences, National Taiwan Normal University, Taipei, Taiwan
The eastern margin of the Tibetan Plateau has given rise to much debate about mechanisms of plateau uplift and evolution and, in particular, the role of the lower crust in crustal thickening. Knowledge of the middle to lower crust conditions is critical for evaluating various models of crustal deformation, but data on crustal evolution through time are lacking. Here, we turn to the Gongga Shan granite, an intrusion along the Xianshuihe fault in easternmost Tibet that directly records local Cenozoic crustal conditions. We present 124 U-Pb samples from the Gongga Shan granite (GSG) that prove that the crust has been stepwise producing partial melt from 56 Ma to 4 Ma. According to the age distribution, the GSG can be separated into four major groups with ages of 4–10 Ma, 12–20 Ma, 25–40 Ma, and 43–56 Ma. Combining the timing information with geophysics and low-temperature thermochronology data, we suggest that events younger than 10 Ma may indicate the onset of recent crustal channel flow in the middle to lower crust. In contrast, the youngest 4 Ma ages indicate the ongoing partial melting of the middle crust. The 12–20 Ma events could be related to an earlier stage of crustal channel flow, consistent with the regional large-scale crustal channel flow in central Tibet.
1 Introduction
The Tibetan plateau results from the collision between the India Plate and Eurasia Plate since ca. 55 Ma (de Sigoyer et al., 2000; Garzanti, 2008) and associated crustal thickening, surface uplift, and magmatism. Cenozoic magmatism on the Tibetan plateau shows systematic variations in space and time that are related to Tibetan tectonic evolution (Zhang H. F. et al., 2004; Zhang P. et al., 2004; Zhang Y. et al., 2004; Chung et al., 2005; King et al., 2011; Wang et al., 2012). The magmatism resulting from deeper crustal partial melting is one of the key pieces of evidence for differentiating tectonic processes from central to eastern Tibet (Figure 1). A controversial issue in eastern Tibet is the extent to which uplift has been driven by shortening along surface-breaking faults (Replumaz and Tapponnier, 2003) or by influx of ductile lower crustal material (Royden et al., 1997), which has significant implications for our understanding of how continents deform. In the Himalaya and southern Tibet, the channel flow mechanism has been widely accepted as an influence on the uplift of the Tibetan Plateau between the late Oligocene to the Miocene time (Beaumont et al., 2001; Godin et al., 2006). In eastern Tibet, a similar mechanism has been used to model the topography of the eastern margin of the Tibetan Plateau since 10-13 Ma (Clark et al., 2005). The crustal flow requires that the middle to lower crust contain material with reduced viscosity, enabling it to flow laterally in response to pressure/topographic gradients. Even small amounts of partial melt can significantly reduce the strength of continental crust (Rosenberg and Handy, 2005), so the occurrence of crustal melting helps to determine the viability of crustal flow. While geophysical techniques can be used to probe the nature of the crust, such data are indirect and are rarely unequivocal, engendering debate about their interpretation and implications. In addition, geophysical techniques only observe the current state of the crust, providing no information about the temporal evolution of the middle/lower crust. In the products of such melting—leucocratic granite intrusions can provide direct evidence of crustal melting through time.
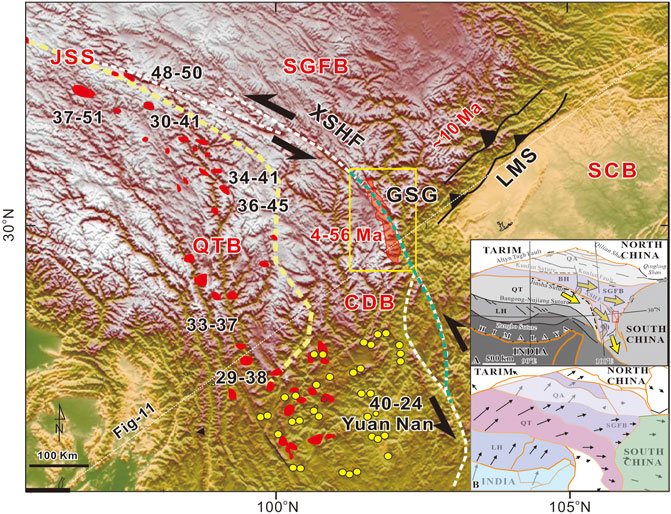
FIGURE 1. Distribution of Cenozoic magmatic events in eastern Tibet. The numbers indicate ages in Ma (data are from Chung et al., 2005; Guo et al., 2005; Spurlin et al., 2005). The solid yellow circles show the 40–24 Ma potassic lamprophyres in southeastern Tibet (Guo et al., 2005). The green dashed line indicates the location of a lithosphere discontinuity (Wang et al., 2010). The inset maps show two different tectonic models. In inert A, the yellow arrows showing the crustal flow directions suggested by geophysical data (Bai et al., 2010; Liu et al., 2014). Rapid exhumation and river incision started from ca. 10 Ma on the hanging wall of the LMS and eastern Tibet (Clark et al., 2005). Inset B shows the deformation (shortening, extrusion, and extensions) are consumed at the boundary of different tectonic blocks. The arrows show the calculated displacement field during 10-5 Ma (Replumaz and Tapponnier, 2003). LMS: Longmenshan fault; SCB: Sichuan Basin, GSG: Gongga Shan granite; QT: Qiangtang block; CDB: Chuan-Dian diamond block; SGFB: Songpan-Garzê fold belt; XSHF: Xianshuihe fault system (white and green dot line); JSS: Jinsha Suture (yellow dot line). Green dash line shows the lithospheric discontinuity from the GSG to ca. latitude 27º-28° (Lei and Zhao, 2016).
On the eastern margin of the Tibetan Plateau, the Gongga Shan granite (GSG) provides such an archive of information on Cenozoic crustal melting, opening a time window into the possible tectonic process from the subduction of the Tethyan slab to recent crustal deformation in the eastern Tibet (Figure 1).
The magmatism of the GSG has been previously dated from 12 to 32 Ma (Roger et al., 1995; Liu et al., 2006; Li and Zhang, 2013), and recently Searle et al. (2016) reported a 5 Ma U-Pb age from the GSG. However, these studies primarily focused on a single transect in the central section of the GSG and had relatively few samples over a limited area. Field observations throughout the GSG point to multiple phases of intrusion, including localities where a series of different intrusive episodes can be identified from cross-cutting relationships. To better constrain the entire emplacement history and the spatial distribution of granitoid ages, we conducted a detailed sampling campaign throughout the GSG (Figure 2). In addition to bedrock samples, we collected river sand and granite clasts from several catchments where upstream areas are hard to reach to increase the spatial coverage of our sampling. Our data both confirm the presence of previously recognized phases and identify additional granite ages, significantly extending the temporal range of crustal melting and granite emplacement.
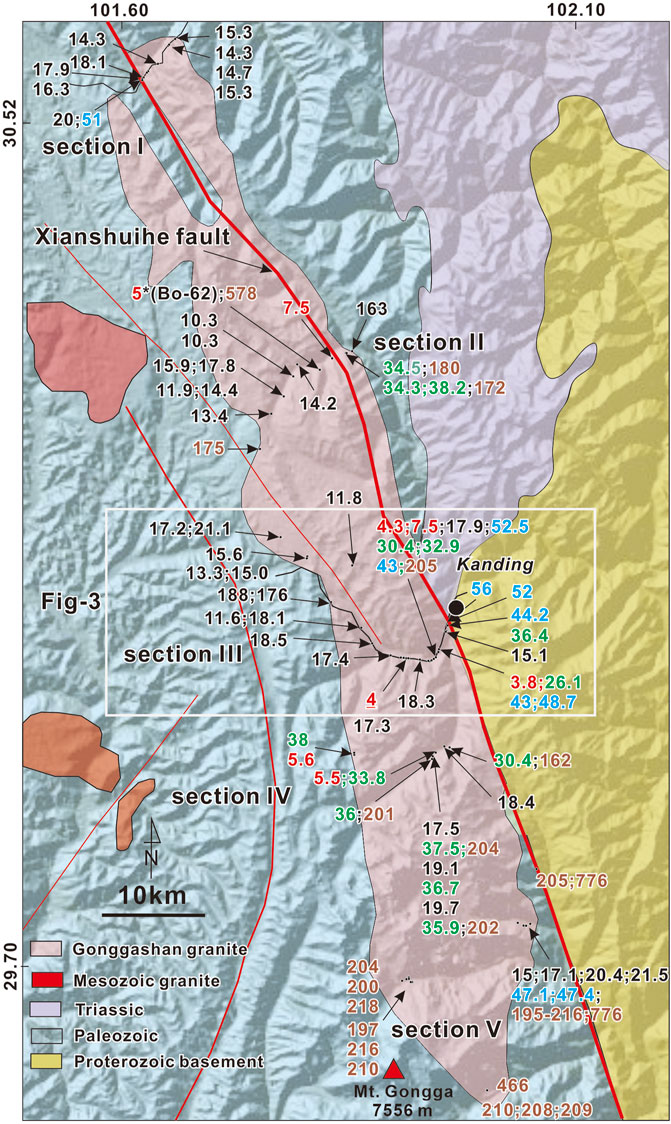
FIGURE 2. Sampling sites and zircon U-Pb ages in the GSG, with ages shown in Ma. The color of the ages indicates different groups of magmatic events. Geological map is modified from Roger et al. (2010). The color of the ages shows four groups of magmatic events (see the text).
2 Geological background
The GSG is located in the Songpan-Garzê fold belt (SGFB), which is separated from the Qiangtang (QT) block in the southwest by the Jinshajiang Suture (JS) (Burchfiel et al., 1995) (Figure 1). The dominant lithology of the SGFB is the Triassic Songpan-Garzê flysch. Still, the region also contains numerous Mesozoic intrusions (ranging in age from 105 to 225 Ma) and Neoproterozoic magmatic basement rocks (759–877 Ma) (Roger et al., 2010).
Most of the Cenozoic magmatism in eastern Tibet occurs west of the XSHF. The volcanic and plutonic rocks indicate magmatism at 51–49 and 38–37 Ma and have been attributed to continental subduction with either south-dipping subduction along the Jinsha suture (Roger et al., 2000) or north-dipping subduction along the Banggong-Nujiang suture (Yin and Harrison, 2000; Kapp et al., 2005; Spurlin, et al., 2005). Potassic volcanism, mainly phlogopite-, clinopyroxene- and olivinephyric calc-alkaline (shoshonitic) lamprophyres, was widely developed in SE Tibet (western Sichuan) during the Paleogene (40–24 Ma), and has been attributed to the presence of the palaeo-subducted slab beneath the SE Tibet and the left-lateral strike-slip motions of the Red River fault and reactivation of pre-existing, trans-lithospheric fault systems, which may have triggered melting and provided conduits for magma ascent (Guo et al., 2005).
The GSG is an elongate granitic body oriented along the left-lateral XSHF (Figure 1) (Wang et al., 1998). The southern end of the granite has extremely high topography, including Gongga Shan, a 7,556 m high peak located at the margin of the granite. The timing of GSG formation has long been considered to be 12–15 Ma and 18 Ma (Roger et al., 1995; Liu et al., 2006), but a recent study (Li and Zhang, 2013) identified an earlier phase of zircon growth at 32–27 Ma and Searle et al. (2016) used SIMS to identify an unusually young granite ca. 5 Ma (Figure 2). According to the geochemistry data the 12–18 Ma magma was mainly of crust origin (Roger et al., 1995; Liu et al., 2006).
3 Methods
3.1 LA-ICPMS
We used an Agilent 7500s quadrupole ICP–MS equipped with a New Wave UP213 laser ablation system (LA-ICPMS) at the Department of Earth and Environmental Sciences of the Chung Cheng University, Taiwan, for zircon U-Pb dating. The analysis process for the LA-ICPMS followed Chiu et al. (2009). A secondary zircon standard GJ-1 was used to check the accuracy of the unknowns. (Jackson et al., 2004). Data deduction and common Pb correction were conducted with GLITTER 4.4.2 (GEMOC) software and ComPbCorr, as proposed by Andersen (2002), respectively. Calculation of weighted mean U–Pb ages, probability density curves, as well as the plotting of concordia plots were carried out using Isoplot v. 3.0 (Ludwig, 2008). The detailed analytical method of the LA-ICPMS lab at Chung-Cheng University can be found in Knittel et al. (2014).
3.2 Secondary ion mass spectrometry (SIMS)
Zircon separates, together with zircon standards Plešovice, Penglai and Qinghu, were mounted in epoxy and polished to expose half of the crystals. All zircons were documented with cathodoluminescence (CL) images to reveal their internal textures. Measurements of U, Th and Pb were conducted using the Cameca IMS-1280 SIMS at the Institute of Geology and Geophysics, Chinese Academy of Sciences (IGG-CAS) in Beijing. The O2− primary ion beam was accelerated at −13 kV, with an intensity of ca. 10 nA. The aperture illumination mode (Kohler illumination) was used to produce an elliptical spot of about 20 x 30 m in size. Mass resolution was set at ∼5,400 (at 10% peak height). A single electron multiplier (EM) was used to measure secondary ion beam intensities by peak jumping sequence. Pb/U calibration was performed relative to the Plešovice standard zircon (Sláma et al., 2008), based on an observed linear relationship between ln (206Pb/238U) and ln (238U16O2/238U) with a slope of 1.3 (Li et al., 2009). U and Th concentration determination of unknowns is calculated against the 91500 standard (Wiedenbeck et al., 1995). Measured compositions were corrected for common Pb using the 207Pb-correction method (Li et al., 2012) with an average present-day crustal composition used for the common Pb (Stacey and Kramers, 1975). Because some samples are quite young, the 206Pb was corrected according to the initial excess or loss of 230Th based on the following equation given by Schärer (1984):
where, λ238 and λ230 are the decay constant of 238U and 230Th, respectively. Th/U of zircon is the value for the measured zircon area during SIMS analysis, Th/U of magma is the ratio for the host magma estimated by the host rock analyses. Uncertainties on individual analyses in data tables are reported at a 1σ level; mean ages for pooled U/Pb analyses are quoted with 95% confidence interval. Statistical reduction and plotting of the data (including calculate ages, uncertainties, weighted means, and the generation of U–Pb concordia plots) were carried out using the Isoplot/Ex v. 2.49 (Ludwig, 2001).
4 Results
4.1 Zircon U–Pb geochronology
We obtained U-Pb ages (LA-ICPMS and SIMS) for 124 separate samples. (Figures 2, 3, and Supplementary Table S2). The detailed analytical results are listed in the Supplementary Material. Most of the zircon grains are euhedral crystals more than 100 µm in length. Some of the zircons show xenocrystic cores. If a zircon had significantly different core and rim structures, we analyzed both the core and rim to identify the youngest event. The CL images show that most zircon grains have oscillatory zoning, suggesting a magmatic origin (Shore and Fowler, 1996) (Figure 4). The GSG granitoids have varying compositions, including syenogranite, alkali feldspar granite, muscovite granite, monzogranite granodiorite. Part of the mineral compositions of the dated samples are shown in Supplementary Table S2.
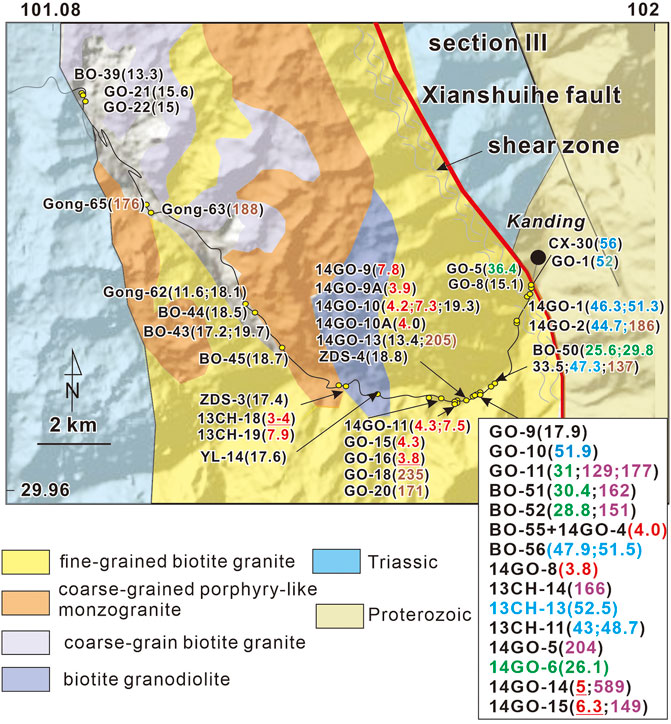
FIGURE 3. Detailed sample locations and zircon U-Pb ages (Ma) for section III. The underlined emplacement ages show the youngest zircon U-Pb age.
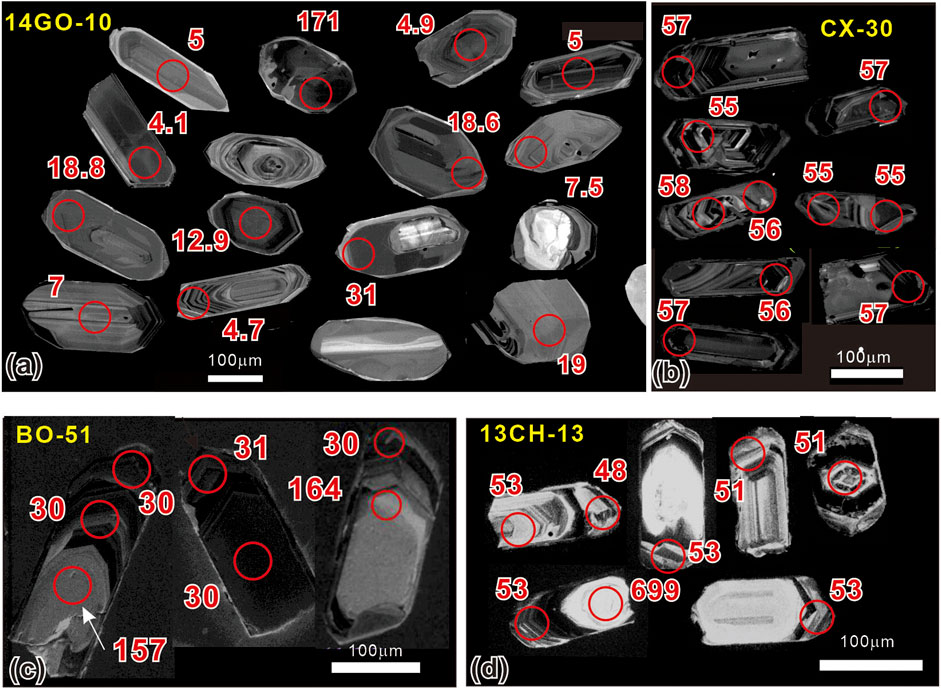
FIGURE 4. (A–D). CL images from samples 14-GO-10, CX-30, BO-51, and 13CH-13. All of these samples show oscillatory zoning, suggesting a magmatic origin. Some grains exhibit a core of inherited zircon but with a Cenozoic rim age.
Cenozoic zircon U-Pb ages range from ca. 56 Ma to 4 Ma inherited Mesozoic to Proterozoic ages in many samples (Figures 2, 3). To gain an overview of magmatic events in the GSG, we plot the U-Pb ages, including inherited and river sand ages. The inherited ages are defined as zircon ages significantly older than other ages from the same sample. The river sand ages indicate that we obtained consistent ages from detrital zircon sampled from different catchments. In the following, we will describe typical outcrop conditions and each section’s zircon U-Pb ages and zircon Th/U ratio.
4.2 Outcrop scale U-Pb results
Figures 5A,B shows the youngest leucogranite outcrops, in which the granodiorite (GO-15) is cut by later-stage granodiorite dike (GO-16) and contains foliated monzogranite Mesozoic xenoliths (GO-18) (Figures 5C, 4I). (location shown in Figure 3) The xenolith (GO-18) is a foliated monzogranite with a concordant age of 235 Ma and many Proterozoic inherited zircons (Figure 5I). We obtained only three Cenozoic zircon grains from GO-16, and two of these grains yielded ages of ca. 3.8 Ma (Figure 5D). Although GO-15 and GO-16 have a cross-cutting relationship, both samples contain ca. 4 Ma zircons (Figures 5G,H). The grain ages of the GO-15 are more complex, showing from Proterozoic to Cenozoic ages (Figures 5E,F). The youngest grain ages are between 4 and 9 Ma, line up concordantly on the concordia map, and can be separated into two mean ages, 4.3 Ma and 7.5 Ma (Figures 5G,H).
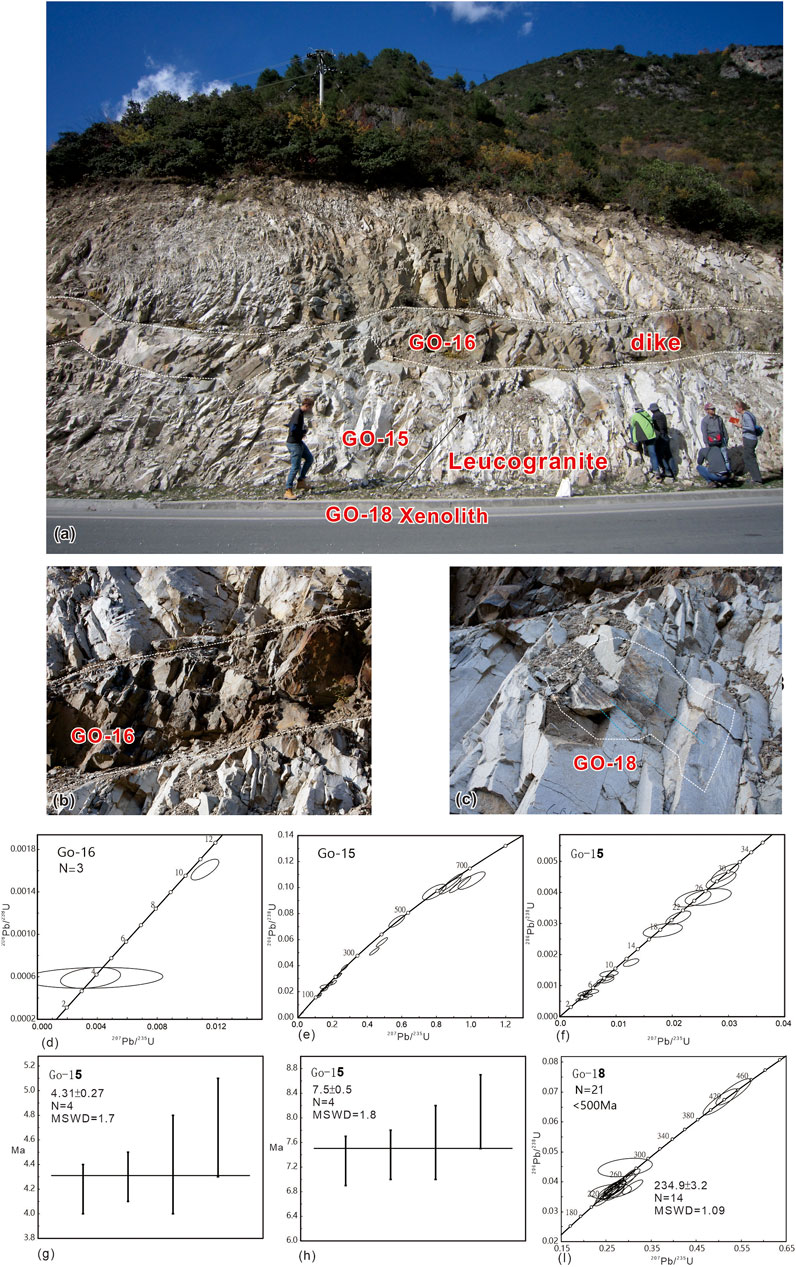
FIGURE 5. (A) Outcrop of the 4 Ma granitoids, with a horizontal mafic dike cutting the leucogranite. (B) close-up of the dike. (C) Mesozoic xenolith with foliation development (blue color). (D) Only three zircon grains have been dated in GO-16; the younger age is ca.3.8 Ma. (E) Concordia map for GO-15 leucogranodiorite, which shows Cenozoic to Proterozoic grain ages. The data-point error ellipses are 2σ in the concordia map. (F) The Cenozoic grain ages of GO-15, from 4–30 Ma, line concordantly in the condcordia map. (G, H) The younger ages of GO-15 can be separated into 4.3 Ma and 7.5 Ma average ages. (I) GO-18 is a Mesozoic xenolith that yields a ca.235 Ma average age.
Figure 6A shows another 4 Ma (BO-55) outcrop in which the youngest pegmatite dike (BO-55) cuts older deformed granitoids (location shown in Figure 3). In addition to 4 Ma grain ages, BO-55 also contains Cenozoic to Mesozoic inherited zircon (Figures 6B,C). Sample BO-52 is a migmatitic leucosome with an age of 29 Ma and many Mesozoic inherited zircons (Figures 6D,E). Sample BO-56 has an age of ca. 51 Ma and is from a foliated biotite monzogranite that cuts a Mesozoic foliated biotite monzogranite (14GO-5) (Figures 6F,G).
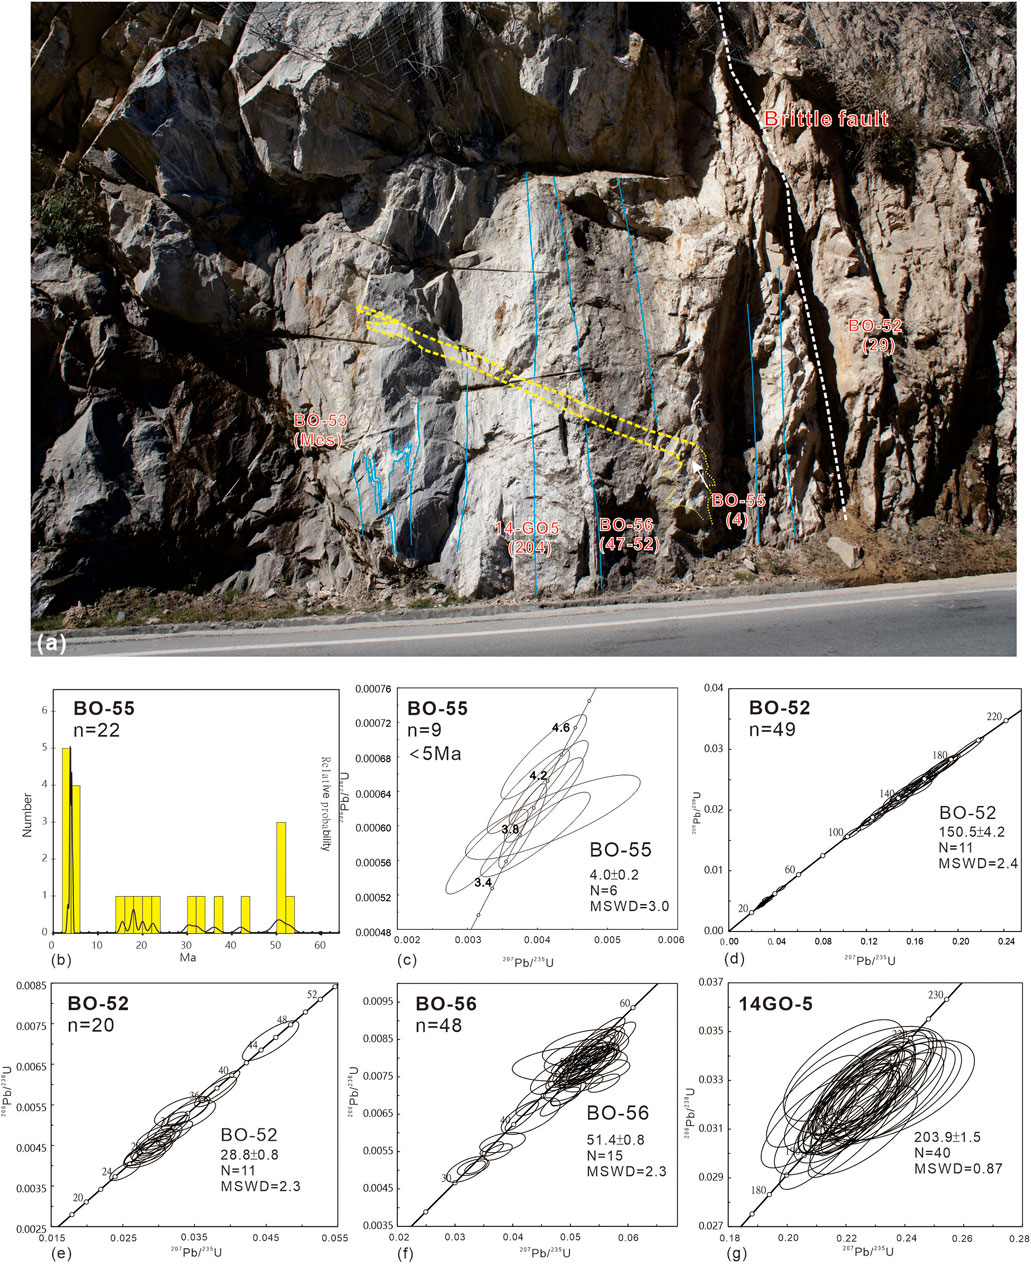
FIGURE 6. (A) Outcrop from Section III, showing a pegmatite dike (yellow) cutting the older granite. The numbers below the sample names indicate the magmatism age. The blue lines are deformed foliation. (B) The age spectrum of sample BO-50. In addition to the 4 Ma zircon it also contains many inherited zircons. (C) The youngest dike age is ca. 4 Ma (BO-55). The data-point error ellipses are 2σ in the concordia maps. (D, E) BO-52 is a 29 Ma migmatitic leucosome with many inherited Mesozoic zircons. (F) BO-56 is foliated biotite monzogranite with an age of 51 Ma. (G) 14GO-5 is a Mesozoic granitoid with an age of 204 Ma.
Samples 14GO-9 and -10 are from two adjacent undeformed granodiorites (location shown in Figure 3). Both samples contain 4 Ma zircons, in addition to inherited zircons of Miocene and Mesozoic to Proterozoic ages (Figure 7). The Cenozoic grain ages can be separated into three groups, ca. 19 Ma, 7.3 Ma, and 4 Ma (Figures 7B–D). The large group of consistent 19 Ma grain ages can be easily distinguished from older and younger groups, indicating an isolated magmatic event (Figure 7C). To confirm the 4 Ma ages, both LA-ICPMS and SIMS analyses were conducted, with consistent results (Figures 7E–G). Although we separate the youngest grain ages into two mean ages, 4 Ma and 7.3 Ma (Figure 7E,G,H), the concordia map shows that all the grain ages from 9–4 Ma line concordantly, indicating the possibility of continuous coherent melting (Figure 7B).
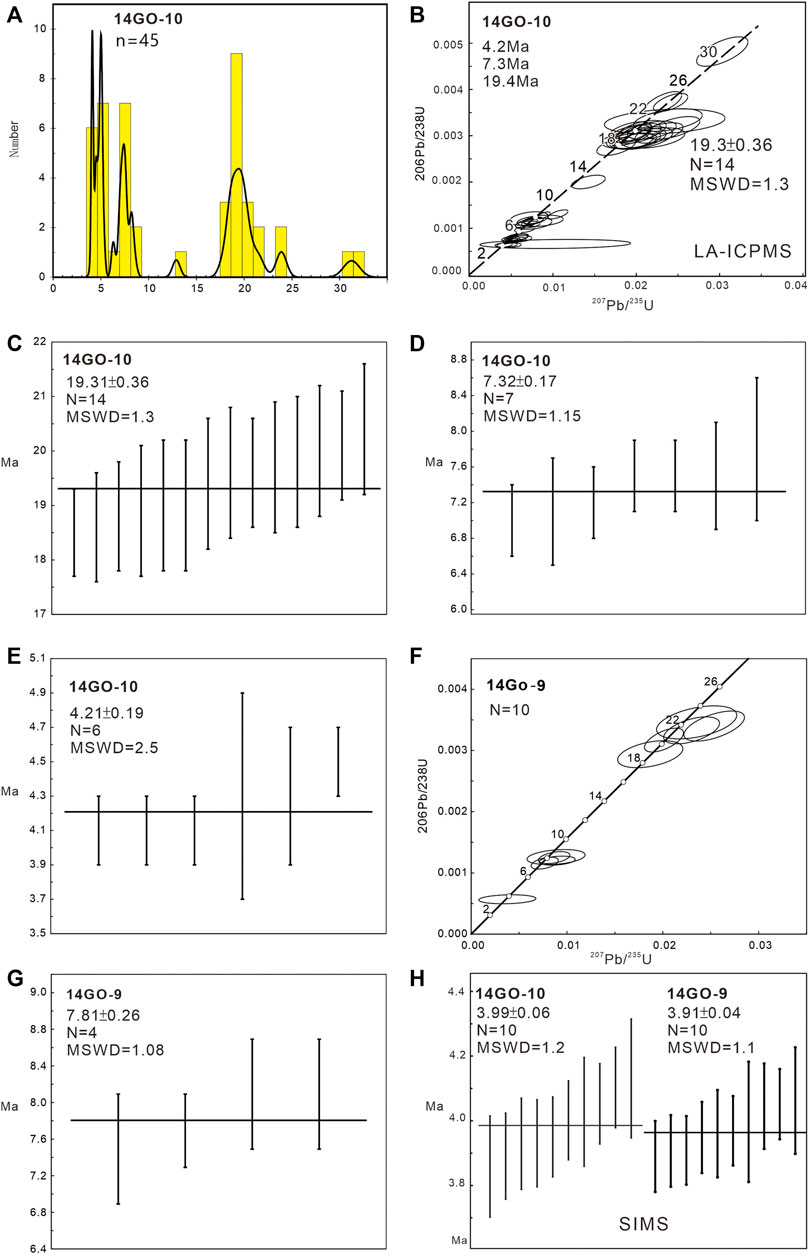
FIGURE 7. (A) Cenozoic age spectrum of sample 14GO-10. (B–E) Concordia map and grain age spectrum of the Cenozoic grain ages in 14GO-10, which can be separated into three main groups. The data-point error ellipses are 2σ in the concordia map. (F, G) Cenozoic concordia map and younger age of the 14GO-9. (H) The two youngest average age is ca. 4 Ma, both in 14GO-10 and 14GO-9, using SIMS analysis.
Figure 8A shows the outcrop of alkali feldspar granite where samples BO-64 and -65 were taken. Both samples contain Cenozoic zircons and inherited Mesozoic zircon grains (Figure 8B). The Cenozoic grain ages range from ca. 30–40 Ma (Figures 8C–E) and line up concordantly in the concordia map, indicating a coherent magmatic event (Figure 8C,D).
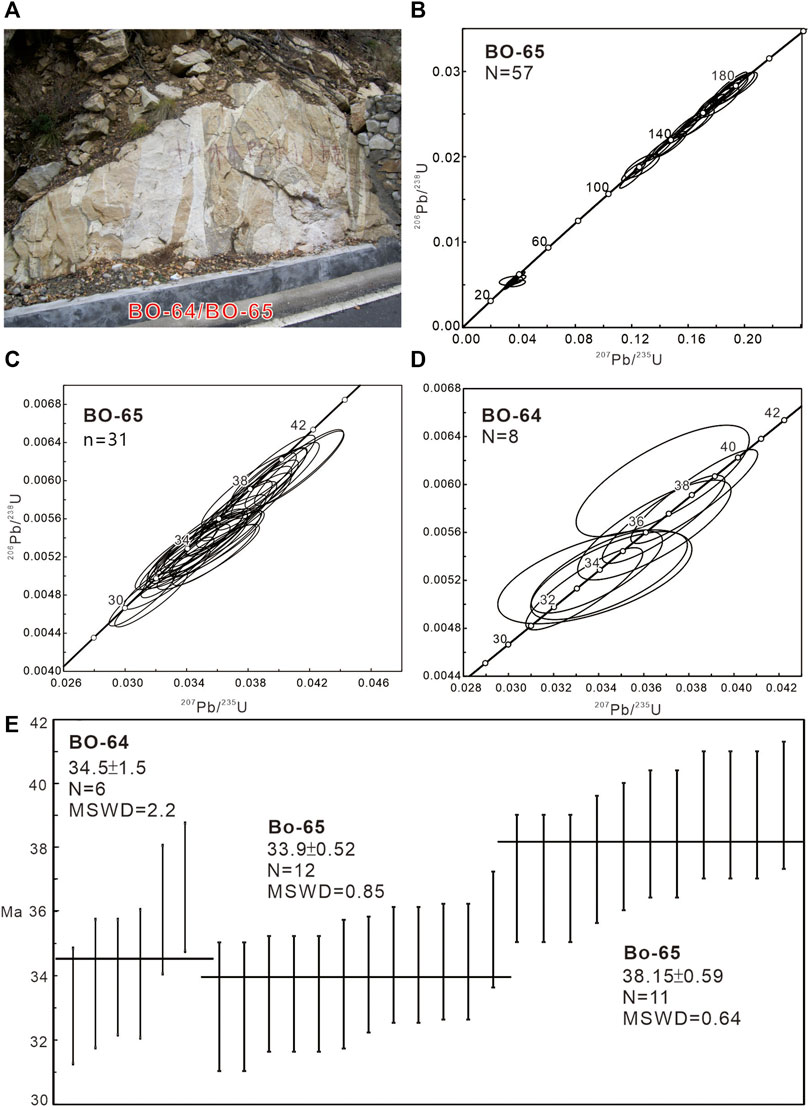
FIGURE 8. (A) Outcrop of the samples BO-64 and BO-65 (alkali feldspar granite). (B) Concordia map for BO-65 which shows Cenozoic and Mesozoic C. The data-point error ellipses are 2σ in the concordia maps. (C, D) Concordia map for the Cenozoic grain ages of BO-64 and -65; their similar age distributions from 32–40 Ma indicate they are the same event. (E) The youngest magmatism in this location is ca. 34 Ma.
4.3 Spatial patterns of U-Pb ages
We now describe the patterns of magmatic ages and intrusions in different sections across the GSG. In Section I, magmatic and zircon grain ages range from 14 to 20 Ma (Figures 2, 9A). In this section, we observe dikes of granite cutting the Triassic slate with no apparent contact metamorphism, indicating a shallow granite emplacement. Some granitoids develop foliated or mylonitic structures and the youngest foliated granite is ca. 14 Ma, which gives an upper limit on the timing of deformation. BO-32 and BO-26 have average ages of 18 Ma and 14 Ma, typical magmatic ages in section I (Figures 9A,B).
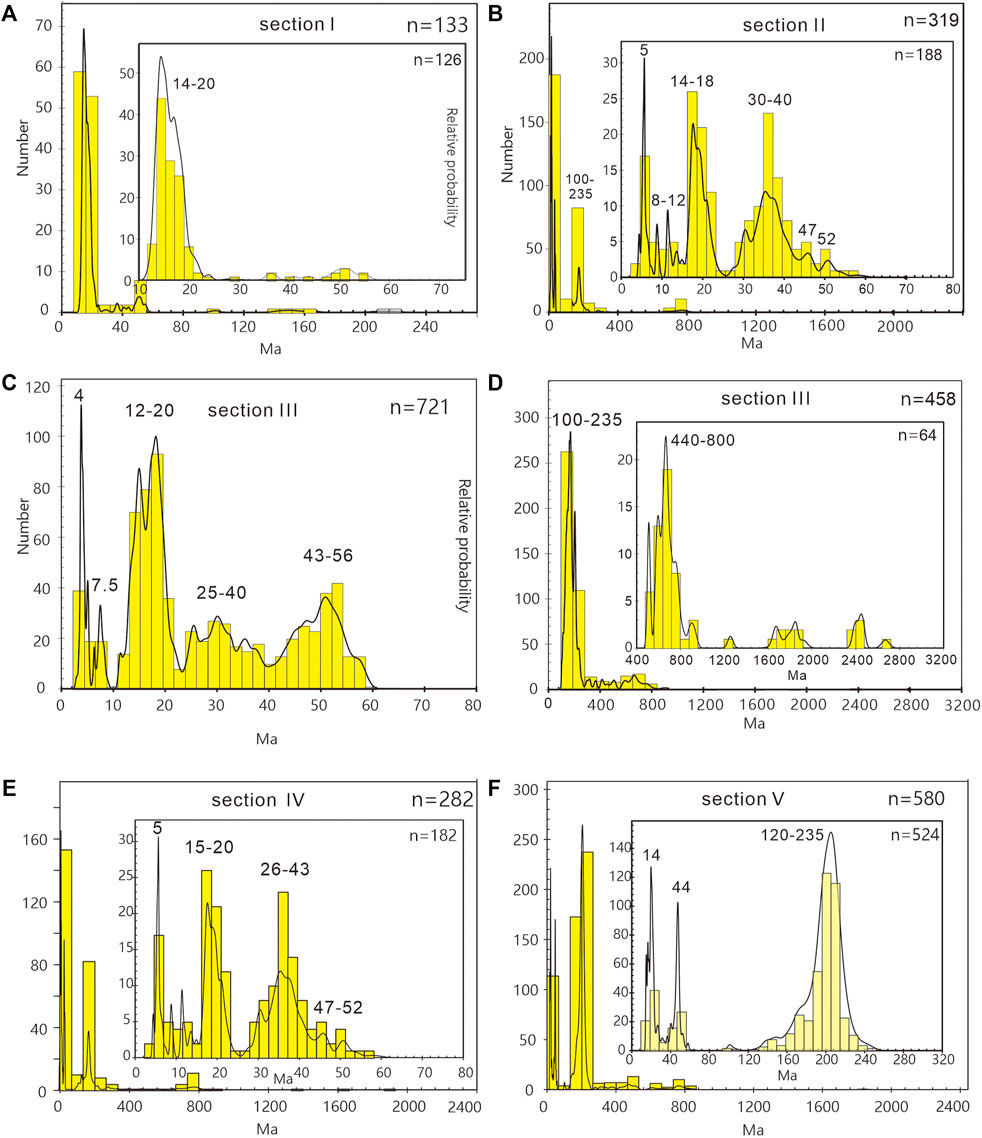
FIGURE 9. Zircon U-Pb grain age spectra for each section. (A, B) are Section I and II. (C, D) are Section III. (E, F) are Section IV and V.
In Section II, we analyzed nine samples and the magmatism ages are much more complex. The youngest age is 5 Ma and there is a small group of ages between 7 and 10 Ma (Figures 2, 9B). Gong-73 is a river sand sample yielding a 7.5 Ma average age, also seen in samples 14GO-10 and GO-15, located 30 km south (Figures 2, 4, 6, 10C). The 10 Ma (Gong 71 and -72) magmatism event is only observed in section II (Figures 2, 8B, 10D). This section also contains a small group of 14-18 Ma ages. Samples BO-64 and -65 indicate magmatism lasting from 30–40 Ma, as described above. According to the grain age spectrum, three main groups can be identified: <10 Ma, 14–18 Ma, 30–40 Ma, and a small group at 47–56 Ma (Figure 2B).
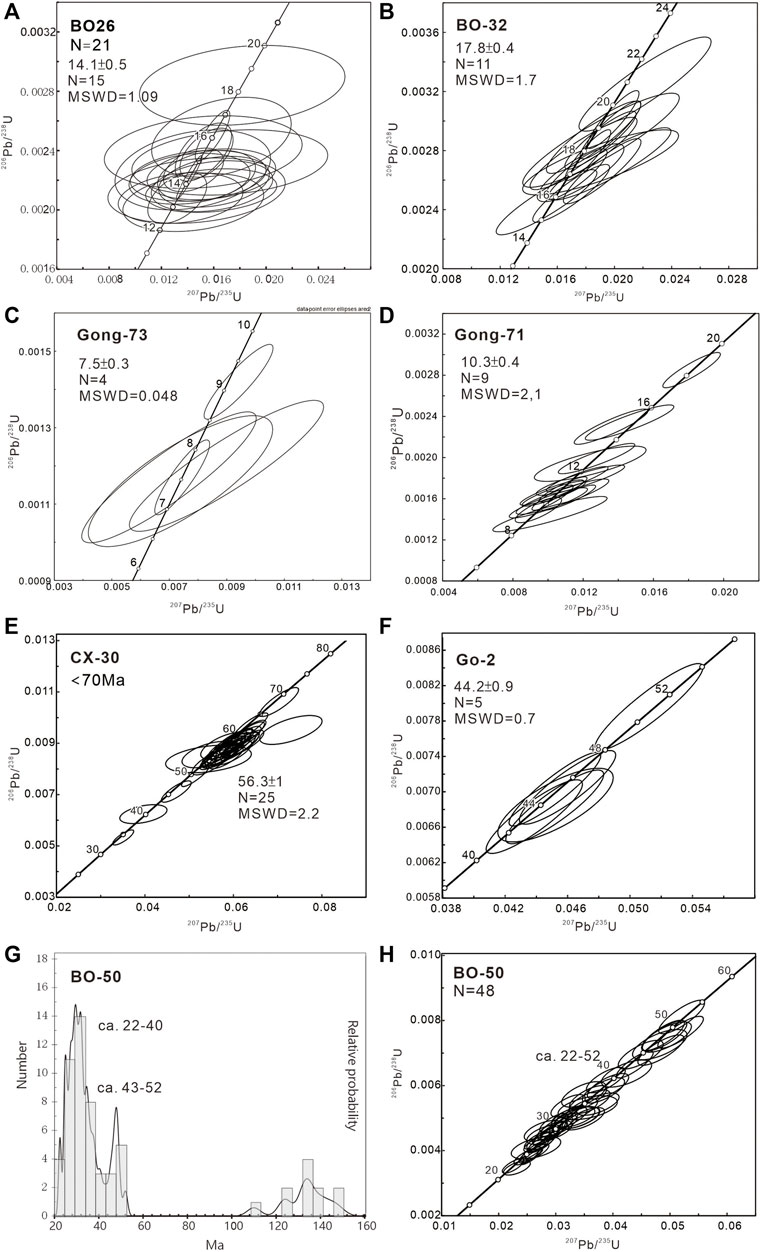
FIGURE 10. Magmatism ages of the GSG. The data-point error ellipses are 2σ in the concordia maps. (A. B) BO-26 and -32 are 18 Ma and 14 Ma, respectively, which are the typical magmatism ages in section I. (C, D) We obtain magmatism ages of 7.5 (Gong-73) and 10 Ma (Gong-71) in Section II. The 10 Ma event only appears in section II (E) CX-30 gives the oldest magmatic age in the GSG. (F) Go-2 yields an age of 44 Ma, belonging to the first stage of magmatism. (G, H) Concordia map and age spectrum of BO-50 which contains two main groups, Cenozoic and Mesozoic. The Cenozoic grain ages can be separated into two groups, 22–40 Ma and 43–52 Ma. Concordia map of the Cenozoic 1.
We collected a very dense set of samples along Section III (Figures 3, 9C,D). The Cenozoic spectrum of zircon grain ages suggests the presence of 4 groups: 4–8 Ma, 12–20 Ma, 25–40 Ma, and 43–56 Ma (Figures 2, 9C). A lot of the inherited Mesozoic to Proterozoic zircons are also observed in this section (Figure 9D).
Sample CX-30, located at the eastern end of Section III, is dominated by grains with ages ca. 50–60 Ma, yielding a 56 Ma average age, the oldest Cenozoic magmatic event found in the GSG (Fig-. 2, 3, 9c, and 10c). Most of the grain ages of sample GO-2 are concentrated around ca. 43 Ma, suggesting an isolate magmatism event (Figure 10D). BO-50 yielded a wide grain age distribution mainly from Cenozoic to Mesozoic ages (Figure 10G). The Cenozoic zircon age spectrum can be separated into two groups, ca. 22–40 Ma and 43–52 Ma (Figure 10G). We can further divide the younger Cenozoic group and calculate three average ages (26 Ma, 30M, and 34 Ma); however, considering all grain ages line up concordantly on the concordia map, the magmatism could be ongoing during 22–40 Ma. The older Cenozoic group (43–52 Ma) and the small Mesozoic age group may represent inherited zircons (Figures 10G,H). The outcrop condition is terrible in Section IV, so we collected many granite clasts and river sand to get an overview of possible magmatism ages (Figure 2). The measured ages can be separated into three major groups: 5–10 Ma, 15–20 Ma, and 26–44 Ma, plus a minor group between 47 and 52 Ma. The youngest magmatism age of ca. 5.5 Ma is located in the central and western parts of the GSG (Figure 2).
Section V contains samples from the eastern and western margins of the GSG. In contrast to the other sections, most of the granitoids are Mesozoic rather than Cenozoic in age, and the Cenozoic magmatic events are concentrated around 14 Ma and 44 Ma (Figure 9F).
Overall, from both in situ samples and the detrital zircon grain ages, the Cenozoic zircon ages range from 56 Ma to 4 Ma but can be separated into four major groups at 4–10 Ma, 12–20 Ma, 25–40 Ma, and 43–56 Ma (Figure 11). Some GSG granitoids are of Mesozoic rather than Cenozoic age, especially in the southern part of the GSG. Most of the older stage Cenozoic granitoids (43–56 Ma) are located on the margin of the GSG (Figure 2). Based on the age distributions, the 12–20 Ma is the dominant magmatic phase in the GSG, and the youngest phase at 10–4 Ma is found scattered throughout the GSG.
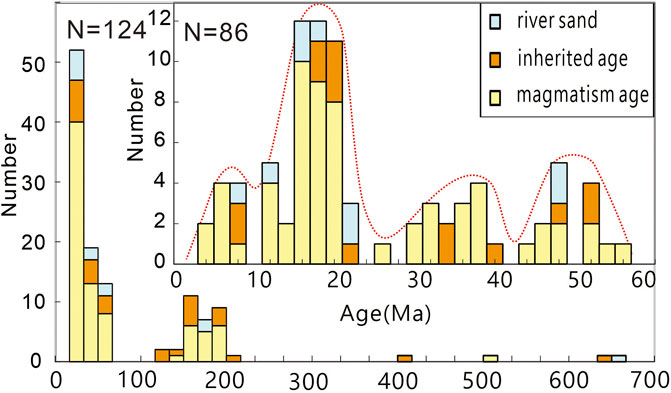
FIGURE 11. Histogram showing the distribution of magmatism ages of the GSG, including river sand, inherited age, and magmatism age.
Compared to the other groups, the 25–40 Ma granitoids abound with detrital Mesozoic zircon grains (100–170 Ma) (Supplementary Table S1). These Mesozoic ages are consistent with Mesozoic magmatism in the SGFB, with the 235 Ma ages representing the oldest observed Mesozoic magmatism in the region. Paleozoic and Proterozoic ages are also observed in the inherited zircons, ages from 440 to 800 Ma. The numerous inherited Mesozoic to Proterozoic zircons and the presence of zircons that have cores with Mesozoic to Proterozoic ages and rims with Cenozoic age suggest that the source of partial melt included both Mesozoic granite and the Proterozoic basement.
4.4 Zircon Th/U ratios of the GSG
The Th/U ratio of zircon can provide significant clues to the physicochemical environment of zircon growth, which suggests that if we combined the geochronologic ages with Th/U ratios, an understanding of the zircon growth or inheritance mechanism could be derived (Rubatto, 2002; Kirkland et al., 2015). To clarify the characteristics of magmatism events in each stage, we determined Th/U ratios along with U-Pb dates. The results show that the Th/U ratios have varied through time since the Proterozoic (Figure 12). In the Mesozoic (from 235 to 170 Ma), most of the Th/U ratios were greater than 0.1, but there was a significant group of 200–100 Ma ages where the Th/U ratios were lower than 0.1. (Figure 12). From ca. 56 to 40 Ma, the Th/U ratios could be separated into two groups, with one falling above, and one below, ca. 0.1. From ca. 40–25 Ma, most of the Th/U ratios were lower than 0.1. From 20 to 10 Ma, the main group is high than ca. 0.1 and the minor group is below ca. 0.1. From 10 to 4 Ma, most of the ratios were higher than 0.1.
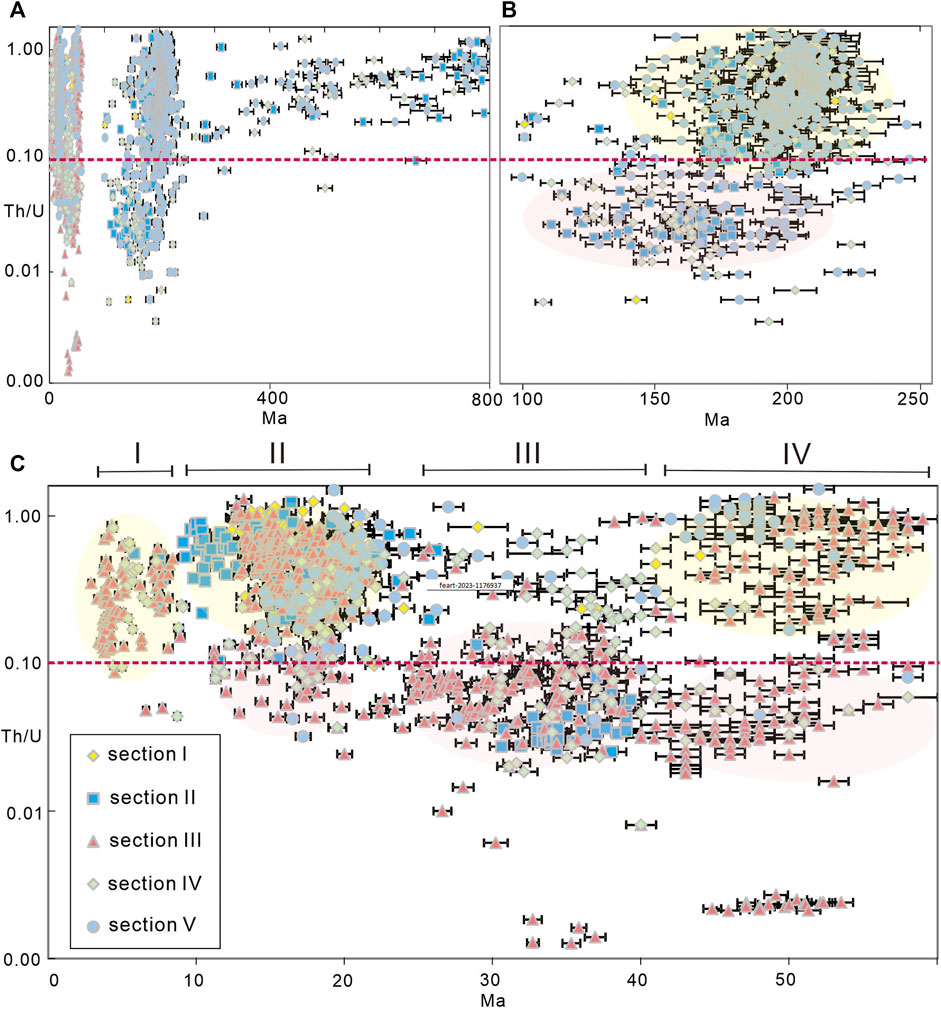
FIGURE 12. Zircon Th/U ratios of the GSG. (A) Th/U ratios since the Proterozoic. (B) Th/U ratios of Mesozoic zircon grains. (C) Th/U ratios of Cenozoic zircon grains.
The Th/U ratio of the Cenozoic zircon grains also shows it can be divided into four groups from 56 Ma to 4 Ma, consistent with four stage magmatism events based on U-Pb zircon ages.
Considering the Th/U ratio also shows two groups higher and lower 0.1 in Mesozoic zircons and lots of the inherited zircon in the Cenozoic granite we infer that the different Th/U ratio in Cenozoic zircon grains could be related to partial melting of the different Mesozoic zircon grains through time but it still needs further studies.
5 Discussions
5.1 Ongoing crustal magmatism events and crustal channel flow in eastern Tibet
Our 4 Ma zircon U-Pb ages provide direct evidence of recent crustal melting under the GSG. Although our data do not constrain the lateral extent of crustal melting in the region, they are consistent with seismic and magnetotelluric data that point to the existence of fluids and/or partial melting in the crust beneath parts of southeastern Tibet (Bai et al., 2010; Wang et al., 2010; Liu et al., 2014) (Figure 13). Figure 13 shows the S-wave velocity structure and VP/VS. ratio of a profile along 30°N which passes through the GSG (Wang et al., 2010). The low S wave velocity zone (2.60–3.40 km/s) in the lower crust suggests that crustal flow might occur locally in the lower crust. The high VP/VS. ratio along the XSHF could be related to partial melting, and the 4 Ma granite provides new evidence that the middle crust has been melting, supporting the crustal channel flow model. In addition, in section III, most of the apatite fission track ages are less than 2 Ma (Xu and Kamp, 2000), indicating rapid exhumation that may be related to ongoing partial melting magma intrusion.
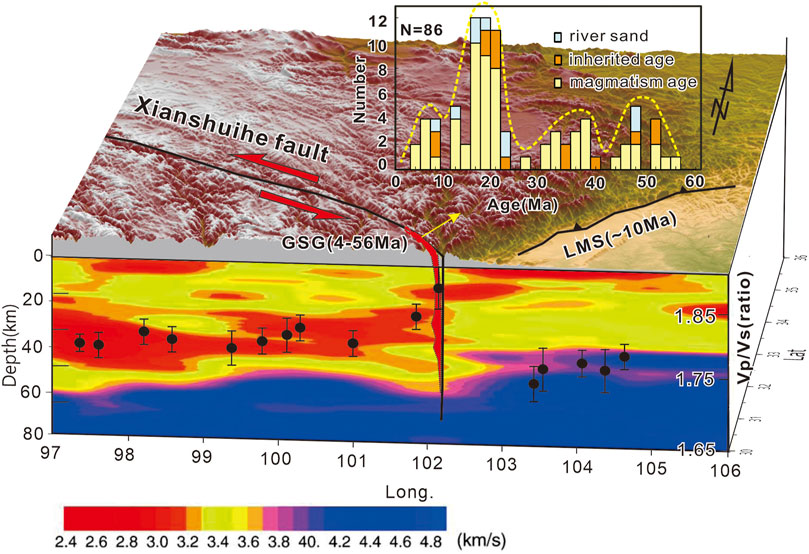
FIGURE 13. Schematic model for the Gongga Shan granite. S-wave velocity structure and VP/VS. ratio of the profile along 30°N, adapted from Wang et al. (2010). The high VP/VS. ratio along the XSHF could be related to partial melting and the Gongga Shan granite extrude to shallow crust along the XSHF.
The final stage of magmatism started from ca. 10 Ma that coincides with the rapid exhumation, faulting activity, and river incision starting from ca. 10 Ma in eastern Tibet (Clark et al., 2005; Wang et al., 2012; Tan et al., 2014), which was proposed to be related with crustal channel flow in eastern Tibet (Royden et al., 1997). We, therefore, suggest that the younger (<10 Ma) magmatism might indicate the initial timing of the recent crustal channel flow.
5.2 Stepwise magmatism in eastern Tibet since the India-Asia collision
Eastern Tibet experienced a significant quiescence of magmatism between ∼100 and 60 Ma, ended by the onset of stepwise magmatism in the early Cenozoic (Figures 1, 2). The stepwise nature of the magmatism is illustrated by the age distribution, suggesting that the magmatism had different sources and can be separated into four age groups: 4–10 Ma, 12–20 Ma, 25–40 Ma, and 43–56 Ma. Previous studies have suggested that the oldest phase of GSG emplacement was 32–27 Ma (Li and Zhang, 2013). Our new data showing events as old as 56 Ma extend the initiation of granite emplacement by about 20 My. We also suggest this magmatism event lasted from 43–56 Ma (Figure 2). The previously proposed 32-27 Ma magmatic event is the same as our 25–40 Ma event, but our data provide additional evidence to show that the event lasted from ca. 25–40 Ma.
Magmatism of a similar age as our older two magmatic events has been found elsewhere in eastern Tibet, such as potassic magmatism in the Qiangtang block in northeastern Tibet at 50–37 Ma and 40–24 Ma potassic magmatism and lamprophyre dikes west of the Xianshuihe fault in southeastern Tibet (Roger et al., 2000; Guo et al., 2005; Spurlin et al., 2005) (Figure 1). The 50–37 Ma magmatic events in NE Tibet have been interpreted as either northward or southward continental subduction (Roger et al., 2000; Spurlin et al., 2005); Spurlin et al. (2005) argued that northward subduction and rolling back of the India plate resulted in the Eocene magmatism in NE Tibet. Guo et al. (2005) suggested that the 40-24 Ma potassic magmatic events resulted from the subduction and rolling back of the Paleo-Tethyan oceanic crust in SE Tibet. P-wave tomography data show the subducted slab beneath northeastern and southeastern Tibet (Figure 10B) (Li et al., 2008; Lei and Zhao, 2016). Considering that the older stage of magmatism is relatively widespread, and the tomography images show that the slab has been subducted beneath eastern Tibet, we postulate that the older magmatism of the GSG could also be related to slab subduction and rollback processes, but further geochemical studies are needed to confirm the origin of the magma.
Are the 12–20 Ma magmatic events possibly related to crustal channel flow? In central Tibet, 26–13 Ma is proposed to be the timing of large-scale crustal channel flow (e.g., Beaumont et al., 2001; Searle and Godin, 2003). Cook and Royden (2008) used a three-dimensional numerical model of deformation in a viscous crust to show that crustal channel flow could migrate from central Tibet to eastern Tibet with time. The crustal thickness reaches 68 km east of Tibet (Hu et al., 2011), similar to central Tibet, indicating a suitable environment for the development of crustal channel flow. Geochemistry data show that the 12–20 Ma granitoids are peraluminous with a metaluminous tendency, consistent with a crustal melting origin (Roger et al., 1995; Liu et al., 2006). In addition, initial Sr ratios of 0.7084–0.732 and ε(t) of −5.6 to −8.8, combined with REE and rare element data, suggest that the 12–20 Ma granitoids probably derived from partial melting of Proterozoic upper continental greywacke, possibly with a small contribution from a low degree of partial melting of calc-alkaline basaltic volcanic rocks (Roger et al., 1995; Liu et al., 2006). A derivation from the partial melting of continental crust suggests that this magmatism could be linked to crustal channel flow. In addition, the timing of this stage of magmatism (12–20 Ma) is younger than in Central Tibet (26–13 Ma), consistent with the model suggesting that the crustal channel flow will migrate from central to eastern Tibet (Cook and Royden, 2008). Thus, we postulate that the 12-20 Ma magmatism is related to crustal channel flow processes.
6 Conclusion
While the GSG has long been recognized as a Cenozoic feature, our set of zircon U-Pb ages significantly extends the timing of granite formation, pushing the onset of crustal melt in the region back 20 My earlier than previously recognized and strongly suggesting that melting and magmatic zircon formation continues to the present. While the GSG granite occupies only a tiny part of the eastern margin region, it provides a detailed archive of local magmatic processes; the regional extent of this melting requires further study.
The presence of crustal melt during and prior to the period when regional uplift and deformation are thought to have taken place provides new information about the condition of the middle/lower crust that should be considered when considering models of uplift and deformation in the region.
Data availability statement
The original contributions presented in the study are included in the article/Supplementary Material, further inquiries can be directed to the corresponding author.
Author contributions
Y-HL: field works, writing the manuscript; KC: fieldwork, editing manuscript and discussions; X-BT: fieldwork, analysis samples; M-FC: analysis samples; H-YC: analysis samples; Q-LL: analysis samples; JS: analysis samples; X-WX: finical support. All authors contributed to the article and approved the submitted version.
Funding
This project received financial support from the Ministry of Science and Technology, Taiwan, ROC, under Grant MOST 103-2116-M-194-001 and the Special Projects for Basic Research Work of the Institute of Geology, China Earthquake Administration (IGCEA1518), National Natural Science Foundation of China (41302159).
Acknowledgments
Tsai Wen Lien helped to analyze the zircon U-Pb ages. The topography map is drawn by GMT. The manuscript was greatly improved by constructive comments from three reviewers and editor Shuangshuang Chen.
Conflict of interest
The authors declare that the research was conducted in the absence of any commercial or financial relationships that could be construed as a potential conflict of interest.
Publisher’s note
All claims expressed in this article are solely those of the authors and do not necessarily represent those of their affiliated organizations, or those of the publisher, the editors and the reviewers. Any product that may be evaluated in this article, or claim that may be made by its manufacturer, is not guaranteed or endorsed by the publisher.
Supplementary material
The Supplementary Material for this article can be found online at: https://www.frontiersin.org/articles/10.3389/feart.2023.1176937/full#supplementary-material
References
Andersen, T. (2002). Correction of common lead in U-Pb analyses that do not report 204Pb. Chem. Geol. 192, 59–79. doi:10.1016/s0009-2541(02)00195-x
Bai, D. H., Unsworth, M. J., Meju, M. A., Ma, X. B., Teng, J. W., Kong, X. R., et al. (2010). Crustal deformation of the eastern Tibetan plateau revealed by magnetotelluric imaging. Nat. Geosci. 3, 358–362. doi:10.1038/ngeo830
Beaumont, C., Jamieson, R. A., Nguyen, M. H., and Lee, B. (2001). Himalayan tectonics explained by extrusion of a low-viscosity crustal channel coupled to focused surface denudation. Nature 414, 738–742. doi:10.1038/414738a
Burchfiel, B. C., Chen, Z., Liu, Y., and Royden, L. H. (1995). Tectonics of the longmen Shan and adjacent regions, Central China. Int. Geol. Rev. 37, 661–735. doi:10.1080/00206819509465424
Chiu, H., Chung, S., Wu, F., Liu, D., Liang, Y., Lin, I., et al. (2009). Zircon U-Pb and Hf isotopic constraints from eastern Transhimalayan batholiths on the precollisional magmatic and tectonic evolution in southern Tibet. Tectonophysics 477, 3–19. doi:10.1016/j.tecto.2009.02.034
Chung, S. L., Chu, M. F., Zhang, Y. Q., Xie, Y. W., Lo, C. H., Lee, T. Y., et al. (2005). Tibetan tectonic evolution inferred from spatial and temporal variations in post-collisional magmatism. Earth Sci. Rev. 68 (3–4), 173–196. doi:10.1016/j.earscirev.2004.05.001
Clark, M. K., House, M. A., Royden, L. H., Whipple, K. X., Burchfield, B. C., Zhang, X., et al. (2005). Late cenozoic uplift of southeastern Tibet. Geology 33, 525–528. doi:10.1130/g21265.1
Cook, K. L., and Royden, L. H. (2008). The role of crustal strength variations in shaping orogenic plateaus, with application to Tibet. J. Geophys. Res. Solid Earth 113 (B8). doi:10.1029/2007jb005457
de Sigoyer, J., Chavagnac, V., Blichert−Toft, J., Villa, I. M., Luais, B., Guillot, S., et al. (2000). Dating the Indian continental subduction and collisional thickening in the northwest Himalaya: multichronology of the Tso Morari eclogites. Geology 28 (6), 487–490. doi:10.1130/0091-7613(2000)028<0487:dticsa>2.3.co;2
Garzanti, E. (2008). Comment on "when and where did India and asia collide?'' by jonathan C. Aitchison, jason R. Ali, and aileen M. Davis. J. Geophys. Res. Solid Earth 113 (4), B04411. doi:10.1029/2007jb005276
Godin, L., Grujic, D., Law, R. D., Searle, M. P., and Godin, L. (2006). “Channel flow, extrusion, and exhumation in continental collision zones: an introduction,” in Channel flow, ductile extrusion and exhumation in continental collision zones. Editors R. D. Law, and M. P. Searle (London: Geological Society, London, Special Publications), 1–23.
Guo, Z. F., Hertogen, J., Liu, J. Q., Pasteels, P., Boven, A., Punzalan, L., et al. (2005). Potassic magmatism in western sichuan and yunnan provinces, SE Tibet, China: petrological and geochemical constraints on petrogenesis. J. Petro1. 46, 33–78. doi:10.1093/petrology/egh061
Hu, J., Xu, X., Yang, H., Wen, L., and Li, G. (2011). S receiver function analysis of the crustal and lithospheric structures beneath eastern Tibet. Earth Planet. Sci. Lett. 306, 77–85. doi:10.1016/j.epsl.2011.03.034
Jackson, S. E., Pearson, N. J., Griffin, W. L., and Belousova, E. A. (2004). The application of laser ablation-inductively coupled plasma–mass spectrometry to in situ U–Pb zircon geochronology. Chem. Geol. 211, 47–69. doi:10.1016/j.chemgeo.2004.06.017
Kapp, P., Yin, A., Harrison, T. M., Ding, L., Deng, X. G., and Zhou, Y. (2005). Cretaceous-Tertiary shortening, basin development, and volcanism in central Tibet. Geol. Soc. Am. Bull. 117, 865–878. doi:10.1130/b25595.1
King, J., Harris, N., Argles, T., Parrish, R., and Zhang, H. (2011). Contribution of crustal anatexis to the tectonic evolution of Indian crust beneath southern Tibet. Geol. Soc. Am. Bull. 123, 218–239. doi:10.1130/b30085.1
Kirkland, C. L., Smithies, R. H., Taylor, R. J. M., Evans, N., and McDonald, B. (2015). Zircon Th/U ratios in magmatic environs. Lithos 212–215, 397–414. doi:10.1016/j.lithos.2014.11.021
Knittel, U., Suzuki, S., Nishizaka, N., Kimura, K., Tsai, W. L., Lu, H. Y., et al. (2014). U–Pb ages of detrital zircons from the sanbagawa belt in western shikoku: additional evidence for the prevalence of late cretaceous protoliths of the sanbagawa metamorphics. J. Asian Earth Sci. 96, 148–161. doi:10.1016/j.jseaes.2014.09.001
Lei, J., and Zhao, D. (2016). Teleseismic P-wave tomography and mantle dynamics beneath Eastern Tibet. Geophys. Geosyst 17, 1861–1884. doi:10.1002/2016GC006262
Li, C., van der Hilst, R., Meltzer, A. S., and Engdahl, E. R. (2008). Subduction of the Indian lithosphere beneath the Tibetan plateau and Burma. Earth Planet. Sci. Lett. 274, 157–168. doi:10.1016/j.epsl.2008.07.016
Li, H. L., and Zhang, Y. Q. (2013). Zircon U–Pb geochronology of the Konggar granitoid and migmatite: constraints on the Oligo-Miocene tectono-thermal evolution of the Xianshuihe fault zone, East Tibet. Tectonophysics 606, 127–139. doi:10.1016/j.tecto.2013.07.007
Li, Q. L., Li, X. H., Wu, F. Y., Yin, Q. Z., Ye, H. M., Liu, Y., et al. (2012). In-situ SIMS U-Pb dating of phanerozoic apatite with low U and high common Pb. Gondwana Res. 21, 745–756. doi:10.1016/j.gr.2011.07.008
Li, X. H., Liu, Y., Li, Q. L., Guo, C. H., and Chamberlain, K. R. (2009). Precise determination of Phanerozoic zircon Pb/Pb age by multi-collector SIMS without external standardization. Geochem. Geophys. Geosystem 10, Q04010. doi:10.1029/2009GC002400
Liu, Q. Y., van der Hilst, R. D., Yu, L., Yao, H., Chen, J., Guo, B., et al. (2014). Eastward expansion of the Tibetan Plateau by crustal flow and strain partitioning across faults. Nat. Geosci. 7, 361–365. doi:10.1038/ngeo2130
Liu, S. W., Wang, Z. Q., Yan, Q. R., Li, Q. G., Zhang, D. H., and Wang, J. G. (2006). Timing, petrogenesis and geodynamic significance of Zheduoshan granitoids. Acta Petrol. Sin. 22 (2), 343–352. doi:10.0000/b21e6aab4ed04f0587c795769ebd83ab
Ludwig, K. R. (2008). Isoplot 3.70: A geochronological toolkit for microsoft excel. Berkeley: Berkeley Geochronology Center, Special Publication.
Ludwig, K. R. (2001). Users manual for Isoplot/Ex rev. 2.49. Berkeley: Berkeley Geochronology Centre Special Publication, 56.
Replumaz, A., and Tapponnier, P. (2003). Reconstruction of the deformed collision zone between India and Asia by backward motion of lithospheric blocks. J. Geophys. Res. 108 (6), 2285. doi:10.1029/2001JB000661
Roger, F., Calassou, S., Lancelot, J., Malavieille, J., Mattauer, M., Xu, Z., et al. (1995). Miocene emplacement and deformation of the Konga Shan granite (Xianshui He fault zone, west Sichuan, China): geodynamic implications. Earth Planet. Sci. Lett. 130, 201–216. doi:10.1016/0012-821x(94)00252-t
Roger, F., Jolivet, M., and Malavieille, J. (2010). The tectonic evolution of the songpan-garzê (north Tibet) and adjacent areas from proterozoic to present: a synthesis. J. Asian Earth Sci. 39, 254–269. doi:10.1016/j.jseaes.2010.03.008
Roger, F., Tapponnier, P., Arnaud, N., Schärer, U., Maurice, B., Zhiqin, X., et al. (2000). An Eocene magmatic belt across central Tibet: mantle subduction triggered by the Indian collision? Terra nova. 12, 102–108. doi:10.1046/j.1365-3121.2000.123282.x
Rosenberg, C., and Handy, M. (2005). Experimental deformation of partially melted granite revisited: implications for the continental crust. J. Metam. Geol. 23, 19–28. doi:10.1111/j.1525-1314.2005.00555.x
Royden, L. H., Birchfiel, B. C., King, R. W., Wang, E., Chen, Z., Shen, F., et al. (1997). Surface deformation and lower crustal flow in eastern Tibet. Science 276, 788–790. doi:10.1126/science.276.5313.788
Rubatto, D. (2002). Zircon trace element geochemistry; partitioning with garnet and the link between U–Pb ages and metamorphism. Chem. Geol. 184, 123–138. doi:10.1016/s0009-2541(01)00355-2
Schärer, U. (1984). The effect of initial 230Th disequilibrium on young U–Pb ages: the makalu case, Himalaya. Earth Planet. Sci. Lett. 67, 191–204. doi:10.1016/0012-821x(84)90114-6
Searle, M. P., and Godin, L. (2003). The South Tibetan detachment and the manaslu leucogranite: a structural re-interpretation and restoration of the annapurna–manaslu Himalaya, Nepal. J. Geol. 111, 505–523. doi:10.1086/376763
Searle, M. P., Roberts, N. M. W., Chung, S. L., Lee, Y. H., Cook, K. L., Elliott, J. R., et al. (2016). Age and anatomy of the Gongga Shan batholith, eastern Tibetan Plateau, and its relationship to the active Xianshui-he fault. Geosphere 12, 948–970. doi:10.1130/GES01244.1
Shore, M., and Fowler, A. D. (1996). Oscillatory zoning in minerals: A common phenomenon. Can. Mineralogist 34, 1111–1126.
Sláma, J., Kosler, J., Condon, D. J., Crowley, J. L., Gerdes, A., Hanchar, J. M., et al. (2008). Plešovice zircon — a new natural reference material for U–Pb and Hf isotopic microanalysis. Chem. Geol. 249, 1–35. doi:10.1016/j.chemgeo.2007.11.005
Spurlin, M. S., Yin, A., Horton, B. K., Zhou, J. Y., and Wang, J. H. (2005). Structural evolution of the Yushu–Nangqian region and its relationship to syncollisional igneous activity, east-central Tibet. Geol. Soc. Am. Bull. 117 (9–10), 1293–1317. doi:10.1130/b25572.1
Stacey, J. S., and Kramers, J. D. (1975). Approximation of terrestrial lead isotope evolution by a two-stage model. Earth Planet. Sci. Lett. 26, 207–221. doi:10.1016/0012-821x(75)90088-6
Tan, X. B., Lee, Y. H., Chen, W. Y., Cook, C. L., and Xu, X. W. (2014). Exhumation history and faulting activity of the southern segment of the Longmen Shan, eastern Tibet. J. Asian Earth Sci. 81, 91–104. doi:10.1016/j.jseaes.2013.12.002
Wang, C. Y., Hai, L., Paul, G. S., Zhu, L., and Chang, L. (2010). Crustal structure variation along 30°N in the eastern Tibetan Plateau and its tectonic implications. Earth Planet. Sci. Lett. 289, 367–376. doi:10.1016/j.epsl.2009.11.026
Wang, E., Burchfiel, B. C., Royden, L. H., Chen, L., Chen, J., Li, W., et al. (1998). Late cenozoic xianshuihe-xiaojiang, Red River, and dali fault systems of southwestern sichuan and central yunnan, China. Boulder: Geological Society of America, 108.
Wang, E., Kirby, E., Furlong, K. P., van Soest, M., Xu, G., Shi, X., Kamp, P. J. J., Hodges, K.V., et al. (2012). Two-phase growth of high topography in eastern Tibet during the Cenozoic. Nat. Geosci. 5, 640–645. doi:10.1038/ngeo1538
Wiedenbeck, M., Alle, P., Corfu, F., Griffin, W. L., Meier, M., Oberli, F., et al. (1995). Three natural zircon standards for U–Th–Pb, Lu–Hf, trace-element and REE analyses. Geostand. Newsl. 19, 1–23. doi:10.1111/j.1751-908x.1995.tb00147.x
Xu, G., and Kamp, P. J. J. (2000). Tectonics and denudation adjacent to the Xianshuihe fault, eastern Tibetan plateau: constraints from fission track thermochronology. J. Geophys. Res. 105 (8), 19231–19251. doi:10.1029/2000jb900159
Yin, A., and Harrison, T. M. (2000). Geologic evolution of the Himalayan-Tibetan orogen. Annu. Rev. Earth Planet. Sci. 28, 211–280. doi:10.1146/annurev.earth.28.1.211
Zhang, H. F., Harris, N., Parrish, R., Kelley, S., Zhang, L., Rogers, N., et al. (2004a). Causes and consequences of protracted melting of the mid-crust exposed in the North Himalayan antiform. Earth Planet. Sci. Lett. 228, 195–212. doi:10.1016/j.epsl.2004.09.031
Zhang, P., Shen, Z., Wang, M., Gan, W., Burgmann, R., Molnar, P., et al. (2004b). Continuous deformation of the Tibetan Plateau from global positioning system data. Geology 32, 809–812. doi:10.1130/g20554.1
Keywords: Gongga Shan granite, eastern Tibet, magmatism, U-Pb dating, crustal channel flow
Citation: Lee Y-H, Cook KL, Tan X-B, Chu M-F, Chiu H-Y, Li Q-L, Shellnutt JG and Xu X-W (2023) U-Pb ages of Gongga Shan granite, western Sichuan and its implication to the tectonic evolutions of eastern Tibet. Front. Earth Sci. 11:1176937. doi: 10.3389/feart.2023.1176937
Received: 01 March 2023; Accepted: 24 July 2023;
Published: 14 August 2023.
Edited by:
Shuangshuang Chen, Sun Yat-sen University, ChinaReviewed by:
Gaoxue Yang, Chang’an University, ChinaAnh Nong, Ho Chi Minh City University of Science, Vietnam
Copyright © 2023 Lee, Cook, Tan, Chu, Chiu, Li, Shellnutt and Xu. This is an open-access article distributed under the terms of the Creative Commons Attribution License (CC BY). The use, distribution or reproduction in other forums is permitted, provided the original author(s) and the copyright owner(s) are credited and that the original publication in this journal is cited, in accordance with accepted academic practice. No use, distribution or reproduction is permitted which does not comply with these terms.
*Correspondence: Yuan-Hsi Lee, bGVleXVhbmhzaUBnbWFpbC5jb20=
†Present address: Kristen L. Cook, IRD, ISTerre, Université Grenoble Alpes, Grenoble, France