 Rinda Nita Ratnasari
 Yuichiro Tanioka
 Yusuke Yamanaka
 Iyan E. Mulia
- 1Institute of Seismology and Volcanology, Faculty of Science, Hokkaido University, Sapporo, Japan
- 2Prediction Science Laboratory, RIKEN Cluster for Pioneering Research, Kobe, Japan
Present tsunami warning systems have been specialized for earthquake-generated tsunamis, but rapidly evaluating the tsunamis caused by volcanic eruptions and/or volcanic sector collapses remains a challenge. In this study, we applied a numerical model to the 2018 Anak Krakatau tsunami event, which was generated by the sector collapse, investigated a tsunami prediction skill by the model, and developed a real-time forecasting method based on a pre-computed database for future tsunamis accompanied by such eruption of Anak Krakatau. The database stores spatiotemporal changes in water surface level and flux, which are simulated under various collapse scenarios, for confined areas in the vicinity of potential source. The areas also cover the locations of observation stations that are virtually placed on uninhabited island surrounding the source area. During an actual volcanic tsunami event, a tsunami is expected to be observed at the observation stations. For real-time tsunami forecasting, the most suitable scenarios to reproduce the observed waveforms are searched quickly in the database. The precomputed results under the identified scenarios are further provided as input for rapid tsunami propagation simulation. Therefore, an effective real-time forecasting can be conducted to densely populated coastal areas located at a considerable distance from the source, such as the coasts of Java and Sumatra. The forecasting performance was examined by applying the method for three hypothetical collapse scenarios assuming different sliding directions. We demonstrated that the tsunamis along the coasts were successfully forecasted. Moreover, we showed that the combination of a pre-computed database and the existence of observation stations near the source area was able to produce appropriate tsunami forecasting for the coastal area even in a volcanic event.
1 Introduction
On 22 December 2018, a devastating tsunami occurred in the Sunda Strait, Indonesia, causing hundreds of death toll and thousands of injured people. The 2018 tsunami case was generated as a result of a large volume of volcanic material from Anak Krakatau volcano (Figure 1) that collapsed into the sea (Grilli et al., 2019; Heidarzadeh et al., 2020a). This tsunami event significantly affected the vicinity across Sunda Strait with recorded maximum tsunami runup height and inundation distance of 13.5 m and 330 m, respectively, along the coasts of Java and Sumatra (Muhari et al., 2019). The Sunda Strait has been identified as an area prone to volcanic tsunamis due to the intense volcanic activity of Anak Krakatau volcano. In 1883, a devastating tsunami occurred at the same volcanic complex caused by the eruption of Krakatau volcano. The 1883 tsunami run up to a height of 30–40 m and a total number of death toll exceeded 36.000 (Verbeek, 1885; Simkin and Fiske, 1983). The 2018 and 1883 tsunami events made it evident that tsunami sources resulting from volcanic eruption, especially those related to the sector collapse of volcanic islands, were able to cause a significant natural hazard (Hunt et al., 2021). It is necessary to develop a real-time tsunami forecasting method for Anak Krakatau and other area prone to volcanic tsunamis in Indonesia.
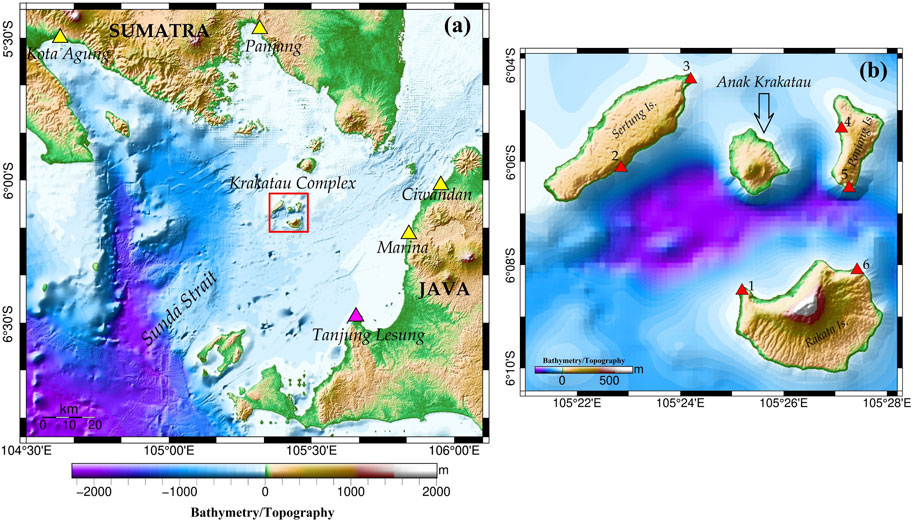
FIGURE 1. (A) Study area of Sunda Strait with tide gauge location indicated by triangles: yellow (real) and magenta (virtual). (B) Anak Krakatau volcanic complex is indicated by the red rectangle in (A), and six virtual observation stations are indicated by red triangles.
Tsunamis associated with volcanic sector collapse are widely recognized worldwide. Although their occurrence is less-frequent than that of earthquake-generated tsunamis, the potential catastrophe from volcanic tsunamis cannot be underestimated and should be considered an important tsunami source in terms of hazards and disaster strategies (Yamanaka and Tanioka, 2017; Williams et al., 2019). The underlying processes of a tsunami associated with mass failure can be investigated through physical experiments and/or numerical simulations of tsunami generation and propagation. Various studies have been conducted on the 2018 Anak Krakatau event to gain deeper insights into the generation of volcanic tsunamis. Several studies performed investigation by using common numerical models adopting 2D depth-averaged coupled models to understand the dynamics of tsunami caused by sector collapse such as Grilli et al. (2019) and Paris et al. (2020). A study to investigate the appropriate source mechanisms of the 2018 tsunami event considering two mechanisms from the eruption and landslide was conducted by Ren et al., 2020. Another study by Heidarzadeh et al. (2020b) combined the physical experiment and numerical modeling to estimate the appropriate source for the 2018 Anak Krakatau case. Both numerical modeling and physical experiments should be useful to understand the underlying process of tsunami associated with volcanic sector collapse for the improvement of future tsunami warning.
Various types of tsunami monitoring systems have been actively operated for early tsunami warning from small to gigantic tsunami scales. The existing tsunami warning systems mainly focus on earthquake-generated tsunamis and rely on the observation systems to accurately detect tsunami potential from earthquakes (Tsushima et al., 2011; Maeda et al., 2015; Tanioka, 2020). In Indonesia, the tsunami warning system is actively operated by Indonesia Tsunami Early Warning System (InaTEWS) (Harig et al., 2020). However, it mainly focused on the earthquake-generated tsunamis and other tsunami sources especially from volcanic-tsunamis is not included in the system. In the case of volcanic tsunamis, mitigating tsunamis remains challenging because it requires deeper understanding of source mechanism of wave generation and monitoring techniques to be combined. In specific case such as volcanic sector collapses, estimating the source mechanisms in real-time is challenging because of the diversity of waves generated by mass failure. The initiation volume of the sector collapses is also complex by broad variety of generation mechanisms, from small slides to large avalanches. Uncertainties in the exact source mechanism of the volcanic sector collapse leave major challenges to construct a real-time tsunami forecasting (Grilli et al., 2019; Muhari et al., 2019).
Concerning the future sector collapse of Anak Krakatau volcano, we aimed to develop a real-time forecasting method using a pre-computed database. To this end, first, we conducted a case study at Anak Krakatau for the 2018 tsunami event in order to investigate the predictive skills in numerical models used in this study. Second, we simulated tsunami waveforms under various collapse scenarios assumed for a future collapse and stored the necessary information in a database. Finally, we proposed a forecasting method using a database and discussed its effectiveness.
2 Data and method
Tsunami waveforms from the 2018 Anak Krakatau event were recorded at four tide gauge stations located in Kota Agung, Panjang, Ciwandan, and Marina Jambu (Figure 1A). The original recorded tide gauge data are available from the Geospatial Information Agency of Indonesia (http://tides.big.go.id). A polynomial approximation method similar to that used by Mulia et al. (2020) was applied to the data to extract tsunami waveforms from tide gauge records.
Tsunami generation by the sector collapse of Anak Krakatau volcano was simulated using VolcFlow model (Kelfoun and Druitt, 2005). VolcFlow model is a two-dimensional (2D) depth-average model which was modified to incorporate 3D interactions between landslide and water to give greater accuracy (Kelfoun et al., 2010; Giachetti et al., 2011). The model is capable of simulating the tsunami generation by two fluids (landslide and water), which interact at each time step by solving general shallow water equations of mass conservation and momentum balance (Kelfoun et al., 2010; Paris et al., 2011). Another complex second-order 3D effect and dissipation due to the wave breaking were not considered in VolcFlow model. Numerical simulation by VolcFlow model was performed using a water density of 1,000 kg m−3. For landslides, we applied a density of 1,500 kg m−3 referring to the main volcanic material composition of Anak Krakatau (Sudrajat, 1982; Camus et al., 1987; Giachetti et al., 2012) and a constant retarding stress of 5 kPa for the numerical simulation of VolcFlow (Mulia et al., 2020).
In the case of a tsunami associated with volcanic sector collapse, a dispersive model has been widely applied and suggested to simulate a tsunami that caused by mass failure (Tappin et al., 2014; Grilli et al., 2017; Paris et al., 2019). The variation of collapse thickness in the generation mechanism of tsunamis may contribute to dispersion (Ward and Day, 2001; Glimsdal et al., 2013; Grilli et al., 2017). The short wave components resulting from rapid acceleration or deceleration from landslide affect the tsunami propagation by its frequency dispersion (Harbitz et al., 2006; Paris, 2015; Grilli et al., 2019). The VolcFlow model is capable of simulating both the behavior of collapsed materials and the propagation of tsunamis, but the speed of tsunami propagation is limited to that of the long waves. To account for dispersive characteristics of tsunami, we employ a non-linear dispersive theory (Boussinesq model) (Yamanaka and Tanioka, 2017) to simulate the tsunami propagation from the tsunami wave field first estimated by VolcFlow model. Manning roughness coefficient of 0.025 m−1/3 was assumed for the bottom friction terms in the Boussinesq model.
Generally, we apply two types of numerical simulations in this study. First, the numerical simulation using a combination of the VolcFlow and Boussinesq models for simulating the sector collapse and tsunami propagation to construct the pre-computed database. Second, we used only the Boussinesq model to forecast the tsunami without any estimation on collapse source for the demonstration of our real-time forecasting simulation. Computational domain with a 3 arc-sec resolution was constructed by integrating the Indonesian bathymetry and topography data with spatial resolution of a 6 arc-sec and 0.27 arc-sec and resampled it.
3 Numerical test for the 2018 Anak Krakatau tsunami event
The estimation characteristics of the selected models (VolcFlow and Boussinesq models) were assessed by applying them to the 2018 Anak Krakatau tsunami event. The initial collapse area of 2018 event is situated in the southwestern part of Anak Krakatau, with a total collapse volume of 0.24 km3. This collapse source was obtained from Mulia et al. (2020), who estimated the collapse volume by comparing the satellite images of Anak Krakatau volcano from before and after the event. In the numerical simulation, VolcFlow and Boussinesq models are sequentially applied for estimating the tsunami generation and propagation. Using the same initial conditions as those used by Mulia et al. (2020), we simulated the behavior of collapsed materials as well as the tsunami generation and propagation based on VolcFlow to extract the spatiotemporal distributions of the simulated water surface level and water fluxes during the event. Subsequently, we switched to the Boussinesq model at a certain time (t0) after the occurrence of collapse, using the spatiotemporal distribution of the water surface level and water fluxes from the VolcFlow simulation as inputs. We set t0 to 2 min based on a trial-and-error method and used the Boussinesq model to simulate the propagation of the 2018 tsunami for 100 min.
The simulated waveforms were compared with the tsunami waveforms recorded at the four tide gauge stations (Figure 2). The waveforms observed at Kota Agung, Ciwandan, and Marina Jambu have a reasonable fit with the simulated waveforms. However, a noticeable discrepancy between the simulated and observed tsunami waveforms was found at Panjang station (Figure 2B). A similar discrepancy was found in other studies such as those by Grilli et al. (2019), Mulia et al. (2020) and Paris et al. (2020). The discrepancy in tsunami amplitude and arrival time were possibly influenced by the effect of shallow water and energy dissipation, as complex interactions occurred in a coastal area of the Panjang station (Mulia et al., 2020; Zengaffinen et al., 2020). By assessing the general performance, we consider that the observed tsunami heights for the 2018 Anak Krakatau tsunami event were reasonably explained by our numerical simulation. Thus, the selected models were appropriate for simulating the generation and propagation of tsunamis triggered by the sector collapse of Anak Krakatau.
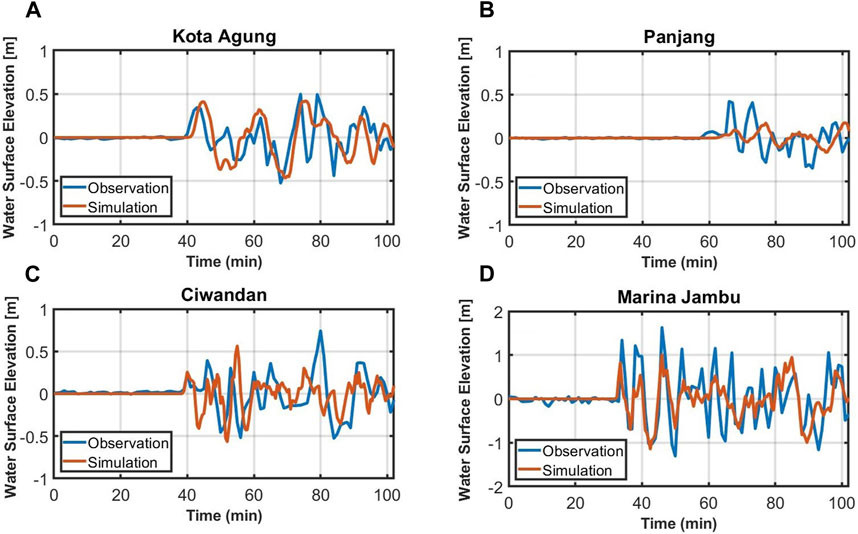
FIGURE 2. Comparison between observed (blue) and simulated (red) tsunami waveforms from 2018 Anak Krakatau event at four tide gauge stations: (A) Kota Agung, (B) Panjang, (C) Ciwandan, and (D) Marina Jambu.
4 Tsunami forecasting strategy
Our real-time tsunami forecasting strategy is based on a pre-computed database. The Anak Krakatau volcano is surrounded by three uninhabited islands: Sertung, Rakata, and Panjang. In this volcanic island complex, tsunamis generated during the collapse sector of Anak Krakatau propagated towards the three pathways out in between the uninhabited islands before traveling further to the coasts of Java and Sumatra. Considering these characteristics, we placed six virtual observation stations in the vicinity of volcano to surround the Anak Krakatau (Figure 1B), as monitoring and early tsunami detection. Moreover, we placed the observation systems in locations that are suitable for the installation of observation stations considering the coastal morphology of the three surrounding islands. The six observations here are the minimum requirements for the application of our methods.
The concept of a pre-computed database for tsunami forecasting has been applied in many studies such as Tanioka et al. (2014) and Gusman et al. (2014). In the present study, we constructed a pre-computed tsunami database for the volcanic sector collapse of Anak Krakatau. Our database includes 16 sector collapse scenarios (SC’s) with various volumes, locations and sliding directions (Supplementary Figure S1). We create those collapse scenarios by setting several parameters such as collapse thickness, dip and strike angle. The detail collapse geometry in each scenario and illustration on the application of collapse thickness variations in our database are shown in Supplementary Table S1 and Supplementary Figure S2 inside the Supplementary Material. In each created scenario, the behavior of collapsed material and the generation and propagation of tsunamis of up to 1 min were simulated using VolcFlow model (Figures 3B, C), then switched to the Boussinesq model for estimating only tsunami propagation with similar manner to the analysis of the 2018 tsunami event (Figure 3D). The determination of the switching time is based on the VolcFlow simulation results, which shows that the significant tsunami generation process under the assumed collapse scenarios is likely to end within 1 min after the occurrence of collapse. The total elapsed time of 3 min after the collapse was long enough for tsunamis to be generated, captured by the virtual observation stations, and propagated through the sea areas between uninhabited islands (Figure 3D). The simulation results of the spatiotemporal changes in the water surface level and flux up to 3 min after the collapse were then stored in the database with a sampling time step of 2-s for the virtual observation stations and three regions A, B, C (Figure 4).
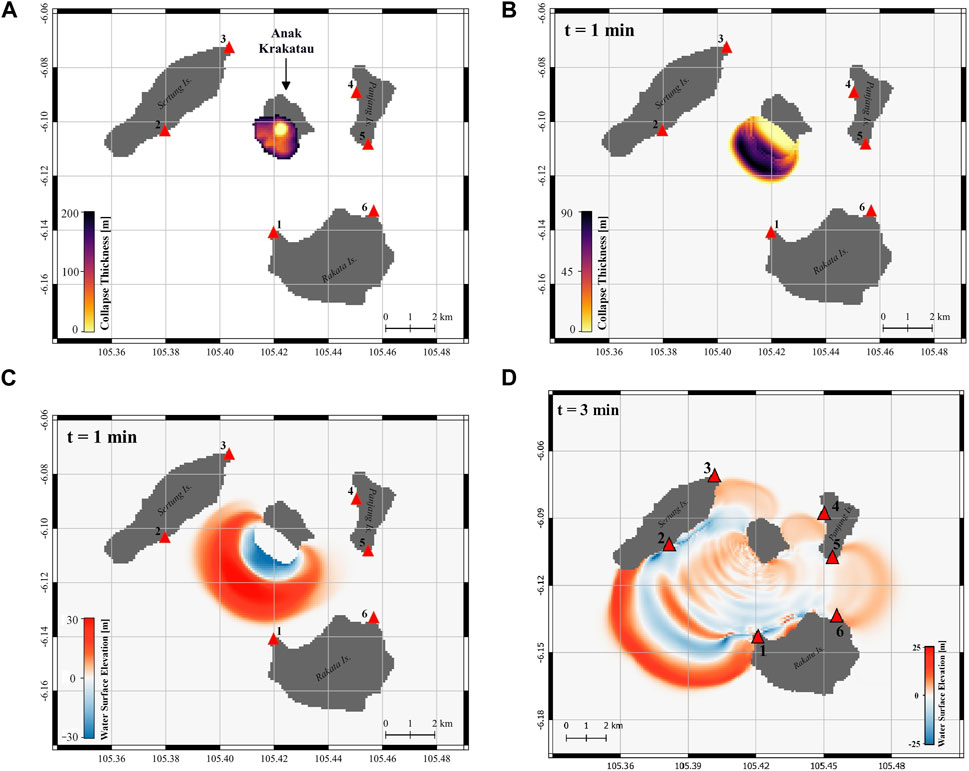
FIGURE 3. Example of a 3-min simulation for pre-computed database. (A) Collapse thickness scenario. (B,C) Landslide and corresponding tsunami propagation for 1 min simulation using VolcFlow model. (D) Subsequent tsunami propagation simulation up to 3 min by Boussinesq model.
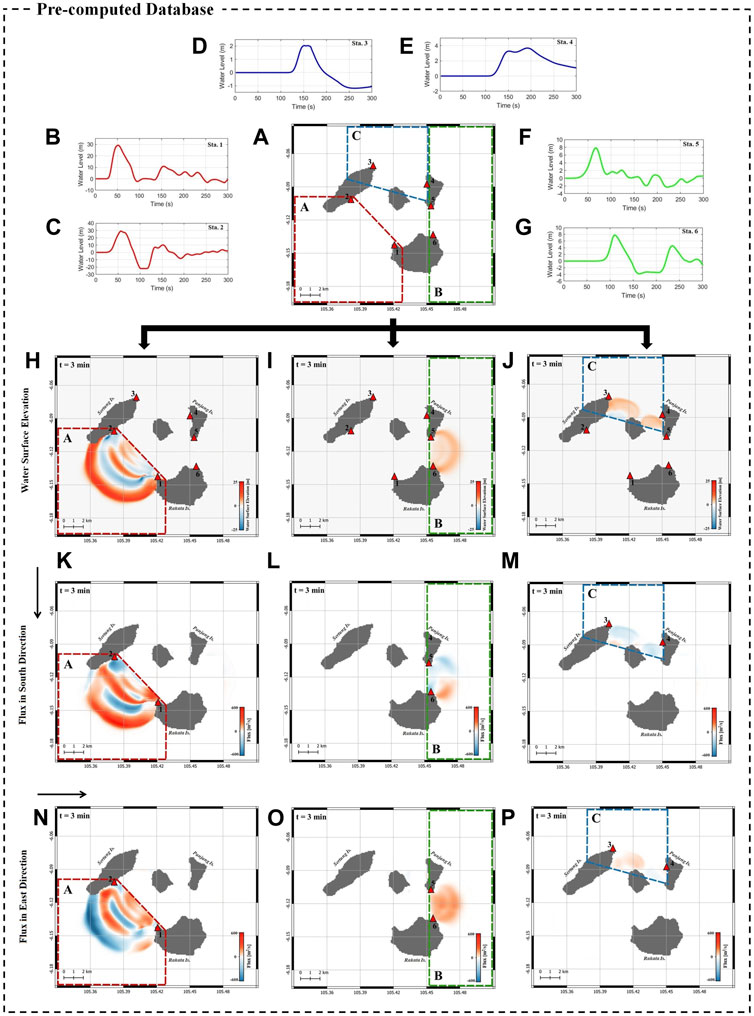
FIGURE 4. Data for the pre-computed database. (A) Three regions A (red-dashed line), B (green-dashed line), and C (blue-dashed line). (B–G) Synthetic waveforms at six virtual observation stations. (H–J) Surface elevation distribution in three regions A, B, C (K–M) Flux distributions in south direction, and (N–P) east direction, in regions A, B, C.
This study considered a tsunami that propagated from an area near the volcano consisting of three separate tsunami elements: tsunami propagating through region A, B, and C (Figure 4A). Each region covers a different pair of two observation stations (Figures 4B–G). At the time of 3 min after the collapse, significant components of the tsunami were located within each region as shown in Figures 4H–P, and similar results were obtained in any assumed scenario. Considering these characteristics, in real-time forecasting strategy, scenario in the database that has the most reasonable waveforms to the observed waveforms is firstly determined as the best scenario. For region A, the best scenario is searched by comparing the observed and pre-computed waveforms at the two virtual stations 1 and 2 located at the end of region A. The changes in the water surface level and flux at the 3 min in region A can therefore be determined based on the best scenario, because they have been computed and stored in the database. Following these, the same analysis is applied to regions B and C. Three collapse scenarios are determined as the best scenario, and these can be identical or different scenarios. By spatially integrating the spatial distributions of water surface level and flux in regions A, B, and C under the identified scenarios at 3 min after the collapse, they can be inputs to a single large-scale tsunami propagation simulation. Real-time tsunami estimation for the coasts of Java and Sumatra can be conducted based on this propagation simulation. This method allows us to conduct real-time tsunami estimation without considering any source in the actual tsunami event associated with a volcanic eruption.
5 Selection of waveforms and initial collapse scenarios
In the real-time application, the most suitable scenarios for each region A, B, and C are identified based on a result from waveform comparison at observation stations. For the comparison, a waveform fitting procedure between pre-computed and observed waveforms at six observation stations with a time window of 100 s is conducted by Root Mean Square Error (RMSE) analyses (Figure 5). The initial collapse time between the actual and pre-computed scenarios might be different. Then, a direct comparison between observed and pre-computed waveforms at observation stations may result in large misfits caused by different tsunami waveform phases (Gusman et al., 2014). To avoid this problem, we applied a time shift procedure by shifting the pre-computed waveforms to the observed waveforms every 2-s. Thus, the optimal pre-computed waveforms with the corresponding scenario were obtained by minimizing the RMSE between the observed and pre-computed waveforms.
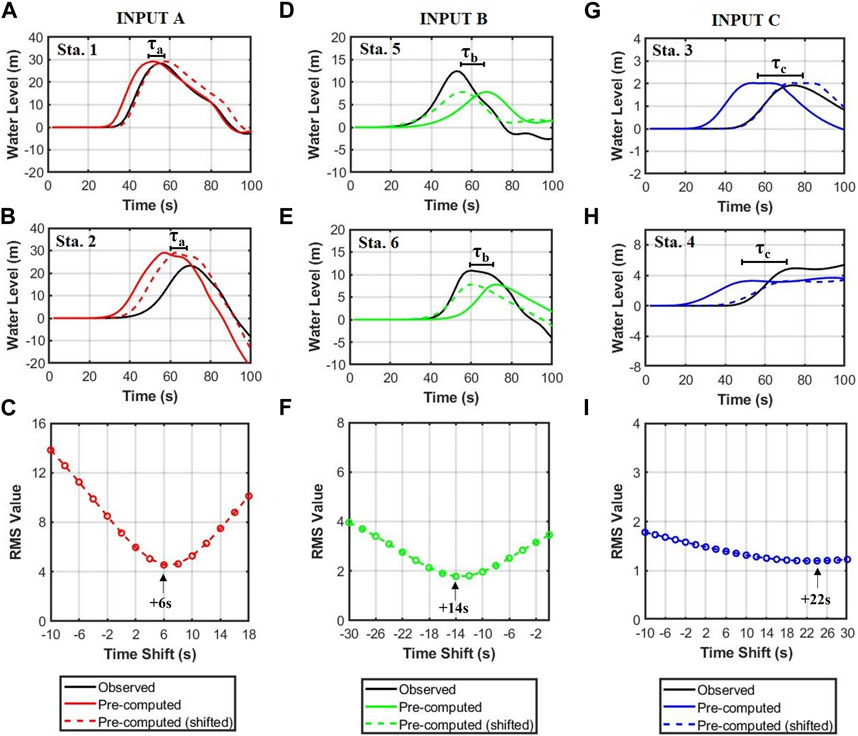
FIGURE 5. Waveform fitting procedure to obtain best combination scenario by RMSE calculation and time-shifting for input A (A–C), Input B (D–F), and Input C (G–I). Black arrows indicate the smallest RMSE misfit with considerable optimal time shift.
In order to obtain the best tsunami wave field to explain the six observed tsunami waveforms, the timing of three scenarios to put in the second type tsunami computation is defined by the time shifts procedure. This process involves comparing pairs of waveforms, resulting in a calculated RMSE value in each region A, B, and C (Figure 5). In region A, we compared the precomputed and observed waveforms at sites 1 and 2 resulted in an identical optimal time shifting value (τa) (Figures 5A–C). In two other regions, the calculation using the data at stations 5 and 6 is for region B (Figures 5D–F), and that using the data at stations 3 and 4 is for region C (Figures 5G–I). Therefore, the most suitable initial collapse scenarios to respectively reproduce the observed waveforms in three regions can be identified through this procedure. Using the identified scenarios and optimal shifting values, we synthesized corresponding spatial distributions of water surface level and flux at 3 min after the collapse by integrating those in three regions A, B, and C.
6 Numerical experiments of tsunami forecasting
The performance of our tsunami forecasting method was assessed in three hypothetical scenarios which considered a represented direction and considerable collapse volume of Anak Krakatau volcano. The hypothetical scenarios were newly assumed for this numerical experiment after the development of database and were not included in the database. To create synthetic waveforms, tsunami under three hypothetical scenarios were calculated based on the similar method described in Section 4.
6.1 Test case 1
The first test case involved a collapse scenario with 0.25 km3 volume, with the main collapse area located in the southern part of the Anak Krakatau volcano. The collapse thickness for this scenario is shown in Figure 6. Krakatau complex has relatively deep water in the southern part of the Anak Krakatau volcano, where the 1,883 post-eruption caldera is situated. The location of Anak Krakatau, which is partially built on the steep edge of the caldera, makes it more unstable and prone to volcanic collapse (Deplus et al., 1995; Giachetti et al., 2012).
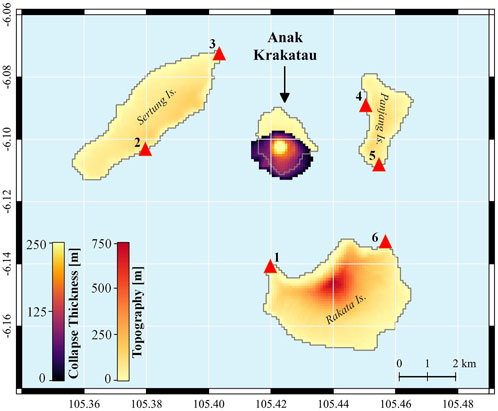
FIGURE 6. Hypothetical collapse scenario with total collapse volume of 0.25 km3 for the Test Case 1.
By applying the procedure for real-time forecasting, we compared the synthetic and pre-computed waveforms at the six virtual observation stations. Waveform fitting analyses by RMSE misfit calculation was then performed to obtain the initial condition for the regions A, B, and C. Based on the waveform fitting result, we obtain the best combination scenario for inputs A, B and C, that is, SC2 (0.19 km3), SC7 (0.12 km3), and SC8 (0.07 km3), with optimal time shifts of +4, +4, and +22 s, respectively (Supplementary Figure S3). The surface elevation and flux distributions at the time of 3 min in those three scenarios inside the database were then used as the initial conditions for the large-scale tsunami propagation simulation by the Boussinesq model. Tsunami propagation at 3.5 min is shown in Figure 7. The forecasted waveforms were compared to the synthetic waveforms (i.e., observation in the real case) from the forward numerical modeling at five locations (Figure 8). The comparison showed that the first tsunami peak and maximum amplitude generally matched well with the observations at the five locations. From this hypothetical scenario, the significant tsunami height was forecasted at Tanjung Lesung, Marina Jambu, and Ciwandan stations with maximum amplitudes of 3.8, 1.2, and 0.5 m, while smaller maximum amplitude of 0.3 and 0.2 m were forecasted at Kota Agung and Panjang stations, respectively.
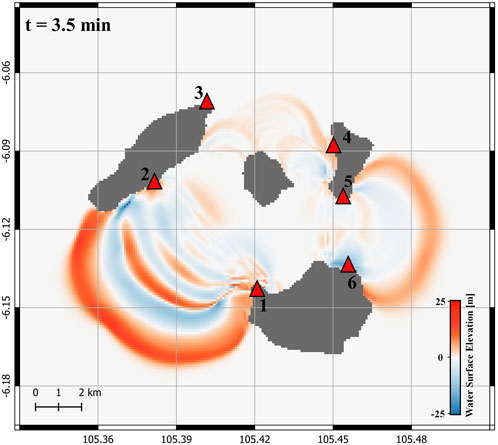
FIGURE 7. Tsunami propagation at 3.5 min using the initial condition from the best combination scenarios from the database for Test Case 1.
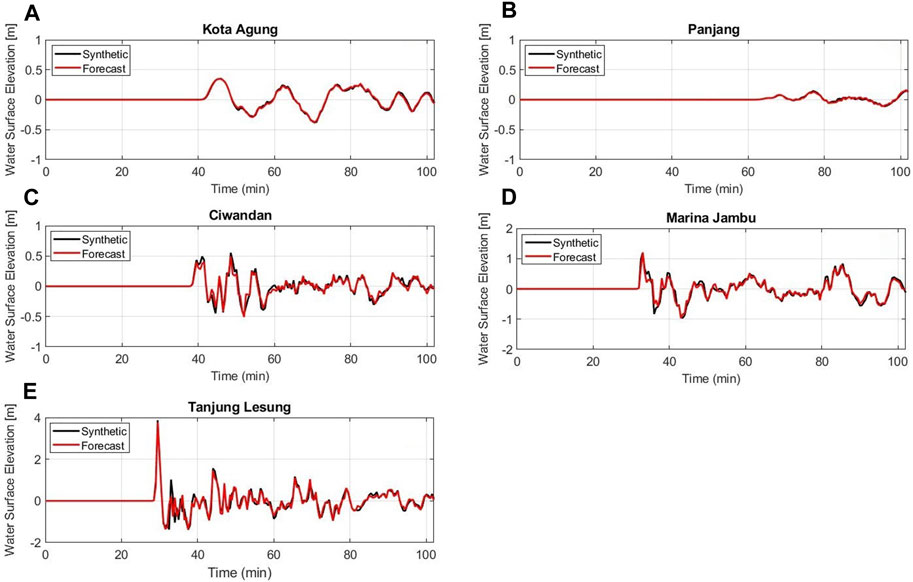
FIGURE 8. Comparison between synthetic and forecasted waveforms from Test Case 1 at five locations: (A) Kota Agung, (B) Panjang, (C) Ciwandan, (D) Marina Jambu, and (E) Tanjung Lesung.
6.2 Test case 2
Volcanic edifices are naturally unstable because of the continuous change and accumulation rates of volcanic deposits (Paris, 2015). Therefore, mass failures can occur in different parts of the volcano with various scales. Considering the potential collapse variety, we assumed a different hypothetical scenario for Case 2 to further assess the performance of our method. In this case, we created a sector collapse scenario with a total collapse volume of 0.21 km3, with the collapse area concentrated in the eastern part of the volcano (Figure 9). Subsequently, a numerical simulation was conducted through the same process as the previous test case.
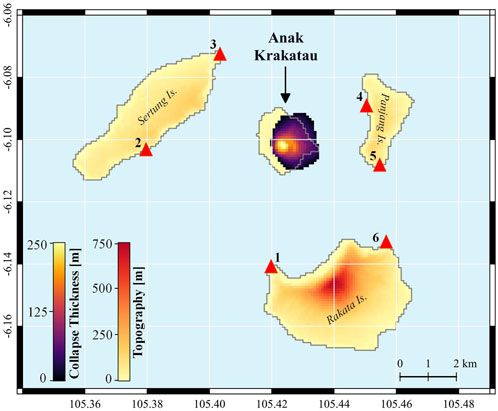
FIGURE 9. Hypothetical collapse scenario with total collapse volume of 0.21 km3 for Test Case 2.
The waveform fitting results indicated a combination of SC8 (0.07 km3), SC8 (0.07 km3), and SC5 (0.25 km3) as the most suitable inputs A, B, and C, respectively (Supplementary Figure S4). The surface elevation and flux distribution at 3 min provided by the best combination of scenarios with optimal time shift of +14 s, −6 s, and −14 s were used as the initial conditions for the large-scale simulation. The tsunami propagation at 3.5 min can be seen in Figure 10. For validation, we compared the forecasted waveforms from our method with synthetic waveforms acquired from forward numerical modeling at the five tide gauge stations (Figure 11). The comparison showed that the first tsunami peak and maximum amplitude generally matched well with the simulated waveforms at the five locations. At Kota Agung and Panjang, the forecasted waveforms were slightly ahead of the arrival time compared with the synthetic waveforms. In this second case, although there were small discrepancies in the tsunami arrival time, we considered that the forecasted waveforms were generally acceptable for real-time tsunami warnings.
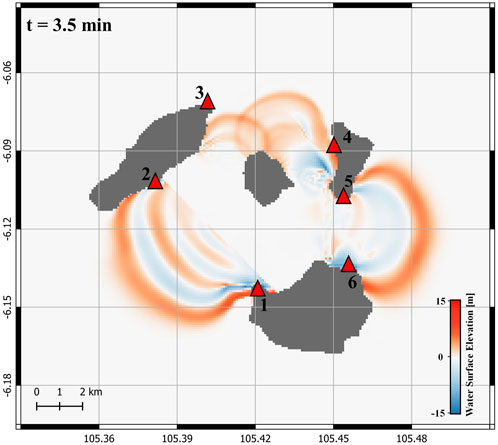
FIGURE 10. Tsunami propagation at 3.5 min using the initial condition from the best combination scenarios from the database for Test Case 2.
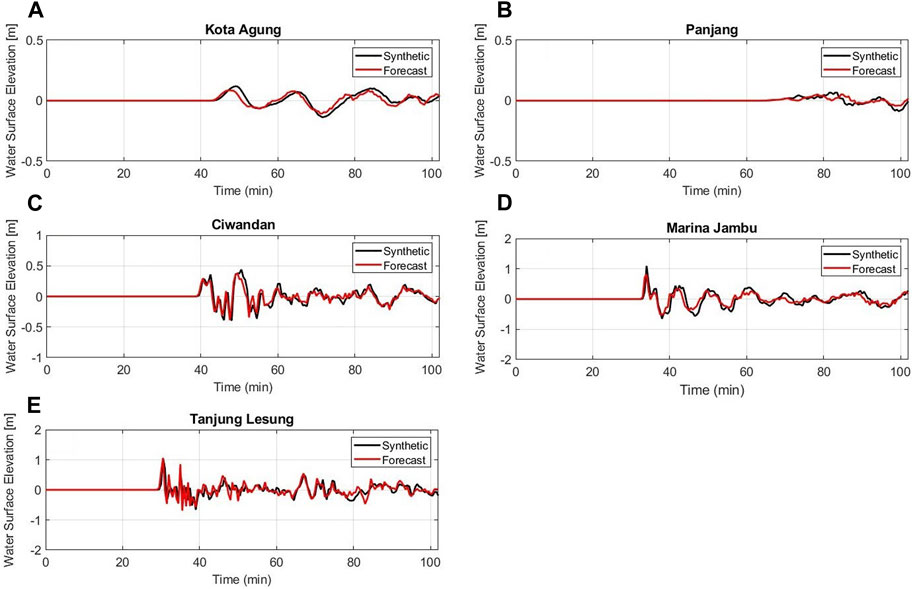
FIGURE 11. Comparison between synthetic and forecasted waveforms from Test Case 2 at five tide gauge locations: (A) Kota Agung, (B) Panjang, (C) Ciwandan, (D) Marina Jambu, and (E) Tanjung Lesung.
6.3 Test case 3
Considering a collapse scenario with various directions and volumes, we initiated the last hypothetical collapse scenario to evaluate the accuracy of our tsunami forecasting method throughout same process with two previous cases. This last hypothetical scenario involved a volcanic collapse volume of 0.20 km3 with the main collapse situated in the northwest part of Anak Krakatau volcano. The collapse thickness of the hypothetical scenario of Case 3 is shown in Figure 12.

FIGURE 12. Hypothetical collapse scenario with total collapse volume of 0.20 km3 for Test Case 3.
Waveform fitting and RMSE misfit analyses suggested a combination scenario of SC16 (0.03 km3), SC16 (0.03 km3), and SC13 (0.13 km3), with optimal time shift of 0, +14, and 0 s, respectively, as initial condition (Supplementary Figure S5). The large-scale tsunami simulation was conducted using surface elevation and flux distribution from the combination of the best scenarios as initial conditions. Figure 13 shows the tsunami propagation at 3.5 min. A comparison between the synthetic (i.e., observation in the real case) and forecasted waveforms at the five locations for Case 3 is shown in Figure 14. The results indicated that the tsunami arrival time was explained well by the forecasted waveforms. However, the forecasted tsunami waveforms from our simulation were slightly underestimated at the five tide gauge locations. This was possibly caused by lack of scenario variations in the database, so that the initial condition in the final simulation is not at optimum combination.
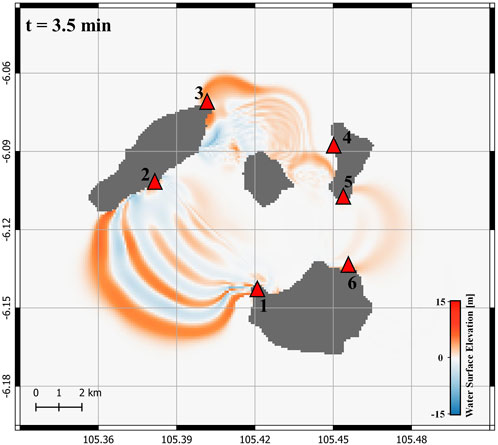
FIGURE 13. Tsunami propagation at 3.5 min using the initial condition from the best combination scenarios from the database for Test Case 3.
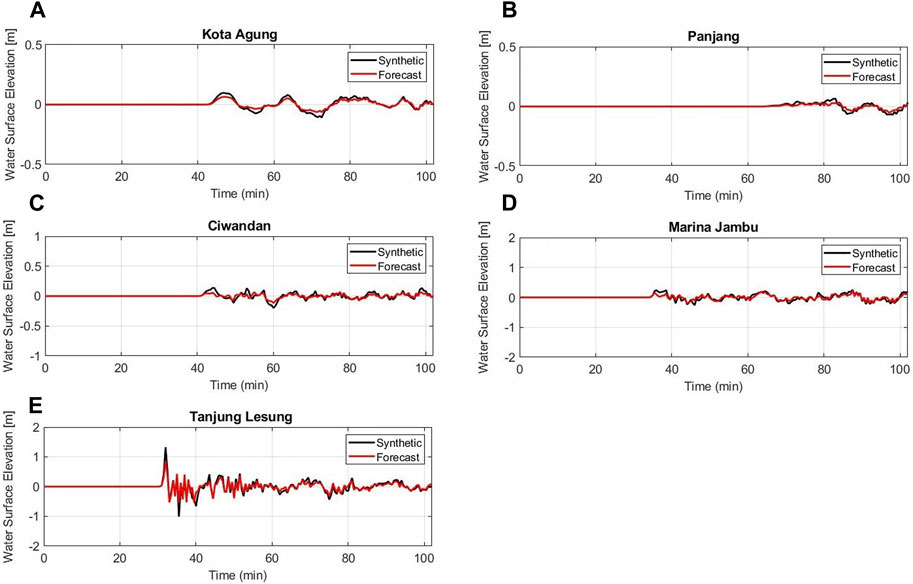
FIGURE 14. Comparison between synthetic and forecasted waveforms from Test Case 3 at five tide gauge locations: (A) Kota Agung, (B) Panjang, (C) Ciwandan, (D) Marina Jambu, and (E) Tanjung Lesung.
7 Discussion
We demonstrated our forecasting method through a numerical experiment using three test cases for Anak Krakatau sector collapse. In our method, we divided the Anak Krakatau complex into three regions A, B, and C, then, determined the best scenario for each region as initial conditions. As shown in the test cases, we obtained appropriate tsunami forecasts along the coast even though the collapse scenarios for the test cases were not inside the database. This method allows us to forecast the tsunami without knowing the detailed information of the collapse source.
The existence of observation stations has become important as they are useful for tsunami forecasting and rapid tsunami detection. A study to investigate the forecasting performance by assimilating offshore observation data and high-frequency radar in the case of Tonga eruption was conducted by Wang et al. (2023). They tested the method that resulted in high forecast accuracy for tsunami warning. Here, we proposed a real-time forecasting method based on a pre-computed database and utilization of observation stations near the source for Anak Krakatau volcano. Our method required at least 100 s of observed waveforms at six observation stations to conduct waveform fitting. A suitable observation station should then be considered in the application of our methods. Various observation networks designated for small to extremely high tsunamis are available and actively operated in Japan. Pressure sensors to observe huge tsunamis were installed along the Japanese coasts (Tsuruoka et al., 2015). Time series of water surface level at the site where the sensor was installed can be estimated from observed pressure data. In 2011, the sensors observed the pressure changes due to the 2011 Tohoku tsunami. The corresponding water surface level changes were successfully estimated at each station although the observations were lacked in some time periods (Japan Meteorological Agency, 2012). A waveform of the tsunami with a peak height of ∼10 m was also observed at a coastal station (Soma station). Applying this, the output value from the pressure sensor can be sent via a dedicated cable to the tide gauge converter that is placed separately in higher elevation area. Finally, the output data is transmitted via satellite to the monitoring center (Tsuruoka et al., 2015). Adopted such a pressure sensor, an essential information such as initial tsunami waveforms that are needed in our method can be provided.
After the 2018 tsunami event, Anak Krakatau volcano continuously showed intense volcanic activity. Considering the high volcanic activity, the topography of Anak Krakatau has changed over time. In this study, we built a pre-computed database using topography from the pre-collapse state of the 2018 Anak Krakatau tsunami to demonstrate our methods. However, in the real application of this method, it is important to frequently renew the topographic data of Anak Krakatau and use it to update the pre-computed database. Moreover, the number of scenarios in the database should be considered as another important factor. In the present study, we created 16 collapse scenarios with various volumes and collapse areas. A higher accuracy of the proposed method can be achieved by increasing the number of collapse scenarios in the database. However, large numbers of scenarios may require more time in the selection process of initial conditions for the real-time simulation. In the implementation of this method, it is important to find the optimal number of collapse scenarios in the database as the Anak Krakatau volcano grows rapidly over time.
8 Conclusion
The tsunami generation and propagation models in this study were carefully tested by performing a numerical simulation of the 2018 Anak Krakatau tsunami and were validated with observed waveforms at four tide gauge stations. For future disaster mitigation strategies, we propose a real-time tsunami forecasting method based on the pre-computed database for the Anak Krakatau volcanic tsunamis in Indonesia. Numerical experiments for the three test cases showed that our method could efficiently produce appropriate tsunami forecasts in the vicinity of the Sunda Strait. Moreover, by implementing our method, we can estimate real-time tsunamis generated by volcanic activity of Anak Krakatau without information on source mechanisms.
Data availability statement
The datasets presented in this study can be found in online repositories. The names of the repository/repositories and accession number(s) can be found below: The original recorded tide gauge data: (http://tides.big.go.id) and the Indonesian bathymetry and topography data (https://tanahair.indonesia.go.id/demnas/#/).
Author contributions
RR performed all computations and wrote the original manuscript. YT and RR conceptualized the idea, analyzed, and discussed the results. YY built and provided the non-linear dispersive code and discussed the research outcomes. IM demonstrated the use of the VolcFlow model and provided the collapse thickness data for the 2018 tsunami event. All authors contributed to the article and approved the submitted version.
Funding
This study was supported by JSPS KAKENHI Grant Number: JP19H0197, JST SPRING Grant Number: JPMJSP2119, and The Ministry of Education, Culture, Sports, Science and Technology (MEXT) of Japan under its the Second Earthquake and Volcano Hazards Observation and Research Program (Earthquake and Volcano Hazard Reduction Research).
Acknowledgments
We thank the editor and reviewers for their valuable comments to improve our manuscript. We thank to Karim Kelfoun for providing the VolcFlow codes and Geospatial Information Agency of Indonesia (BIG) for providing the tide gauge, bathymetry and topography data.
Conflict of interest
The authors declare that the research was conducted in the absence of any commercial or financial relationships that could be construed as a potential conflict of interest.
The reviewer YW declared a past co-authorship with the author IM to the handling editor.
Publisher’s note
All claims expressed in this article are solely those of the authors and do not necessarily represent those of their affiliated organizations, or those of the publisher, the editors and the reviewers. Any product that may be evaluated in this article, or claim that may be made by its manufacturer, is not guaranteed or endorsed by the publisher.
Supplementary material
The Supplementary Material for this article can be found online at: https://www.frontiersin.org/articles/10.3389/feart.2023.1213493/full#supplementary-material
References
Camus, G., Gourgaud, A., and Vincent, P. M. (1987). Petrologic evolution of Krakatau (Indonesia): implications for a future activity. J. Volcanol. Geotherm. Res. 33 (4), 299–316. doi:10.1016/0377-0273(87)90020-5
Deplus, C., Bonvalot, S., Dahrin, D., Diament, M., Harjono, H., and Dubois, J. (1995). Inner structure of the Krakatau volcanic complex (Indonesia) from gravity and bathymetry data. J. Volcanol. Geotherm. Res. 64 (1–2), 23–52. doi:10.1016/0377-0273(94)00038-I
Giachetti, T., Paris, R., Kelfoun, K., and Ontowirjo, B. (2012). Tsunami hazard related to a flank collapse of Anak Krakatau volcano, Sunda Strait, Indonesia. Geol. Soc. Spec. Publ. 361 (1), 79–90. doi:10.1144/SP361.7
Giachetti, T., Paris, R., Kelfoun, K., and Pérez-Torrado, F. J. (2011). Numerical modelling of the tsunami triggered by the Güìmar debris avalanche, Tenerife (Canary Islands): comparison with field-based data. Mar. Geol. 284 (1–4), 189–202. doi:10.1016/j.margeo.2011.03.018
Glimsdal, S., Pedersen, G. K., Harbitz, C. B., and Løvholt, F. (2013). Dispersion of tsunamis: does it really matter? Nat. Hazards Earth Syst. Sci. 13, 1507–1526. doi:10.5194/nhess-13-1507-2013
Grilli, S. T., Shelby, M., Kimmoun, O., Dupont, G., Nicolsky, D., Ma, G., et al. (2017). Modeling coastal tsunami hazard from submarine mass failures: effect of slide rheology, experimental validation, and case studies off the US east coast. Nat. Hazards 86 (1), 353–391. doi:10.1007/s11069-016-2692-3
Grilli, S. T., Tappin, D. R., Carey, S., Watt, S. F. L., Ward, S. N., Grilli, A. R., et al. (2019). Modelling of the tsunami from the december 22, 2018, lateral collapse of Anak Krakatau volcano in the Sunda straits, Indonesia. Sci. Rep. 9 (1), 11946–12015. doi:10.1038/s41598-019-48327-6
Gusman, A. R., Tanioka, Y., MacInnes, B. T., and Tsushima, H. (2014). Journal of geophysical research: solid Earth. J. Geophys. Res. Solid Earth 120, 1195–1209. doi:10.1002/2014JB011376
Harbitz, C. B., Løvholt, F., Pedersen, G., and Masson, D. G. (2006). Mechanisms of tsunami generation by submarine landslides: A short review. Nor. J. Geol. 86 (3), 255–264.
Harig, S., Immerz, A., Weniza, S., Griffin, J., Weber, B., Babeyko, A., et al. (2020). The tsunami scenario database of the Indonesia tsunami early warning system (InaTEWS): evolution of the coverage and the involved modeling approaches. Pure Appl. Geophys. 177, 1379–1401. doi:10.1007/s00024-019-02305-1
Heidarzadeh, M., Ishibe, T., Sandanbata, O., Muhari, A., and Wijanarto, A. B. (2020b). Numerical modeling of the subaerial landslide source of the 22 December 2018 Anak Krakatoa volcanic tsunami, Indonesia. Ocean. Eng. 195, 106733. doi:10.1016/j.oceaneng.2019.106733
Heidarzadeh, M., Putra, P. S., Nugroho, S. H., and Rashid, D. B. Z. (2020a). Field survey of tsunami heights and runups following the 22 December 2018 Anak Krakatau Volcano tsunami, Indonesia. Pure Appl. Geophys. 177 (10), 4577–4595. doi:10.1007/s00024-020-02587-w
Hunt, J. E., Tappin, D. R., Watt, S. F. L., Susilohadi, S., Novellino, A., Ebmeier, S. K., et al. (2021). Submarine landslide megablocks show half of Anak Krakatau island failed on December 22nd, 2018. Nat. Commun. 12 (1), 2827. doi:10.1038/s41467-021-22610-5
Japan Meteorological Agency (2012). Report on the 2011 off the pacific coast of Tohoku earthquake, chapter 2: tsunami, technical report of the Japan meteorological agency 133. Avaliable At: https://www.jma.go.jp/jma/kishou/books/gizyutu/133/CHAPTER2.
Kelfoun, K., and Druitt, T. H. (2005). Numerical modeling of the emplacement of Socompa rock avalanche, Chile. J. Geophys. Res. Solid Earth 110 (12), B12202–B12213. doi:10.1029/2005JB003758
Kelfoun, K., Giachetti, T., and Labazuy, P. (2010). Landslide-generated tsunamis at réunion island. J. Geophys. Res. Earth Surf. 115 (4), F04012. doi:10.1029/2009JF001381
Maeda, T., Obara, K., Shinohara, M., Kanazawa, T., and Uehira, K. (2015). Successive estimation of a tsunami wavefield without earthquake source data: A data assimilation approach toward real-time tsunami forecasting. Geophys. Res. Lett. 42 (19), 7923–7932. doi:10.1002/2015GL065588
Muhari, A., Heidarzadeh, M., Susmoro, H., Nugroho, H. D., Kriswati, E., Imamura, F., et al. (2019). The december 2018 Anak Krakatau volcano tsunami as inferred from post-tsunami field surveys and spectral analysis. Pure Appl. Geophys. 176 (12), 5219–5233. doi:10.1007/s00024-019-02358-2
Mulia, I. E., Watada, S., Ho, T. C., Satake, K., Wang, Y., and Aditiya, A. (2020). Simulation of the 2018 Tsunami due to the flank failure of Anak Krakatau Volcano and implication for future observing systems. Geophys. Res. Lett. 47 (14). doi:10.1029/2020GL087334
Paris, A., Heinrich, P., Paris, R., and Abadie, S. (2020). The december 22, 2018, Anak Krakatau, Indonesia, landslide and tsunami: preliminary modeling results. Pure Appl. Geophys. 177 (2), 571–590. doi:10.1007/s00024-019-02394-y
Paris, A., Okal, E. A., Guérin, C., Heinrich, P., Schindelé, F., and Hébert, H. (2019). Numerical modeling of the june 17, 2017, landslide and tsunami events in karrat fjord, west Greenland. Pure Appl. Geophys. 176 (7), 3035–3057. doi:10.1007/s00024-019-02123-5
Paris, R., Giachetti, T., Chevalier, J., Guillou, H., and Frank, N. (2011). Tsunami deposits in Santiago Island (Cape Verde archipelago) as possible evidence of a massive flank failure of Fogos volcano. Sediment. Geol. 239 (3–4), 129–145. doi:10.1016/j.sedgeo.2011.06.006
Paris, R. (2015). Source mechanisms of volcanic tsunamis. Philosophical Trans. R. Soc. A Math. Phys. Eng. Sci. 373 (2053), 20140380–20140415. doi:10.1098/rsta.2014.0380
Ren, Z., Wang, Y., Wang, P., Hou, J., Gao, Y., and Zhao, L. (2020). Numerical study of the triggering mechanism of the 2018 Anak Krakatau tsunami: eruption or collapsed landslide? Nat. Hazards 102, 1–13. doi:10.1007/s11069-020-03907-y
Simkin, T., and Fiske, R. S. (1983). Krakatau 1883 eruption and its effects. Washington, D. C: Smithson. Inst., 464.
Sudrajat, A. (1982). The morphological development of Anak Krakatau volcano, Sunda Strait. Geol. Indonesia 9, 1–11.
Tanioka, Y., Gusman, A. R., Ioki, K., and Nakamura, Y. (2014). Real-time tsunami inundation forecast for a recurrence of 17th century great Hokkaido earthquake in Japan. J. Disaster Res. 9 (3), 358–364. doi:10.20965/jdr.2014.p0358
Tanioka, Y. (2020). Improvement of near-field tsunami forecasting method using ocean-bottom pressure sensor network (S-net). Earth Planets Space 72, 132. doi:10.1186/s40623-020-01268-1
Tappin, D. R., Grilli, S. T., Harris, J. C., Geller, R. J., Masterlark, T., Kirby, J. T., et al. (2014). Did a submarine landslide contribute to the 2011 Tohoku tsunami? Mar. Geol. 357, 344–361. doi:10.1016/j.margeo.2014.09.043
Tsuruoka, A., Suzuki, H., Marutani, M., and Nakadate, A. (2015). Tide and tsunami observation system in JMA. Sokkou-jihou 82, S105–S123. Avaliable At: https://www.jma.go.jp/jma/kishou/books/sokkou-kaiyou/82/vol82s105.pdf.
Tsushima, H., Hirata, K., Hayashi, Y., Tanioka, Y., Kimura, K., Sakai, S., et al. (2011). Near-field tsunami forecasting using offshore tsunami data from the 2011 off the Pacific coast of Tohoku Earthquake. Earth, Planets Space 63 (7), 821–826. doi:10.5047/eps.2011.06.052
Wang, Y., Imai, K., Mulia, I. E., Ariyoshi, K., Takahashi, N., Sasaki, K., et al. (2023). Data assimilation using high-frequency radar for tsunami early warning: A case study of the 2022 Tonga volcanic tsunami. J. Geophys. Res. Solid Earth 128 (2), 1–12. doi:10.1029/2022JB025153
Ward, S. N., and Day, S. (2001). Cumbre vieja volcano-potential collapse and tsunami at La palma, canary islands. Geophys. Res. Lett. 28 (17), 3397–3400. doi:10.1029/2001GL013110
Williams, R., Rowley, P., and Garthwaite, M. C. (2019). Reconstructing the Anak Krakatau flank collapse that caused the December 2018 Indonesian tsunami. Geology 47 (10), 973–976. doi:10.1130/G46517.1
Yamanaka, Y., and Tanioka, Y. (2017). Estimating the topography before volcanic sector collapses using tsunami survey data and numerical simulations. Pure Appl. Geophys. 174 (8), 3275–3291. doi:10.1007/s00024-017-1589-8
Keywords: real-time forecasting, volcano, eruption, tsunami, Anak Krakatau
Citation: Ratnasari RN, Tanioka Y, Yamanaka Y and Mulia IE (2023) Development of early warning system for tsunamis accompanied by collapse of Anak Krakatau volcano, Indonesia. Front. Earth Sci. 11:1213493. doi: 10.3389/feart.2023.1213493
Received: 28 April 2023; Accepted: 23 August 2023;
Published: 06 September 2023.
Edited by:
Hans-Balder Havenith, University of Liège, BelgiumReviewed by:
Yosuke Aoki, The University of Tokyo, JapanYuchen Wang, Japan Agency for Marine-Earth Science and Technology (JAMSTEC), Japan
Copyright © 2023 Ratnasari, Tanioka, Yamanaka and Mulia. This is an open-access article distributed under the terms of the Creative Commons Attribution License (CC BY). The use, distribution or reproduction in other forums is permitted, provided the original author(s) and the copyright owner(s) are credited and that the original publication in this journal is cited, in accordance with accepted academic practice. No use, distribution or reproduction is permitted which does not comply with these terms.
*Correspondence: Rinda Nita Ratnasari, cmluZGEubml0YXJhdG5hc2FyaS5oMkBlbG1zLmhva3VkYWkuYWMuanA=