 Purushottam Kumar Garg1*†
 Manish Mehta2
 Aparna Shukla3
 Pankaj Chauhan2
 Kapil Kesarwani4
 Sandipan Mukherjee1
- 1G.B. Pant National Institute of Himalayan Environment, Ladakh Regional Centre, Leh, Ladakh UT, India
- 2Wadia Institute of Himalayan Geology, Dehradun, Uttarakhand, India
- 3Ministry of Earth Sciences, New Delhi, India
- 4G.B. Pant National Institute of Himalayan Environment, Almora, Uttarakhand, India
Supraglacial debris cover greatly influences glacier dynamics. The present study combines field and remote sensing observations acquired between 2000 and 2020 to understand debris characteristics, area and terminus changes, surface velocity, and mass balance of the Companion Glacier, Central Himalaya, along with a systematic investigation of its supraglacial morphology. According to field observations, the glacier’s lower ablation zone has very coarse and thick debris (1–3 m). Owing to thick debris and consequent protected margins, the glacier could maintain its geometry during the study (2000–2020) showing much less area loss (0.07% ±0.1% a−1) and terminus retreat (1.2 ±1.9 m a−1) than other glaciers in the study region. The average mass balance (−0.12 ±0.1 m w. e. a−1; 2000–2020) was also less negative than the regional trend. Interestingly, in contrast to widespread regional velocity reduction, Companion’s average velocity increased (by 21%) from 6.97 ±3.4 (2000/01) to 8.45 ±2.1 m a−1 (2019/20). Further, to investigate supraglacial morphology, the glacier ablation zone is divided into five zones (Zone-I to V; snout-to-up glacier) based on 100 m altitude bins. Analysis reveals that stagnation prevails over Zone-I to Zone-III, where despite slight acceleration, the velocity remains <∼8 m a−1. Zone-V is quite active (12.87 ±2.1 m a−1) and has accelerated during the study. Thus, Zone-IV with stable velocity, is sandwiched between fast-moving Zone-V and slow-moving Zone-III, which led to bulging and development of mounds. Debris slides down these mounds exposing the top portion for direct melting and the meltwater accumulates behind the mounds forming small ponds. Thus, as a consequence of changing morphology, a new ablation mechanism in the form of spot-melting has dominated Zone-IV, leading to the highest negative mass balance here (−0.5 ±0.1 m w. e. a−1). The changing snout and supraglacial morphology, active mound-top’s melting and formation of ponds likely promote relatively higher glacier wastage in the future.
1 Introduction
Globally, 7.3% of the area of mountain glaciers is debris-covered (Herreid and Pellicciotti, 2020). In the Himalaya, debris-covered glaciers are widespread, constituting about 10% of the total ice cover (Bolch et al., 2012), whereas debris cover in the ablation zones (i.e., glacier area below the equilibrium line) reaches ∼40% (Sharma et al., 2016). In mountainous regions, debris is usually derived from the surrounding valley walls and added to the glacier system through various processes, e.g., rockfalls, surface melting, small landslides, or avalanches (Evatt et al., 2015; van Woerkom et al., 2019; Miles et al., 2020). If the debris transfer mechanism of the glacier is not efficient, the debris accumulates in the ablation zone of the glacier (Shroder et al., 2000). The combination of steep and gentle slopes over accumulation and ablation areas of a glacier also promotes debris accumulation, leading to the formation of a debris-covered glacier (Scherler et al., 2011). Miles et al. (2020) have defined debris-covered glaciers as “glaciers with a largely continuous layer of supraglacial debris over most of the ablation area, typically increasing in thickness towards the terminus”. Accordingly, the typical debris thickness distribution on debris-covered glaciers is such that it decreases a) from the snout toward the upglacier, and b) from the margins toward the center (Anderson and Anderson, 2018). The debris has the ability to increase or decrease melt rates depending on its thickness (östrem, 1959; Nicholson and Benn, 2006; Reznichenko et al., 2010; Nicholson et al., 2018; Zhang et al., 2019; 2022). As a result, case a) offsets the impact of higher temperatures at lower altitudes, inverting the ablation gradient and causing higher lowering upglacier (Benn et al., 2012; Vijay and Braun, 2018). Case b) promotes higher melting along the central portion of the glacier; consequently, concavities develop, which may lead to the development and widening of supraglacial channels (Pratap et al., 2015; Mölg et al., 2020; Garg et al., 2022b). Uneven melting on a spatial scale caused by heterogeneous debris thickness distribution facilitates the development of ice cliffs (Sakai et al., 2002) and hummocky topography (Miles et al., 2020). Therefore, debris cover not only influences the overall mass balance of a glacier but also regulates the evolution of its supraglacial morphology (Benn et al., 2012; Pratap et al., 2015; Rowan et al., 2015; Miles et al., 2020; Mölg et al., 2020; Bartlett et al., 2021; Garg et al., 2022b). In view of prevailing negative glacier mass balance conditions in the Himalaya (Kääb et al., 2015; Brun et al., 2017; Azam et al., 2018; Maurer et al., 2019; Shean et al., 2020) debris-covered glaciers likely undergo morphological changes, which need to be examined carefully (Kirkbride and Deline, 2013; Fyffe et al., 2020). However, only a few studies have investigated the supraglacial morphology of debris-covered glaciers in order to improve our understanding of glacier evolution on a spatial and temporal scale (Pratap et al., 2015; Mölg et al., 2020; Bartlett et al., 2021; Garg et al., 2022a; 2022b). In the Central Himalaya, about 12%–15% of the glacierized area is covered by debris (Bolch et al., 2012; Kraaijenbrink et al., 2017) with competitively higher debris proportion over northern slopes (Scherler et al., 2011). Interestingly, Scherler et al. (2011) noted that the population of glaciers having >20% debris cover among glaciers studied by them is 67% in the central Himalaya which is the second highest (after Hindu-Kush; 74%) in the entire High Mountain Asia (HMA). The previous studies suggested that most of Central Himalayan debris-covered glaciers retreated at a slower rate but the local mass balance of debris-covered glaciers is distinctly non-linear and non-monotonic with respect to the topographic parameters (Dobhal et al., 2013; Pratap et al., 2015). Many debris-covered glaciers are retreating relatively slowly, e.g., Dunagiri (3 m a−1), Chorabari (6 m a−1), Shankulpa (6.8 m a−1), Bhagirathi Kharak (1.5 m a−1), but many others are retreating at faster rates of up to 25 m a−1 (Vohra, 1981; Swaroop et al., 2001; Nainwal et al., 2008; Dobhal et al., 2013). Garg et al. (2017a) studied 18 glaciers in Uttarakhand (an Indian state), central Himalaya. and reported an average debris cover of 28% in 1990 which increased to 34% in 2015. The low average terminus retreat (12 m a−1) and area loss (3% m a−1) over debris-covered glacier was also reported by Garg et al. (2017a) against high average retreat (21 m a−1) and area loss (4% a−1) over clean glaciers. Bandyopadhyay et al. (2019) computed the geodetic mass balance for the Upper Ganga basin for the 2000–2014 period and found reduced melt rates over debris-covered glaciers. They specifically highlighted that the surface lowering over the thickly debris-covered (>1 m) ablation zone of the Charobari Glacier was moderately lower. Changing glacier morphology coupled with spatially heterogeneous mass loss owing to differential debris thickness distribution is also reported from the Dokriani Glacier in the central Himalaya (Garg et al., 2022b). Nevertheless, interlinkage between various supraglacial processes that may influence the overall glacier evolution is rarely explored.
The present study investigates a debris-covered glacier in the Central Himalaya in terms of mass balance, surface ice velocity, and debris thickness distribution and examines its morphology using dedicated field-based and remote sensing observations. The specific objectives of the paper are to a) quantify glacier dimensional changes, mass balance, and surface ice velocity (SIV) of the Companion Glacier, central Himalaya, and b) assess the impact of debris on glacier mass balance, ablation pattern, and supraglacial morphology. The present study will help better understand the complex interplay between various glacier parameters and supraglacial processes that influence the overall evolution of debris-covered glaciers which supply a notable proportion of fresh water in the HMA. The broader scientific understanding of glacial behavior in high-altitude regions supports global efforts to mitigate the impacts of climate change on vulnerable ecosystems and communities. Thus, the study’s findings are expected to serve as an essential foundation for predicting future water supplies in the region and formulating effective adaptation strategies to cope with the challenges posed by climate change.
2 Study area
The present study focuses on the ‘Companion Glacier’ (snout coordinates: 30°44′34″N, 79°04′10″E) located in the Mandakini valley of the Alaknanda catchment, a tributary of the Ganga River. The Companion Glacier got its name from its proximity to the Chorabari Glacier (a well-studied glacier in the Central Himalaya). Companion Glacier is a small glacier with a total area of only 2.11 ± 0.1 km2 (in 2020), and it descends from an altitude of 5,333 m above sea level (asl) and terminates at 3,757 m asl. By 2020, about 63% of the glacier surface was covered with debris ranging in size from a few millimeters to big boulders exceeding several meters in diameter. The glacier is oriented north-south, with the snout facing south. The average surface gradient of the glacier is 29.7° with a gentle (12.7°) ablation zone and steep (36.8°) upper portion (>4,200 m asl; marked with white hatching in Figure 1). The meltwater stream originating from the Companion Glacier is called ‘Saraswati’ which meets the Mandakini River (originated from the Chorabari Glacier, the largest glacier of the Mandakini valley) in the downstream area after a short distance of 1.5 km (Figure 1). The general climate of the study area is dry–cold in winter and humid–temperate in summer. It alternatively receives precipitation from the mid-latitude westerlies during winter and Indian Summer Monsoon during summer (Bookhagen and Burbank, 2010; Burbank et al., 2012; Mehta et al., 2012; Dobhal et al., 2013).
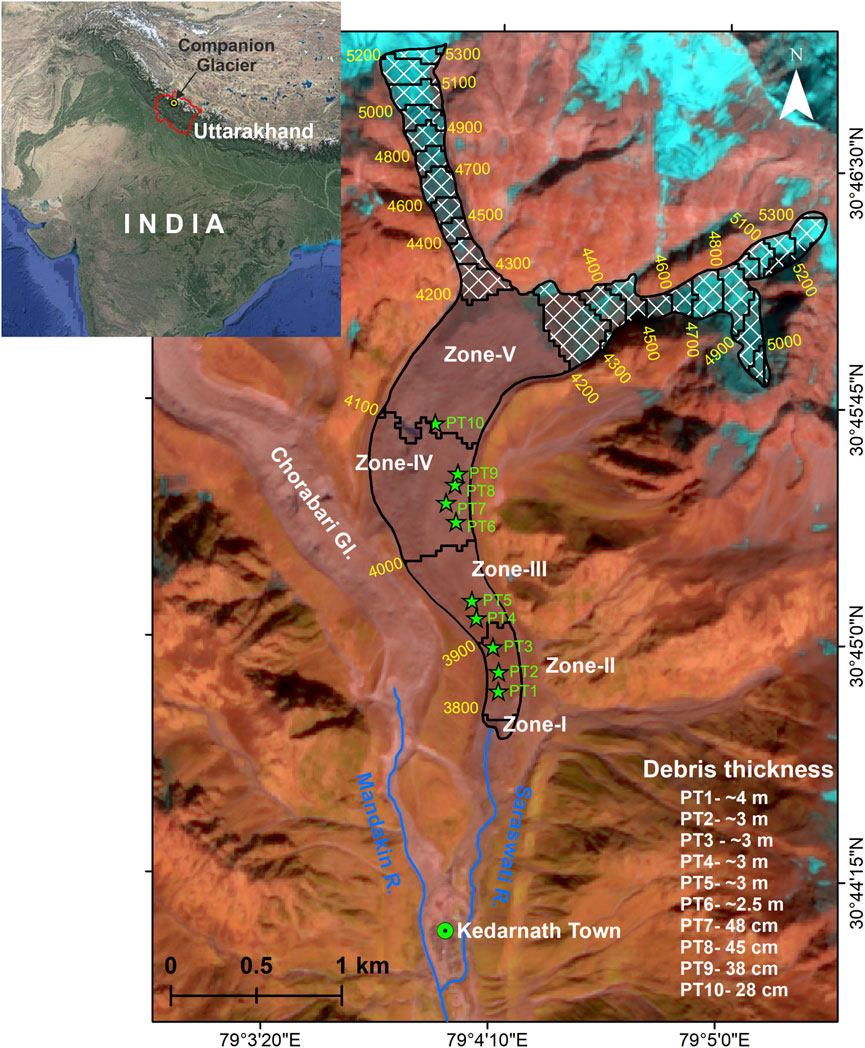
FIGURE 1. Location map of the study area. Extensive supraglacial debris cover is visible on the glacier’ ablation zone. The green stars overlain on the map (Points (PT) 1–10) show the locations of debris thickness measurements. To investigate the supraglacial morphology and underlying processes, the ablation zone is divided into five zones (Zone-I to Zone-V) based on the 100 m altitude bins. The glacier portion above the gently sloping ablation zone (>4,200 m asl) has been marked with white hatching. The background image is a Sentinel-2 MultiSpectral Instrument (MSI) image of 8 October 2020, with a band combination of Shortwave Infrared-Near Infrared-Green.
The present paper aims at assessing supraglacial morphology as regulated by the debris cover. Therefore, the debris-covered ablation zone of the glacier, which spread roughly between 3,700 and 4,200 m asl, was divided into five zones (Zone-I to Zone-V), taking the 100 m contour interval as a base (Figure 1).
3 Dataset
The present study aims at integrating field and remote sensing-based observations to understand the glacier state and its morphological evolution during the last 2 decades (2000–2020). For this, temporal and multi-sensor satellite data were acquired from Landsat- Enhanced Thematic Mapper Plus (ETM+), Operational Land Imager (OLI); Terra- Advanced Spaceborne Thermal Emission and Reflection Radiometer (ASTER), Sentinel-2 MultiSpectral Instrument (MSI) along with Shuttle Radar Topographic Mission (SRTM) Digital Elevation Model (DEM) version-3. The Landsat and SRTM data were acquired from the U.S. Geological Survey website (https://earthexplorer.usgs.gov), Sentinel-2 images were downloaded from Copernicus Open Access Hub (https://scihub.copernicus.eu), whereas the ASTER data was acquired from the NASA Earthdata website (https://www.earthdata.nasa.gov/). All the dataset was projected to the UTM coordinate system with WGS84 datum. The complete details, including the date of acquisition, spatial resolution, and purpose of each dataset, are given in Table 1.
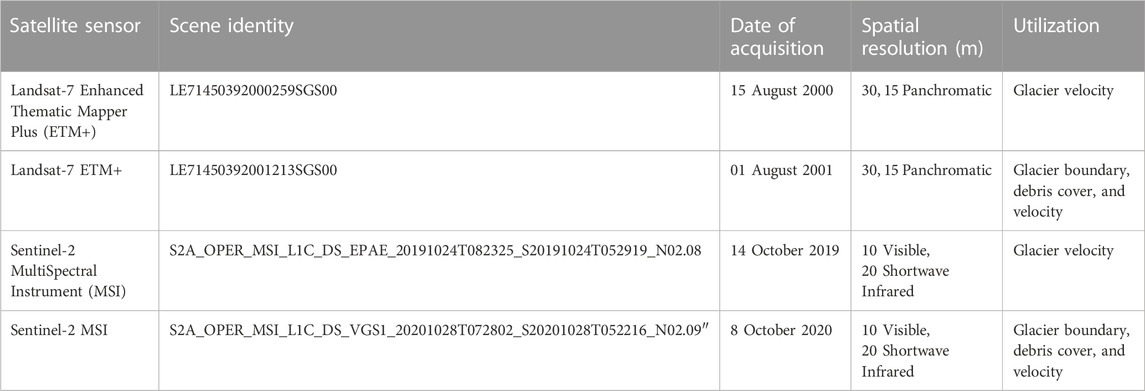
TABLE 1. Details of data used in the study.
To obtain field data, a glacier expedition was conducted on the glacier during the third week of October 2020. During the fieldwork, supraglacial debris thickness was measured by manually excavating the debris and assessing its depth using a measuring tape. A horizontal stick was placed across the excavation, and measurements were taken multiple times, at least three instances, and subsequently averaged to obtain a consolidated value. In cases where digging was unfeasible due to the presence of substantial boulders, we estimated the debris thickness from the top of the boulder down to the point where the glacier ice became visible through cavities. The latitude, longitude coordinates, and altitude of each point where debris thickness was either measured or estimated were recorded using a handheld Global Positioning System (GPS; Garmin 64s; accuracy: ±10 m horizontal and ±5 vertical). In addition, detailed observations on supraglacial debris size, snout morphology, and surface features such as supraglacial vegetation, subsidence sites, and surface mounds were made to better understand the implications of changing glacier mass balance and velocity.
4 Methodology
4.1 Glacier area, debris cover, and length change estimation
Glacier boundary was digitized manually on the ETM+ image of 2002 and the MSI image of 2020, which likely provide the best results (Stokes et al., 2007; Paul et al., 2013; Garg et al., 2017a). The ETM+ image was pan-merged with the band combination of Shortwave Infrared (SWIR)-Near Infrared (NIR)-Green to increase the spatial resolution from 30 m to 15 m, which greatly facilitated the visual interpretation. The False Colour Composites of MSI were also created using the band combinations of SWIR-NIR-Red and SWIR-NIR-Green. Before layer stacking, the SWIR band of MSI was resampled from 20 m to 10 m to make it compatible with the spatial resolution of the rest of the bands utilized. The ablation zone of Companion Glacier is heavily covered with debris, but its delineation was not very difficult thanks to well-elevated lateral moraines. Furthermore, while the debris cover on the glacier is derived from the surrounding valley walls, its tone, and texture differ slightly from those of the surrounding valley walls (Figure 1), which aided in the demarcation of the glacier margins. The signs of movement (derived from overlaying temporal images), the undulating glacier surface, the presence of supraglacial ponds, and most importantly, the presence of the snout wall, aided the visual interpretation. The water divide was defined using an SRTM DEM and visual comparison from Google Earth. The debris-covered portion of the glacier was marked visually within the glacier boundary taking advantage of tonal difference (Stokes et al., 2007; Garg et al., 2017a). The Companion Glacier has two branches of accumulation (Figure 1). Here, the length of the glacier was measured along the central flow line from the snout to the upper limit of the longest branch. The length change (retreat) was measured as per Bhambri et al. (2012), wherein lines with 50 m intervals were drawn parallel to the central flow line across the glacier width, and the length of each line intersecting the temporal boundaries was averaged to arrive at the average retreat.
4.2 Geodetic mass balance calculation
4.2.1 Horizontal and vertical biases corrections
The DEMs from SRTM (2000) and ASTER (2020) were compared on a pixel-by-pixel basis to compute the glacier surface elevation change (SEC). First of all, both the DEMs were carefully checked for peaks and sinks and, whenever necessary, these were removed using the spline method (Racoviteanu et al., 2009; Paul et al., 2015). Then, horizontal and vertical congruence among the DEMs was ensured by using the SRTM DEM as a base (Nuth and Kääb, 2011). To achieve horizontal congruence, the standard deviation of the elevation difference over the least error-prone stable terrain was minimized (Berthier et al., 2016). Stable terrain was extracted by masking a) glaciated areas using RGI 6.0 glacier boundaries, b) cloud cover using on-screen digitization, c) gentle (<4°) and steep (>45°) slopes using SRTM DEMs, and d) elevation difference values >± 100 m, considering them as outliers (Nuth and Kääb, 2011; Berthier et al., 2016; Shukla and Garg, 2019).
The vertical congruence was also achieved over the stable terrain by applying the above-discussed glacier, cloud, and slope masks, with the elevation difference outlier mask restricted to ±50 m (Berthier et al., 2016; Shukla and Garg, 2019). Then, we correct along/across track biases by rotating the ASTER ground track (Nuth and Kääb, 2011; Gardelle et al., 2013; Berthier et al., 2016). Subsequently, the elevation, slope, and curvature-dependent biases were corrected by establishing their relationship with elevation differences over stable terrain and using a third-order polynomial fit (Garg et al., 2022b). Supplementary Table S1 shows improvements in standard deviation after each sequential correction applied on the ASTER DEM. A total of ∼45% improvement was seen after applying all the corrections (Supplementary Table S1).
4.2.2 C-band penetration and seasonality corrections
The SRTM DEM used in this study was acquired in the C-band, which possesses varying penetration capability on different glacier surfaces (∼0–10 m; Gardelle et al., 2013), and forms one of the most important sources of uncertainty in glacier surface elevation change computations (Kääb et al., 2012; Gardelle et al., 2013; Vijay and Braun, 2016; Zhou et al., 2018). Previous studies have reported different C-band penetration depth values for different regions (Kääb et al., 2012; Vijay and Braun, 2016; Zhou et al., 2018). Here, we applied a penetration value of 3.5 m for the snow/ice surface as suggested by Bandyopadhyay et al. (2019) specifically for the Uttarakhand region, and 0.4 m for the debris-covered surface as suggested by (Kääb et al., 2012).
The SRTM and ASTER DEMs used in this study were acquired in February (2000) and October (2020), respectively, showing a seasonal difference of about 4 months. To account for this difference in DEM acquisition months, we applied a seasonality correction of 0.15 m w. e per winter month, which corresponds to the mean winter MB of 35 glaciers in the northern hemisphere (Ohmura, 2011; Gardelle et al., 2013). The applied value is also very similar to the mean accumulation rate of the Dokriani Glacier in the Central Himalaya, which is close to our study area (Garg et al., 2022b).
4.2.3 Outlier handling and mass balance computation
In glaciers characterized by a negative mass balance regime, the maximum thinning is anticipated to take place at the snout region, while the minimum thinning is expected in the upper accumulation regions (Schwitter and Raymond, 1993). However, we noticed a few pixels of high contrast even in the accumulation area. Pieczonka and Bolch (2015) explained that these kinds of anomalous values are caused by the erroneous matching of optical images and can be handled using a sigmoid function. The sigmoid function assumes that the glacier surface elevation change varies with altitude following a nonlinear trend. In the present study, we used a simplified version of the sigmoid function proposed by Zhou et al. (2018) to determine the maximum allowable thickness change (Δhmax) at a certain altitude, as shown in Equations 1, 2:
where ω is normalized altitude, Amx and Amn are the maximum and minimum altitudes of the glacier, respectively, Ag is the altitude of an individual pixel, and ν is the empirical coefficient, which denotes the maximum elevation change at the front of the glacier. For the Companion Glacier, we set a value of −40 m following the recommendation of Zhou et al. (2018) and based on the previous elevation change measurements (Bandyopadhyay et al., 2019; Shean et al., 2020). The discarded values from applying the Δhmax filter were replaced with the mean value of the corresponding 100 m altitude band. In the next step, the mean elevation change value for each altitude band was computed and multiplied by the area of the respective band to determine the volume of ice change. Finally, the mass balance of the Companion Glacier was computed utilizing the mean density values of 850 ±60 kg/m3 and 560 ±40 kg/m3 for the ablation and accumulation areas, respectively, as proposed by Dobhal et al. (2013) for Chorabari Glaciers, which were derived from an in-situ mass balance study, along with references from Dobhal et al. (2021) and Garg et al. (2022b) based on field measurements conducted over the Dokriani Glacier in the central Himalaya. We also referred the framework presented by Huss (2013) for the consideration of uncertainties associated with density assumptions.
4.3 Velocity measurements
The panchromatic band (15 m) of Landsat ETM+ images of 2000 and 2001 and the NIR band (10 m) of Sentinel-2 MSI images of 2019 and 2020 were utilized to deduce surface ice velocities for 2000/01 and 2019/20, respectively. The ‘Co-registration of Optically Sensed Images and Correlation (COSI-Corr)’ matching programme was used to correlate the temporal images. The COSI-Corr was developed by Leprince et al. (2007) initially for observing tectonic movements and first applied by Scherler et al. (2008) in the glaciological application. Since then, it has become a standard method in glaciology and has been widely applied in several studies (Scherler et al., 2011; Bhattacharya et al., 2016; Bhushan et al., 2017; Shukla and Garg, 2019; Kaushik et al., 2022). The COSI-Corr uses initial (usually larger) and final (usually smaller) window sizes to retrieve the relative displacement between the correlated images which facilitates maximizing correlation and capturing finer details, respectively. Here we chose an initial and final window size combination of 64×32 pixels for both ETM+ and MSI but a respective step size of 4 and 6 to resample the displacement images in a common ground resolution of 60 m. The resulting east-west (E-W) and north-south (N-S) displacement images were subjected to several filters. First, we filtered out low signal-to-noise ratio (SNR) values that are less than 0.9 to eliminate poor correlations. Then, we discarded the values >± 100 m, considering them outliers. This threshold was decided based on field knowledge. Thereafter, we applied a non-local mean (NLM) filter, which holds an exceptionally high efficiency in preserving the fine details while reducing additive white Gaussian noise. To address the isolated pixels and fill the small gaps caused by discarded pixels, we applied a median filter having a kernel size of 3×3 pixels. The moving shadow and cloud lead to biases in the velocity computation which were manually digitized and masked from correlations to avoid these errors. Finally, the absolute velocity was computed as the square root of the sum of the squares of the N-S and E-W displacements. The correlated image pairs did not necessarily have 1-year temporal separation, therefore, the velocity products were normalized to 365 days.
4.4 Uncertainty estimation
In the present study, the glacier boundaries were digitized on-screen using visual interpretation and, hence, are likely to contain interpretational bias. Therefore, to quantify the uncertainty associated with glacier area delineation, an approach suggested by Paul et al. (2013) is adopted. For this, a total of six analysts with sufficient experience (2–6 years) in remote sensing-based glaciological studies were asked to digitize the boundary of Companion Glacier independently on the MSI image. The standard deviation of all the glaciers boundaries thus quantified was 0.05 km2 or 3.8%. This is in line with the previous uncertainty estimates in glacier area mapping (Bolch et al., 2010; Paul et al., 2013; Chand and Sharma, 2015; Garg et al., 2017a). Since the debris-covered area was estimated within the glacier boundary, an equal uncertainty was assumed for it (Garg et al., 2017a). The uncertainty in length change was quantified as per Hall et al. (2003), wherein the square root of the pixel resolution of temporal images was calculated and added to the coregistration error (i.e., one pixel).
Uncertainty in geodetic mass balance estimation was quantified using all the reliable pixels over non-glaciated stable terrain. As described in Section 4.2.1, the reliable stable terrain was obtained by masking the glacier (using RGI 6.0 glacier boundaries), cloud mask (using on-screen digitization) and slope mask (eliminating area with slope >45°) (Berthier et al., 2016; Garg et al., 2022b). The slope mask was applied based on the recommendations made in the literature which highlighted that DEMs contain large errors in the steep slopes (Jacobsen, 2005; Rodríguez et al., 2006; Vilímek et al., 2015; King et al., 2017). Rolstad et al. (2009) particularly emphasized on excluding areas steeper than 30° where few identical features are matched in the stereo pairs. The exclusion of steep mountainsides reduces elevation differences that stem from horizontal shifts of the DEMs due to uncertainty in the absolute orientation. Several earlier studies applied a slope threshold of 30° for masking the error-prone values (Pieczonka and Bolch, 2015; Bhushan et al., 2017; Neckel et al., 2017; Zhou et al., 2019). However, following Berthier et al. (2016), we applied a slope threshold of 45° which allowed more pixels from non-glaciated terrain to be included in the uncertainty estimation process. Afterward, as suggested by several studies (Gardelle et al., 2013; Zhou et al., 2018), the standard deviation of each 100 m altitude band over stable areas (σsi) was used to approximate the error associated with glacier surface elevation change over the corresponding band (σi) using Equations (3), (4)
where Tp and Ep are the total and effective number of pixels, respectively, Gp represents the ground resolution of the pixels, and d is the distance of autocorrelation (600 m; Bhushan et al., 2018; Zhou et al., 2018). The d is equal to the range of influence which is obtained from the semi-variograms of elevation difference values over non-glaciated stable areas (Wang and Kääb, 2015; Magnússon et al., 2016). Subsequently, the total uncertainty in glacier surface elevation changes (
where
where σhi is the observed surface elevation difference, ρi is the density values used here (850 ± 60 kg m−3 for ice and 560 ± 40 kg m−3, for snow/firn; Huss, 2013; Garg et al., 2022b), σρ is the density estimates uncertainty (±60 kg/m3), ρw is the density of water (1,000 kg m−3) and t is the total time period (21 years). The density uncertainty value ±60 kg m3 is used here uniformly both for ice and snow as it is highest amongst both the density assumptions and, hence, can be considered conservative allowing the inclusion of uncertainty in density assumption more appropriately. The t is used in the equation to arrive at the uncertainty estimation value of the annual scale (i.e., m a−1).
The COSI-Corr can provide accuracy in the order of 1/20–1/10 of the pixel size of the correlated images (Scherler and Strecker, 2012; Tiwari et al., 2014), which translates to an error of ±1 m to ±1.5 m for MSI and ETM+ images. Notably, in the present study, image pairs from the same path/row were used for correlation to avoid horizontal shift (Heid and Kääb, 2012). The image-to-image coregistration of ETM+ and MSI images is also suitable for glaciological studies (Storey and Choate, 2004; Heid and Kääb, 2012; Bhattacharya et al., 2016). Here, the total uncertainty associated with the velocity estimation was quantified over stable terrain, where theoretically no movement is expected (Shukla and Garg, 2019). Error-prone areas such as shadows, cloud cover, and slopes >45° were masked out before uncertainty estimation. Following (Scherler and Strecker, 2012; Garg et al., 2017b; Shukla and Garg, 2019), the mean and standard deviation of observed velocity over stable terrain were summed up and divided by the temporal separation of the image pair to arrive at the error quotient.
5 Results
5.1 Area, length, and debris cover changes
As per the MSI image of 2020, the total area of the Companion Glacier is 2.08 ±0.1 km2. In 2001, the total area of the glacier was 2.11 ± 0.1 km2. Thus, the glacier area has only slightly reduced by −0.03 ±0.1 km2 (−1.3% ± 2.8%) in the last 19 years. The glacier’s ablation zone varies in width between ∼200 and ∼600 m and is characterized by heavy debris cover. The total debris cover on the glacier was 59.4% (1.25 ±0.1 km2) in 2001, which increased to 63.2% (1.31 ±0.1 km2) in 2020, showing a growth of 4.9% ±2.8% (0.3% ±0.1% a−1). These results show that the changes in area and debris cover are trivial and are within the range of associated uncertainties. Notably, almost the entire ablation zone of the glacier is debris-covered (Figure 1) leaving a limited scope for increasing the debris cover further up the glacier. The length of the glacier was 4.6 km in 2020, and snout fluctuation analysis reveals a very low retreat of only 70.6 ±33.1 m during 2001–2020, which translates into an annual retreat of 2.7 ±1.7 m a−1.
5.2 Debris cover characteristics
The glacier’s ablation zone is covered with rocky debris, with debris sizes ranging from huge boulders (several meters in diameter) in the lower reaches to silt in the upper reaches (Figures 1, 2). In total, the characteristics of the debris were observed at 10 locations (Figure 1). In the lower portion from Point one (PT1) to PT5, the debris is very thick exceeding ∼2–3 m, and characterized by huge boulders with a diameter of >2 m (Figures 2A–D). Displacing boulders in order to measure the thickness was not possible, and hence the exact debris thickness could not be measured here. Visual estimations suggest the debris thickness to be greater than ∼3 m between PT1 to PT5. On PT6, the thickness of debris is relatively less (visual estimation ∼2.5 m) but it is still not physically measurable as it comprises big boulders (Figure 2E). The PT7 is a mound where the debris is relatively thin at the top and could be measured exactly (48 cm). However, the debris was thick at the mound’s bottom and surroundings (>1.5 m). The photographs shown in Figures 2F–H display the transition between big boulders to relatively fine debris. The PT8 displayed settings similar to the PT7, which represented a mound with thin debris (45 cm) on top and thick debris (∼1 m) at the bottom and surroundings. At PT9 the debris is comparatively thin (38 cm) and composed of fine grains (Figure 2I). A debris thickness of 28 cm has been recorded at PT-10 (Figure 2J). These observations confirm a typical debris thickness distribution setting (Anderson and Anderson, 2018), which gradually decreases up the glacier with increasing distance from the snout. Details of debris thickness measurement (latitude, longitude, altitude) are given in Supplementary Table S1.
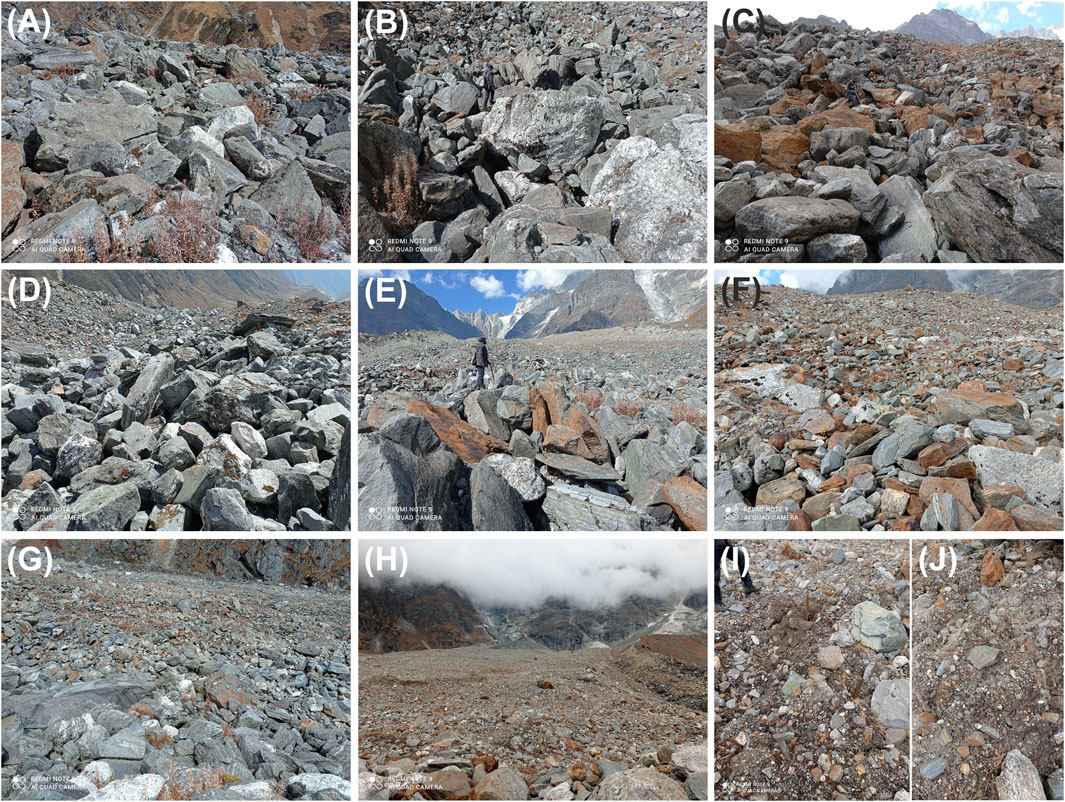
FIGURE 2. Debris cover characteristics of the Companion Glacier observed during the fieldwork in October 2020. The debris is very thick (∼2–3 m) over lower reaches [Zone-I through Zone-III; Panels (A–E)]. The debris thickness keeps decreasing with increasing distance from the snout in the upglacier direction. Panels (F–H) show a clear transition from huge to relatively fine debris. Upper portions [Panels (I–J)] have fine and comparatively thin debris (<40 cm).
5.3 Surface ice velocity
The surface ice velocity of the glacier was estimated for the 2000/01 and 2019/20 periods. It is important to note that owing to featureless perennial snow cover, steep mountain slopes, wide crevasses, and seracs, it is challenging to deduce velocities for the accumulation area of glaciers using the optical-feature tracking technique (Heid and Kääb, 2012; Shukla and Garg, 2020). Therefore, here the velocity estimations are limited to the debris-covered ablation zone, where reliable correlations could be obtained (Figure 3). The SIV is computed using two approaches: a) zonal SIV: where the mean of all the pixels in each of the 100 m altitude bands (categorized here from Zone-I to Zone-V) is computed, and b) along the central flow line (CFL): where the mean of every 50 m distance from the snout to the upglacier is computed. Zonal results reveal that almost the entire ablation zone is moving at very low rates (Figure 3). Zone-I (5.8 ± 2.1 m a−1 in 2019/20) and Zone-II (5.8 ± 2.1 m a−1 in 2019/20) moved at similar and the slowest rate, but an acceleration of ∼34% and ∼15%, respectively, is observed in these zones. Zone-III has slowed down (by ∼5%) and moved at a rate of 7.6 ± 2.1 m a−1 in 2019/20. Zone-IV moved at an almost similar rate of 10.1 ± 3.4 m a−1 during 2000/01 and 10.0 ±2.1 m a−1 during 2019/20 showing almost no change in velocity. A notable acceleration (by ∼76%) in SIV from 7.3 ± 3.4 to 12.9 ± 2.1 m a−1 occurred in Zone-V, which became the fastest-moving zone of the glacier (Figure 3A). The average SIV of all five zones was 7.0 ± 3.4 m/during 2000–01, which increased (by 21%) to 8.5 ± 2.1 m a−1 during 2019/20. The average SIV along the CFL during 2000/01 (10.1 ±3.4) and 2019/20 (11.8 ± 2.1) is comparatively higher than zonal, but it also confirms an acceleration (by ∼16%). The SIV of Zone-I increased (by 61%) from 4.9 ± 3.4 to 7.9 ± 2.1 m a−1 and that of Zone-II (by ∼80%) increased from 4.0 ± 3.4 to 7.2 ± 2.1 m a−1. Zone-III decelerated (by ∼8%) from 10.2 ± 3.4 to 9.3 ± 2.1 m a−1 whereas Zone-IV, in the case of CFL, showed deceleration (by ∼12%) from 14.6 ± 3.4 to 12.8 ± 2.1 m a−1. SIV increases dramatically (by 58%) over Zone-V, from 11.8 ± 3.4 to 18.6 ± 2.1 m a−1, similar to Zonal. It is evident from Figure 3 and Figure 4 that both Zonal and CFL SIV show increasing SIV with increasing distance from the snout, which is typical for mountain types of glaciers (Bhushan et al., 2017).
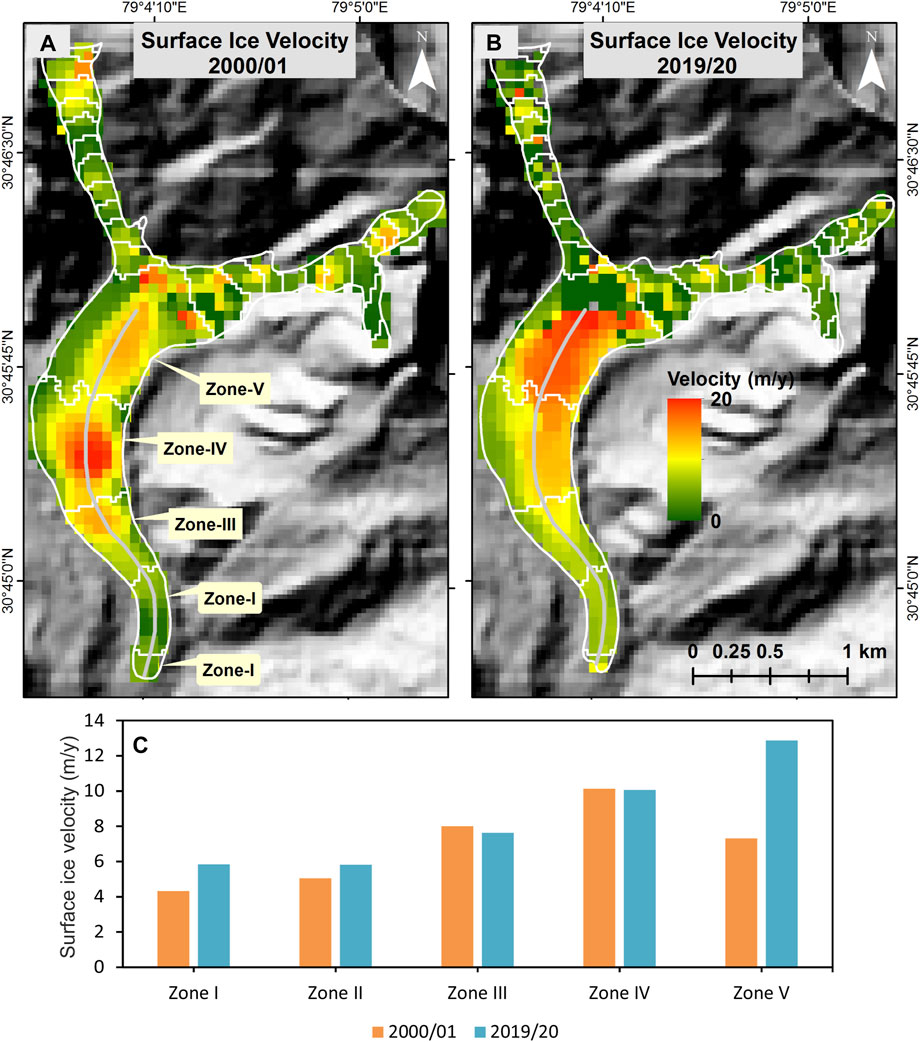
FIGURE 3. The average zonal Surface ice velocity (SIV) of the Companion Glacier. Panel (A) shows spatial distribution of SIV for 2000/01 deduced from correlating repeat Enhanced Thematic Mapper Plus (ETM+) images. Panel (B) shows spatial distribution of SIV for 2019/20 deduced from correlating MultiSpectral Instrument (MSI) images. Panel (C) shows average zonal SIV for the years 2000/01 and 2019/20. Notice a decrease in SIV over Zone-III and an increase over Zone-V. Zone-IV, with no change in SIV, became sandwiched between slow-moving Zone-III and fast-moving Zone-V, which led to changes in glacier morphology.
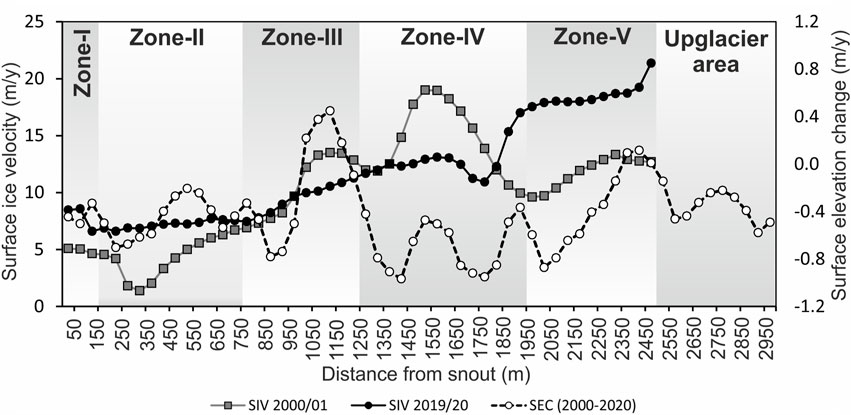
FIGURE 4. Surface elevation change (2000–2020) and surface ice velocity (SIV; 2000/01 and 2019/20) of the Companion Glacier, calculated along the central flow line sampled every 50 m from the snout upglacier. Notice the highest surface thinning in Zone-IV and an increase in SIV over Zone-V. The velocity differences between Zone-III and Zone-V caused bulging in Zone-IV; consequently, several mounds developed here and led to spot melting, which explains the higher thinning in this zone.
5.4 Mass balance and surface elevation change
The glacier SEC has been estimated using the SRTM DEM of 2000 and the ASTER DEM of 2020. However, after seasonality correction, the SRTM DEM represented the ablation period of 1999, bringing the total study span to 21 years. Results reveal a negative glacier-wide mass balance for the Companion Glacier with a total value of −2.58 ±1.8 m w. e. during 1999–2020, which translates into a specific mass balance of −0.12 ±0.1 m w. e. a−1. Further, similar to SIV, the SEC of the Companion Glacier was also computed for all five zones and along the CFL (Figures 4, 5). The Zonal SEC reveals an average thinning (negative SEC values are referred to as thinning) of −0.30 ±0.1 m a−1 for Zone-I to V. The minimum thinning is observed over Zone-III (−0.08 ±0.1 m a−1) while the highest thinning is observed over Zone-IV (−0.59 ±0.1 m a−1). Zone-I (−0.31 ± 0.1 m a−1) and Zone-II (−0.40 ±0.1 m a−1) also underwent considerable thinning. Zone-V had a moderate thinning (−0.13 ±0.1 m a−1) during the observation period of 1999–2020. Results along the CFL reveal comparatively higher average thinning of −0.43 ±0.1 m a−1 for Zone-I to V. However, the pattern of thinning is similar to the zonal one, with the minimum in Zone-III (−0.19 ±0.1 m a−1) and the maximum in Zone-IV (−0.69 ±0.1 m a−1). Zone-I (−0.43 ±0.1 m a−1), Zone-II (−0.47 ±0.1 m a−1), and Zone-V (−0.38 ±0.1 m a−1) showed intermediate thinning.
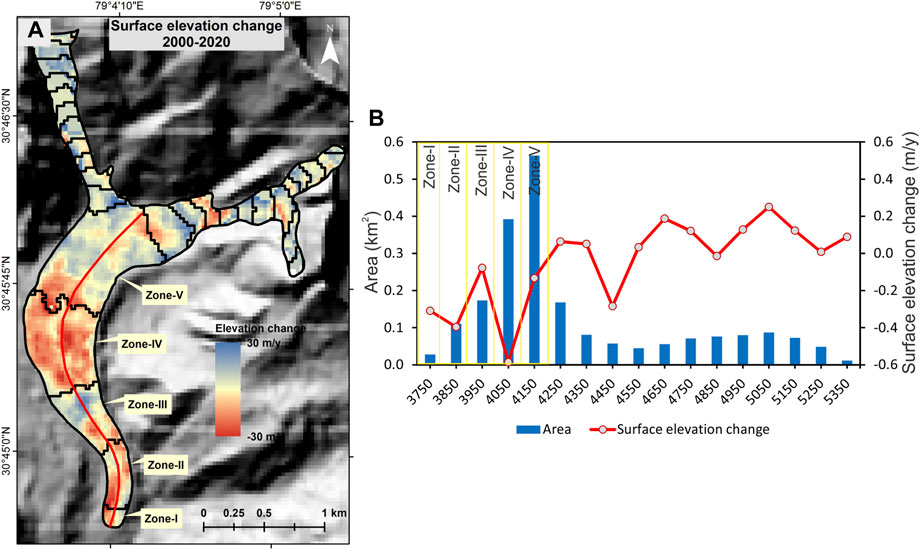
FIGURE 5. Mass balance of the Companion Glacier was computed by comparing the ASTER (2020) and SRTM (2000) Digital Elevation Models. Panel (A) shows the spatial distribution of the mass balance, which clearly displays the most negative mass balance over Zone-IV. Panel (B) shows the average surface elevation change for every 100 m altitude band. It is noticeable that Zone-IV covers the second-largest fraction of the glacier area and also underwent maximum thinning. Thus, Zone-IV plays an important role in overall glacier mass balance.
6 Discussion
6.1 Status of the Companion Glacier from a regional perspective
In the study region (Uttarakhand Himalaya), there are several terminus retreat measurement records. A compilation of previous measurements comprising 51 records shows an average retreat of 18.7 m a−1 considering all the available periods and 15.2 m a−1 during the post-2000 period (Supplementary Table S3). Garg et al. (2017b) analyzed the terminus retreat of 18 representative and well-distributed glaciers in the Uttarakhand Himalaya and reported an average retreat of 12.43 ±3.67 m a−1 during 2001–2015. In comparison to these, the terminus retreat of the Companion Glacier (3.72 ± 1.7 m a−1) is much less. Dobhal et al. (2013) suggested that the debris-covered Himalayan glaciers retreat at a slower rate. However, Kargel et al. (2011) highlighted that glaciers with relatively low terminus retreat may also experience sufficient mass loss through down-wasting. The previous area changes measurements in the study region also reveal continuous area loss since the mid-twentieth century. A compilation of all records for all available time frames for basin scale as well as individual glaciers shows an average area loss of 0.22% a−1 whereas the average area loss for the post-2000 period is 0.18% a−1 (Supplementary Table S4). In this regard, the Companion Glacier showed an insignificant area loss (−0.07% ± 0.1% a−1). Previous debris cover records in the study region show an average debris growth rate of 1.22% a−1 and 0.76% a−1 for all time frames and the post-2000 period, respectively, which again is much higher than that of the Companion Glacier (0.26% ± 0.1% a−1) (Supplementary Table S5). The SIV records for Uttarakhand glaciers are also available from earlier studies, which reveal an average SIV of ∼26.4, ∼23, and 16.1 m a−1 during ∼1993, ∼2000, and ∼2015, respectively (Supplementary Table S6). SIV was reported to have decreased by 2.6, 2.3, and 2% from 1993 to 2000, 2000 to 2015, and 1993 to 2015, respectively (Supplementary Table S6). In contrast to these observations, the Companion Glacier moved at a very slow rate during 2000/01 (6.97 ±3.4 m a−1) and 2019/20 (8.45 ±2.1 m a−1). Also, while the SIV of other glaciers in the region slowed down, Companion Glacier showed an acceleration (by 21%). The anomalous behaviour of Companion Glacier is discussed in Section 6.2.
Further, the mass balance of the Companion Glacier (−0.12 ±0.1 m w. e. a−1) is also not in line with the regional trend. In the Uttarakhand Himalaya, only five glaciers have been monitored using field-based (glaciological) mass balance, namely, the Chorabari (2003–2010; −0.73 m w. e. a−1), Dokriani (1993–2014; −0.32 m w. e. a−1), Tipra Bank (1981–1988; −0.14 m w. e. a−1), Dunagiri (1984–1990; −1.04 m w. e. a−1) and Satopanth Glacier (2015–2017; −4.9 m w. e. a−1 in the ablation area; values converted from cm d−1 in Shah et al. (2019) to m w. e. a−1 using a density conversion factor 0.85), which showed more negative balance during their respective study periods (Pratap et al., 2016; Azam et al., 2018). Out of these, the Dunagiri Glacier can be said to be akin to the Companion Glacier, as it is also heavily debris-covered (82.4%; Garg et al., 2017a). However, the mass balance of the Dunagiri Glacier is highly negative probably because its gently sloping ablation zone (12°; Garg et al.,. 2017a) is studded with numerous supraglacial ponds and ice cliffs, which are expected to enhance the melt rates (Sakai et al., 2002; Miles et al., 2017). Also, the Dunagiri Glacier has a very small accumulation area, which also limits its chances of accumulating mass input from direct snowfall (Sakai et al., 2002; Shukla and Garg, 2020). The Tipra Bank Glacier has comparable debris cover (64.5% in 2015; Garg et al., 2017a) to that of Companion Glacier (63.2%) and showed a comparable mass balance. This is probably because its snout region is insulated owing to the thick debris cover (Mehta et al., 2011). The steep slope of the ablation zone also prevented the development of supraglacial ponds and ice cliffs over Tipra Bank, and, hence, the influence of external factors on melt rates is minimal. The neighbouring Chorabari Glacier (located on the right side of the Companion Glacier), which shares a composite lateral moraine with the Companion Glacier (Figure 6), and has a relatively smaller debris cover (25.8%) than later showed a highly negative mass balance (−0.73 m w. e. a−1) (Dobhal et al., 2013). Notably, the debris thickness on the Chorabari Glacier is comparatively thinner than that on Companion Glacier. Dobhal et al. (2013) reported a maximum debris thickness of 1.8 m near the terminus region, which gradually decreases to 5 cm at approximately 3 km from the snout. Relatively thin debris coupled with an overall steep slope (26°) probably could not protect it completely, and hence higher thinning (1.5–2 m a−1) is evident over the ablation zone of the glacier, particularly at the upper-middle parts (Dobhal et al., 2013). The relative height difference between lateral moraines and the glacier surface (Figure 6) confirms a large and striking difference in glacier surface thinning between Choarabari and Companion glaciers. On the Chorabari Glacier, the relative difference between glacier surfaces and moraine height is 76–112 m, which indicates high and widespread thinning of the glacier (Figure 6). By contrast, the Companion Glacier has less difference (∼20–30 m) between glacier surface and moraine, confirming less thinning on this glacier and explaining the large difference in mass balance over both glaciers (Figure 6).
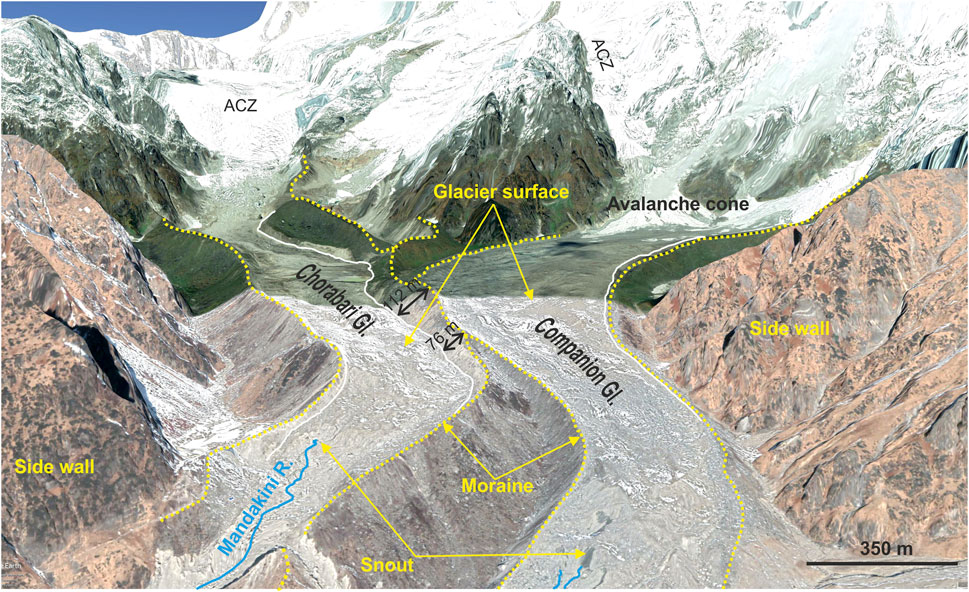
FIGURE 6. The morphological settings and key features of the Companion Glacier and neighbouring Chorabari Glacier are depicted in this Google Earth image. The figure clearly displays a striking difference between glacier surfaces and lateral moraine heights. This confirms that, owing to its thick debris cover, the Companion Glacier underwent relatively less thinning than its neighbour. White lines on the figure indicate the glacier surface.
The glaciers in the Uttarakhand region have also been monitored for geodetic mass balance (on a regional and individual glacier scale) (Kääb et al., 2012; Bhattacharya et al., 2016; Bhushan et al., 2017; Brun et al., 2017; Bandyopadhyay et al., 2019; Maurer et al., 2019; Shean et al., 2020; Remya et al., 2022). Based on previous estimates, the region has an average mass balance of −0.33 m w. e. a−1 (Supplementary Table S7), which is significantly higher than the Companion Glacier (−0.12 ± 0.1 m w. e. a−1). Thus, the entire analysis comparing Companion Glacier’s terminus retreat, area loss, debris growth, SIV, and mass balance with other glaciers of the region highlights that the rate of glacier parameter change on this glacier is very low and can be attributed to its local topography and debris cover characteristics, which are discussed in forthcoming sections.
6.2 Impact of debris on glacier changes
It is evident from the discussion given in Section 6.1 that the rate of dimensional (i.e., length and area) changes is very low on the Companion Glacier, which can directly be attributed to the presence of very thick debris cover. Usually, the ablation area of glaciers is prone to the shrinkage of margins and consequent area loss (Dobhal et al., 2013). However, on the Companion Glacier, thick debris protected the margins in the lower ablation area, apart from the frontal area where small retreats and area changes are visible. Shrinkage occurred in the upper reaches where clean ice exists. This is because the upper reaches of the glacier are located on very steep slopes (>36°) and are debris-free which likely promotes higher ice loss (Nicholson et al., 2018; Zhou et al., 2022). Further, the peculiar characteristics of the terminus region are studied here through zonal investigation (Figure 7) to understand the current pace of retreat and its future evolution. Zone-I represents the snout portion of the Companion Glacier, which rests on a steep slope. Slope analysis of the ablation zone of the glacier reveals a mean slope of 12.7°. The mean slope of Zone-I, on the other hand, is 20.7°. The sudden increase in slope is also evident on the field (Figure 7) owing to which the big boulders rolled down and deposited at the front of the snout. During the field in October 2020, real-time falling of debris from the upper edge of the snout wall was also observed. The subsidence in steep-sloped Zone-I may also be one of the reasons for the comparatively higher surface thinning here (−0.31 ±0.1 m a−1). Field observations suggest that probably owing to the collapse of sub-glacial streams and snout cave, several depressions have developed in Zone-I. These depressions are less likely a result of the direct melting of glacier ice rather they were created through subsidence. Since the geodetic surface elevation change calculation compares the elevation of pixels of the corresponding location, such depression/subsidence contributes to negative surface elevation change or surface lowering resulting in overall higher thinning rates. The falling debris has exposed the snout wall, which is covered with dirt (fine debris) (Figure 7). The fine debris cover reduces the albedo of the snout, resulting in more solar intake and promoting direct melting of the snout wall (visible during 1 hour of continuous observation), and it is expected that the glacier may experience accelerated snout retreat in the future (Reid and Brock, 2010; Evatt et al., 2015; Fyffe et al., 2020).

FIGURE 7. Panels (A–D) display the snout morphology of the Companion Glacier observed during the glacier field work in October 2020. A sudden increase in slope is evident in the snout region (Panel A) owing to subsidence. The steep slope has mobilized the debris, and big boulders are rolling or sliding down and being deposited at the front of the snout wall Panels (B, C). Panel (D) shows the size of the deposited debris at the glacier front on a human scale. The dirt-covered snout wall is also visible in the figure.
Further, the low SIV of the Companion Glacier, to some extent, can also be attributed to the thick debris cover and lateral drag exerted by the well-connected (through debris and ice) lateral moraines (Tiwari et al., 2014; Garg et al., 2017b). Although the mass loss has accelerated in the Himalaya since the beginning of the 21st century and other glaciers in the study region have undergone substantial mass loss (Brun et al., 2017; Bandyopadhyay et al., 2019; Maurer et al., 2019; Shean et al., 2020), the Companion Glacier has maintained its overall mass and experienced less negative mass balance during 2000–2020. Nevertheless, in a warming scenario, it is expected that it might have experienced slightly higher melting in recent years, and the meltwater percolated to its base and increased the basal sliding (Benn et al., 2012; Scherler and Strecker, 2012; Bhattacharya et al., 2016; Garg et al., 2017b). This, coupled with less negative mass balance (and low surface thinning), explains the slight acceleration of the Companion Glacier, irrespective of the widespread slowdown in the study region.
The debris is very thick (>3 m) in Zones I through III. The underlying ice becomes completely insulated from daily surface energy fluxes beneath a debris thickness of 0.25–0.3 m, with only longer-term changes in surface energy balance reaching the underlying debris-ice interface (östrem, 1959; Brock et al., 2010; Nicholson and Benn, 2013; Reid and Brock, 2014; Miles et al., 2020). Therefore, over these zones, the glacier ice under debris cover is completely protected, as evidenced by the relatively smaller surface elevation changes observed here (Figure 5). Because direct melting is unlikely, any thinning observed over Zones I and II can be explained by the pronounced subsidence phenomenon (rather than direct melting). In the field, numerous subsidence sites were observed (Supplementary Figure S2), probably owing to the collapse of englacial channels or the accumulation of meltwater over depressions at the interface of porous debris (comprising big boulders) and glacier ice, which triggers melting and leads to subsidence.
6.3 Evolution of supraglacial morphology
The spatial distribution of glacier mass and underlying slope can influence the glacier SIV which, in turn, can influence the supraglacial surface evolution (Benn et al., 2012; Garg et al., 2022b). Results reveal the average SIV of the Companion Glacier to be 6.97 ± 3.4 m a−1 and 8.45 ± 2.1 m a−1 during 2000–01 and 2019–20, respectively. Despite the slight acceleration, the SIV at lower elevations (Zones I and II) is quite low. Previously, several studies have considered the glacier portions with SIV less than 10 m a−1 to be stagnant (Quincey et al., 2009; Scherler et al., 2011; Garg et al., 2022a). Garg et al. (2022a) conducted a dedicated study on the Pensilungpa Glacier, Zanskar Himalaya, and designated the lower ablation zone with SIV <10 m a−1 as stagnant. In this regard, Zone-I and Zone-II of the Companion Glacier can clearly be interpreted as stagnant. Notably, Zone-I (4.3 ± 3.4 m a−1 in 2000/01 to 5.8 ± 2.1 m a−1 in 2019–20) and Zone-II (5.1 ± 3.4 m a−1 in 2000/01 to 5.8 ± 2.1 m a−1 in 2019/20) experienced a slight acceleration in SIV during 2000–2020 possibly owing to subsidence-induced slope increase in lower regions and rolling of boulders. This is because subsidence (which was frequently observed during the field visit) increases the local slope and destabilizes the big boulder which often role down to some distance and give an impression of displacement in the correlated image. The velocity is still below the threshold of stagnation which led to unique surface development. The velocity in these zones is so low (<6 m a−1) that it has allowed the growth of vegetation on the glacier surface (Figure 8). During the field visit, well-grown woody shrubs could be seen in Zone-I and Zone-II thriving on the thick debris (>∼2 m) (Figure 8). The presence of vegetation can be interpreted as a manifestation of a relatively stable glacier portion for the past two-three decades. Zone-III had an average velocity of 8.0 ± 3.4 m a−1 during 2000/01 which decreased to 7.6 ± 2.1 m a−1 during 2019/20. As a result, Zone III, despite having a slightly higher SIV than the lower two zones, can also be classified as stagnant. Zone-III is the prime zone that blocks the higher SIV of upper Zone-IV and Zone-V. Zone-IV can be said to be active (SIV 10.1 ± 3.4 and 10.1 ± 2.1 m a−1 during 2000–01 and 2019–20, respectively) and had almost no change in SIV. However, the velocity of Zone-V accelerated strikingly (by 76%) from 7.3 ± 3.4 m a−1 in 2000/01 to 12.9 ± 2.1 m a−1 in 2019/20. Thus, it is evident that Zone-IV is sandwiched between the slow-moving Zone-III and fast-moving Zone-V, which has led to peculiar morphological transformations in Zone-IV. Field observations suggest that owing to blockage by Zone-III and pushing by Zone-V, bulging has occurred in Zone-IV. Consequently, several mounds have developed over Zone-IV (Figure 9) (Bartlett et al., 2021). The large debris slides down from these uplifted mounds owing to an increase in slope, exposing the tops of the mounds for direct melting as the remaining debris on the top portion is relatively fine and thin (<30 cm) (Figure 9G). In the field, several mounds were climbed, and wet debris was found on the way to the top (Figures 9G,H). On the peaks of mounds, the debris is very thin, which could not protect its melting (Nicholson and Benn, 2006; Nicholson et al., 2018; Zhang et al., 2019; Zhou et al., 2022). As a result, spot melting in the form of mound-top melting is dominant over Zone IV. It is a well-known fact that the presence of debris cover increases the water retention capacity of the glaciers (Benn et al., 2012). Consequently, the meltwater from these mounds often accumulates behind the mound (on the upglacier side) and facilitates the formation of small supraglacial ponds (Figure 9G) (Sakai and Fujita, 2010). Supraglacial ponds once formed become the hotspot of melting as these are directly exposed to incoming solar radiations and can absorb up to seven times higher solar radiation as compared to the surrounding debris-covered portion of the glacier (Sakai et al., 2000; Brun et al., 2018; Buri et al., 2021; Miles et al., 2022; Zhao et al., 2022). Hence, the supraglacial ponds formed behind the mounds are expected to actively contribute in spot melting. Therefore, the high rate of thinning observed over Zone-IV (−0.59 ± 0.1 m a−1) (Figures 4, 5) can be attributed to the spot-melting phenomenon that is dominating in this zone. It is also evident from Figure 5 that Zone-IV has the second-largest fraction (∼19%) of the total glacier area, and the pronounced melting here plays a crucial role in the overall mass balance of the glacier. If the process continues, more ponds may appear in this zone, which may grow over time and influence the overall mass balance. Previously, several studies have reported that, as a consequence of negative mass balance conditions, the supraglacial morphology of the glaciers is changing (Benn et al., 2012; Pratap et al., 2015; Thompson et al., 2016; Garg et al., 2022a; 2022b). For instance, Garg et al. (2022a), in their study on Pensilungpa Glacier, have found that the lower portion of the glacier has become stagnant, which coupled with differential melting has promoted the development of ice cliffs that now dominate the melting process in the lower reaches. Similarly, Garg et al. (2022b) found that typical debris thickness distribution (i.e., thick over the margins and thin along the CFL; Anderson and Anderson, 2018) on the Dokriani Glacier promoted higher melting along the CFL, which increased the concavity of the glacier. The meltwater flowing along the CFL has led to the development of a supraglacial channel, which is deepening and widening over time and has negatively impacted the overall health of the glacier. These observations suggest that supraglacial debris cover (and its spatial thickness distribution) coupled with a negative mass balance regime is causing rapid change in the supraglacial morphology of the debris-covered glaciers of the Himalaya, which needs to be studied systematically in order to understand glacier health and evolution.
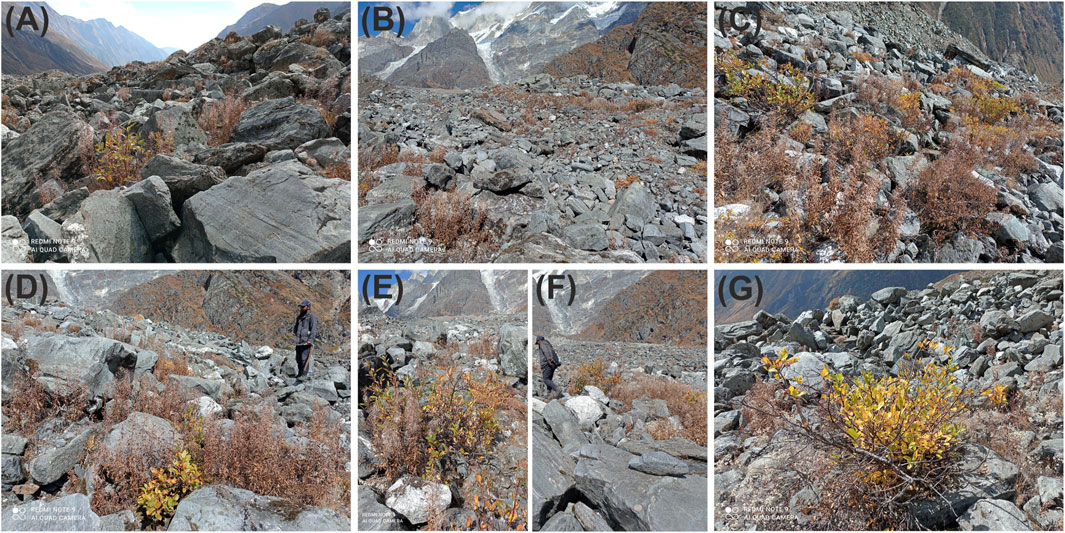
FIGURE 8. Photographs of extensive vegetation growth on the lower ablation zone (Zones I and II) of the Companion Glacier [Panels (A–G)]. It is notable that the velocity over Zone-I and Zone-II is very low (<6 m a−1) which allowed vegetation to thrive even on the glacier surface.

FIGURE 9. Panels (A–F) Photographs of several mounds observed over Zone IV of the Companion Glacier during fieldwork in October 2020. Zone-IV is sandwiched between the slow-moving Zone-III and the fast-moving Zone-V, which resulted in the bulging and development of mounds. The mounds have relatively thin debris on top, which promotes melting [Panel (G–H)]. The meltwater originating from the mounds accumulates behind them, forming small ponds [Panel (I)]. These observations confirm that the supraglacial morphology of the debris-covered glaciers is evolving differently.
7 Conclusion
The present study integrates field and remote sensing-based observation to understand the overall state of the Companion Glacier and systematically investigates the evolution of its supraglacial morphology. A glacier field expedition was carried out in October 2020 to measure debris thickness and make observations on various morphological features. Fortunately, the snow and cloud-free satellite images from Sentinel-2 and ASTER could be obtained for the same period (i.e., October 2020), which in combination with suitable data from earlier time frames helped in estimating changes in various glacier parameters, namely, length, area, debris cover, SIV, SEC, and mass balance. The following major inferences can be drawn from the study:
• The Companion Glacier is extensively (63.2%) and heavily debris-covered. The debris comprising huge boulders over the lower reaches (Zone-I through Zone-III) is so thick (>∼2–3 m) that it is practically not measurable, and only visual estimations could be made.
• Despite widespread recession in the study region, the Companion Glacier has maintained its geometry. Owing to thick debris cover, particularly over Zone-I through Zone-III (∼2–3 m), the glacier margins are protected, and consequently, the glacier experienced only nominal overall area loss (−0.07% ± 0.1% a−1) and terminus retreat (2.72 ± 1.7 m a−1). However, changing snout morphology is led by subsidence, consequently increasing slope and falling debris may cause accelerated retreat (and associated area loss) in the future.
• The average SIV of Companion Glacier was very low in 2000/01 (6.97 ± 3.4 m a−1). In 2019–20, the SIV of Companion glacier accelerated (by ∼21%), becoming 8.45 ± 2.1 m a−1, bucking the regional trend of glacier velocity reduction. Despite the acceleration (due to sustained mass), the overall SIV remained low, particularly from Zone-I to Zone-III, allowing vegetation to grow on the glacier surface. Zone-IV and Zone-V are active, while the former had no change in SIV, the later accelerated considerably (by 76%).
• The thick debris (>2 m) completely insulated the ice over Zone-I through III and the observed slight thinning here is mainly caused by subsidence. Overall, the mass balance of the Companion Glacier was −0.12 ±0.1 m w. e. a−1 which is much less than the regional mass balance.
• The peculiar observation is that Zone-IV is sandwiched between slow-moving Zone-III and fast-moving Zone-V, which led to buckling up. As a result, several mounds have formed over Zone IV. The debris slid down these mounds, exposing the tops to direct melting. The meltwater originating from these mounds is accumulating behind them, facilitating the development of ponds, which in turn further promote the melting. Thus, spot melting is dominant in Zone-IV and the highest and most substantial thinning (−0.59 ±0.1 m w. e. a−1) is observed here.
Overall, the results reveal that the supraglacial morphology of the glacier is changing in response to the prevailing mass balance regime, changing glacier velocity, and the presence of debris cover. Debris cover particularity regulates the spatial distribution of ablation rates and velocity. The changing supraglacial morphology is leading to the development of various features, viz., supraglacial channels, mounds, ice cliffs, and ponds. These features possess the capability of altering the ablation process. Therefore, it is important to understand the evolution of supraglacial morphology in order to comprehend the glacier state and its future behaviour.
Data availability statement
The original contributions presented in the study are included in the article/Supplementary Material, further inquiries can be directed to the corresponding author.
Author contributions
PG designed the research, collected and processed most data and wrote first draft of the paper. MM, AS, PC, KK, and SM helped in the interpretation of field and remote sensing data. All authors contributed to the article and approved the submitted version.
Acknowledgments
The authors are grateful to Prof. Sunil Nautiyal, Director, G.B. Pant National Institute of Himalayan Environment. A heartfelt thank is extended to the Director, Wadia Institute of Himalayan Geology (WIHG) who supported the glacier field expedition. Thank is also due to Jairam Singh Yadav, Scientist, WIHG who helped during the fieldwork.
Conflict of interest
The authors declare that the research was conducted in the absence of any commercial or financial relationships that could be construed as a potential conflict of interest.
Publisher’s note
All claims expressed in this article are solely those of the authors and do not necessarily represent those of their affiliated organizations, or those of the publisher, the editors and the reviewers. Any product that may be evaluated in this article, or claim that may be made by its manufacturer, is not guaranteed or endorsed by the publisher.
Supplementary material
The Supplementary Material for this article can be found online at: https://www.frontiersin.org/articles/10.3389/feart.2023.1219755/full#supplementary-material
References
Anderson, L. S., and Anderson, R. S. (2018). Debris thickness patterns on debris-covered glaciers. Geomorphology 311, 1–12. doi:10.1016/j.geomorph.2018.03.014
Azam, M. F., Wagnon, P., Berthier, E., Vincent, C., Fujita, K., and Kargel, J. S. (2018). Review of the status and mass changes of Himalayan-Karakoram glaciers. J. Glaciol. 64, 61–74. doi:10.1017/jog.2017.86
Bandyopadhyay, D., Singh, G., and Kulkarni, A. V. (2019). Spatial distribution of decadal ice-thickness change and glacier stored water loss in the Upper Ganga basin, India during 2000–2014. Sci. Rep. 9, 16730. doi:10.1038/s41598-019-53055-y
Bartlett, O. T., Ng, F. S. L., and Rowan, A. V. (2021). Morphology and evolution of supraglacial hummocks on debris-covered Himalayan glaciers. Earth Surf. Process. Landforms 46, 525–539. doi:10.1002/esp.5043
Berthier, E., Cabot, V., Vincent, C., and Six, D. (2016). Decadal region-wide and glacierglacier-wide mass balances derived from multi-temporal ASTER satellite digital elevation models. Validation over the mont-blanc area. Front. Earth Sci. 4. doi:10.3389/feart.2016.00063
Benn, D. I., Bolch, T., Hands, K., Gulley, J., Luckman, A., Nicholson, L. I., et al. (2012). Response of debris-covered glaciers in the Mount Everest region to recent warming, and implications for outburst flood hazards. Earth-Science Rev. 114, 156–174. doi:10.1016/j.earscirev.2012.03.008
Bhambri, R., Bolch, T., and Chaujar, R. K. (2012). Frontal recession of Gangotri Glacier, Garhwal Himalayas, from 1965 to 2006, measured through high-resolution remote sensing data. Curr. Sci. 102, 489–494. doi:10.5167/uzh-59630
Bhattacharya, A., Bolch, T., Mukherjee, K., Pieczonka, T., Kropáček, J., and Buchroithner, M. F. (2016). Overall recession and mass budget of Gangotri Glacier, Garhwal Himalayas, from 1965 to 2015 using remote sensing data. J. Glaciol. 62, 1115–1133. doi:10.1017/jog.2016.96
Bhushan, S., Syed, T. H., Arendt, A. A., Kulkarni, A. V., and Sinha, D. (2018). Assessing controls on mass budget and surface velocity variations of glaciers in Western Himalaya. Sci. Rep. 8, 8885. doi:10.1038/s41598-018-27014-y
Bhushan, S., Syed, T. H., Kulkarni, A. V., Gantayat, P., and Agarwal, V. (2017). Quantifying changes in the gangotri glacier of central himalaya: evidence for increasing mass loss and decreasing velocity. IEEE J. Sel. Top. Appl. Earth Obs. Remote Sens. 10, 5295–5306. doi:10.1109/JSTARS.2017.2771215
Bolch, T., Kulkarni, A., Kääb, A., Huggel, C., Paul, F., Cogley, J. G., et al. (2012). The state and fate of himalayan glaciers. Science 336, 310–314. doi:10.1126/science.1215828
Bolch, T., Yao, T., Kang, S., Buchroithner, M. F., Scherer, D., Maussion, F., et al. (2010). A glacier inventory for the western Nyainqentanglha Range and the Nam Co Basin, Tibet, and glacier changes 1976–2009. Cryosphere 4, 419–433. doi:10.5194/tc-4-419-2010
Bookhagen, B., and Burbank, D. W. (2010). Toward a complete himalayan hydrological budget: spatiotemporal distribution of snowmelt and rainfall and their impact on river discharge. J. Geophys. Res. Earth Surf. 115, F03019. doi:10.1029/2009JF001426
Brock, B. W., Mihalcea, C., Kirkbride, M. P., Diolaiuti, G., Cutler, M. E. J., and Smiraglia, C. (2010). Meteorology and surface energy fluxes in the 2005–2007 ablation seasons at the Miage debris-covered glacier, Mont Blanc Massif, Italian Alps. J. Geophys. Res. 115, D09106. doi:10.1029/2009JD013224
Brun, F., Berthier, E., Wagnon, P., Kääb, A., and Treichler, D. (2017). A spatially resolved estimate of High Mountain Asia glacier mass balances from 2000 to 2016. Nat. Geosci. 10, 668–673. doi:10.1038/ngeo2999
Brun, F., Wagnon, P., Berthier, E., Shea, J. M., Immerzeel, W. W., Kraaijenbrink, P. D. A., et al. (2018). Ice cliff contribution to the tongue-wide ablation of Changri Nup Glacier, Nepal, central Himalaya. Cryosphere 12, 3439–3457. doi:10.5194/tc-12-3439-2018
Burbank, D. W., Bookhagen, B., Gabet, E. J., and Putkonen, J. (2012). Modern climate and erosion in the Himalaya. Comptes Rendus Geosci. 344, 610–626. doi:10.1016/j.crte.2012.10.010
Buri, P., Miles, E. S., Steiner, J. F., Ragettli, S., and Pellicciotti, F. (2021). Supraglacial ice cliffs can substantially increase the mass loss of debris-covered glaciers. Geophys. Res. Lett. 48. doi:10.1029/2020GL092150
Chand, P., and Sharma, M. C. (2015). Glacier changes in the Ravi basin, North-Western Himalaya (India) during the last four decades (1971–2010/13). Glob. Planet. Change 135, 133–147. doi:10.1016/j.gloplacha.2015.10.013
Dobhal, D. P., Mehta, M., and Srivastava, D. (2013). Influence of debris cover on terminus retreat and mass changes of Chorabari Glacier, Garhwal region, central Himalaya, India. J. Glaciol. 59, 961–971. doi:10.3189/2013JoG12J180
Dobhal, D. P., Pratap, B., Bhambri, R., and Mehta, M. (2021). Mass balance and morphological changes of Dokriani Glacier (1992–2013), garhwal himalaya, India. Quat. Sci. Adv. 4, 100033. doi:10.1016/j.qsa.2021.100033
Evatt, G. W., Abrahams, I. D., Heil, M., Mayer, C., Kingslake, J., Mitchell, S. L., et al. (2015). Glacial melt under a porous debris layer. J. Glaciol. 61, 825–836. doi:10.3189/2015JoG14J235
Fyffe, C. L., Woodget, A. S., Kirkbride, M. P., Deline, P., Westoby, M. J., and Brock, B. W. (2020). Processes at the margins of supraglacial debris cover: quantifying dirty ice ablation and debris redistribution. Earth Surf. Process. Landforms 45, 2272–2290. doi:10.1002/esp.4879
Gardelle, J., Berthier, E., Arnaud, Y., and Kääb, A. (2013). Region-wide glacier mass balances over the Pamir-Karakoram-Himalaya during 1999–2011. Cryosphere 7, 1263–1286. doi:10.5194/tc-7-1263-2013
Garg, P. K., Garg, S., Yousuf, B., Shukla, A., Kumar, V., and Mehta, M. (2022a). Stagnation of the Pensilungpa Glacier, western himalaya, India: causes and implications. J. Glaciol. 68, 221–235. doi:10.1017/jog.2021.84
Garg, P. K., Shukla, A., and Jasrotia, A. S. (2017a). Influence of topography on glacier changes in the central Himalaya, India. Glob. Planet. Change 155, 196–212. doi:10.1016/j.gloplacha.2017.07.007
Garg, P. K., Shukla, A., Tiwari, R. K., and Jasrotia, A. S. (2017b). Assessing the status of glaciers in part of the chandra basin, himachal himalaya: A multiparametric approach. Geomorphology 284, 99–114. doi:10.1016/j.geomorph.2016.10.022
Garg, P. K., Yadav, J. S., Rai, S. K., and Shukla, A. (2022b). Mass balance and morphological evolution of the Dokriani Glacier, central Himalaya, India during 1999–2014. Geosci. Front. 13, 101290. doi:10.1016/j.gsf.2021.101290
Hall, D. K., Bayr, K. J., Schöner, W., Bindschadler, R. A., and Chien, J. Y. L. (2003). Consideration of the errors inherent in mapping historical glacier positions in Austria from the ground and space (1893–2001). Remote Sens. Environ. 86, 566–577. doi:10.1016/S0034-4257(03)00134-2
Heid, T., and Kääb, A. (2012). Repeat optical satellite images reveal widespread and long term decrease in land-terminating glacier speeds. Cryosphere 6, 467–478. doi:10.5194/tc-6-467-2012
Herreid, S., and Pellicciotti, F. (2020). The state of rock debris covering Earth’s glaciers. Nat. Geosci. 13, 621–627. doi:10.1038/s41561-020-0615-0
Huss, M. (2013). Density assumptions for converting geodetic glacier volume change to mass change. Cryosphere 7, 877–887. doi:10.5194/tc-7-877-2013
Jacobsen, K. (2005). “Analysis of digital elevation models based on space information,” in New strategies for European remote sensing (Rotterdam: Mill Press), 439–451.
Kääb, A., Berthier, E., Nuth, C., Gardelle, J., and Arnaud, Y. (2012). Contrasting patterns of early twenty-first-century glacier mass change in the Himalayas. Nature 488, 495–498. doi:10.1038/nature11324
Kääb, A., Treichler, D., Nuth, C., and Berthier, E. (2015). Brief communication: contending estimates of 2003–2008 glacier mass balance over the pamir–karakoram–himalaya. Cryosphere 9, 557–564. doi:10.5194/tc-9-557-2015
Kargel, J. S., Cogley, J. G., Leonard, G. J., Haritashya, U., and Byers, A. (2011). Himalayan glaciers: the big picture is a montage. Proc. Natl. Acad. Sci. U.S.A. 108, 14709–14710. doi:10.1073/pnas.1111663108
Kaushik, S., Singh, T., Bhardwaj, A., and Joshi, P. K. (2022). Long-term spatiotemporal variability in the surface velocity of Eastern Himalayan glaciers, India. Earth Surf. Process. Landf. 47, 1720–1733. doi:10.1002/esp.5342
King, O., Quincey, D. J., Carrivick, J. L., and Rowan, A. V. (2017). Spatial variability in mass loss of glaciers in the Everest region, central Himalayas, between 2000 and 2015. Cryosphere 11, 407–426. doi:10.5194/tc-11-407-2017
Kirkbride, M. P., and Deline, P. (2013). The formation of supraglacial debris covers by primary dispersal from transverse englacial debris bands. Earth Surf. Process. Landforms 38, 1779–1792. doi:10.1002/esp.3416
Kraaijenbrink, P. D. A., Bierkens, M. F. P., Lutz, A. F., and Immerzeel, W. W. (2017). Impact of a global temperature rise of 1.5 degrees Celsius on Asia’s glaciers. Nature 549, 257–260. doi:10.1038/nature23878
Leprince, S., Barbot, S., Ayoub, F., and Avouac, J.-P. (2007). Automatic and precise orthorectification, coregistration, and subpixel correlation of satellite images, application to ground deformation measurements. IEEE Trans. Geosci. Remote Sens. 45, 1529–1558. doi:10.1109/TGRS.2006.888937
Magnússon, E., Muñoz-Cobo Belart, J., Pálsson, F., Ágústsson, H., and Crochet, P. (2016). Geodetic mass balance record with rigorous uncertainty estimates deduced from aerial photographs and lidar data—Case study from Drangajökull ice cap, NW Iceland. Cryosphere. 10, 159–177. doi:10.5194/tc-10-159-2016
Maurer, J. M., Schaefer, J. M., Rupper, S., and Corley, A. (2019). Acceleration of ice loss across the Himalayas over the past 40 years. Sci. Adv. 5, eaav7266. doi:10.1126/sciadv.aav7266
Mehta, M., Dobhal, D. P., and Bisht, M. P. S. (2011). Change of Tipra Glacier in the garhwal himalaya, India, between 1962 and 2008. Prog. Phys. Geogr. Earth Environ. 35, 721–738. doi:10.1177/0309133311411760
Mehta, M., Majeed, Z., Dobhal, D. P., and Srivastava, P. (2012). Geomorphological evidences of post-LGM glacial advancements in the himalaya: A study from Chorabari Glacier, garhwal himalaya, India. J. Earth Syst. Sci. 121, 149–163. doi:10.1007/s12040-012-0155-0
Miles, E. S., Steiner, J. F., Buri, P., Immerzeel, W. W., and Pellicciotti, F. (2022). Controls on the relative melt rates of debris-covered glacier surfaces. Environ. Res. Lett. 17, 064004. doi:10.1088/1748-9326/ac6966
Miles, E. S., Willis, I. C., Arnold, N. S., Steiner, J., and Pellicciotti, F. (2017). Spatial, seasonal and interannual variability of supraglacial ponds in the Langtang Valley of Nepal, 1999–2013. J. Glaciol. 63, 88–105. doi:10.1017/jog.2016.120
Miles, K. E., Hubbard, B., Irvine-Fynn, T. D. L., Miles, E. S., Quincey, D. J., and Rowan, A. V. (2020). Hydrology of debris-covered glaciers in High Mountain Asia. Earth-Science Rev. 207, 103212. doi:10.1016/j.earscirev.2020.103212
Mölg, N., Ferguson, J., Bolch, T., and Vieli, A. (2020). On the influence of debris cover on glacier morphology: how high-relief structures evolve from smooth surfaces. Geomorphology 357, 107092. doi:10.1016/j.geomorph.2020.107092
Nainwal, H. C., Negi, B. D. S., Chaudhary, M., Sajwan, K. S., and Gaurav, A. (2008). Temporal changes in rate of recession: evidence from Satopanth and bhagirath Kharak glaciers, Uttarakhand, using. Total Stn. Surv. 95, 653–660.
Neckel, N., Loibl, D., and Rankl, M. (2017). Recent slowdown and thinning of debris-covered glaciers in south-eastern Tibet. Earth Planet. Sci. Lett. 464, 95–102. doi:10.1016/j.epsl.2017.02.008
Nicholson, L., and Benn, D. I. (2006). Calculating ice melt beneath a debris layer using meteorological data. J. Glaciol. 52, 463–470. doi:10.3189/172756506781828584
Nicholson, L., and Benn, D. I. (2013). Properties of natural supraglacial debris in relation to modelling sub-debris ice ablation: properties of supraglacial debris. Earth Surf. Process. Landforms 38, 490–501. doi:10.1002/esp.3299
Nicholson, L. I., McCarthy, M., Pritchard, H. D., and Willis, I. (2018). Supraglacial debris thickness variability: impact on ablation and relation to terrain properties. Cryosphere 12, 3719–3734. doi:10.5194/tc-12-3719-2018
Nuth, C., and Kääb, A. (2011). Co-registration and bias corrections of satellite elevation data sets for quantifying glacier thickness change. Cryosphere 5, 271–290. doi:10.5194/tc-5-271-2011
Ohmura, A. (2011). Observed mass balance of mountain glaciers and Greenland ice sheet in the 20th century and the present trends. Surv. Geophys 32, 537–554. doi:10.1007/s10712-011-9124-4
östrem, G. (1959). Ice melting under a thin layer of moraine, and the existence of ice cores in moraine ridges. Geogr. Ann. 41, 228–230. doi:10.1080/20014422.1959.11907953
Paul, F., Barrand, N. E., Baumann, S., Berthier, E., Bolch, T., Casey, K., et al. (2013). On the accuracy of glacier outlines derived from remote-sensing data. Ann. Glaciol. 54, 171–182. doi:10.3189/2013AoG63A296
Paul, F., Bolch, T., Kääb, A., Nagler, T., Nuth, C., Scharrer, K., et al. (2015). The glaciers climate change initiative: methods for creating glacier area, elevation change and velocity products. Remote Sens. Environ. 162, 408–426. doi:10.1016/j.rse.2013.07.043
Pieczonka, T., and Bolch, T. (2015). Region-wide glacier mass budgets and area changes for the Central Tien Shan between ∼1975 and 1999 using Hexagon KH-9 imagery. Glob. Planet. Change 128, 1–13. doi:10.1016/j.gloplacha.2014.11.014
Pratap, B., Dobhal, D. P., Bhambri, R., Mehta, M., and Tewari, V. C. (2016). Four decades of glacier mass balance observations in the Indian Himalaya. Reg. Environ. Change 16, 643–658. doi:10.1007/s10113-015-0791-4
Pratap, B., Dobhal, D. P., Mehta, M., and Bhambri, R. (2015). Influence of debris cover and altitude on glacier surface melting: A case study on Dokriani Glacier, central himalaya, India. Ann. Glaciol. 56, 9–16. doi:10.3189/2015AoG70A971
Quincey, D. J., Luckman, A., and Benn, D. (2009). Quantification of Everest region glacier velocities between 1992 and 2002, using satellite radar interferometry and feature tracking. J. Glaciol. 55, 596–606. doi:10.3189/002214309789470987
Racoviteanu, A. E., Paul, F., Raup, B., Khalsa, S. J. S., and Armstrong, R. (2009). Challenges and recommendations in mapping of glacier parameters from space: results of the 2008 global land ice measurements from space (GLIMS) workshop, boulder, Colorado, USA. Ann. Glaciol. 50, 53–69. doi:10.3189/172756410790595804
Reid, T. D., and Brock, B. W. (2010). An energy-balance model for debris-covered glaciers including heat conduction through the debris layer. J. Glaciol. 56, 903–916. doi:10.3189/002214310794457218
Reid, T. D., and Brock, B. W. (2014). Assessing ice-cliff backwasting and its contribution to total ablation of debris-covered Miage glacier, Mont Blanc massif, Italy. J. Glaciol. 60, 3–13. doi:10.3189/2014JoG13J045
Remya, S. N., Kulkarni, A. V., Hassan Syed, T., and Nainwal, H. C. (2022). Glacier mass loss in the Alaknanda basin, Garhwal Himalaya on a decadal scale. Geocarto Int. 37, 3014–3032. doi:10.1080/10106049.2020.1844309
Reznichenko, N., Davies, T., Shulmeister, J., and McSaveney, M. (2010). Effects of debris on ice-surface melting rates: an experimental study. J. Glaciol. 56, 384–394. doi:10.3189/002214310792447725
Rodríguez, E., Morris, C. S., and Belz, J. E. (2006). A global assessment of the SRTM performance. Photogrammetric Eng. Remote Sens. 72, 249–260. doi:10.14358/PERS.72.3.249
Rolstad, C., Haug, T., and Denby, B. (2009). Spatially integrated geodetic glacier mass balance and its uncertainty based on geostatistical analysis: application to the western svartisen ice cap, Norway. J. Glaciol. 55, 666–680. doi:10.3189/002214309789470950
Rowan, A. V., Egholm, D. L., Quincey, D. J., and Glasser, N. F. (2015). Modelling the feedbacks between mass balance, ice flow and debris transport to predict the response to climate change of debris-covered glaciers in the Himalaya. Earth Planet. Sci. Lett. 430, 427–438. doi:10.1016/j.epsl.2015.09.004
Sakai, A., and Fujita, K. (2010). Formation conditions of supraglacial lakes on debris-covered glaciers in the Himalaya. J. Glaciol. 56, 177–181. doi:10.3189/002214310791190785
Sakai, A., Nakawo, M., and Fujita, K. (2002). Distribution characteristics and energy balance of ice cliffs on debris-covered glaciers, Nepal himalaya. Arct. Antarct. Alp. Res. 34, 12–19. doi:10.1080/15230430.2002.12003463
Sakai, A., Takeuchi, N., Fujita, K., and Nakawo, M. (2000). Role of supraglacial ponds in the ablation process of a debris-covered glacier in the Nepal Himalaya. Wallingford: IAHS Publication, 119–132.
Scherler, D., Bookhagen, B., and Strecker, M. R. (2011). Spatially variable response of Himalayan glaciers to climate change affected by debris cover. Nat. Geosci. 4, 156–159. doi:10.1038/ngeo1068
Scherler, D., Leprince, S., and Strecker, M. (2008). Glacier-Surface velocities in alpine terrain from optical satellite imagery—accuracy improvement and quality assessment. Remote Sens. Environ. 112, 3806–3819. doi:10.1016/j.rse.2008.05.018
Scherler, D., and Strecker, M. R. (2012). Large surface velocity fluctuations of Biafo Glacier, central Karakoram, at high spatial and temporal resolution from optical satellite images. J. Glaciol. 58, 569–580. doi:10.3189/2012JoG11J096
Schwitter, M. P., and Raymond, C. F. (1993). Changes in the longitudinal profiles of glaciers during advance and retreat. J. Glaciol. 39, 582–590. doi:10.3189/S0022143000016476
Shah, S. S., Banerjee, A., Nainwal, H. C., and Shankar, R. (2019). Estimation of the total sub-debris ablation from point-scale ablation data on a debris-covered glacier. J. Glaciol. 65, 759–769. doi:10.1017/jog.2019.48
Sharma, P., Patel, L. K., Ravindra, R., Singh, A., K, M., and Thamban, M. (2016). Role of debris cover to control specific ablation of adjoining Batal and Sutri Dhaka glaciers in Chandra Basin (Himachal Pradesh) during peak ablation season. J. Earth Syst. Sci. 125, 459–473. doi:10.1007/s12040-016-0681-2
Shean, D. E., Bhushan, S., Montesano, P., Rounce, D. R., Arendt, A., and Osmanoglu, B. (2020). A systematic, regional assessment of High Mountain Asia Glacier Mass balance. Front. Earth Sci. 7, 363. doi:10.3389/feart.2019.00363
Shroder, J. F., Bishop, M. P., Copland, L., and Sloan, V. F. (2000). Debris-covered glaciers and rock glaciers in the nanga parbat himalaya, Pakistan. Geogr. Ann. Ser. A, Phys. Geogr. 82, 17–31. doi:10.1111/j.0435-3676.2000.00108.x
Shukla, A., and Garg, P. K. (2019). Evolution of a debris-covered glacier in the western himalaya during the last four decades (1971–2016): A multiparametric assessment using remote sensing and field observations. Geomorphology 341, 1–14. doi:10.1016/j.geomorph.2019.05.009
Shukla, A., and Garg, P. K. (2020). Spatio-temporal trends in the surface ice velocities of the central Himalayan glaciers, India. Glob. Planet. Change 190, 103187. doi:10.1016/j.gloplacha.2020.103187
Stokes, C. R., Popovnin, V., Aleynikov, A., Gurney, S. D., and Shahgedanova, M. (2007). Recent glacier retreat in the Caucasus Mountains, Russia, and associated increase in supraglacial debris cover and supra-/proglacial lake development. Ann. Glaciol. 46, 195–203. doi:10.3189/172756407782871468
Storey, J. C., and Choate, M. J. (2004). Landsat-5 bumper-mode geometric correction. IEEE Trans. Geosci. Remote Sens. 42, 2695–2703. doi:10.1109/TGRS.2004.836390
Swaroop, S., Oberai, L. K., Srivastava, D., and Gautam, C. K. (2001). “Recent fluctuations in snout front of Dunagiri and chaurabari glaciers, dhauliganga and Mandakini- Alaknanda basins, chamoli district, Uttar Pradesh,” in Proceedings of the symposium on snow, ice and glaciers – a himalayan perspective (Lucknow, India: Geological Survey of India), 77–81.
Thompson, S., Benn, D. I., Mertes, J., and Luckman, A. (2016). Stagnation and mass loss on a himalayan debris-covered glacier: processes, patterns and rates. J. Glaciol. 62, 467–485. doi:10.1017/jog.2016.37
Tiwari, R. K., Gupta, R. P., and Arora, M. K. (2014). Estimation of surface ice velocity of Chhota-Shigri glacier using sub-pixel ASTER image correlation. Curr. Sci. 106, 853–859.
van Woerkom, T., Steiner, J. F., Kraaijenbrink, P. D. A., Miles, E. S., and Immerzeel, W. W. (2019). Sediment supply from lateral moraines to a debris-covered glacier in the Himalaya. Earth Surf. Dyn. 7, 411–427. doi:10.5194/esurf-7-411-2019
Vijay, S., and Braun, M. (2018). Early 21st century spatially detailed elevation changes of Jammu and Kashmir glaciers (Karakoram–Himalaya). Glob. Planet. Change 165, 137–146. doi:10.1016/j.gloplacha.2018.03.014
Vijay, S., and Braun, M. (2016). Elevation change rates of glaciers in the lahaul-spiti (western himalaya, India) during 2000–2012 and 2012–2013. Remote Sens. 8, 1038. doi:10.3390/rs8121038
Vilímek, V., Klimeš, J., Emmer, A., and Benešová, M. (2015). Geomorphologic impacts of the glacial lake outburst flood from Lake No. 513 (Peru). Environ. Earth Sci. 73, 5233–5244. doi:10.1007/s12665-014-3768-6
Vohra, C. P. (1981). “Himalayan glaciers,” in The Himalaya: The aspects of change (Delhi: Oxford University Press), 138–151.
Wang, D., and Kääb, A. (2015). Modeling glacier elevation change from DEM time series. Remote Sens. 7, 10117–10142. doi:10.3390/rs70810117
Zhang, Y., Gu, J., Liu, S., Wang, X., Jiang, Z., Wei, J., et al. (2022). Spatial pattern of the debris-cover effect and its role in the Hindu Kush-Pamir-Karakoram-Himalaya glaciers. J. Hydrology 615, 128613. doi:10.1016/j.jhydrol.2022.128613
Zhang, Y., Liu, S., Liu, Q., Wang, X., Jiang, Z., and Wei, J. (2019). The role of debris cover in catchment runoff: A case study of the hailuogou catchment, south-eastern Tibetan plateau. Water 11, 2601. doi:10.3390/w11122601
Zhao, C., Yang, W., Miles, E., Westoby, M., Kneib, M., Wang, Y., et al. (2022). Thinning and surface mass balance patterns of two neighbouring debris-covered glaciers in the southeastern Tibetan Plateau. Glaciers/Glaciers 17, 3895–3913. doi:10.5194/tc-17-3895-2023
Zhou, S., Sun, Z., and Sun, P. (2022). Rapid Glacier shrinkage in the gongga mountains in the last 27 years. Remote Sens. 14, 5397. doi:10.3390/rs14215397
Zhou, Y., Li, Z., Li, J., Zhao, R., and Ding, X. (2019). Geodetic glacier mass balance (1975–1999) in the central Pamir using the SRTM DEM and KH-9 imagery. J. Glaciol. 65, 309–320. doi:10.1017/jog.2019.8
Keywords: glacier mass balance, debris cover, glacier velocity, supraglacial morphology, central Himalaya
Citation: Garg PK, Mehta M, Shukla A, Chauhan P, Kesarwani K and Mukherjee S (2023) Supraglacial geomorphology of Companion Glacier, central Himalaya: evolution, controls and consequences. Front. Earth Sci. 11:1219755. doi: 10.3389/feart.2023.1219755
Received: 09 May 2023; Accepted: 22 September 2023;
Published: 04 October 2023.
Edited by:
Akshaya Verma, National Institute of Hydrology, IndiaReviewed by:
Yong Zhang, Hunan University of Science and Technology, ChinaRaaj Ramsankaran, Indian Institute of Technology Bombay, India
Copyright © 2023 Garg, Mehta, Shukla, Chauhan, Kesarwani and Mukherjee. This is an open-access article distributed under the terms of the Creative Commons Attribution License (CC BY). The use, distribution or reproduction in other forums is permitted, provided the original author(s) and the copyright owner(s) are credited and that the original publication in this journal is cited, in accordance with accepted academic practice. No use, distribution or reproduction is permitted which does not comply with these terms.
*Correspondence: Purushottam Kumar Garg, cGsuZ2FyZ0BnYnBpaGVkLm5pYy5pbg==, Z2FyZy5nbGFjaW9AZ21haWwuY29t
†ORCID: Purushottam Kumar Garg, https://orcid.org/0000-0001-5314-0566