 Ewan-Loiz Pelleter1*
 Mélanie Principaud1Anne-Sophie Alix1Audrey Boissier1Sandrine Cheron1Florian Besson1Vincent Altorffer1Charline Guérin1Arnaud Gaillot1Delphine Pierre1Mathieu Rospabé1
 Thomas Giunta1
 Léa Grenet1Cecile Cathalot1
 Marie-Anne Cambon2Yves Fouquet1
- 1Geo-Ocean, University Brest, CNRS, Ifremer, UMR6538, Plouzane, France
- 2University Brest, Ifremer, CNRS, BEEP, Plouzané, France
Introduction: Although, there is an increasing focus on inactive or extinct seafloor massive sulfide (SMS) deposits driven by the possibility of marine mining, only few studies have been devoted to them so far. The Trans-Atlantic Geotraverse (TAG) hydrothermal field is probably one of the best-studied hydrothermal systems even if the relict SMS deposits known since the mid-1980s have not been thoroughly explored.
Objectives: The main objective of this study was to describe the characteristics of these so-called inactive sites.
Methods: During four different expeditions, we acquired high-resolution acoustic data and performed numerous human occupied vehicle (HOV) dive operations including extensive rock sampling and in-situ temperature measurements.
Results and Discussion: We discovered thirteen new hydrothermal mounds including six large (i.e. > 5,000 m2) deposits making the TAG hydrothermal field one of the largest accumulation of hydrothermal materials (21.1 Mt) known on the seafloor. However, copper and zinc grades of the largest SMS deposits remain low (i.e. < 1.4 wt%) even compared to on-land volcanogenic massive sulfide deposits. Additionally, eight areas of diffuse hydrothermal fluid flow were identified challenging the presumed inactivity of these SMS deposits and, for the first time, emphasizing the importance of low temperature (LT) hydrothermal activity in whole the TAG field. Inactive and weakly active SMS deposits exhibit a large diversity of surface mineralization (e.g. sulfides, Fe-Mn mineralization, jasper) illustrating complexity of hydrothermal activities but also different ageing history. Several mounds no longer have visible sulfide chimneys and are covered by a widespread layer of manganese and iron oxyhydroxides attesting the longevity of diffuse fluid flow at specific locations even long after last high-temperature (HT) hydrothermal activity has ceased. This contrasts with SMS deposits that are devoid of extensive LT precipitates but characterized by standing or topped sulfide chimney indicating a relatively abrupt cessation of HT hydrothermal activity.
Conclusion: Together these results allow us to propose evolution models to explain the diversity of active, weakly active and inactive SMS deposits in the TAG hydrothermal field.
1 Introduction
Seafloor massive sulfide (SMS) deposits are now seen as a possible future resource for base (Zn and Cu), precious (Au and Ag), and rare metals (Se, In, and Ge) (Cathles, 2011; Petersen et al., 2016). However, considered as analogous to land-based volcanogenic massive sulfide (VMS) deposits, SMS deposits are still poorly characterized regarding their distribution, size, and accurate metal tenors. The cumulative tonnage of the 62 best-documented SMS deposits is estimated to be 50 Mt and less than 42 Mt if only large (>5,000 m2) deposits are considered (Hannington et al., 2010; Hannington et al., 2011). Copper and zinc median grades of SMS (Cu + Zn = 14.9 wt%; n = 62) are higher than those reported for VMS deposits; however, calculations are generally made on the basis of surface sampling, which are not representative of the whole, tridimensional deposits (Hannington et al., 2010; 2011; Lehrmann et al., 2018). Hence, the short-term economic potential of SMS deposits remains highly hypothetical, especially as most of the known SMS deposits are currently active and should be preserved from any exploitation (Van Dover et al., 2018). Research efforts have to be carried out on finding and characterizing inactive and extinct SMS deposits that received little attention from geologists and biologists since the discovery of the first hydrothermal vent and related ecosystems in 1977.
The TAG hydrothermal field on the Mid-Atlantic Ridge is the most extensively studied hydrothermal field in the context of a slow-spreading ridge and is one of those with a higher occurrence of the so-called inactive deposit in the present-day oceans. The spatial distribution of SMS deposits is intriguing and raises fundamental questions about the spatial and temporal evolution of hydrothermal systems associated with detachment faults (Humphris et al., 2015; Graber et al., 2020). Although TAG has been the focus of recent scientific expeditions that have discovered new SMS deposits (Gehrmann et al., 2019; Graber et al., 2020), some of which are being described as extinct (Lehrmann et al., 2018; Murton et al., 2019), few submersible dives and related sampling operations have been carried out on these relict zones since 1994 (Rona et al., 1993a; Humphris and Cann, 2000). As a result, there are still many knowledge gaps about the precise nature of the so-called inactive SMS deposits in the TAG hydrothermal field, including their extent, mineralogy, and geochemistry. Additionally, no detailed exploration aimed at identifying and characterizing areas of hydrothermal fluid flows (e.g., diffuse venting) has been performed, even though this is one of the most important parameters for defining an SMS as active or inactive (Jamieson and Gartman, 2020). Here, we present the results of four cruise expeditions combining high-resolution mapping, dive observations, comprehensive sampling, and temperature measurements that provide new insights into the diversity, spatial distribution, and evolution of inactive and weakly active SMS deposits at slow-spreading ridges.
2 Geological setting
The TAG hydrothermal field is located on a 40-km-long ridge segment with an hourglass morphology, narrowing and shallowing toward the center (Purdy et al., 1990; Sempéré et al., 1990; Smith and Cann, 1990) and bounded to the north and south by non-transform discontinuities. The segment is characterized by a morphological asymmetry between the western and eastern flanks. The western rift valley wall consists of fault escarpments and sedimented terraces (Kleinrock and Humphris, 1996a; Kleinrock and Humphris, 1996b; Humphris and Kleinrock et al., 1996), and volcanic activity in the axial valley is expressed by the juxtaposition of individual volcanoes (Rona et al., 1993b; White et al., 1998). The eastern wall is characterized by a higher, steeper, but smoother morphology than the western flank, and it exposes lower crustal rocks (Zonenshain et al., 1989). Together with the acquisition of magnetic and seismic data, this led authors to identify a detachment fault most likely active since the last 1.35 Myr (Tivey et al., 2003; Canales et al., 2007; deMartin et al., 2007; Zhao et al., 2012). It is now widely accepted that detachment faulting somehow controls the hydrothermal circulation beneath the TAG hydrothermal field, although some debates exist about the location of the heat source (deMartin et al., 2007; Guo et al., 2023; Zhao et al., 2012).
The TAG hydrothermal field is located on the hanging wall of the detachment fault. The whole field spans over an area of 45 km2, though it has been roughly divided into two main hydrothermal areas distanced by 2 km (Figure 1). The low-temperature zone (LTZ) discovered in 1972–1973 (Scott et al., 1974; Rona et al., 1975) lies at a water depth between 3,000 and 2,500 m and spreads over an area of 12 km2. Temperature anomalies recorded during HOV Alvin dives were suggestive of probable low-temperature hydrothermal venting at least at one site (Rona et al., 1984). Mineralization mainly consists of low-temperature (LT) Fe–Mn–Si deposits that were formed between 125 and 4 kyr (Lalou et al., 1986). The high-temperature zone (HTZ; Figure 1) lies at a water depth between 3,700 and 3,400 m and was first discovered in 1985 with the TAG active mound (Rona et al., 1986). The TAG active mound is a 200-m-diameter and 50-m-high SMS deposit and the only one in the TAG hydrothermal field to exhibit high-temperature (up to 366°C) hydrothermal activity. The deposit is located at the intersection of axis-parallel faults and axis-oblique faults and close to a large and highly faulted volcanic center (Karson and Rona, 1990; Kleinrock and Humphris, 1996; Bohnenstiehl and Kleinrock, 2000; Graber et al., 2020). It is composed of two stacked circular platforms linked to different hydrothermal events, anhydrite dissolution, and related collapse of the mound (Humphris et al., 1995; Humphris et al., 1996). The upper platform is topped to the north by the black smoker complex (BSC), a 10–15-m-tall cone-shaped structure, the locus of the high-temperature activity. No venting was observed at the lower platform since the late 1990s, confirming the extinction of Kremlin white smokers (Edmonds et al., 1996). Surface mineralization of the deposits is dominated by sulfides associated with anhydrite. Ocherous Fe oxides were also observed from the steep outer talus slopes on the western, northern, and eastern parts of the deposit (Tivey et al., 1995). A study of the ocher indicates oxidation of primary sulfide assemblages by an LT fluid concomitant with direct precipitation of Fe oxide and silica from this fluid (Tivey et al., 1995). The HTZ also contains several relict SMS deposits (Rona et al., 1993). In this relatively restricted area (approximately 15 km2), at least 14 hydrothermal deposits are present (for an equivalent mass of 22.1 Mt; Graber et al., 2020) including the active mound (360°C; Rona et al., 1986), the so-called inactive deposits of the Alvin zone, the MIR zone characterized by high heat flow (Rona et al., 1996), and the LT shimmering mound (22.5°C). Recent investigations including drilling operations provide a new model for inactive SMS deposits, highlighting a strong silicification process occurring at the closing stages of hydrothermal episodes (Murton et al., 2019). Sulfide mineralization was formed between 102 kyr and the present, and the dating of two manganese crusts provides an estimated age of 140 and 74 kyrs (Lalou et al., 1990; Lalou et al., 1993; Lalou et al., 1995).
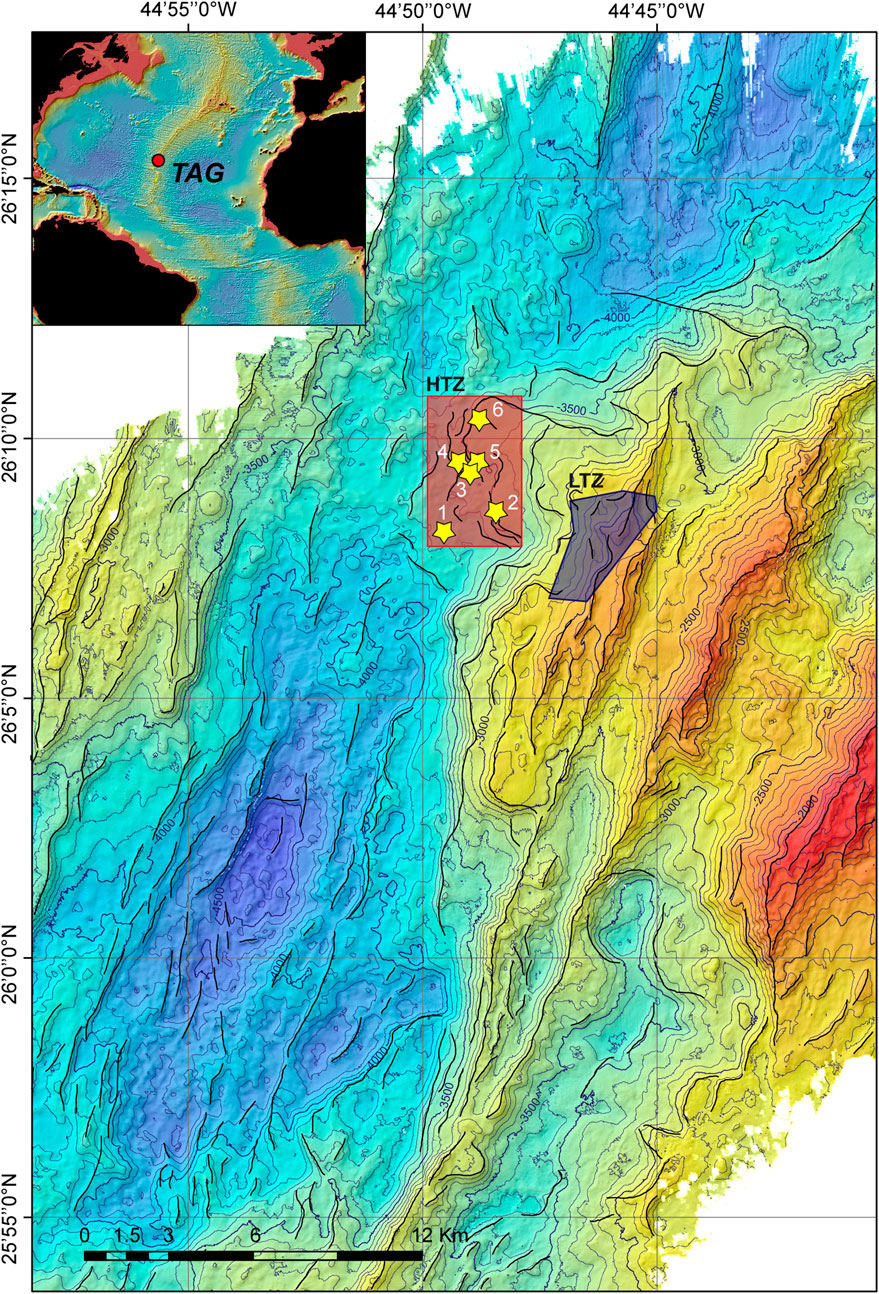
Figure 1. Bathymetric map (with 100 m contours) of the TAG region. The HTZ corresponds to the high-temperature zone, and yellow stars correspond to major SMS deposits: 1, TAG active mound; 2, MIR mound; 3, Southern mound; 4, Shinkai mound; 5, Double mound; 6, Shimmering mound. See Figure 2 for detailed information on SMS deposits in the HTZ. The LTZ corresponds to the low-temperature zone enclosing several Fe–Mn–Si deposits and potential diffuse flow.
3 Materials and methods
3.1 Acoustic data
Acoustic data were acquired during the Cambon (2014) (https://doi.org/10.17600/14000100) cruise. Regional acoustic surveys were acquired between 8 and 10 knots using the hull-mounted Reson SeaBat 7150 MBES. High-resolution (HR) seafloor mapping was performed using the ROV Victor-mounted Reson SeaBat 7125 MBES (400 kHz). The surveys were made at 0.3 knots at a near-constant altitude of 50 m above seafloor. Horizontal resolutions of 1 m and 0.5 m were obtained for bathymetric maps and acoustic backscatter maps, respectively. Post-processing of raw data files was carried out with SonarScope and GLOBE software (©Ifremer).
3.2 Dive observations, measurements, and sampling
Thirteen dives with sampling and temperature measurements (HOV T-probe) using the HOV Nautile and ROV Victor were made during the Cambon (2014), Fouquet et al. (2017) (https://doi.org/10.17600/17000200), and Pelleter and Cathalot (2022) (https://doi.org/10.17600/18001851) cruises.
To avoid strong sampling bias (e.g., focusing on chimney samples), we favored systematic sampling across SMS deposits (Supplementary Figure S1). When achievable, we focused on massive blocks outcropping from the scarp fault. This strategy is thought to provide a representative view of surface and subsurface mineralization (first 5 m) and, if strongly oxidized samples are excluded, relatively good information of the SMS deposit grades in the upper zones.
3.3 Mineralogy and geochemistry
Sixty-six sulfide-rich rocks and 55 Fe–Mn oxides and silica-rich mineralization were analyzed (Supplementary Tables S1, S2). Mineral identification was done using X-ray diffraction (XRD) analyses conducted with a Bruker AXS D8 Advance diffractometer. Sample powder was top loaded into circular cavity holders, and all analyses were run between 5° and 70°2θ, with 0.01°2θ step at 1s/step (Cu–Kα radiation, 40 kV, 30 mA). Mineral identification was done using DIFFRAC.SUITE EVA software, and semi-quantitative estimation was performed using TOPAS software.
Major and trace element analyses were conducted with a wavelength-dispersive X-ray fluorescence spectrometer (WD-XRF; Bruker AXS S8 TIGER) on fusion beads or compressed pellets, respectively. After data acquisition, measured net peak intensities corrected from inter-element effects were converted into concentrations using relevant calibration curves generated from the analysis of certified reference materials. For gold analyses, samples were digested in aqua regia. Au was adsorbed on a membrane filter, and WD-XRF analysis was performed directly on the filter (Etoubleau et al., 1996).
3.4 Outlines of SMS deposits and volume/tonnage calculations
The geological limits of the SMS deposits are based on integration of dive observations, sample analyses, and bathymetry and backscatter data interpretation. Some outlines (and related volume calculation) must be taken with caution, particularly when no or low coverage of HR acoustic data was available and/or only limited length of the dive track passed through the SMS deposits.
Volume estimations were performed in ArcGIS software. Most of the volume calculations were done using a 2-m resolution digital terrain model (DTM). A lower-resolution DTM (i.e., 20 m) was used for some deposits that were not covered by HR acoustic data surveys. The first step is to use the outlines of SMS deposits for clipping the bathymetric data. In the second step, we generate a reference surface using interpolation methods. The reference surface will represent the expected topography before the formation of SMS deposits (Graber et al., 2020; Sanchez-Mora et al., 2022). Two interpolation methods were tested using the ArcGIS spatial analyst toolbox: (i) inverse distance weighted interpolation and (ii) “Topo to Raster” interpolation tool (see Supplementary Material for details). After interpolation is done, we calculate the volume between the reference surface and the initial DTM. Tonnage is calculated with an average density value of 3.5 t/m3 (see Supplementary Material for details).
4 Results
4.1 Hydrothermal zones in the HTZ and characteristics of hydrothermal deposits
According to the spatial distribution of hydrothermal deposits, type of mineralization, and morphology of the mounds, we propose to distinguish four hydrothermal zones (Figure 2): (1) MIR zone, (2) Nautile zone, (3) Alvin zone, and (4) shimmering zone. Note that the Alvin zone defined here corresponds to the Alvin relict zone described by Tivey et al. (1995) and to the southern part of the Alvin relict zone (also called North relict hydrothermal zone) defined by Rona et al. (1986); Rona et al. (1993a). Similarly, the Nautile hydrothermal zone hosts the Abyss mound (discovered by Graber et al., 2020) and most likely includes the northern part of the historical MIR zone defined by Rona et al. (1993a).
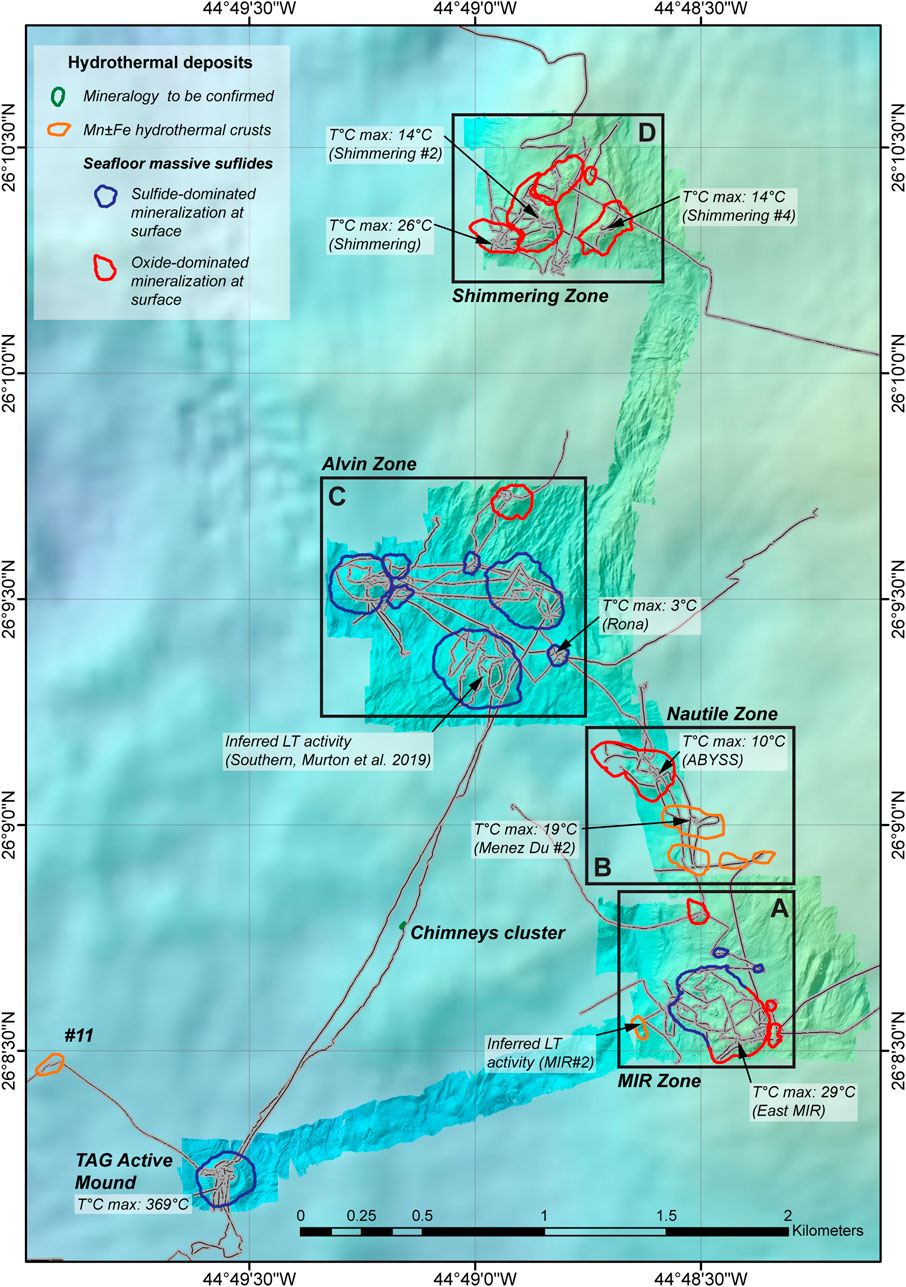
Figure 2. Spatial distribution of the 28 SMS deposits in the HTZ of the TAG hydrothermal field. Blue contours: SMS deposits where surface mineralization is dominated by sulfide-rich rocks. Red contours: SMS deposits where surface mineralization is dominated by oxyhydroxide-rich rocks. The maximum temperatures measured for hydrothermal venting are reported. “Inferred LT activity” corresponds to an area where orange/pale yellow precipitates were observed during submersible dives. Black lines with gray halos correspond to submersible dives (HOV Nautile and ROV Victor). High-resolution bathymetric map (1 m grid resolution) acquired during Cambon (2014) (Reson SeaBat 7125 MBES; ROV Victor).
There are also two scattered deposits to the southwest (mound #11 and chimney cluster; Figure 2). Mound #11 is a deposit discovered 750 m northwest of the active mound by Graber et al. (2020) and is the most western deposit of the TAG district. Surface mineralization is mainly composed of the Mn±Fe±Si hydrothermal crust covered by pelagic sediment. The summit exhibits a relatively flat, hill-shaped morphology with no visible chimney structure. The small cluster (10–20 m length) of chimneys is located 1.2 km northeast of the active mound. Chimneys lie on pelagic sediments and are distributed along a NNE–SSW fault (axis-parallel faults) and close to an axis-oblique fault.
4.1.1 MIR zone
The MIR zone (Rona et al., 1986; Rona et al., 1993a; Rona et al., 1993b) is a hydrothermal area of 0.5 km2 located 2 km east of the active mound (Figure 2). Recent studies (Murton et al., 2019; Graber et al., 2020) point out the presence of a major structural feature in this area: a N–S-trending, west-facing fault that extends more than 1 km to the north. At least seven hydrothermal deposits are identified in the MIR zone, and all but one (MIR #2) are located east of the N–S fault on an elevated block (Figure 2). The main mineralized area (MIR) is an oval-shaped 500-m-long and 300-m-wide zone with different morphologies and mineralized structures from the east to the west (Figures 3A, 4A–F). The western part of the MIR zone can be subdivided into two subzones: subzones A and B (Figure 3A), both being separated by an E–W-trending gully composed of metalliferous sediments covered by Mn±Fe±Si hydrothermal crust and/or pelagic sediment. On HR bathymetric maps, subzones A and B are characterized by areas of rough texture which correspond to boulders of massive to semi-massive sulfides, ocherous Fe oxides, jasper, and toppled and standing sulfide chimneys (Figure 4A). The major N–S-trending fault bounds the western border of subzone A and exposes the interior of the mound (Figure 4C). Most of the steep slope consists of broken rock fragments of basalts, together with strongly altered (±mineralized) basalts and sulfides (Figure 4B). Around 5 m under the toppled chimneys, a sharp and narrow transition between altered and mineralized basalts, massive sulfides, and sulfide chimneys (Figure 4C) indicates that deposits in the western part of subzone A are relatively thin (less than 10 m thick). The presence of basalt scree under LT hydrothermal crusts on the plateau between the western limit of subzone A and subzone B confirms that massive sulfide layers do not exceed several meters of thickness in the southwest of the MIR. The thickness of the SMS deposits is greater further east or in subzone B, but most likely does not exceed 25–30 m. Subzone C is situated in the southeastern part of the MIR and has a “crescent-moon” shape. The top of this subzone (approximately 5,000 m2) exhibits a rough texture on bathymetric map data, similar to those observed for subzones A and B (Figure 3A). However, it does not correspond to chimneys and/or massive sulfide boulders but to metric to up to 6–7-m-tall Mn–Fe–Si mounds (Figure 4D). A widespread surface of these mounds exhibits an ongoing low-temperature activity (maximum T°C up to 29°C; Figure 4E). The associated pale orange and black precipitates are composed of Fe oxides, silica, bacterial mats, and Mn oxides. The northwestern part of subzone C and its flanks show a smooth texture on HR bathymetric map data related to Mn±Fe±Si hydrothermal crusts commonly covered by thin pelagic sediments (Figure 4F). Two holes were drilled on this smooth part of subzone C during the JC138 cruise (Lehrmann et al., 2018; 073RD and 076RD drill holes), which intersect massive sulfides at 3.6 mbsf under the Mn±Fe±Si hydrothermal crust and a jasper layer. The thickness of the mineralization in subzone C can be estimated to be up to 30 m on the basis of the topographic expression and dive observations made on the south and east flanks (see Supplementary Figure S2). Slopes at the MIR are relatively gentle (i.e., mean slope: 23.3°; Table 1), with the steep–slope talus (>40°) being restricted to southeastern and eastern parts of the site.
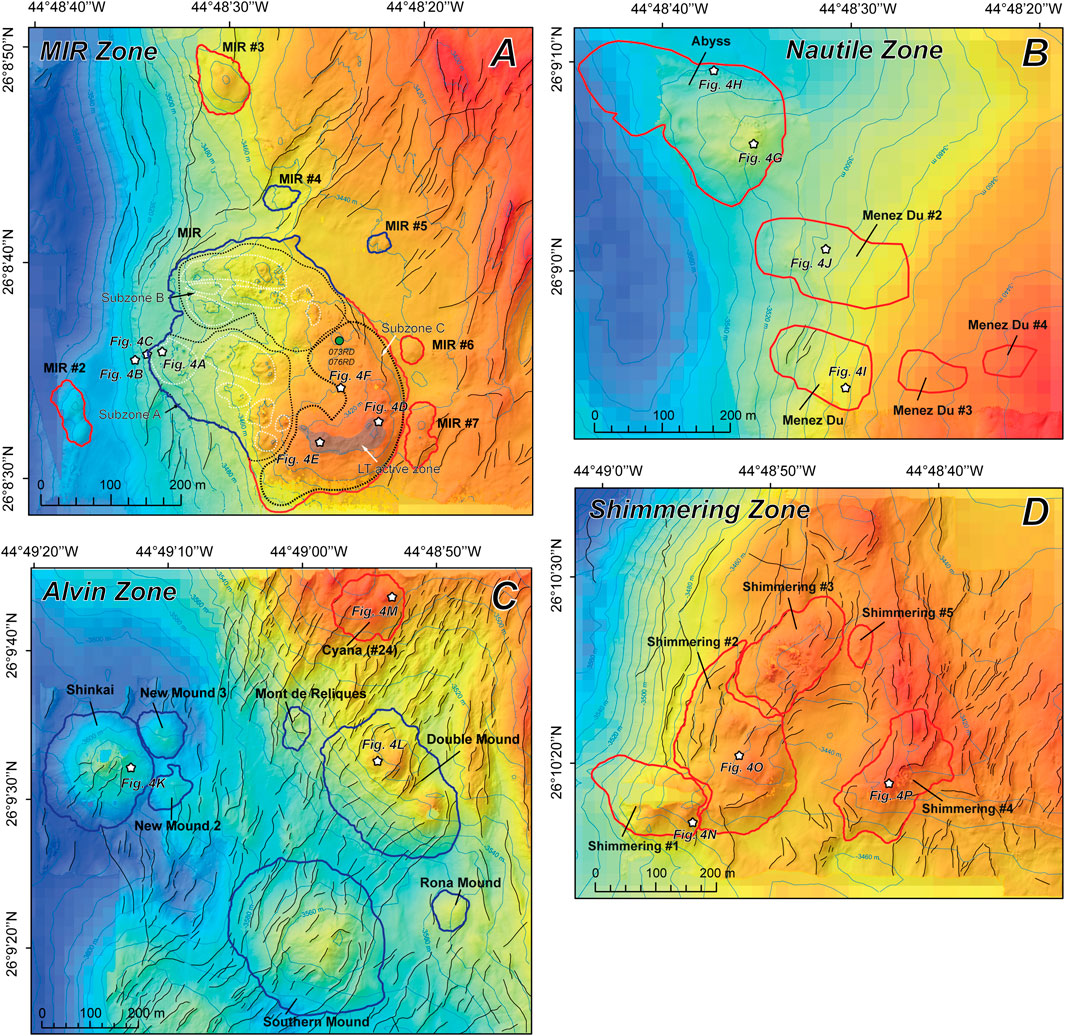
Figure 3. Bathymetric maps of the main hydrothermal zones of the TAG hydrothermal field. (A) MIR Zone. (B) Nautile Zone. (C) Alvin Zone. (D) Shimmering Zone. Red lines correspond to the proposed limits of the SMS mounds. White stars indicate the location of the photographs presented in Figures 4, 5. Black solid lines are lineaments (e.g., faults) interpreted from the HR bathymetric map.
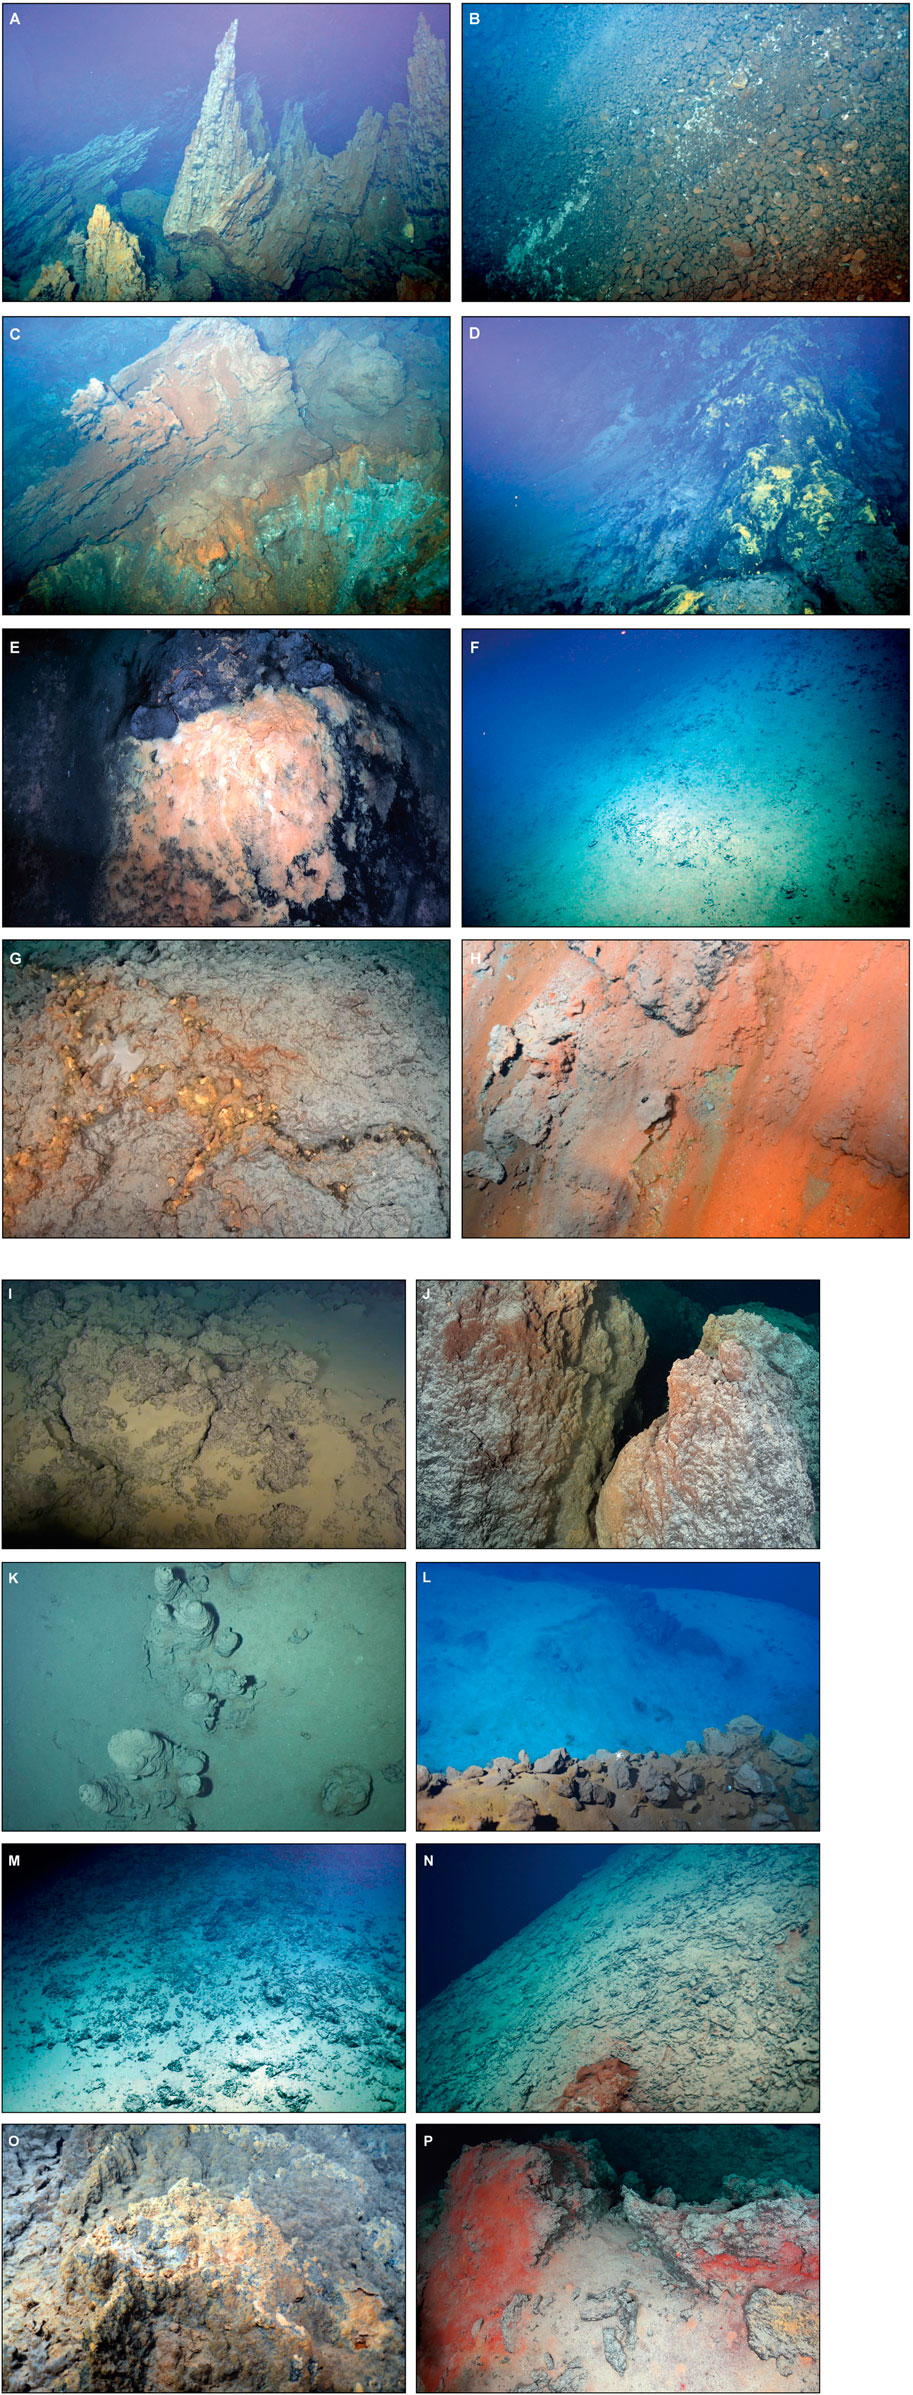
Figure 4. Photographs of surface mineralization in the TAG hydrothermal field. (A) Toppled sulfide chimneys (approximately 5–7 m tall) observed in the western part of the MIR mound (Subzone A). (B) Talus with polygenic rock blocks composed of basalt, altered basalts (white), and massive sulfides (west of subzone A; MIR). (C) Transition between altered basalt (white zone), massive sulfides (brown zone), and toppled chimney at the western edge of subzone A (MIR). (D) Iron–silica–manganese hydrothermal mounds (up to 7 m tall) with diffuse fluids (yellow areas) outcropping in the LT hydrothermal zone southeast of the MIR mound (subzone C). (E) Close-up of orange and pale yellow iron–silica precipitates surrounded by black manganese oxyhydroxides (MIR; subzone C). The measured temperature reaches 29°C. (F) Manganese crust with pelagic sediment cover (MIR). (G) Yellow–orange iron–silica precipitating in fractures inside the Mn–Fe–Si crust (ABYSS). The measured temperature reaches 10°C. (H) Nearly fully oxidized massive sulfides (note the bright red color) observed on the northern flank of the Abyss mound. (I) Thick manganese crust with pelagic sediment cover observed at the summit of Menez Du. (J) Metric oxide-rich blocks at the summit of Menez Du #2. Orange and red colors represent the ongoing precipitation of iron oxides from diffuse venting between the two blocks. The measured temperature reaches 19°C. (K) Standing inactive chimneys (approximately 1–2 m tall) observed approximately 50 m east of the summit of the Shinkai mound. (L) Massive sulfides scree observed at the fault scarp at the Double mound. A very low pelagic sediment cover indicates that fault movement was recent. In the background, massive sulfides are draped in the veil of the pelagic sediment. (M) Widespread manganese crust with pelagic sediment covering massive sulfides at the Cyana mound. (N) Manganese crust covering the southeast flank of the Shimmering mound. The brown–red block most likely corresponds to a part of a relict chimney with oxidation at the surface. (O) LT fluid (14°C) diffusing through Fe–Si precipitates near the summit of Shimmering zone #2. (P) Metric blocks composed of iron–silica-rich rocks (jasper) observed at the summit of Shimmering zone #4.
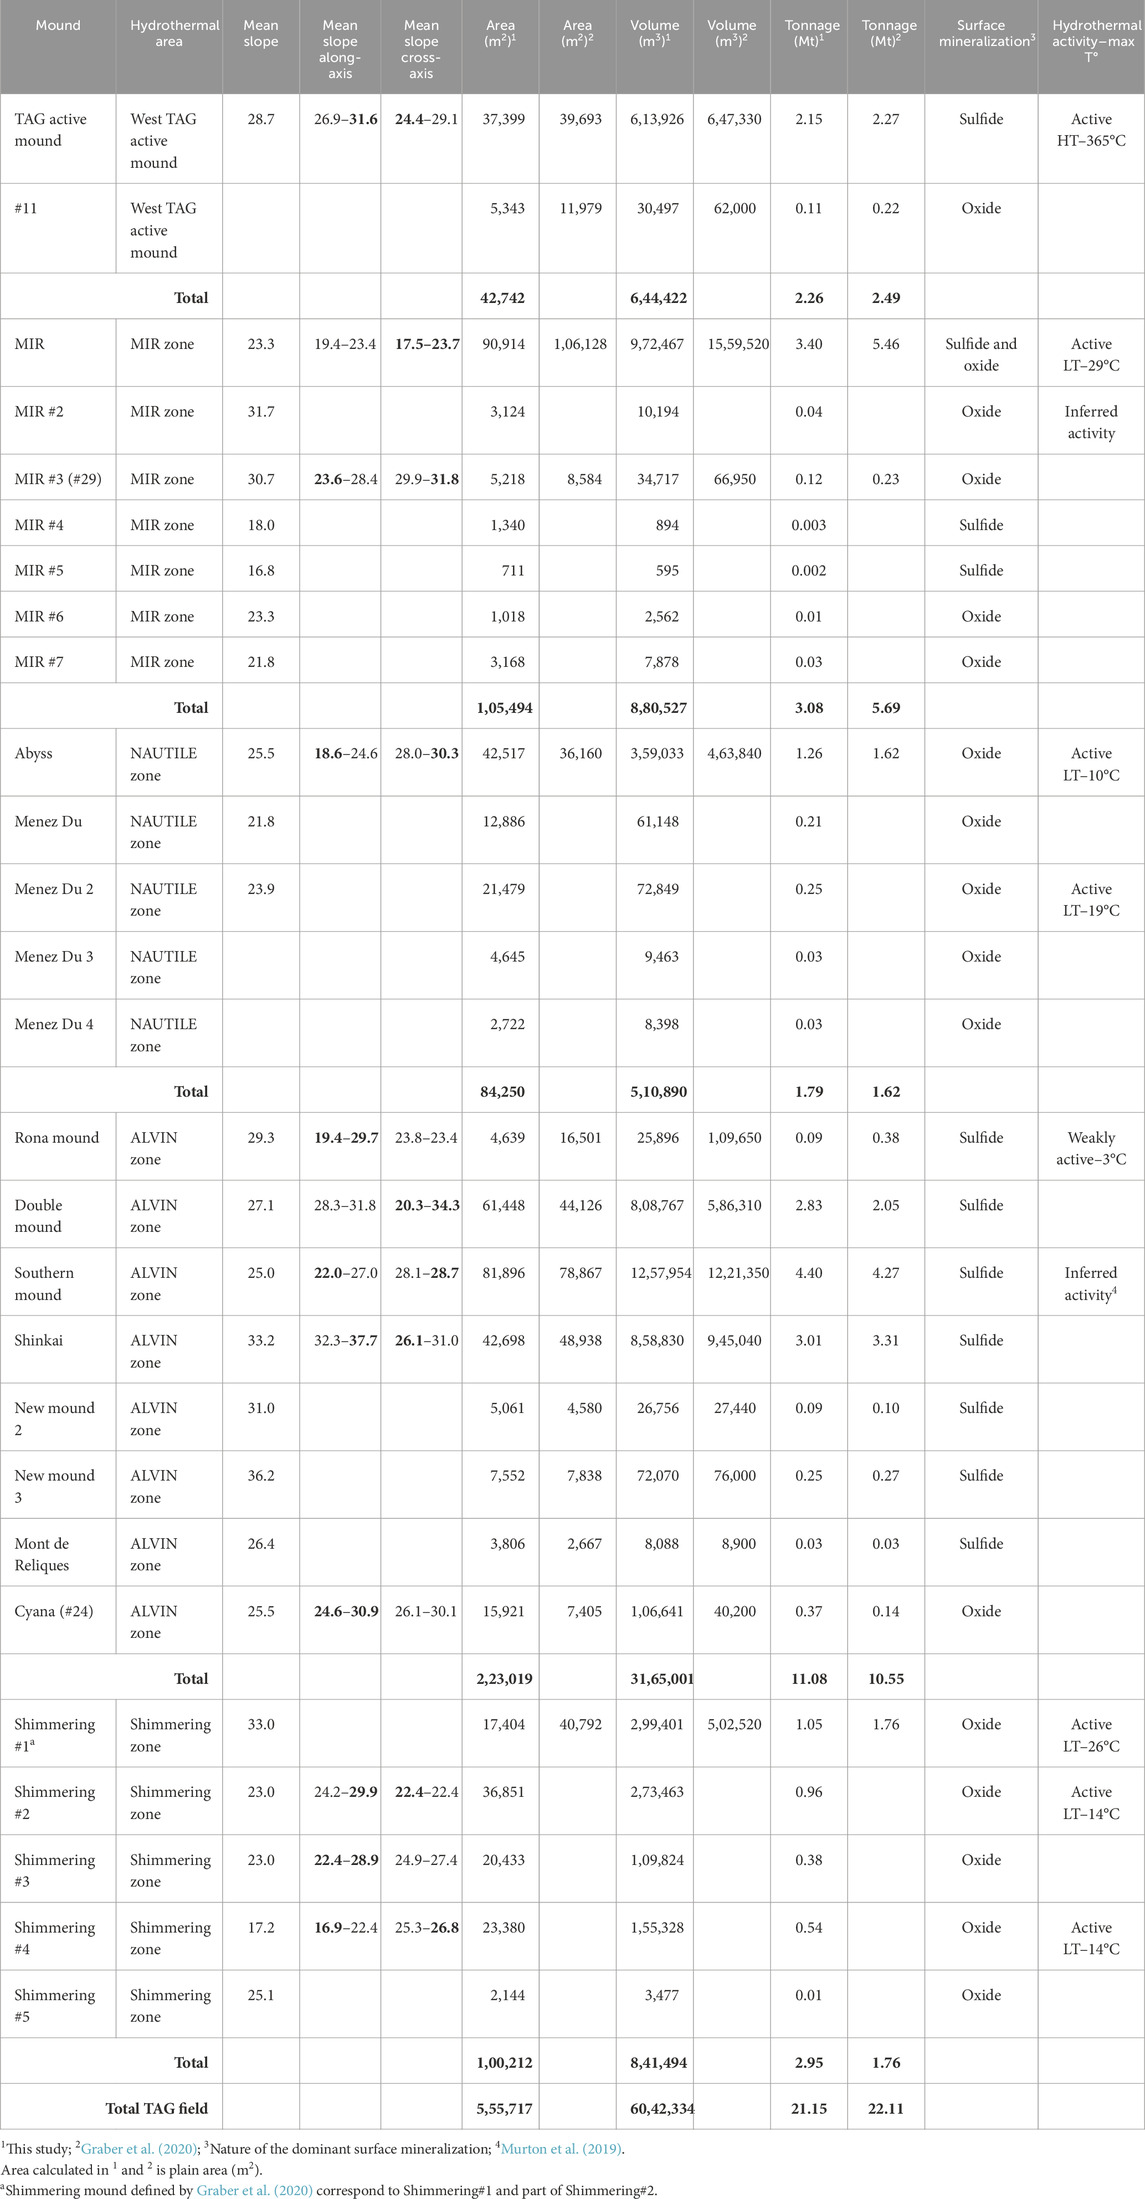
Table 1. Characteristics and volume and tonnage estimates for hydrothermal deposits in the TAG hydrothermal field.
The other hydrothermal mounds observed in the MIR zone (i.e., MIR #2 to #7) are relatively small, between 30 m and 70 m in diameter. They are separated into two groups based on surface mineralization (i.e., oxide-dominated or sulfide-dominated). The first group is composed of hydrothermal mounds covered by widespread Mn±Fe±Si hydrothermal crusts (MIR #2, #3, #6, and #7; Figure 3A) and pelagic sediments. The top of these deposits is relatively flat, and no standing sulfide chimneys were observed attesting to a long-ceased HT hydrothermal activity. The mean slopes are over 30.5° for MIR #2 and #3 and less than 23.5° for MIR #6 and #7 (Table 1). MIR #2 is made of two coalescent mounds controlled by an N–S-trending lineament. In the northern part of MIR #2, LT hydrothermal activity is inferred from the presence of iron oxide, silica, and bacterial mats that formed along cracks inside an Mn-rich crust. MIR #3 is bounded on its western part by the N–S-trending, west-facing fault. Though Mn±Fe±Si hydrothermal crusts dominate surface mineralization at MIR #3, dredge operation (HER2-DR16) performed on the west cliff provided a large diversity of mineralization including strongly silicified sulfide-bearing rocks and jaspers. MIR #6 and #7, located east of MIR, also show some evidence of the presence of an old high-temperature sulfide mineralization under the Mn±Fe±Si hydrothermal crusts (i.e., sample HER-PL20-06, MIR #6; massive sulfide rocks outcropping at MIR #7).
The second group of mounds (MIR #4 and MIR #5) corresponds to small and thin SMS deposits mainly composed of old broken and fallen chimneys and/or meter-sized (semi-)massive sulfide blocks. A few centimeter-thick, pelagic sediment layers cover the mineralization. The mean slopes are gentle (16.8°–18°; Table 1) because these deposits correspond to scattered sulfide blocks spread on a relatively flat area (<15°).
4.1.2 Nautile zone
The Nautile zone is adjacent to the MIR zone and is composed of at least five deposits in a hydrothermal area of 0.4 km2, with the southernmost deposit located just 130 m north of MIR #3 (Figure 2). The Abyss mound is located in the northwestern part of the Nautile zone (Figure 3B) and constitutes the largest hydrothermal deposit of the area (325 m × 200 m). It has a WNW–ESE elongated shape attributed to the coalescence of two distinct semi-circular mounds characterized by gentle downslope (18°–25°) from the east to the west. Eastward, the mound is made up of two platforms, with the upper platform (60 m in diameter) superposed rather symmetrically on the lower platform (200 m in diameter). The upper platform shows semi-circular depressions (3–4 m deep, up to 40 m in diameter) and is topped to the east by LT concretions, where weak hydrothermal activity (max: 10°C) is observed (Figure 4G). The talus on the steep slopes is composed of highly oxidized massive sulfides (Figure 4H). Westward, the deposit is composed of one platform (approximately 120 m in diameter) with a central depression attributed to a major collapse of the structure. The proportion of the pelagic sediment cover is relatively high, particularly in the upper part of the platforms where depressions, relatively flat areas, or gentle slopes dominate. Surface samples collected on the Abyss mound are mainly composed of iron oxyhydroxides. Pyrite is restricted to a few relict micrometric minerals in strongly oxidized breccia.
The four mounds have been named Menez Du (“black mound” in Breton), #2, #3, and #4 (Figure 3B) because of the presence of massive Mn concretions and crusts outcropping that form pelagic sediments (Figure 4I). These mounds have flat morphologies with gentle slopes (<25°). The top of Menez Du #2 is composed of hill-shaped oxide structures with few plurimetric oxide-dominated blocks at the top. Low-temperature diffusive venting with pale orange precipitates develops along cracks onto Mn±Fe±Si crusts (17.7°C) or between plurimetric-scale oxide blocks (19°C; Figure 4J). At Menez Du, #3 and #4, mineralization is barely visible under the pelagic sediment cover. Iron oxyhydroxide patches are observed along fault scraps, and massive Mn crusts and mounds outcrop at the top of the mounds. Outlines of Menez Du #3 and #4 are unclear and must be taken with caution since 1) no HR acoustic data are available, 2) observations were done during one sole dive, and 3) pelagic sediments cover a large surface of the mounds.
4.1.3 Alvin zone
The Alvin zone is a hydrothermal zone of ca. 1 km2 located just northwest of the Nautile zone (Figure 2). Eight SMS deposits including three of the largest (i.e., > 40,000 m2) SMS deposits of the TAG hydrothermal field are identified (Figure 3C; Table 1). All but one (Cyana) are dominated by sulfide-rich mineralization at the surface. Shinkai, new mounds #2 and #3, and Mont de reliques are topped by inactive chimneys (Figure 4K), attesting to a relatively recently ceased HT hydrothermal activity. These mounds have generally steep slopes (>30°; e.g., Shinkai; Table 1) and are unaffected by axis-parallel faults. The Shinkai mound is a 200-m-diameter SMS deposit characterized by a regular conical morphology only disrupted by some collapse structures just south and southwest of the summit. Surface mineralization is dominated by chimneys and semi-massive and highly silicified massive sulfides. Metalliferous sediments with scarce meter-scale sulfide blocks (massive sulfides and chimneys) are also present, particularly on the north and northwestern flank of the mound. The southern part of the Shinkai mound is characterized by the presence of meter-sized massive sulfide blocks due to mass wasting. New mound #3 is smaller than Shinkai but possesses similar morphology and surface mineralization. New mound #2 and Mont de reliques differ slightly by exhibiting an irregular central crater. Southern mound, Double mound, Cyana mound, and Rona mound are devoid of standing relict chimneys and generally display a flat surface covered by pelagic sediments at their summits. This indicates a relatively long-ceased HT hydrothermal activity. Southern mound and Double mound are strongly affected by NNW to NW faults (i.e., axis-parallel faults) that expose 1) decimeter- to meter-sized massive sulfide boulders (Figure 4L) embedded in sulfide–sulfate–oxide-rich sediments, 2) indurated sulfide- and/or oxide-rich sediments (with rare aragonite), and 3) chimney-derived materials. Meter-sized massive sulfide boulders related to mass wasting are common on the steepest slopes (e.g., southwestern flanks of the Double mound and Southern mound). Most samples collected in the fault correspond to semi-massive to massive sulfide blocks only oxidized at the surface. On the eastern edge of the Southern mound, a fault scarp shows iron-rich metalliferous sediments up to 7 m in thickness and with only few sulfide rubbles. At the Double mound, a large zone (40 m in diameter) of a thick metalliferous sediment layer (including blocks of the hydrothermal crust) is present in the northern part of the deposit. The Rona mound is a 60-m-diameter deposit lying on the top of a circular volcanic edifice. Gentle slopes (<25°) expose decimeter-sized sulfide-rich blocks embedded in pelagic sediments. Rare meter-sized sulfide boulders were observed on the northern and southern flanks where slopes are steeper (ca. 30°). Small patches of Si–Fe precipitates associated with microbial mats occur ca. 20–30 m from the summit to the north and west. No visible diffuse venting was observed, but a slight temperature anomaly was measured (i.e., 3°C). Similar patches observed at the Southern mound near the summit during dive HER-PL-17 might correspond to microbial mats identified by Murton et al. (2019). The Cyana mound is a 150-m-diameter SMS deposit formed by at least three flat hill-shaped edifices. Gentle slopes characterize the deposit, although it is dissected by a NE–SW axis-parallel fault. A striking feature of this mound compared to other SMS deposits in the Alvin zone is the extent of the LT Mn-rich hydrothermal crust (Figure 4M) that almost entirely covers the sulfide material and can reach a thickness of up to 10 cm. Sulfide rocks were only observed on a slump scarp located south of the NE–SW fault.
4.1.4 Shimmering zone
The shimmering zone is located 1 km north of the northern border of the Alvin zone (Figure 2) in the “smooth northern block” defined by Graber et al. (2020). This hydrothermal area of ca. 0.3 km2 is located on a bathymetric high bounded by a major west-facing N–S fault (Figure 2). It comprises at least five hydrothermal deposits including four large mounds (>10,000 m2) and one small mound (<5,000 m2) (Table 1). Shimmering, Shimmering #2, Shimmering #4, and Shimmering #5 coalesce into a large complex (up to 600 m long and 200 m wide) with a sigmoid-like shape (Figure 3D). Shimmering and Shimmering #2 are bounded to the west by the major N–S fault interpreted as a detachment surface (Szitkar et al., 2019). Shimmering #3 and #5 are located 150 m west of a detachment surface identified by Graber et al. (2020) at the southern edge of an N–S volcanic ridge. Shimmering #4 is separated from the other deposits by a small basin covered by mixed pelagic–hydrothermal sediments. Shimmering #4 lies at the intersection of an N–S volcanic ridge and an axis-perpendicular fault. The Shimmering zone surface mineralization is mainly composed of oxide-rich rocks including Mn crusts (Figure 4N), Fe ± Mn ± Si LT precipitates (Figure 4O), metalliferous sediments, and iron–silica-rich rocks (Figure 4P). Semi-massive sulfide mineralization outcropping is observed at the Shimmering mound where steep slopes (>30°) offer the opportunity to observe subsurface mineralization located under the LT Fe ± Mn ± Si hydrothermal crusts. Several metric-wide LT patches with fluid flow venting at temperatures up to 26°C were observed on the hydrothermal crust near the summit of the Shimmering mound. Widespread LT hydrothermal crusts cover the sub-circular Shimmering #2 mound. The base of the deposit is a 200-m-diameter platform with a steep SE flank (up to 30°) and a gentler NW flank (<25°). The platform is crosscut by N–S to NE–SW faults and topped by at least three smaller cone-shaped structures. These latter structures, less than 50 m in diameter and 15 m in height, appear unaffected by the faults and host several small LT patches (T° up to 14°C; Figure 4O). Shimmering #3 is a (200 m × 100 m) NE–SW-elongated mound with gentle slopes (mean slope 23°). Pelagic sediments cover most of the mineralization except at the summit where metric- to decametric-sized boulders outcrop (rough texture on the HR bathymetric map; Figure 3D). Surprisingly, these large boulders coated by a millimeter-thick hydrogenetic Fe–Mn layer are friable due to a high proportion of oxides and oxyhydroxides with a variable amount of silica. Shimmering #4 is a large (200 m x 100 m) NE–SW-elongated deposit characterized by gentle slopes (mean slope 17.2°). Pelagic sediments cover the base of the southern flank embedding widespread Mn ± Fe ± Si hydrothermal crusts. Metric to decametric boulders outcrop at the summit where an E–W fault and a NNE–SSW fault intersect. It corresponds to iron–silica mineralization (Figure 4P), most likely uplifted during tectonic dissection of the mound. Low-temperature fluids (up to 14°C) diffuse through cracks, and LT precipitates develop on the Fe–Si blocks. Shimmering #5 is a small mound where outcrop LT hydrothermal crusts are covered by pelagic sediments.
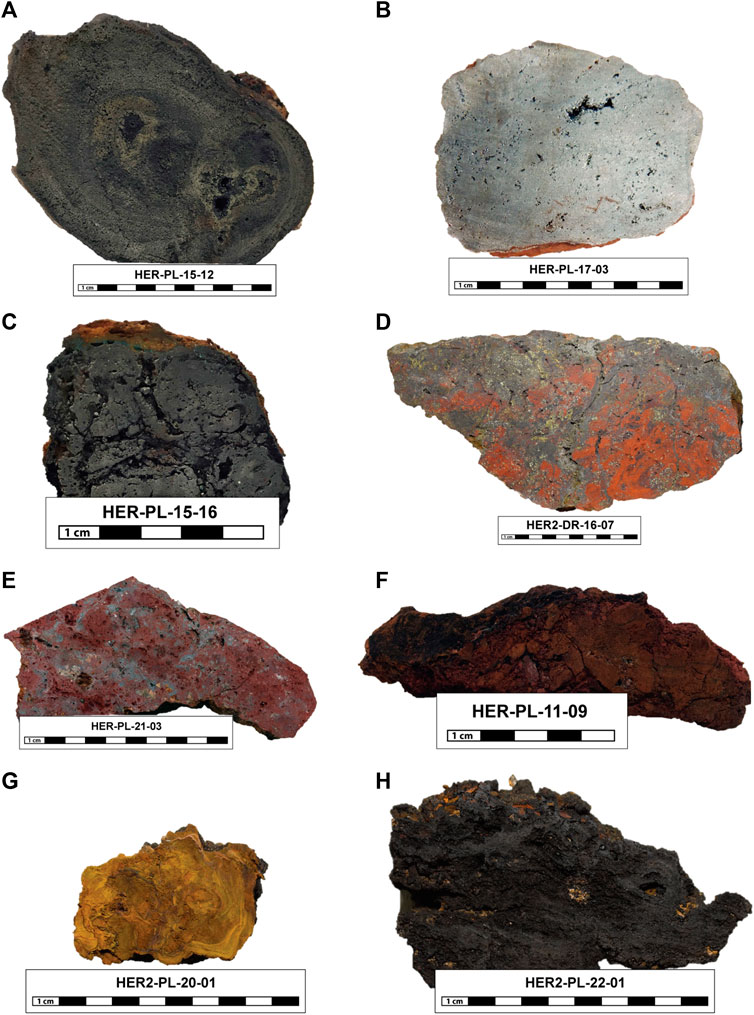
Figure 5. Photomicrographs representative of surface mineralization collected in the TAG hydrothermal field. (A) Chimney fragment (HER-PL-15-12; New mound #2) with two fluid conduits. The sample is mainly composed of pyrite, marcasite, and chalcopyrite. (B) Massive sulfides composed of recrystallized pyrite (HER-PL-17-03; Southern mound). (C) Massive sulfides with a brecciated structure (HER-PL-15-16; Double mound) mainly composed of pyrite. The thin lining of chalcopyrite at the boundary of pyrite clasts and cavities indicates late HT pulses (associated with anhydrite dissolution). (D) Jasper breccia (bright red) partially replaced by grayish pyritic hydrothermal chert indicating a reaction with reduced, hot (<150°C) fluids (HER-PL-16-07; MIR #3). (E) Jasper breccia material with a vuggy texture (HER-PL-21-03; MIR mound). (F) Fully oxidized sulfide breccia (HER-PL-11-09; Abyss mound). (G) Low-temperature Fe–Si precipitate (HER2-PL-20-01; Shimmering #3). (H). Cu and Zn-rich manganese hydrothermal crust (HER2-PL-22-01; Menez Du #3).
4.2 Mineralogy and geochemistry
4.2.1 Sulfide-rich mineralization
Sulfide-rich rocks were sampled in the MIR zone (n = 23), Alvin zone (n = 41), and Shimmering zone (n = 2). In the MIR zone, samples are mainly composed of fragments of chimneys and few semi-massive sulfides. Most of the semi-massive sulfides and strongly silicified sulfide rocks (Figures 5D, E) were recovered at MIR# 3. The mineralogy of the MIR zone is dominated by iron sulfides (pyrite and marcasite; 42 wt%) associated with a significant amount of chalcopyrite (21 wt%) and silica (e.g., quartz and opal; 23 wt%) (Figure 6). Minor minerals include secondary copper minerals (covellite and atacamite) and goethite. MIR #3 samples are commonly silica-rich, which indicates the presence of a strongly silicified zone beneath the Fe–Mn oxyhydroxide crusts. Surface samples at the MIR exhibit a large amount of chalcopyrite (27 wt%) and a lower proportion of silica (3 wt%). Sphalerite is generally scarce, except in chimneys where its proportions can reach up to 56 wt%. The mean copper concentration in the MIR zone is high (ca. 10 wt%), whereas the zinc content is generally lower than 3 wt% (Supplementary Table S1). Average Cu + Zn concentrations reach 13.6 wt% (±9.7; n = 15) and 10.5 wt% (±9.1; n = 7) for MIR and MIR #3, respectively (Figure 7A). High Cu + Zn concentrations (16.8 wt% ±9.8; n = 13) are recorded in chimney samples (Figure 7A). Semi-massive sulfides have very low Zn concentrations (<0.2 wt%) but exhibit relatively high copper contents (up to 13.5 wt%) compared to the Alvin zone (Figure 7A). Gold concentrations vary from less than 0.1 ppm to up to 18.3 ppm (mean Au: 5.8 ppm ±6.2; n = 14). High Au contents are correlated with high Zn, Cd, Ga, and Ag concentrations. However, four samples from MIR #3 are relatively gold-rich (>3 ppm) without significant Zn enrichment (i.e., Zn < 0.7 wt%). These samples are characterized by high silica concentrations (26.67 wt% to 70.92 wt% SiO2).
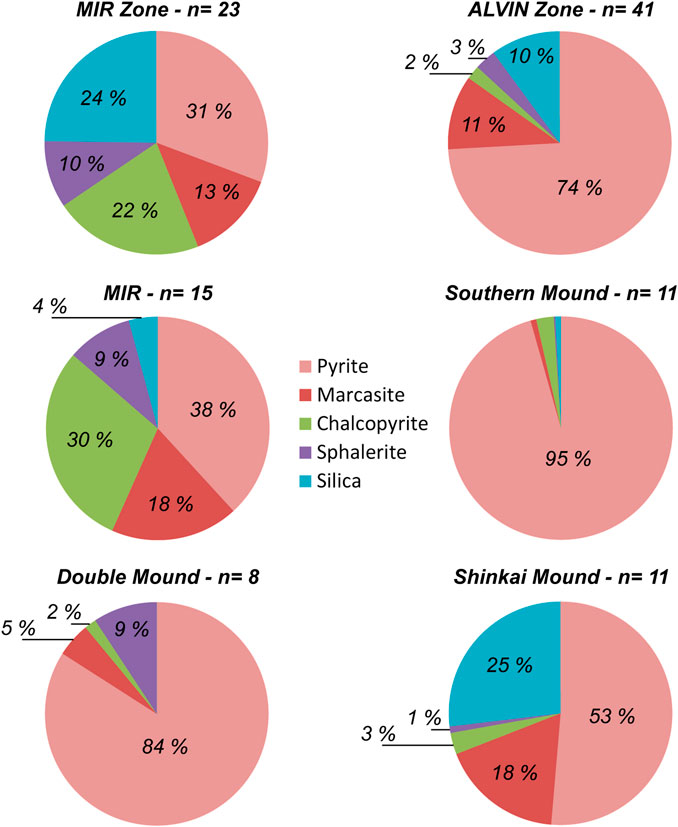
Figure 6. Abundance of major minerals estimated by X-Ray diffraction in sulfide-rich rocks sampled in the ALVIN and MIR zones.
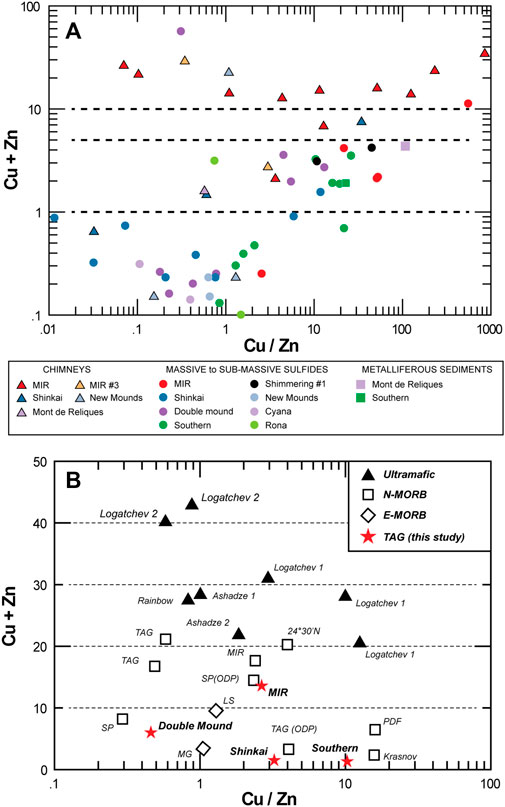
Figure 7. (A) Copper and zinc concentrations vs. the Cu/Zn ratio for sulfide chimney (triangles), massive and semi-massive sulfides (circles), and metalliferous sediments (square) sampled in the MIR (black symbols), ALVIN (white symbols), and Shimmering (gray symbols) zones. (B) Average copper and zinc concentrations vs. the Cu/Zn ratio for SMS from the Mid-Atlantic Ridge. Red stars: large SMS deposits in the TAG hydrothermal zone (this study).
Surface and subsurface samples collected in the Alvin zone mainly comprise semi-massive to massive sulfides and rare chimneys (Figures 5A–C). Iron sulfides (pyrite and marcasite; 79 wt%) are dominant, and silica (10 wt%), sphalerite (3 wt%), and chalcopyrite (2 wt%) are only present in minor amounts (Figure 6). The Double mound and Southern mound are predominantly composed of pyrite (81 wt% and 84 wt%, respectively) and minor marcasite (5 wt% and 1 wt%, respectively). Chalcopyrite and sphalerite amounts are low in the two deposits. The higher sphalerite amount for the Double mound (Figure 6) is only due to one Zn-rich sample. The Shinkai mound is characterized by a high proportion of silica minerals (opal, cristobalite, and quartz; 28 wt%) either in the chimney or massive sulfides. High silica content is also recorded in two samples collected at New Mound 2 and New Mound 3 (HER-PL-15-13 and HER-PL-14-03). Marcasite contents are higher in the Shinkai mound samples than in those from the Double mound and Southern mound (Figure 6). The two samples from Mont des reliques are dominated by iron sulfides and show a significant amount of aragonite. Two sulfide-rich rocks were sampled on an NNE–SSW fault that crosscuts the Cyana mound. Pyrite and marcasite are dominant sulfides, but a significant amount of amorphous silica is also detected.
Low average Cu and Zn concentrations characterize SMS deposits of the Alvin zone (Figure 7B). All but two samples exhibit zinc concentrations lower than 2 wt%, and only five samples have copper values greater than 3 wt%. All samples (including chimneys) from the Southern mound and Shinkai mound have zinc contents lower than 1 wt%, and all semi-massive sulfides are rather copper-poor (i.e., < 3 wt%). These two mounds have average copper and zinc concentrations even lower than those of Krasnov and TAG (ODP samples) deposits (Figure 7B). Higher average zinc and copper values and lower Cu/Zn ratio recorded for the Double mound (Figure 7B) are due to a single sample with very high Zn (42.85 wt%) and Cu (13.44 wt%) concentrations. Disregarding this sample, average Zn and Cu contents and Cu/Zn ratio are similar to those recorded for the Shinkai mound. Gold concentrations are low in most sulfide samples from the Alvin zone. No sample from the Southern mound has Au content greater than 1 ppm, and only two samples at the Double mound exhibit Au concentrations greater than 1 ppm (i.e., 1.9 ppm). Five samples display relatively high gold contents (i.e., > 3 ppm; up to 31.3 ppm), and all but one have SiO2 concentrations greater than 33 wt%. Sample HER-PL-14-02 (chimney; New Mound 2) shows an Au concentration of 8.4 ppm correlated with high Zn (10.72 wt%), Ag (470 ppm), and Ga (616 ppm) concentrations. Samples from the Southern mound show high cobalt concentrations (up to 1,669 ppm, average at 598 ppm; n = 11) compared to other sulfide mineralization of the Alvin zone.
Two samples of the seventeen collected in the Shimmering zone correspond to sulfide mineralization. They were sampled on the southern flank of the Shimmering mound where steep slopes provide access to deeper parts of the deposit. Pyrite is the major phase, but a significant amount of chalcopyrite is detected (13 wt% and 14 wt%). Zinc concentrations are low (<0.3 wt%), and copper values reach 4.08 wt% (HER-PL-18-01).
4.2.2 Oxyhydroxide-rich and silica-rich mineralization
This group of mineralized rocks comprises LT Fe-rich precipitates (Figure 5G), LT Mn-rich precipitates (Figure 5H), mixed LT Fe–Si–Mn precipitates, metalliferous sediments, strongly to fully oxidized sulfide rocks (Figure 5F), and silica–iron-rich rocks (Figures 5D, E).
At mound #11, two samples from the widespread Mn ± Fe ± Si crust were sampled. The main minerals identified are birnessite, todorokite, goethite, and nontronite. X-ray amorphous FeOOH and silica are also expected. Even though the HER-PL-13-02 sample exhibits a slight copper enrichment (i.e., 0.3 wt%), the precipitates are characterized by low metal contents in accordance with the LT hydrothermal precipitation (Figure 8).
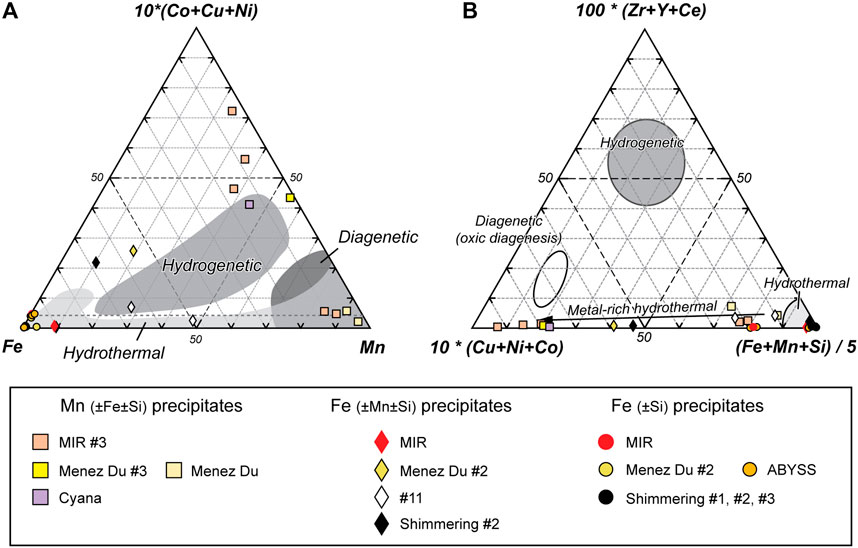
Figure 8. Ternary discriminative diagrams of the LT precipitates from the TAG hydrothermal field [(A) from Bonatti et al. (1972) and (B) modified from Josso et al. (2017)].
LT mineralization in the MIR zone (n = 8) encompasses Mn-rich hydrothermal crusts (n = 5) and Fe ± Si-rich deposits (n = 3) including currently forming Fe–Si precipitate (sample HER2-PL-22-PBT01). Mn-rich crusts were only sampled at MIR #3, whereas Fe ± Si-rich precipitates were sampled at MIR, MIR #3, and MIR #7. Todorokite and birnessite are the major components of Mn-rich mineralization, except for one sample (HER2-DR-16-10) mainly composed of X-ray amorphous Mn oxyhydroxides. Quartz was also detected as a trace mineral. Two Fe ± Si-rich precipitates are composed of X-ray amorphous FeOOH (e.g., lepidocrocite) and amorphous silica, and one sample from an old hydrothermal crust at MIR (HER-PL-21-06) shows the presence of goethite and hematite. Trace elements in LT precipitates are highly variable. Five samples exhibit relatively low metal concentrations in accordance with hydrothermal ferromanganese rocks (e.g., Cu < 0.27 wt%; Zn < 0.42 wt%). Conversely, three Mn hydrothermal crusts have unusually high copper concentrations (3.7–10.7 wt%) for hydrothermal deposits (Figure 8). They also display relatively high Ba values (>0.3 wt%), and Zn contents vary from 0.25 to 0.6 wt%. Molybdenum content is high (i.e., > 1,000 ppm) in all Mn-rich crusts regardless of the copper concentration. Silica–iron mineralization is mainly composed of quartz with minor oxides and/or oxyhydroxides and sulfides. Copper and zinc concentrations vary from 0.16 to 0.59 wt% and <0.01 to 0.4 wt%, respectively.
Samples collected in the Nautile zone can be separated in LT Fe-rich (±Si ± Mn) precipitates (n = 7), Mn-rich hydrothermal crusts (n = 3), metalliferous sediments (n = 1), and strongly oxidized sulfide breccia (n = 1). Samples from the Abyss mound are all iron-rich mineralization and are dominated by iron oxides and/or oxyhydroxides. The main minerals identified are goethite and hematite. Quartz and nontronite were also detected. Mn-rich hydrothermal crusts were sampled at Menez Du and Menez Du #3. They are predominantly composed of birnessite and X-ray amorphous oxyhydroxides with minor calcite (i.e., pelagic sediment in cavities). Menez Du #2 samples include 1) an LT Fe-rich precipitate composed of X-ray amorphous FeOOH and 2) an Fe–Mn–Si hydrothermal crust composed of goethite, X-ray amorphous FeOOH, and X-ray amorphous Mn oxyhydroxides. Low-temperature Fe-rich mineralization in the Nautile zone has low metal concentrations characteristic of hydrothermal deposits (Figure 8). Four samples exhibit manganese concentrations over 10 wt%. Two of these precipitates (HER2-PL-16-04 and HER2-PL-22-01; Menez Du #3) have high copper and zinc concentrations of up to 3.6 wt% and 1 wt%, respectively. Mn-rich crusts sampled at Menez Du have low metal concentrations in agreement with a hydrothermal origin. All Mn-rich samples are characterized by relatively high Mo values, whereas Ni concentrations over 1,000 ppm were only recorded for one Cu-poor (<0.1 wt%) and one Cu-rich (3.6 wt%) Mn crust. Metalliferous sediments (HER-PL-11-10) and strongly oxidized sulfide breccia (HER-PL-11-09) from the Abyss mound display variable but relatively high copper values (0.5 wt% and 2.45 wt%).
Fe ± Si ± Mn mineralization in the Alvin zone comprises metalliferous sediments (n = 9), silica–iron-rich rocks (n = 2), and LT Fe-rich or Mn-rich hydrothermal crusts (n = 2). Goethite is the main phase present in metalliferous sediments (except HER-PL-11-06a). Carbonates are present in three samples, and nontronite was identified in one sample where X-ray amorphous FeOOH is also expected. The HER-PL-11-06a sample shows a high amount of todorokite and birnessite associated with goethite. The LT Fe-rich crust (HER-PL15-17; Double mound) is composed of goethite associated with nontronite. Birnessite is the main mineral detected in sample HER-PL11-01 (Cyana mound), though the presence of X-ray amorphous Mn oxyhydroxides is likely. XRD analyses of silica–iron-rich mineralization detected goethite, jarosite, and sulfides. However, X-ray amorphous FeOOH and amorphous silica are probably the main components of the two samples. Metalliferous sediments exhibit variable but generally high zinc (up to 0.52 wt%) and/or copper (up to 3.9 wt%) concentrations. One exception is the HER-PL-14-07 sample where very low trace element contents and high silica values are recorded. The two LT hydrothermal crust samples (HER-PL-15-17 and HER-PL-11-01) show contrasted geochemical signatures. The LT Fe-rich crust from the Double mound has low metal concentrations, whereas the Mn-rich crust from the Cyana mound exhibits copper and zinc values over 3 wt% and 0.9 wt%, respectively. Silica–iron-rich mineralization (Shinkai mound) displays low Cu concentrations (i.e., < 0.06 wt%) and zinc values between 0.15 and 0.5 wt%. Two samples have gold contents over 1 ppm (i.e., 1.4 and 1.6 ppm).
In the Shimmering zone, LT Fe ± Si ± Mn precipitates, silica–iron-rich mineralization, and metalliferous sediments are mainly composed of X-ray amorphous FeOOH, goethite, hematite, quartz, and X-ray amorphous silica. Calcite is present in one sample (HER-PL-18-07), and pyrite was only detected in an Si–Fe-rich mineralization (HER-PL-20-08a). All but one sample have copper values lower than 0.21 wt%. The highest Cu concentration (i.e., 1 wt%) is recorded for an LT Fe ± Si ± Mn hydrothermal crust collected at the top of Shimmering mound #2, where active diffuse fluids (13.7°C) were observed. Zinc concentrations vary between <0.01 and 0.64 wt%, with no specific enrichment associated with a type of mineralization (i.e., LT precipitates, metalliferous sediment, and Si–Fe mineralization). Higher zinc concentrations are recorded for an LT Fe ± Si crust (HER-PL-18-05) and an Si–Fe-rich mineralization with relicts of sulfides (HER2-PL-20-08a). Other trace elements are generally low, with the exception of two samples from Shimmering mound #2, which display relatively high Pb concentrations (0.18 wt%).
4.3 Volume and tonnage estimations of hydrothermal deposits
Volume and tonnage estimations are summarized in Table 1. The cumulative tonnage of the TAG hydrothermal field is 21.1 Mt for sulfides deposited onto the seafloor. The Alvin zone represents more than half of this tonnage with three mounds (i.e., Shinkai, Southern, and Double mounds) containing 10.2 Mt of sulfides altogether. The largest SMS deposits are the Southern mound (4.4 Mt), Shinkai mound (3.3 Mt), MIR mound (3.4 Mt), and Double mound (2.8 Mt). At the MIR zone, all but the MIR mound are small SMS deposits with a tonnage less than 0.12 Mt. The Shimmering zone contains four mounds with a tonnage over 0.38 Mt and two hydrothermal deposits with a tonnage approximately 1 Mt. The cumulative tonnage of the Shimmering zone is equivalent to the tonnage of the MIR zone. The Nautile zone has a cumulative tonnage for the five mounds of 1.8 Mt, with most of the tonnage contained in the Abyss deposit (ca. 1.3 Mt). The calculated tonnage for Menez Du and Menez Du #2 is approximately 0.2 Mt. However, calculated tonnages at the Nautile zone must be taken with caution since calculations were based on the lower-resolution digital terrain model (DTM), i.e., 20 m. Indeed, the volumes calculated on the basis of 2 m-resolution DTM are greater by a factor of 1.5–1.8 than the volumes calculated on the basis of 20 m-resolution DTM (Supplementary Table S3).
5 Discussion
5.1 Size, nature, and resource potential of hydrothermal deposits
Extensive exploration of the TAG hydrothermal field led to the discovery of thirteen new hydrothermal deposits. Six newly discovered deposits have dimensions over 5,000 m2 and can be seen as “significant SMS deposits” (Hannington et al., 2010). The total tonnage of approximately 21.1 Mt of the hydrothermal material deposited on the seafloor is similar, though slightly lower than recent estimation (22.1 Mt; Graber et al., 2020). The lower surface area we defined from extensive dive explorations explains most of the discrepancy between our tonnage estimations and those of Graber et al. (2020). However, we believe that the calculation method used to estimate the mound mass may also lead to an overestimation of tonnages. This is particularly true for MIR deposits, where the IDW interpolation generates an unlikely topography for the reference surface (Supplementary Figure S2), leading to an increase of more than 50% of the tonnage. Thus, caution must be paid when interpolating a reference surface, especially when deposits lie on a complex topography. At TAG, according to Murton et al. (2019) and Graber et al. (2020), total sulfide mass including subseafloor mineralization might be as high as 26 or 29 Mt. A similar tonnage of 27 Mt can be estimated from our results considering that subseafloor mineralization represents 30% of the surface tonnage (Hannington et al., 1998; Graber et al., 2020). These recent estimations indicate that the TAG hydrothermal field hosts one of the largest accumulations of sulfide materials known in the ocean and remains remarkable even in comparison with that in other large districts, such as Middle Valley (10–15 Mt; Hannington et al., 2011) or Semenov hydrothermal fields (9 Mt; Monecke et al., 2016; 13.95 Mt; Cherkashev et al., 2010; or 40 Mt; Cherkashev et al., 2013).
In the Shimmering zone and Nautile zone, surface mineralization mainly comprises LT hydrothermal precipitates (e.g., Mn–Fe–Si ± Cu crusts), metalliferous sediments, Si–Fe mineralization (e.g., jasper and silicified sulfide breccia), and rare fully weathered sulfide breccias. The average concentrations of economic metals (e.g., Cu, Zn, and Au) are low in many, but not all, samples, indicating that the shallow part of the deposits can be seen as nearly barren. No sulfide-rich rocks were sampled in the Nautile zone, and only two pyrite-rich massive sulfides were recovered at the Shimmering mound, making any interpretation of the economic potential of these deposits not possible. Metalliferous sediments with variable thickness may cover the massive sulfides in the Alvin zone, and a silica cap was identified at the summit of Southern and Rona mounds from drilling operations (Lehrmann et al., 2018; Murton et al., 2019). However, sulfide-rich rocks (i.e., massive to semi-massive sulfides and sulfide chimneys) dominate surface and subsurface mineralization sampled in the Alvin zone. Massive sulfides are mainly composed of pyrite and marcasite with only less amounts of sphalerite and chalcopyrite (Figure 6), and the average copper and zinc concentration is remarkably low (Figure 7B). It is particularly true for Southern and Shinkai mounds where the average copper and zinc contents (Cu + Zn < 1.4 wt%) are lower than that calculated for the TAG active mound (Cu + Zn: 3.2 wt%; Hannington et al., 1998). Such low Zn coupled with rather low Cu is unusual for surface and subsurface massive sulfides as the refining process is thought to trigger Zn remobilization (and to a lesser extent Cu) and its subsequent enrichment in the upper part of an SMS deposit (Hannington et al., 1998; Lehrmann et al., 2018). The presence of Co ± Cu ± Se enrichment (i.e., HT elements; Fouquet et al., 2010) in some sulfides might indicate a preferential sampling of the deepest Cu-rich and Zn-poor parts of the mound (>5 m). However, many samples record relatively high concentrations in Zn-associated LT elements (i.e., Ag: mean approximately 150 ppm; Pb: up to 543 ppm) supporting sampling of the upper 5 m of the sulfide mounds (Hannington et al., 1998). Moreover, drilling results obtained by Murton et al. (2019) for the Southern mound show that Zn concentration is systematically lower than 0.3 wt%. Although the reasons for such zinc depletion (e.g., “over-refining” processes and supergene remobilization of Zn; Lehrmann et al., 2018) are beyond the scope of this study, our results indicate that the Zn (±Cu)-poor upper orebody is distinctive of large SMS deposits hosted in the Alvin zone. On the contrary, smaller mounds such as the Rona mound and Mont de reliques (immature SMS deposits) seem to have higher Zn ± Cu grades (Murton et al., 2019). This questions the economic interest of large mafic-hosted SMS deposits, especially when compared to volcanogenic massive sulfides characterized by mean Cu + Zn greater than 2.66 wt% (Franklin et al., 2005). The gold content is generally low (<1 ppm), except for the strongly silicified sulfides that may enclose secondary gold related to reworking processes (Firstova et al., 2019).
The surface and subsurface mineralization in the MIR zone is composite in nature, divided into 1) Fe ± Mn ± Si mineralization (e.g., east of MIR, MIR #2, #3, #6, and #7) and 2) sulfide chimneys and massive sulfides (e.g., West of MIR, MIR #4, and #5). Several LT Mn-rich crusts exhibit high copper and zinc concentrations that are atypical for this type of hydrothermal mineralization (see Section 5.4). Sulfide mineralization processes in the MIR zone have distinct mineralogical and chemical signatures compared to those collected in other TAG hydrothermal zones. Significant amounts of chalcopyrite and to a lesser extent sphalerite were identified (Figure 6), and high copper (±zinc) concentrations are recorded (Figure 7). Our observations confirm that the MIR deposit is actually a large area of coalesced mounds (Rona et al., 1993a; 1993b) with limited thickness (<30 m). These mounds are most likely immature compared to large SMS deposits of the Alvin zone (i.e., Southern mound, Double mound, and Shinkai mound), where HT hydrothermal fluid flow appears more focused through time. This may explain why copper in the upper orebody at MIR and MIR #3 is highly (6–9-fold) enriched compared to Southern and Shinkai upper orebodies. Though our sampling at the MIR is principally restricted to the west area (subzones A and B) and mostly corresponds to chimneys, drilling conducted on the western border of subzone C confirms the presence of a Cu-rich zone at 4 mbsf (Murton et al., 2019). Gold concentrations over 1 ppm are recorded for more than half of MIR zone samples (Zn-rich chimneys, MIR; silicified sulfides, MIR #3). With all the uncertainties associated with these results, it seems that the MIR hydrothermal zone has the highest SMS resource potential in the TAG field.
5.2 Distribution of hydrothermal deposits
More than two-thirds (20/28) of hydrothermal deposits belong to the contiguous MIR, Nautile, and Alvin hydrothermal zones and span over a narrow (ca. 500 m) curved surface extending 2.5 km from south to north (Figure 2). In the south, i. e., MIR and Nautile zones, the distribution of hydrothermal mounds shows a general N–S trend, whereas SMS deposits in the Alvin zone are roughly aligned along a NW–SE direction. The general distribution of the deposits appears controlled by two major structures: 1) the N–S west-facing fault in the south and 2) the NW–SE trough interpreted by Graber et al. (2020) as an old transfer fault connecting the southern and the northern domains. Considering the distribution and density of hydrothermal deposits, these two major structures have probably maintained a high permeability in a restricted zone through time. At the MIR mound, local modification of permeability and subsequent migration of vent activity to the west is expected according to the composite nature of mineralization from the east (LT crusts) to the west (standing sulfide chimneys) (see also Section 5.5).
The Shimmering zone is formed by a dense cluster of five mounds apparently spatially disconnected from the other contiguous hydrothermal zones located to the south (Figure 2). Deposits are within the “smooth northern block” (Graber et al., 2020) in an area where oblique and axis-perpendicular faults intersect axis-parallel faults. Moreover, a major N–S-trending, west-facing fault scarp bounds the western part of the hydrothermal zone and is interpreted as a detachment surface related to the initiation of a new detachment fault (Szitkar et al., 2019). A consequence would be that the Shimmering zone is structurally distinct from the southern hydrothermal zones (Szitkar et al., 2019; Graber et al., 2020). The “chaotic zone” between the Alvin and Shimmering zones remains poorly explored, so we cannot rule out the presence of small (<< 5,000 m2) inactive or weakly active deposits. However, with exception to the Cyana mound, no large mounds are inferred from Graber et al. (2020) HR bathymetric maps in this “chaotic zone.” This apparent absence of large SMS and thus long-duration HT hydrothermal activity between the Alvin zone and Shimmering zone should be investigated in future work to ascertain if the shimmering zone and the southern hydrothermal zones are connected or not, i.e., if hydrothermal fluids are linked to a single convection cell or different ones (Humphris et al., 2015).
The sparse distribution of the three last deposits (TAG active mound, mound #11, and chimney cluster; Figure 2) compared to that of the other hydrothermal zones, as well as the diverse size, activity, morphology, and mineralization type, is intriguing. Additional exploration of the hydrothermal mounds hosted in the “extensional area” defined by Graber et al. (2020) is necessary to understand the tectonic controls and/or hydrothermal history in this area.
5.3 Current low-temperature activity
The extensive dive observations and measurements performed so far have provided the most comprehensive present-day distribution of hydrothermal activity in the TAG field. A significant result is the presence of low-temperature diffuse flow (<30°C) in nearly all of the investigated hydrothermal zones. Beyond questioning the inactive nature of some old hydrothermal deposits of the TAG hydrothermal field (section 5.6), this brings insights on the current upflow zones. The maximum temperatures measured vary in range, from slightly over the seawater temperature (3°C; Rona mound) to up to 29°C (east of the MIR). The contiguous MIR, Nautile, and Alvin hydrothermal zones show a gradual decrease in maximum temperature from south to north (Figure 2). Furthermore, morphologies of currently forming LT precipitates vary from 7-m-tall hills at the MIR mound to scarce centimeter-scale orange patches at the Rona mound supporting the progressive weakening of the LT activity toward the Alvin zone. Further north, the shimmering zone hosts three areas with significant LT hydrothermal activities (with the maximum temperature ranging from 14°C to 26°C). Presently forming LT precipitates are distributed along cracks in Mn–Fe–Si crusts and span over a surface of tens of meters. At Shimmering zones #2 and #4, the distribution of diffuse fluids and precipitates as well as the intensity of venting are similar to those of Menez Du #2. The relatively intense LT activity (up to 26°C) recorded in the Shimmering zone contrasts with the inactive or very weakly active nature of the Alvin hydrothermal zone yet closest to the HT active mound and MIR and Nautile diffusive zones. If the spatial distribution of venting is representative of the current upflow zones in the subsurface, a lack of visible diffuse venting at the Alvin zone (contrary to all other hydrothermal zones) may provide constraints on subsurface circulation patterns in the hanging wall. Considering a single convection model (i.e., fluids from the same upwelling flow supply all hydrothermal zones), inactivity or very weak activity of the Alvin zone deposits could be seen as reflecting a strong decrease of permeability in the hanging wall below this area. According to the mass of sulfides deposited in the Alvin zone (i.e., half of the total tonnage of the TAG field) and occurrence of standing chimneys, evidence of long-lived upflow zones in the area, the decrease of permeability would have to be recent (<5,000 years). LT hydrothermal activity recorded at the MIR, Nautile, and Shimmering zones (2 km WNW and 4 km NNE of Active mound) might be linked to the presence of major N–S-trending faults that would act as preferential pathways for fluids and thus sustain diffuse venting. However, the apparent spatial disconnection of the Shimmering zone and the absence of visible diffuse venting at the Alvin zone might also be the expression of different circulation cells (Humphris et al., 2015). Additional exploration in the vicinity of the Shimmering zone as well as the east of the MIR (faulted upper terrain described by Graber et al., 2020), i.e., toward the LTZ, together with investigation of fluid geochemistry, is crucial to decipher between a single or multiple convection cell model.
5.4 Past low-temperature activity: insights from hydrothermal Mn–Fe–Si crusts
Several but not all SMS deposits lacking upright chimneys are sealed by widespread Mn–Fe–Si hydrothermal crusts attesting to the longevity of diffuse flow at specific locations even long after ceasing of the last HT hydrothermal activity. The LT hydrothermal crust covers all deposits in the Shimmering zone and Nautile zone. Only Cyana and mound #11 deposits in the Alvin and southwest hydrothermal zones, respectively, display widespread LT hydrothermal crusts at the surface. In the MIR zone, the LT hydrothermal crust entirely covers MIR #2, #3, and the eastern part of the MIR. Hydrothermal mounds covered by LT hydrothermal crusts are characterized by a relatively flat top morphology with rare visible fault scarps indicating that low-temperature activity still occurs after the dissection and collapse of the sulfide mounds. A significant renewal of HT activity after sustained diffuse flow was only seen at the MIR mound (between subzones A/B and subzone C) where small sulfide chimneys developed on Mn–Fe–Si crusts. In the Alvin zone, a decrease in the hydrothermal activity is evident from major silicification of sulfide-rich rocks at the Shinkai mound and the presence of jasper formation at the summit of the Southern mound and Rona mound (Murton et al., 2019). However, large SMS deposits in the Alvin zone are mostly devoid of widespread LT crusts, suggesting no sustained LT diffuse venting in the area since the last HT hydrothermal activity. The spatial distribution of LT hydrothermal crusts is intriguing and points to longevity of the LT discharge zones in the Shimmering, Nautile, and MIR zones (confirmed by current LT activity). On the contrary, SMS deposits of the Alvin zone located in the heavily tectonized area seem affected by radical changes of upflow zones after HT activity ceased.
LT hydrothermal crusts exhibit a wide variety of Mn, Fe, and Si concentrations and a large range of Fe/Mn that support a hydrothermal origin and different precipitation temperatures. Very high copper and zinc concentrations (up to 10 wt%) recorded make these crusts atypical for low-temperature precipitates and could give misleading information on the origin of this mineralization (Figure 8A), apart from using recent discrimination diagrams based on immobile elements (e.g., Zr, Y, and Ce; Figure 8B; Josso et al., 2017). In the TAG hydrothermal field, five deposits (MIR #3, Menez Du #2 and #3, Cyana, and Shimmering #2) host a hydrothermal crust with copper and zinc concentrations higher than 1 wt%. Mn oxyhydroxides are thought to be the main Cu–Zn-bearing phase since the highest copper and zinc contents (up to 10 wt% Cu and 1 wt% Zn) are recorded for Mn-rich crusts. Metal enrichments (e.g., Ni, Co, Cu, and Zn) in hydrothermal Mn ± Fe ± Si mineralization have already been reported in previous studies (e.g., Hein et al., 2008; Hein et al., 1996; Hein et al., 1992; Hein et al., 1990; Conly et al., 2011; González et al., 2016; Pelleter et al., 2017). Several hypotheses may account for the metal enrichment of hydrothermal Mn mineralization, such as the leaching of magmatic or ultramafic rocks, sulfide mineralization, or biogenic sediments (Hein et al., 2008). Sulfides were sampled under the Mn–Fe–Si crusts at MIR #3 and Cyana mounds and thus are most likely the source of the Cu and Zn recorded in Mn-rich hydrothermal precipitates. Sustained LT hydrothermal activity attested by the presence of widespread Mn–Fe–Si crusts could thus fundamentally alter the pristine surface and subsurface sulfide mineralization and release metals. Though Mn oxyhydroxides appear as potential sinks for copper and to a lesser extent zinc, the ultimate fate of metals during LT hydrothermal activity needs investigations of diffuse fluid and associated LT precipitate chemistry.
5.5 Relative age of the hydrothermal mounds and/or last HT hydrothermal activity
Several geological parameters can help define the relative age/chronology of the hydrothermal processes and age(s) of deposits (e.g., size, morphology, surface, and subsurface geology, including faults).
A first-order criterion is the presence of standing or toppled sulfide chimneys (Figure 4A, C, K) for identifying deposits characterized by a recent cessation of HT activity. Standing and/or toppled chimneys are present in the Alvin zone (Shinkai, New Mound #2 and #3, and Mont de reliques), MIR zone (MIR subzones A and B), and the southwest hydrothermal zone (chimney cluster). No relict chimney was observed at the top of large mounds in the Shimmering zone nor Nautile zone, attesting to long-ceased HT activity. At the MIR, the dating of several standing and toppled chimneys provided ages spanning between 3,000 and 500 years (Lalou et al., 1995). Based on these results, we assume that last HT activity at Shinkai, New mounds, Mont de reliques, and chimney cluster most likely belongs to this period of time (3,000 to approximately 500 years). The TAG active mound is thought to be inactive during this period of time until the recent reactivation of HT activity 60 years ago (Lalou et al., 1995). Therefore, we assume that last HT activity (3,000–500 years) was focused in the western part of the Alvin zone and in a restricted area west of the MIR. Chimney clusters discovered between the Alvin zone and active mound indicate a very short-lived hydrothermal activity (transitional?) in the extensional area.
Other criteria that can be used for deciphering a relative chronology of hydrothermal processes include indirect geological factors such as morphology, pelagic sediment cover, weathering of sulfides, or tectonic dissection (e.g., Murton et al., 2019). The size of the deposit may help localize areas of long-duration HT activity. In the TAG hydrothermal field, thirteen deposits consist of very large deposits (>10,000 m2), with sulfide accumulation of over 1 Mt and up to 4.4 Mt. The Shimmering zone and Alvin zone have four very large SMS deposits. The Nautile zone hosts three large deposits, and the last two are the MIR mound and Active mound. Dating studies have shown that the active mound has accumulated 2 Mt of sulfides over 50 kyrs, including several episodes of activity (2%–20% of this time) and inactivity (Lalou et al., 1995; Humphris and Cann, 2000). Shinkai, Southern, and Double mounds exhibit circular, conical, to sub-conical shapes suggesting a sustained (yet probably episodic), focused upflow of HT fluids in the Alvin zone. Relatively steep slopes and surface mineralization dominated by sulfides (only oxidized in outer rims) imply that these three SMS deposits are not significantly older than the Active mound. It is in agreement with ages of approximately 50 kyrs, obtained on sulfide samples attributed to the Double mound (Lalou et al., 1995). Based on the morphology, sediment cover, and absence of tectonic dissection, several authors proposed that the age of the Shinkai mound might be less than 40 kyrs (Murton et al., 2019; Graber et al., 2020). Actually, these geological features mostly suggest that the Shinkai mound has experienced a sustained HT hydrothermal episode more recently than Southern and Double mounds, which is different than being intrinsically younger, and a way to illustrate this is to consider the Active mound as an analog. The Active mound is not dissected by axis-oblique or axis-parallel faults, and it has relatively steep mean slopes (28.7°; Table 1) and a thin pelagic sediment cover. However, the maximum age recorded, i.e., the potential first HT hydrothermal activity, is around 50 kyrs (Lalou et al., 1993). Considering the large sulfide volume and assuming episodic HT hydrothermal episodes, the Shinkai mound may be as old as the Active, Double, and Southern mounds. New geochronological studies are needed to determine precisely the maximum age for the Shinkai mound and the age of the last HT event at Southern and Double mounds (i.e., before the spreading-parallel extensional faulting). The morphology and surface geology of the Cyana mound are unique in the Alvin hydrothermal zone with a gentle slope, flat surface, and a widespread layer of the hydrothermal manganese crust. Contrary to the observation by Graber et al. (2020), Cyana is affected by axis-parallel faults and should not be considered certainly younger than the Double mound. Actually, the widespread Mn crust and lack of relict chimneys indicate that last HT activity at the Cyana mound is probably as old as, or older, than that at the Double mound. Interestingly, Lalou et al. (1995) reported one age of 74 kyrs for the Mn crust in the Alvin zone. Though the precise location of the dated sample is unknown, several lines of evidence support an old HT event (>74 kyrs) in the Alvin zone, which might be attributed to the formation of the Cyana mound.
Gentle slopes and relatively flat morphologies sometimes barely visible on the HR bathymetric map characterize hydrothermal mounds in the Nautile and Shimmering zones. Together with the locally thick sediment cover and presence of oxide-dominated boulders, this supports a very long-ceased HT activity and relatively increased ages for sulfide mineralization (i.e., > 50 kyrs). No absolute ages are presently ascribed for these deposits. However, re-examination of data from the historical MIR zone described by Rona et al. (1993a); Rona et al. (1993b) in regards with new observations suggests that samples collected for dating during Alvin 2188 and 2195 dives do not belong to the MIR mound. This is in agreement with the observation of recent studies highlighting that the MIR mound appears smaller than previously thought (Murton et al., 2019; Graber et al., 2020). Alvin 2188 and 2195 dives most likely occurred several hundreds of meters north to the actual MIR mound, i.e., a zone between MIR #3 and Menez Du #2. High conductive heat flows measured during Alvin 2188 and 2195 dives at 3463, 3483, and 3484 mbsl (Rona et al., 1993b) are also in good accordance with diffuse venting discovered in the southern part of the Nautile zone (up to 19°C measured at Menez Du #2). Two samples collected in this area (i.e., Alvin 2188 3-1 and Alvin 2195 1-1) provided radiometric ages of 102 and 50 kyrs, respectively (Lalou et al., 1995). If our assumptions on localization of historical sample stations and interpretations of geological features are correct, hydrothermal mounds located in the Nautile zone and/or the northern edge of the MIR zone are the oldest deposits in the TAG hydrothermal field. Shimmering zone deposits share common geological features with Nautile zone deposits and the Cyana mound (morphologies, surface mineralization, and sediments cover). Though radiometric dates are needed, deposits hosted in the Shimmering zone appear older than those in Alvin zone mounds (with exception of Cyana) and were probably first active before 74 kyrs (i.e., higher age reported for LT activity in the Alvin zone).
The MIR mound is a complex mineralized area with relatively thin and immature sites with standing and toppled chimneys to the west (subzones A and B) and larger site(s) with the LT Mn–Fe–Si crust to the east (subzone C). Samples collected in the western part (subzones A and B) during dive MIR 3.76 are no older than 20 kyrs (Lalou et al., 1995), attesting to the relatively recent hydrothermal activity to the west. Though no age is available for the eastern part of the mound, we assume higher ages (>20 kyrs) based on geological characteristics (size, morphology, and surface mineralization). Additional sampling of the eastern zone and geochronological studies would help deciphering the polyphase history of the MIR mound.
Within the limitation of indirect geological characteristics and previous dating studies, the HT hydrothermal history of the TAG hydrothermal field may be summarized as follows:
1) The HT hydrothermal activity that began at least 105–75 kyrs ago was mainly focused in the Nautile zone and most likely in the Shimmering zone. Some SMS mounds might be synchronous in the north of the MIR zone (e.g., MIR #3) and in the Alvin zone (i.e., Cyana).
2) An HT event began at least as early as 50–40 kyrs in the Alvin zone (e.g., Southern and Double mounds) and at the Active mound. It may indicate a southward and/or westward migration of the HT hydrothermal activity. One age south to the Nautile zone or north to the MIR zone corresponds to this period, but no subsequent HT event is recorded in this area after that episode.
3) From 20–10 kyrs, new HT events occurred west of the MIR mound and at the Active mound. It is very likely that episodic activity during this period also took place in the Alvin zone (e.g., Shinkai mound).
4) At around 5 kyrs, a HT activity was recorded at the Active mound (Lalou et al., 1990) which associated with the formation of the upper platform (Humphris and Kleinrock, 1996).
5) toppled A new HT hydrothermal episode attested by the presence of standing andchimneys occurred between 3,000 and 500 years in the Alvin zone (Shinkai, New mounds, Mont de Reliques) and west of the MIR mound.
6) Current HT activity began around 60 years ago and is only present at the Active mound (Lalou et al., 1995).
Possible older HT hydrothermal events (>125 kyrs) may have occurred in the TAG hydrothermal field. Our observations indicate that SMS deposits can be concealed by LT hydrothermal crusts and pelagic sediments. Hence, this may lead to misinterpretation on the nature of the deposit (i.e., SMS deposit versus LT deposit only) without extensive exploration and sampling operations. The LTZ localized on the upper eastern flank of the TAG massif (Figure 1) hosts several Mn–Fe deposits (Rona et al., 1975; Rona et al., 1984; Thompson et al., 1985). Even though Mn–Fe–Si crusts in the LTZ (see Plate I of Thomson et al., 1985) are very similar to those covering sulfide mineralization in the HTZ (Figures 4F, M, N) including copper enrichments (Mills et al., 2001), no sulfide mineralization is presently known. Yet, over the last decades, studies have shown that black smoker-type deposits can develop several kilometers off-axis in association with detachment faults (Petersen et al., 2009; Fouquet et al., 2010). The analogy between the Mn–Fe–Si crusts studied here and those described by Thompson et al. (1985) in the LTZ encourages further exploration to the east to find potential old SMS deposits and thus constrain the spatial and temporal extent of the TAG HT hydrothermal field.
5.6 Evolution and genetic models of SMS deposits at the TAG field
The first step of hydrothermal activity led to the formation of chimney clusters and, if HT activity persists, to small SMS mounds (Figure 9A). For the Active mound, formation of the deposit is complex and is linked to cycles of anhydrite precipitation and dissolution, which is responsible for flat tops and platform-like morphology (Humphris and Kleinrock, 1996; Petersen et al., 2000). Anhydrite dissolution and subsequent collapse of the structure may explain the formation of the circular depression observed at Mont de reliques and New mounds #2 (Figure 9A). Nevertheless, the morphology of the Active mound characterized by stacked flat platforms is rather uncommon inside the TAG hydrothermal field. Only Shimmering #2 and Abyss mounds exhibit a similar morphology (i.e., platform(s) shape with a flat top or depression) that may be related to massive anhydrite dissolution and related collapse of the mound. Conversely, large SMS deposits hosted in the Alvin zone display rather conical to sub-conical shapes (e.g., Shinkai, Double, and Southern mounds; Supplementary Figure S3) without significant depression or large flat-top excluding massive anhydrite dissolution. Even though anhydrite dissolution cannot be ruled out from the presence of brecciated sulfides (Murton et al., 2019), the collapse of these mounds is most likely controlled by tectonic dissection and/or mass wasting. Additionally, high silica recorded in massive sulfides at Shinkai may stabilize sulfide structures (Delaney et al., 1992) and, together with filling of some collapse structures by the last ceased HT activity, may explain the striking conical shape of this mound (Figure 9B). A silica cap at depth has also been reported near the summit of the Southern mound and Rona mound and is attributed to a waning phase occurring at the closing stage of the hydrothermal activity (Murton et al., 2019) (Figure 9B).
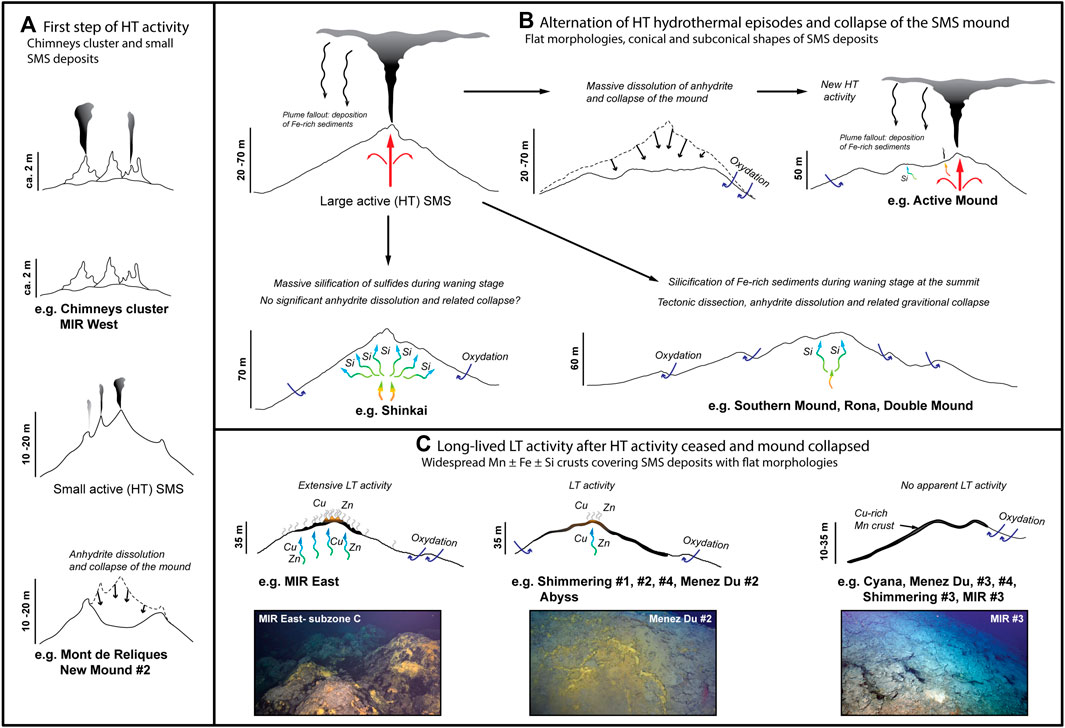
Figure 9. Evolution model proposed to explain the diversity of active, weakly active, and inactive SMS deposits in the TAG hydrothermal field. (A) Early cycles of HT hydrothermal activity lead to the formation of sulfide chimney clusters and small SMS mounds. Massive anhydrite dissolution (and related collapse of the mound) may follow if strong seawater entrainment into the mound occurred during the HT activity. (B) Successive cycles of HT activity and inactivity will eventually lead to the development of large SMS mounds. Massive anhydrite dissolution would explain platform-like shape of some deposits (e.g., TAG active mound, Shimmering #2, and Abyss). Limited anhydrite dissolution and related mass wasting of sulfides combined with tectonic dissection explain morphologies of some SMS deposits (e.g., Southern mound and Double mound). Waning of HT activity associated with the closing stage of the hydrothermal cycles may result in silicification. (C) Successive cycles of LT activity long after the mound has collapsed and HT activity has ceased. Massive precipitation of Fe–Si–Mn small mounds and crusts will eventually cover the SMS mound. LT activity may remobilize copper and zinc from massive sulfides. Copper ± zinc may be adsorbed into Mn oxyhydroxides or lost in the water column.
A second major step of hydrothermal activity in the TAG hydrothermal field is the development of a long-lived, possibly episodic, LT hydrothermal activity. Widespread Mn ± Fe ± Si crusts cover mounds with gentle slopes and relatively flat morphologies with no more standing sulfide chimneys (Figure 9C; Supplementary Figure S3). Together with the presence of active LT venting in the Shimmering zone, Nautile zone, and MIR zone, these observations indicate that LT activity is a major event in the TAG hydrothermal field. This is in good agreement with the large time span (i.e., 140–4 kyrs) recorded for Mn crusts (Lalou et al., 1986; Lalou et al., 1995). LT hydrothermal events are most likely concomitant with oxidation of sulfide minerals in seawater (e.g., Abyss mound), eventually leading to oxide-dominant surface and subsurface mineralization. Oxidation of pristine hydrothermal sulfides by LT hydrothermal fluids and/or seawater may release metals (e.g., Cu, Zn; Dekov et al., 2011) that would either be trapped into secondary minerals (e.g., Fe oxyhydroxides, Mn oxyhydroxydes, and atacamite) or discharged into seawater. Sulfide oxidation and related leaching of metals should be more efficient during the LT hydrothermal activity than at seawater temperature (e.g., Chandra and Gerson, 2010; Fallon et al., 2017). Then, if the long-lived LT activity identified in the TAG hydrothermal field reveals to be a common process in other hydrothermal fields hosting old SMS deposits, this process should be considered in future studies on biogeochemical cycles of metals in the deep ocean. In addition, such sustained LT activity (10°C–30°C) in a sulfide-rich environment (i.e., SMS) may support diverse mesophilic microbial populations for long durations (Zeng et al., 2021).
5.7 Defining active, inactive, and extinct SMS deposits: insight from the TAG hydrothermal field
With increasing interest in polymetallic sulfides, part of the scientific community working on hydrothermal systems calls for the protection of active hydrothermal sites (Van Dover et al., 2018). As a consequence, potential mining activity would be focused on so-called inactive/extinct sites, though only few studies have been carried out on these deposits. Some authors recently advocated for research efforts to propose a classification of inactive and extinct deposits/vent fields that could help for mining regulations (Jamieson and Gartman, 2020; Van Dover et al., 2020). To our knowledge, the International Seabed Authority (ISA) has only proposed a definition for inactivity and extinction at vent-scale with distinction based on potential hydrothermal rejuvenation from mining activity (ISBA/25/LTC/6 Rev.2, 2022). Jamieson and Gartman (2020) argued that the term “extinct” should be only used for deposits hosted in an inactive vent field for which the probability of hydrothermal rejuvenation is low (but not certain). Considering that TAG hydrothermal mounds are all linked to the same heat source and a common detachment fault system that controls the hydrothermal circulation, Jamieson and Gartman (2020) classified the TAG field as hydrothermally active. This recommendation is relevant, particularly now knowing that all hydrothermal zones in the TAG field exhibit temperature anomalies. However, defining the extent of a single hydrothermal vent field (i.e., cluster(s) of deposits related to a common heat source and/or subseafloor permeability) may be challenging. That is true for TAG, where the location of the heat source and by extension the pattern of hydrothermal circulation is now disputed (e.g., McCaig et al., 2010; Guo et al., 2023). Moreover, the question of geological continuity may arise if inactive sulfide deposits are discovered toward the LTZ at depths shallower than the detachment fault termination (approximately 3,300 m, Graber et al., 2020). As a consequence, considering knowledge gaps and based on a precautionary approach, all known and to-be-discovered deposits belonging to the TAG area (including HTZ and LTZ, i.e., approximately 45 km2) should be grouped within a single field or district classified as hydrothermally active.
For an inactive field, Jamieson and Gartman (2020) proposed a set of indicators such as the absence of an upright chimney, relatively flat mound, lack of fluid venting, and absence of a vent biological community that may be important to distinguish extinct sites from inactive sites. These criteria are most likely diagnostic for prolonged HT hydrothermal inactivity. The discovery of a long-lived low-temperature hydrothermal activity in the TAG area indicates that deposits with flat morphologies, no more standing chimneys, and a thick Fe–Mn hydrothermal crust may still host hydrothermal activity. Since the episodicity of low-temperature activity is not known, documentation and dating of LT precipitates should be considered to improve the definition of inactivity and extinction. New data arising from active and inactive hydrothermal field exploration programs are essential to fill gaps in scientific knowledge regarding the geology and ecology of inactive/extinct SMS deposits.
6 Conclusion
Extensive dive exploration, sampling, and measurements coupled with high-resolution acoustic data provide new insights on the nature of mafic-hosted SMS deposits as well as their spatial and temporal distribution and evolution in the TAG hydrothermal field. Our conclusions can be summarized as follows:
1) Thirteen new hydrothermal deposits were discovered including six large (>5,000 m2) deposits. The TAG hydrothermal field currently hosts 28 hydrothermal mounds accumulating 21.1 Mt of hydrothermal materials deposited above the seafloor.
2) Large and mature SMS deposits are mostly characterized by low copper and zinc concentrations compared to mafic-hosted volcanogenic massive sulfides. This questions the economic potential of large mafic-hosted SMS deposits in slow-spreading ridge settings.
3) LT activity (3°C–29°C) is identified in eight different areas including five newly discovered zones of diffuse venting. The spatial distribution of present sites of venting questions the geometry of sub-surface circulation patterns within the hanging wall and should be considered in future 3D flow modeling.
4) Shimme The distribution, morphology, mineralogy, and geochemistry of the hydrothermal deposits can be used to propose a new chronologic framework of the sulfide formation. HT activity was mainly focused in the ring zone and the Nautile zone until 50 kyrs ago. A migration of HT activity to the Alvin zone, MIR zone (e.g., MIR mound), and active mound is likely since 50 kyrs, including different periods of activity (50–40 kyrs, 20–10 kyrs, 5 kyrs, 3,000–500 yrs, and 60 yrs) and inactivity. Excluding the recent rejuvenation of the Active mound at 60 yrs, last HT hydrothermal activity of the TAG field was focused in the western part of the MIR mound and at Shinkai mound, New Mound #2 and #3, and Mont de reliques.
5) Widespread LT crusts covering old flattened SMS mounds indicate that LT hydrothermal events can occur long after ceasing of the last HT hydrothermal activity. This finding indicates that old SMS deposits might be discovered to the east toward the LTZ. Long-lived LT hydrothermal activity (>140 kyrs to present) is a major process in the evolution and aging of SMS mounds in the TAG hydrothermal field, and its consequences on the fate of metals and microbial processes should be investigated in the future.
6) As already mentioned by Jamieson and Gartman (2020), none of the hydrothermal deposits belonging to the TAG area should be considered extinct. Without additional constrains on the sub-surface fluid flow pathways, all deposits should be grouped in a single hydrothermal field (including the HTZ and LTZ) classified as “active.”
Further exploration to the north of the Shimmering zone and east of the Alvin, Nautile, and MIR zones is needed to fully understand the extension of the TAG SMS district. New radiometric dating of sulfides, Mn oxides, and aragonite of well-localized samples is also of prime importance to better constrain the temporal evolution of the TAG hydrothermal field. Knowing the spatial and temporal distribution of active, weakly active, and inactive SMS deposits would help constrain the present and past upflow zones and hence evolution of convection cell(s) associated with the development of detachment fault systems.
Data availability statement
The datasets presented in this study can be found in online repositories. The names of the repository/repositories and accession number(s) can be found in the article/Supplementary Material.
Author contributions
E-LP: conceptualization, investigation, writing–original draft, and writing–review and editing. MP: writing–review and editing. A-SA: data curation, methodology, and writing–review and editing. AB: formal analysis, validation, and writing–review and editing. SC: formal analysis and writing–review and editing. FB: formal analysis and writing–review and editing. VA: formal analysis and writing–review and editing. CG: data curation, formal analysis, and writing–review and editing. AG: formal analysis and writing–review and editing. DP: formal analysis and writing–review and editing. MR: formal analysis and writing–review and editing. TG: writing–review and editing. LG: formal analysis and writing–review and editing. CC: writing–review and editing. M-AC: writing–review and editing. YF: supervision and writing–review and editing.
Funding
The author(s) declare financial support was received for the research, authorship, and/or publication of this article. The HERMINE2 expedition (2022) was carried out thanks to the France 2030 government funding for the “deep sea”—“Projet Mission DMA et CCZ”—ANR-22-MAFM-001.”
Acknowledgments
The authors thank the crews of R/V Pourquoi pas? and Nautile HOV and all participants of the BICOSE, HERMINE, and HERMINE2 cruises for their assistance at sea. We thank reviewers J-II, JK and JJ for their thoughtful comments and suggestions, which significantly improved the quality of this paper.
Conflict of interest
The authors declare that the research was conducted in the absence of any commercial or financial relationships that could be construed as a potential conflict of interest.
Publisher’s note
All claims expressed in this article are solely those of the authors and do not necessarily represent those of their affiliated organizations, or those of the publisher, the editors, and the reviewers. Any product that may be evaluated in this article, or claim that may be made by its manufacturer, is not guaranteed or endorsed by the publisher.
Supplementary material
The Supplementary Material for this article can be found online at: https://www.frontiersin.org/articles/10.3389/feart.2024.1304993/full#supplementary-material
References
Bohnenstiehl, D. R., and Kleinrock, M. C. (2000). Fissuring near the TAG active hydrothermal mound, 26°N on the Mid-Atlantic Ridge. J. Volcanol. Geotherm. Res. 98, 33–48. doi:10.1016/S0377-0273(99)00192-4
Bonatti, E., Kraemer, T., and Rydell, H. (1972). Classification and genesis of submarine iron-manganese deposits, in. Ferromanganese Deposits of the Ocean Floor. Editor D. R. Horn (Washington D.C., United States: Seabed Assessment Program, IDOE, NSF), 149–166.
Canales, J. P., Sohn, R. A., and deMartin, B. J. (2007). Crustal structure of the Trans-Atlantic Geotraverse (TAG) segment (Mid-Atlantic Ridge, 26°10′N): implications for the nature of hydrothermal circulation and detachment faulting at slow spreading ridges. Geochem. Geophys. Geosyst. 8, Q08004. doi:10.1029/2007GC001629
Cathles, L. M. (2011). What processes at mid-ocean ridges tell us about volcanogenic massive sulfide deposits. Min. Deposita 46, 639–657. doi:10.1007/s00126-010-0292-9
Chandra, A. P., and Gerson, A. R. (2010). The mechanisms of pyrite oxidation and leaching: a fundamental perspective. Surf. Sci. Rep. 65, 293–315. doi:10.1016/j.surfrep.2010.08.003
Cherkashev, G. A., Ivanov, V. N., Bel’tenev, V. I., Lazareva, L. I., Rozhdestvenskaya, I. I., Samovarov, M. L., et al. (2013). Massive sulfide ores of the northern equatorial Mid-Atlantic Ridge. Oceanology 53, 607–619. doi:10.1134/S0001437013050032
Cherkashov, G., Poroshina, I., Stepanova, T., Ivanov, V., Bel’tenev, V., Lazareva, L., et al. (2010). Seafloor massive sulfides from the northern equatorial Mid-Atlantic Ridge: new discoveries and perspectives. Mar. Georesources Geotechnol. 28, 222–239. doi:10.1080/1064119X.2010.483308
Conly, A. G., Scott, S. D., and Bellon, H. (2011). Metalliferous manganese oxide mineralization associated with the boléo Cu-Co-Zn district, Mexico. Econ. Geol. 106, 1173–1196. doi:10.2113/econgeo.106.7.1173
Dekov, V., Boycheva, T., Hålenius, U., Petersen, S., Billström, K., Stummeyer, J., et al. (2011). Atacamite and paratacamite from the ultramafic-hosted Logatchev seafloor vent field (14°45′N, Mid-Atlantic Ridge). Chem. Geol. 286, 169–184. doi:10.1016/j.chemgeo.2011.05.002
Delaney, J. R., Robigou, V., McDuff, R. E., and Tivey, M. K. (1992). Geology of a vigorous hydrothermal system on the Endeavour segment, Juan de Fuca Ridge. J. Geophys. Res. 97, 19663–19682. doi:10.1029/92jb00174
deMartin, B. J., Sohn, R. A., Canales, J. P., and Humphris, S. E. (2007). Kinematics and geometry of active detachment faulting beneath the Trans-Atlantic Geotraverse (TAG) hydrothermal field on the Mid-Atlantic Ridge. Geology 35, 711–714. doi:10.1130/G23718A.1
Edmonds, H. N., German, C. R., Green, D. R. H., Huh, Y., Gamo, T., and Edmond, J. M. (1996). Continuation of the hydrothermal fluid chemistry time series at TAG, and the effects of ODP drilling. Geophys. Res. Lett. 23, 3487–3489. doi:10.1029/96GL01597
Etoubleau, J., Cambon, P., Fouquet, Y., Henry, K., and Moal, S. (1996). Séparation des métaux nobles (Pt, Au) d’une matrice géologique par chromatographie d’échange d’ions et détermination par spectrométrie de fluorescence X. Le J. de Physique IV 06, C4-C843–C4-852. doi:10.1051/jp4:1996481
Fallon, E. K., Petersen, S., Brooker, R. A., and Scott, T. B. (2017). Oxidative dissolution of hydrothermal mixed-sulphide ore: an assessment of current knowledge in relation to seafloor massive sulphide mining. Ore Geol. Rev. 86, 309–337. doi:10.1016/j.oregeorev.2017.02.028
Firstova, A., Stepanova, T., Sukhanova, A., Cherkashov, G., and Poroshina, I. (2019). Au and Te minerals in seafloor massive sulphides from semyenov-2 hydrothermal field, Mid-Atlantic Ridge. Minerals 9, 294. doi:10.3390/min9050294
Fouquet, Y., Cambon, P., Etoubleau, J., Charlou, J. L., OndréAs, H., Barriga, F. J. A. S., et al. (2010). “Geodiversity of hydrothermal processes along the mid-atlantic Ridge and ultramafic-hosted mineralization: a new type of oceanic Cu-Zn-Co-Au volcanogenic massive sulfide deposit,” in Diversity of hydrothermal systems on slow spreading ocean ridges. Editors P. A. Rona, C. W. Devey, J. Dyment, and B. J. Murton (United States: American Geophysical Union), 321–367.
Fouquet, Y., Pelleter, E., and Cathalot, C. (2017). HERMINE cruise. RV Pourquoi pas? doi:10.17600/17000200
Franklin, J. M., Gibson, H. L., Jonasson, I. R., and Galley, A. G. (2005). “Volcanogenic massive sulfide deposits,” in One hundredth anniversary volume. Editors J. W. Hedenquist, J. F. H. Thompson, R. J. Goldfarb, and J. P. Richards (USA: Society of Economic Geologists), 0. doi:10.5382/AV100.17
Gehrmann, R. a. S., North, L. J., Graber, S., Szitkar, F., Petersen, S., Minshull, T. A., et al. (2019). Marine mineral exploration with controlled source electromagnetics at the TAG hydrothermal field, 26°N mid-Atlantic Ridge. Geophys. Res. Lett. 46, 5808–5816. doi:10.1029/2019GL082928
González, F. J., Somoza, L., Hein, J. R., Medialdea, T., León, R., Urgorri, V., et al. (2016). Phosphorites, Co-rich Mn nodules, and Fe-Mn crusts from galicia bank, NE atlantic: reflections of cenozoic tectonics and paleoceanography. Geochem. Geophys. Geosyst. 17, 346–374. doi:10.1002/2015GC005861
Graber, S., Petersen, S., Yeo, I., Szitkar, F., Klischies, M., Jamieson, J., et al. (2020). Structural control, evolution, and accumulation rates of massive sulfides in the TAG hydrothermal field. Geochem. Geophys. Geosystems 21, e2020GC009185. doi:10.1029/2020GC009185
Guo, Z., Rüpke, L., Petersen, S., German, C. R., Ildefonse, B., Hasenclever, J., et al. (2023). Detachment-parallel recharge can explain high discharge fluxes at the TAG hydrothermal field. Earth Planet. Sci. Lett. 617, 118245. doi:10.1016/j.epsl.2023.118245
Hannington, M., Galley, A., Herzig, P. M., and Petersen, S. (1998). “28. Comparison of the tag mound and stockwork complex with Cyprus-type massive sulfide deposits,” in Proceedings of the ocean drilling program (Scientific Results).
Hannington, M., Jamieson, J., Monecke, T., and Petersen, S. (2010). “Modern Sea-floor massive sulfides and base metal ResourcesToward an estimate of global sea-floor massive sulfide potential,” in The challenge of finding new mineral Resources Global metallogeny, innovative exploration, and new discoveries (USA: Society of Economic Geologists). doi:10.5382/SP.15.2.001
Hannington, M., Jamieson, J., Monecke, T., Petersen, S., and Beaulieu, S. (2011). The abundance of seafloor massive sulfide deposits. Geology 39, 1155–1158. doi:10.1130/G32468.1
Hein, J. R., Ahn, J.-H., Wong, J. C., Kang, J.-K., Smith, V. K., Yoon, S.-H., et al. (1992). Geology, geophysics, geochemistry, and deep-sea mineral deposits, Federated States OF Micronesia; KORDI-USGS R.V. Farnella cruise F11-90-CP (USGS numbered series No. 92–218), open-file report. USA: U.S. Geological Survey.
Hein, J. R., Gibbs, A. E., Clague, D. A., and Torresan, M. (1996). Hydrothermal mineralization along submarine rift zones, Hawaii. Mar. georesources Geotechnol. 14, 177–203. doi:10.1080/10641199609388310
Hein, J. R., Schulz, M. S., Dunham, R. E., Stern, R. J., and Bloomer, S. H. (2008). Diffuse flow hydrothermal manganese mineralization along the active Mariana and southern Izu-Bonin arc system, western Pacific. J. Geophys. Res. Solid Earth 113. doi:10.1029/2007JB005432
Hein, J. R., Schulz, M. S., and Kang, J.-K. (1990). Insular and submarine ferromanganese mineralization of the Tonga-lau region. Mar. Min. 9, 305–354.
Humphris, S. E., and Cann, J. R. (2000). Constraints on the energy and chemical balances of the modern TAG and ancient Cyprus seafloor sulfide deposits. J. Geophys. Res. 105, 28477–28488. doi:10.1029/2000JB900289
Humphris, S. E., Herzig, P. M., Miller, D. J., Alt, A. C., Becker, K., Brown, D., et al. (1995). The internal structure of an active sea-floor massive sulphide deposit. Nature 377, 713–716. doi:10.1038/377713a0
Humphris, S. E., and Kleinrock, M. C. (1996). Detailed morphology of the TAG active hydrothermal mound: insights into its formation and growth. Geophys. Res. Lett. 23, 3443–3446. doi:10.1029/96GL03079
Humphris, S. E., Tivey, M. K., and Tivey, M. A. (2015). The Trans-Atlantic Geotraverse hydrothermal field: a hydrothermal system on an active detachment fault. Rona 121, 8–16. doi:10.1016/j.dsr2.2015.02.015
ISBA/25/LTC/6 (2022). Recommendations for the guidance of contractors for the assessment of the possible environmental impacts arising from exploration for marine minerals in the Area. Available at: https://www.isa.org.jm/wp-content/uploads/2023/05/ISBA_25_LTC_6_Rev.2-2211076E.pdf.
Jamieson, J. W., and Gartman, A. (2020). Defining active, inactive, and extinct seafloor massive sulfide deposits. Mar. Policy 117, 103926. doi:10.1016/j.marpol.2020.103926
Josso, P., Pelleter, E., Pourret, O., Fouquet, Y., Etoubleau, J., Cheron, S., et al. (2017). A new discrimination scheme for oceanic ferromanganese deposits using high field strength and rare earth elements. Ore Geol. Rev. SI:Marine mineral deposits New Resour. base, precious, Crit. metals 87, 3–15. doi:10.1016/j.oregeorev.2016.09.003
Karson, J. A., and Rona, P. A. (1990). Block-tilting, transfer faults, and structural control of magmatic and hydrothermal processesin the TAG area, Mid-Atlantic Ridge 26°N. Geol. Soc. Am. Bull. 102, 1635–1645. doi:10.1130/0016-7606(1990)102<1635:BTTFAS>2.3.CO;2
Kleinrock, M. C., and Humphris, S. E. (1996a). Structural control on sea-floor hydrothermal activity at the TAG active mound. Nature 382, 149–153. doi:10.1038/382149a0
Kleinrock, M. C., and Humphris, S. E. (1996b). Structural asymmetry of the TAG Rift Valley: evidence from a near-bottom survey for episodic spreading. Geophys. Res. Lett. 23, 3439–3442. doi:10.1029/96GL03073
Lalou, C., Reyss, J.-L., Brichet, E., Arnold, M., Thompson, G., Fouquet, Y., et al. (1993). New age data for Mid-Atlantic Ridge hydrothermal sites: TAG and Snakepit chronology revisited. J. Geophys. Res. 98, 9705–9713. doi:10.1029/92JB01898
Lalou, C., Reyss, J.-L., Brichet, E., Rona, P. A., and Thompson, G. (1995). Hydrothermal activity on a 105-year scale at a slow-spreading ridge, TAG hydrothermal field, Mid-Atlantic Ridge 26°N. J. Geophys. Res. 100, 17855–17862. doi:10.1029/95JB01858
Lalou, C., Thompson, G., Arnold, M., Brichet, E., Druffel, E., and Rona, P. A. (1990). Geochronology of TAG and Snakepit hydrothermal fields, Mid-Atlantic Ridge: witness to a long and complex hydrothermal history. Earth Planet. Sci. Lett. 97, 113–128. doi:10.1016/0012-821X(90)90103-5
Lalou, C., Thompson, G., Rona, P. A., Brichet, E., and Jehanno, C. (1986). Chronology of selected hydrothermal Mn oxide deposits from the transatlantic geotraverse “TAG” area, Mid-Atlantic Ridge 26°N. Geochimica Cosmochimica Acta 50, 1737–1743. doi:10.1016/0016-7037(86)90135-3
Lehrmann, B., Stobbs, I. J., Lusty, P. A. J., and Murton, B. J. (2018). Insights into extinct seafloor massive sulfide mounds at the TAG, Mid-Atlantic Ridge. Minerals 8, 302. doi:10.3390/min8070302
Mccaig, A. M., Delacour, A., Fallick, A. E., Castelain, T., and FrüH-Green, G. L. (2010). “Detachment Fault control on hydrothermal circulation systems: interpreting the subsurface beneath the tag hydrothermal field using the isotopic and geological evolution of oceanic core complexes in the atlantic,” in Diversity of hydrothermal systems on slow spreading ocean ridges (United States: American Geophysical Union), 207–239. doi:10.1029/2008GM000729
Mills, R. A., Wells, D. M., and Roberts, S. (2001). Genesis of ferromanganese crusts from the TAG hydrothermal field. Chem. Geol. 176, 283–293. doi:10.1016/s0009-2541(00)00404-6
Monecke, T., Petersen, S., Hannington, M. D., Grant, H., and Samson, I. M. (2016). “The minor element endowment of modern sea-floor massive sulfides and comparison with deposits hosted in ancient volcanic successions,” in Rare Earth and critical elements in ore deposits. Editors P. L. Verplanck, and M. W. Hitzman (USA: Society of Economic Geologists), 0. doi:10.5382/Rev.18.11
Murton, B. J., Lehrmann, B., Dutrieux, A. M., Martins, S., de la Iglesia, A. G., Stobbs, I. J., et al. (2019). Geological fate of seafloor massive sulphides at the TAG hydrothermal field (Mid-Atlantic Ridge). Ore Geol. Rev. 107, 903–925. doi:10.1016/j.oregeorev.2019.03.005
Pelleter, E., Fouquet, Y., Etoubleau, J., Cheron, S., Labanieh, S., Josso, P., et al. (2017). Ni-Cu-Co-rich hydrothermal manganese mineralization in the Wallis and Futuna back-arc environment (SW Pacific). Ore Geol. Rev. SI:Marine mineral deposits New Resour. base, precious, Crit. metals 87, 126–146. doi:10.1016/j.oregeorev.2016.09.014
Petersen, S., Herzig, P. M., and Hannington, M. D. (2000). Third dimension of a presently forming VMS deposit: TAG hydrothermal mound, Mid-Atlantic Ridge, 26°N. Mineral. Deposita 35, 233–259. doi:10.1007/s001260050018
Petersen, S., Krätschell, A., Augustin, N., Jamieson, J., Hein, J. R., and Hannington, M. D. (2016). News from the seabed – geological characteristics and resource potential of deep-sea mineral resources. Mar. Policy 70, 175–187. doi:10.1016/j.marpol.2016.03.012
Petersen, S., Kuhn, K., Kuhn, T., Augustin, N., Hékinian, R., Franz, L., et al. (2009). The geological setting of the ultramafic-hosted Logatchev hydrothermal field (14°45′N, Mid-Atlantic Ridge) and its influence on massive sulfide formation. Lithos, Recent Dev. seafloor petrology Tect. 112, 40–56. doi:10.1016/j.lithos.2009.02.008
Purdy, G. M., Sempere, J.-C., Schouten, H., Dubois, D. L., and Goldsmith, R. (1990). Bathymetry of the mid-atlantic ridge, 24°-31°N: a map series. Mar. Geophys Res. 12, 247–252. doi:10.1007/BF02428196
Rona, P. A., Bogdanov, Y. A., Gurvich, E. G., Rimski-Korsakov, N. A., Sagalevitch, A. M., Hannington, M. D., et al. (1993a). Relict hydrothermal zones in the TAG hydrothermal field, mid-Atlantic Ridge 26°N, 45°W. J. Geophys. Res. 98, 9715–9730. doi:10.1029/93JB00552
Rona, P. A., Hannington, M. D., Raman, C. V., Thompson, G., Tivey, M. K., Humphris, S. E., et al. (1993b). Active and relict sea-floor hydrothermal mineralization at the TAG hydrothermal field, Mid-Atlantic Ridge. Econ. Geol. 88, 1989–2017. doi:10.2113/gsecongeo.88.8.1989
Rona, P. A., Klinkhammer, G., Nelsen, T. A., Trefry, J. H., and Elderfield, H. (1986). Black smokers, massive sulphides and vent biota at the Mid-Atlantic Ridge. Nature 321, 33–37. doi:10.1038/321033a0
Rona, P. A., McGregor, B. A., Betzer, P. R., Bolger, G. W., and Krause, D. C. (1975). Anomalous water temperatures over Mid-Atlantic Ridge crest at 26° North latitude. Deep Sea Res. Oceanogr. Abstr. 22, 611–618. doi:10.1016/0011-7471(75)90048-0
Rona, P. A., Petersen, S., Becker, K., Von Herzen, R. P., Hannington, M. D., Herzig, P. M., et al. (1996). Heat flow and mineralogy of TAG relict high-temperature hydrothermal zones: mid-Atlantic Ridge 26°N, 45°W. Geophys. Res. Lett. 23, 3507–3510. doi:10.1029/96GL03257
Rona, P. A., Thompson, G., Mottl, M. J., Karson, J. A., Jenkins, W. J., Graham, D., et al. (1984). Hydrothermal activity at the trans-atlantic geotraverse hydrothermal field, mid-Atlantic Ridge crest at 26°N. J. Geophys. Res. 89, 11365–11377. doi:10.1029/JB089iB13p11365
Sánchez-Mora, D., Jamieson, J., Cannat, M., Escartín, J., and Barreyre, T. (2022). Age and rate of accumulation of metal-rich hydrothermal deposits on the seafloor: the lucky strike vent field, Mid-Atlantic Ridge. J. Geophys. Res. Solid Earth 127, e2022JB024031. doi:10.1029/2022JB024031
Scott, R. B., Rona, P. A., Mcgregor, B. A., and Scott, M. R. (1974). The TAG hydrothermal field. Nature 251, 301–302. doi:10.1038/251301a0
Sempéré, J.-C., Purdy, G. M., and Schouten, H. (1990). Segmentation of the Mid-Atlantic Ridge between 24° N and 30°40' N. Nature 344, 427–431. doi:10.1038/344427a0
Smith, D. K., and Cann, J. R. (1990). Hundreds of small volcanoes on the median valley floor of the Mid-Atlantic Ridge at 24–30° N. Nature 348, 152–155. doi:10.1038/348152a0
Szitkar, F., Dyment, J., Petersen, S., Bialas, J., Klischies, M., Graber, S., et al. (2019). Detachment tectonics at Mid-Atlantic Ridge 26°N. Sci. Rep. 9, 11830–11838. doi:10.1038/s41598-019-47974-z
Thompson, G., Mottl, M. J., and Rona, P. A. (1985). Morphology, mineralogy and chemistry of hydrothermal deposits from the TAG area, 26°N Mid-Atlantic Ridge. Chem. Geol. 49, 243–257. doi:10.1016/0009-2541(85)90159-7
Tivey, M. A., Schouten, H., and Kleinrock, M. C. (2003). A near-bottom magnetic survey of the Mid-Atlantic Ridge axis at 26°N: implications for the tectonic evolution of the TAG segment. J. Geophys. Res. Solid Earth 108. doi:10.1029/2002JB001967
Tivey, M. K., Humphris, S. E., Thompson, G., Hannington, M. D., and Rona, P. A. (1995). Deducing patterns of fluid flow and mixing within the TAG active hydrothermal mound using mineralogical and geochemical data. J. Geophys. Res. 100, 12527–12555. doi:10.1029/95JB00610
Van Dover, C. L., Arnaud-Haond, S., Gianni, M., Helmreich, S., Huber, J. A., Jaeckel, A. L., et al. (2018). Scientific rationale and international obligations for protection of active hydrothermal vent ecosystems from deep-sea mining. Mar. Policy 90, 20–28. doi:10.1016/j.marpol.2018.01.020
Van Dover, C. L., Colaço, A., Collins, P. C., Croot, P., Metaxas, A., Murton, B. J., et al. (2020). Research is needed to inform environmental management of hydrothermally inactive and extinct polymetallic sulfide (PMS) deposits. Mar. Policy 121, 104183. doi:10.1016/j.marpol.2020.104183
White, S. N., Humphris, S. E., and Kleinrock, M. C. (1998). New observations on the distribution of past and present hydrothermal activity in the TAG area of the Mid-Atlantic Ridge (26°08′ N). Mar. Geophys. Res. 20, 41–56. doi:10.1023/A:1004376229719
Zeng, X., Alain, K., and Shao, Z. (2021). Microorganisms from deep-sea hydrothermal vents. Mar. Life Sci. Technol. 3, 204–230. doi:10.1007/s42995-020-00086-4
Zhao, M., Canales, J. P., and Sohn, R. A. (2012). Three-dimensional seismic structure of a Mid-Atlantic Ridge segment characterized by active detachment faulting (Trans-Atlantic Geotraverse, 25°55′N-26°20′N). Geochem. Geophys. Geosyst. 13, Q0AG13. doi:10.1029/2012GC004454
Keywords: seafloor massive sulfides, inactive deposits, TAG hydrothermal field, Mid-Atlantic Ridge (MAR), diffuse venting
Citation: Pelleter E-L, Principaud M, Alix A-S, Boissier A, Cheron S, Besson F, Altorffer V, Guérin C, Gaillot A, Pierre D, Rospabé M, Giunta T, Grenet L, Cathalot C, Cambon M-A and Fouquet Y (2024) Diversity, spatial distribution and evolution of inactive and weakly active hydrothermal deposits in the TAG hydrothermal field. Front. Earth Sci. 12:1304993. doi: 10.3389/feart.2024.1304993
Received: 30 September 2023; Accepted: 19 January 2024;
Published: 02 April 2024.
Edited by:
Glen T. Snyder, The University of Tokyo, JapanReviewed by:
Jun-ichiro Ishibashi, Kobe University, JapanJohn William Jamieson, Memorial University of Newfoundland, Canada
Jonguk Kim, Korea Institute of Ocean Science and Technology (KIOST), Republic of Korea
Copyright © 2024 Pelleter, Principaud, Alix, Boissier, Cheron, Besson, Altorffer, Guérin, Gaillot, Pierre, Rospabé, Giunta, Grenet, Cathalot, Cambon and Fouquet. This is an open-access article distributed under the terms of the Creative Commons Attribution License (CC BY). The use, distribution or reproduction in other forums is permitted, provided the original author(s) and the copyright owner(s) are credited and that the original publication in this journal is cited, in accordance with accepted academic practice. No use, distribution or reproduction is permitted which does not comply with these terms.
*Correspondence: Ewan-Loiz Pelleter, ZXdhbi5wZWxsZXRlckBpZnJlbWVyLmZy