 Min Gao
 Majie Fan
 Guangsheng Zhuang
 Domenico Chiarella
- 1Research Institute of Petroleum Exploration and Development, PetroChina, Beijing, China
- 2Department of Earth and Environmental Sciences, The University of Texas at Arlington, Arlington, TX, United States
- 3Department of Earth Sciences, Royal Holloway, University of London, Egham, United Kingdom
- 4Department of Geology and Geophysics, Louisiana State University, Baton Rouge, LA, United States
The late Paleocene to early Eocene (LPEE, ∼59–50 Ma) greenhouse condition is the most recent geologic analogue for future climate change induced by increased atmospheric CO2 partial pressure (pCO2). Recognition of the hyperthermals and reconstruction of the continental hydroclimate and atmospheric pCO2 during this warm period are fundamental to the understanding of Earth’s surface responses to high atmospheric pCO2. Here we study paleosol morphology, bulk organic matter δ13Corg, leaf wax n-alkanes δ13Cn-alk and δDn-alk, and reconstruct mean annual precipitation (MAP) and atmospheric pCO2 from the fine-grained floodplain deposits in the greater Green River Basin, western U.S.A., to examine the hydroclimate evolution in the continental interior during the LPEE. The Paleocene-Eocene Thermal Maximum (PETM) was identified as a ∼4‰–5‰ negative carbon isotope excursion (CIE) in the bulk organic δ13Corg record and leaf wax n-alkanes δ13Cn-alk record, and a 30‰–50‰ increase in leaf wax n-alkanes δDn-alk record. Well drained green paleosols and water-logged histosols dominated the floodplain deposition during the LPEE, and poorly drained red paleosols and carbonate-rich calcisols characterized the hyperthermal. Our reconstructed MAP is generally high (800–1,500 mm) during the LPEE and does not show significant change during the PETM. Our estimated atmospheric pCO2, by integrating bulk organic δ13Corg and paleosol carbonate δ13Cc values, is generally in the range of 600–900 ppm during the early Eocene, 1–2 times higher than the preindustrial level. These records suggest that the continental hydroclimate was generally humid and warm during the LPEE, and transient drying likely happened during the PETM.
Highlights
•PETM was recognized as a ∼4‰–5‰ negative carbon isotope excursion in the greater Green River Basin
•Continental climate was generally humid and warm during the late Paleocene-early Eocene based on proxy data
•Transient drying likely happened during the PETM based on an δDn-alk increase and soil morphology change.
1 Introduction
Continental hydroclimate and environment during the late Paleocene-early Eocene (LPEE, 59–50 Ma) greenhouse state are fundamental to the understanding of Earth’s surface responses to future global warming (e.g., McInerney and Wing, 2011). The warm climate during the LPEE culminated at the Early Eocene Climatic Optimum (EECO) during 52–50 Ma (Zachos et al., 2001), and the LPEE consists of several short-term hyperthermal events, including the most prominent Paleocene-Eocene Thermal Maximum (PETM) occurred at ∼55.5 Ma (Zachos et al., 2001), and smaller Eocene Thermal Maximum 2 and 3 (ETM-2, ETM-3) at ∼53.5 Ma and ∼52.8 Ma, respectively (e.g., Zachos et al., 2001; Lourens et al., 2005; Sluijs et al., 2009; Abels et al., 2012; Schneider-Mor and Bowen, 2013). During the LPEE greenhouse state, benthic foraminifera δ18Oc values decreased by at least 1.0‰, representing ∼4°C increase in ocean bottom temperature, and the δ13Cc values decreased ∼2.0‰ (Zachos et al., 2001). It has been suggested that the warm global climate during the LPEE was associated with injection of a very large mass of 13C-depleted carbon into the atmosphere or ocean (e.g., Zachos et al., 2008). Possible sources of the carbon include: 1) deeply buried rocks that were liberated as methane and CO2 by intrusive volcanisms (Svensen et al., 2004); 2) high methane fluxes from large marine gas hydrate capacitors as a result of increasing deep-sea temperature (e.g., Dickens, 2003); 3) metamorphic decarbonation of carbonate-rich pelagic sediments and release of CO2 when the Tethyan oceanic crust was subducted during the India and Eurasia collision (e.g., Caldeira, 1992; Kent and Muttoni, 2008; Guo et al., 2021); or 4) repeated, large-scale releases of dissolved organic carbon from the ocean by ventilation of the ocean interior (e.g., Sexton et al., 2011).
The responses of continental climate and environment to future global warming can be predicted from detailed continental hydroclimate records during the LPEE. Sedimentary basins at different global sites provide a rich archive of continental hydroclimate for this warm period, and many studies have been conducted to examine the contemporaneous climatic and ecological responses based on paleopedology, stable isotope analysis, and climate modeling (e.g., Koch et al., 1995; Bowen et al., 2001; Sewall and Sloan, 2006; Hren et al., 2010; Hyland et al., 2013; Snell et al., 2013; Carmichael et al., 2017; 2018; Hollis et al., 2019; Rush et al., 2021; Cramwinckel et al., 2023). However, most of these studies focus only on a short period of the early Paleogene, such as the PETM and EECO (e.g., Bowen et al., 2001; Bowen and Beerling, 2004; McInerney and Wing, 2011; Hyland et al., 2013). Up to now, long and continuous terrestrial climate records covering the entire early Paleogene are rare.
The hyperthermal events occurred during the LPEE have been well documented in marine isotope record and continental isotope record in the Bighorn Basin in the western U.S.A. The PETM is characterized by a more than 1.0‰ negative excursion of deep-sea carbonate δ18Oc values and ∼4°C–8°C increase of deep-sea temperature over a duration of ∼100 kyr (e.g., Kennett and Stott, 1991; Röhl et al., 2000; Zachos et al., 2003; Tripati and Elderfield, 2005; Röhl et al., 2007). The PETM is also expressed as a ∼3‰–8‰ negative CIE in the marine and terrestrial carbon isotope records (e.g., Kennett and Stott, 1991; Zachos et al., 2001; Koch et al., 2003; Pagani et al., 2006; Baczynski et al., 2016). In the Bighorn Basin, the PETM and ETM-2 have been characterized by negative CIEs in isotope records of soil carbonate and organic matter (e.g., Koch et al., 1995; Stott et al., 1996; Wing et al., 2005; Hyland et al., 2013; Baczynski et al., 2016; Abels et al., 2016).
The paleoenvironmental condition in continental mid-latitude during the extreme hyperthermal events and the atmospheric pCO2 during the LPEE have been debated. A global increase in wetland deposits during the PETM was used to suggest intensified precipitation (Sloan et al., 1992; 1999), which was supported by clay mineral assemblages that suggest wetter conditions (e.g., Robert and Kennett, 1994), and climate modeling that suggests wetter subtropical environment (e.g., Rind, 1998). However, other sedimentological studies and precipitation reconstructions suggest dry conditions in Europe (Schmitz and Andreasson, 2001; Schmitz and Pujalte, 2003), and in the Bighorn Basin in the western U.S.A. (Kraus et al., 2013). Based on paleosol carbon isotope records, Sinha and Stott (1994) proposed that the atmospheric pCO2 during the LPEE was generally between 300 and 700 ppm. Paleosol carbon isotope studies in the Wind River Basin in the western U.S.A. suggest that the atmospheric pCO2 ranged from 350 to 1,265 ppm during the EECO (Fan et al., 2011; Hyland et al., 2013). The most recent, The Cenozoic CO2 Proxy Integration Project (CenCO2PIP) Consortium (2023) assessed a comprehensive collection of proxy reconstructions and suggested that pCO2 during the LPEE ranged between ∼400 and ∼1700 ppm, and the highest was at ∼51 Ma.
To improve our understanding of mid-latitude terrestrial responses to the global climate changes during the LPEE, we conducted a multi-method study on the early Paleogene floodplain deposits in the greater Green River Basin in southwest Wyoming. Specifically, this study constructs a high-resolution, continuous bulk organic δ13Corg record that is assisted by leaf-wax n-alkanes δ13Cn-alk trend to identify the PETM; uses paleosol morphology, leaf-wax n-alkanes δDn-alk and the chemical index of alteration without potassium (CIA-K) of bulk sediments in paleosol B-horizons to reconstruct paleoclimate; and reconstructs pCO2 using paleosol carbonate δ13Cc and bulk organic δ13Corg values.
2 Geological background
The greater Green River Basin was in the Sevier foreland during the Late Cretaceous and evolved into an isolated intermontane basin during the latest Cretaceous-early Eocene Laramide orogeny (Dickinson et al., 1988; DeCelles, 2004; Gao et al., 2016). The basin is bounded by the Sevier thrust belt to the west, the Wind River Range and Granite Mountains to the north, the Rawlins uplift and Sierra Madre Mountains to the east, and the Uinta Mountains to the south (Figure 1). The samples used for analysis in this study were collected along a ∼1430-m-thick measured section of the lower Paleogene strata in the southern part of the basin, to the southeast of the Rock Springs Uplift (Figure 1). The section consists of two segments: the Fort Union Formation with a thickness of about 780 m, and the Wasatch Formation with a thickness of about 650 m. Detailed description and in-depth sedimentological study of this section have been conducted and published in our earlier work (Gao and Fan, 2018).
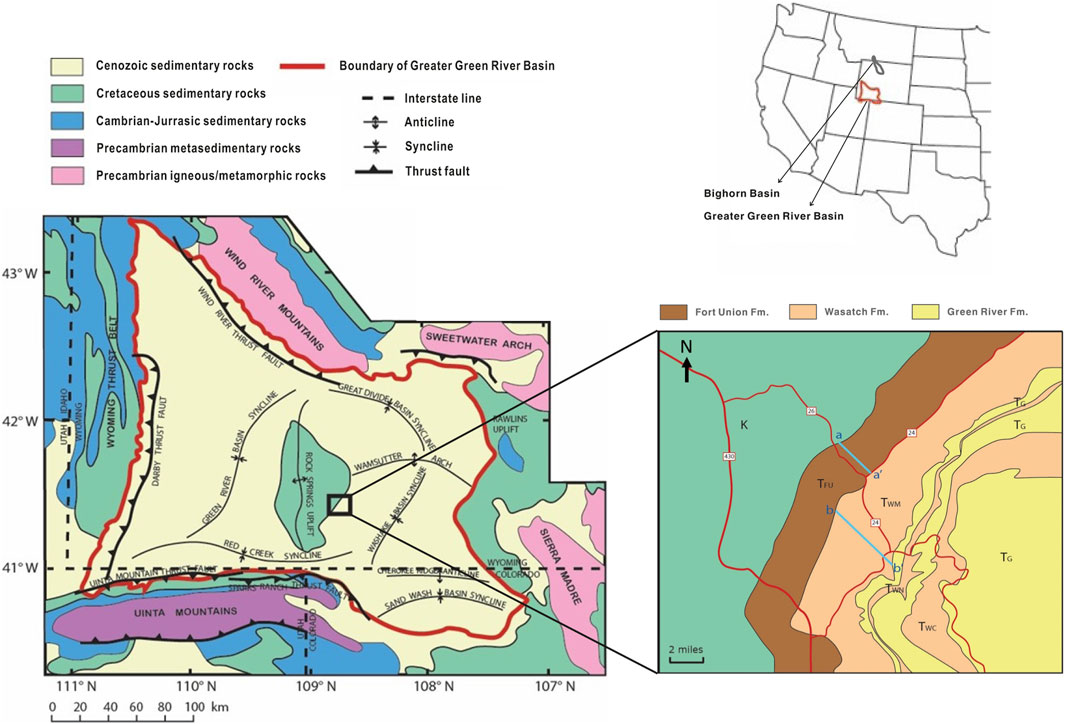
Figure 1. Location of the study area and major structural features in the greater Green River Basin [based on Roehler (1992) and geologic map courtesy of USGS]. The black box represents the study area. a-a’ represents the measured section of the Fort Union Formation, b-b’ represents the measured section of the Wasatch Formation.
The Paleogene strata in the greater Green River Basin consist of three formations: the Paleocene Fort Union Formation and the lower Eocene Wasatch Formation, both deposited in predominantly fluvial systems, and the overlying lower Eocene Green River Formation deposited in fluvial and lacustrine environments (e.g., Dickinson and others, 1988; Shuster and Steidtmann, 1988; Roehler, 1992; Pietras and others, 2003; Gao and Fan, 2018). This study focuses on the Fort Union and the Wasatch formations, to investigate the recorded signals of the continental hydroclimate during the Paleocene-early Eocene. On the sampled section of this study, the Fort Union Formation is characterized by multiple fining-upward sequences, with lithofacies changes from very fine-to medium-grained, horizontally bedded (Sh), laminated (Sl), and massive (Sm) sandstone to massive (Fm) and laminated (Fl) mudstone, paleosol (Fp), and coal (C) in each sequence, typical of a distal floodplain environment (Figure 2); the Wasatch Formation conformably overlies the Fort Union Formation, and is featured by stacked, thick or thin lenticular sandstone units with erosional bases and trough-cross stratifications (St), ripples (Sr), or other sedimentary structures (Sh, Sl, Sm), nested in fine-grained lithofacies (Fm, Fl, Fp), interpreted to be frequently migrating river channels over the floodplain in a braided river system (Figure 2) (Gao and Fan, 2018). The fine-grained deposits of these two formations along the sampled section contain large amount of paleosols, providing the opportunity to build long isotope and element records for the interpretation of early Paleogene continental climate.
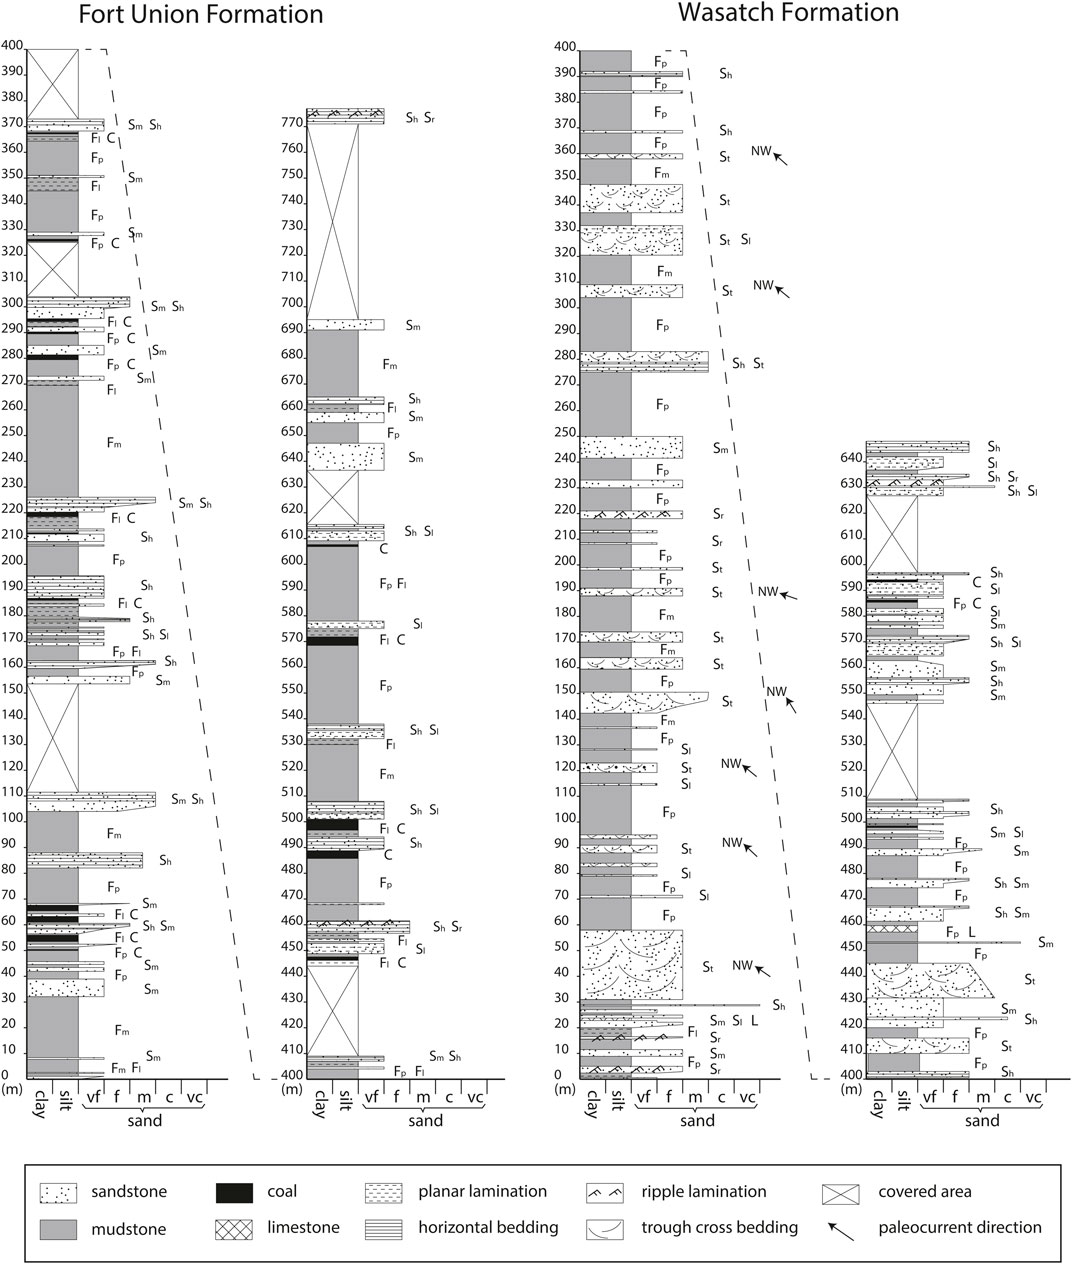
Figure 2. Measured stratigraphic sections of the Paleocene Fort Union Formation and the lowermost Eocene Wasatch Formation (Gao and Fan, 2018, © Yale University-AJS, used with permission). Section locations are shown in Figure 1.
The chronology of the greater Green River Basin relies mainly on land mammal fossil assemblages and pollen biostratigraphy (e.g., Roehler and Martin, 1987; 1992; Honey, 1988; Woodburne, 2004); paleomagnetostratigraphy and radiometric dating of volcanic ash beds were only conducted to some intervals of the Eocene strata stratigraphically above our section (e.g., Mauger, 1977; Machlus et al., 2004). North America Land Mammal ages have been calibrated to absolute geologic time scale based on paleomagnetostratigraphy and radiometric dating of ash beds in other basins in Wyoming (e.g., Clyde et al., 1997). Mammal fossils of Diacodon, Gelastops, Mixodectes, Paleotomus, Promioclaenus, etc., typical to the early Torrejonian land mammal stage (To2, ∼61.3–62.3 Ma), were found in the Fort Union Formation, ∼8 km south of our studied locality (Rigby, 1980). Age-diagnostic fossils were previously documented at several stratigraphic levels in other measured sections of the Wasatch Formation near our studied section (Roehler, 1992). These stratigraphic levels can be correlated to our section based on lithostratigraphic correlations. The presence of Hyracotherium, Hyopsodus, Haplomylus, and Diacodexis, in the main body of the Wasatch Formation in several localities places the deposition to the early Wasatchian stage (Wa0-Wa5, ∼55.0–53.4 Ma). The top of the main body of the Wasatch Formation is determined to be older than ∼53 Ma because the presence of Heptodon, Lambdotherium, and Meniscotherium in the Niland Tongue Member of the Wasatch Formation (e.g., Roehler, 1992; Tauxe et al., 1994), stratigraphically above our studied interval, places the Member to middle or late Wasatchian stage (Wa6-Wa7, ∼52.9–52.6 Ma).
3 Methods
Four types of data were collected to reconstruct the continental hydroclimate during the LPEE in the greater Green River Basin, including paleosol morphology observations documenting changes in paleosol type; high-resolution bulk organic δ13Corg and low-resolution leaf wax n-alkanes δ13Cn-alk and δDn-alk values for the identification of PETM; coupled paleosol carbonate δ13Cc and bulk organic δ13Corg values to reconstruct pCO2; and CIA-K of paleosol B-horizons for the reconstruction of MAP.
3.1 Paleosol classification
The paleosol description and classification in this study are mainly based on the field observations of soil texture and structure, mottled color and mineral accretions. The B-horizon in the soil profile is the key interest of this study, for its important role in reflecting the drainage condition and assisting the pCO2 reconstruction. Several key features were used to identify the B-horizons during our field examination of paleosols: 1) B-horizons often display reddish, yellowish, or brownish colors due to the accumulation of iron oxides or clay minerals; 2) B-horizons usually exhibit distinctive ped structures, such as wedge-shaped peds or slickensides; and 3) accumulated materials are often present in B-horizons as evidence of illuviation, such as the shiny clay films that form along the wedge-shaped peds or slickensides, the iron oxide coatings, the pedogenic carbonate nodules, etc. (e.g., Mack et al., 1993; Retallack, 1997; 2001; Kraus, 1999; Daniels and Haering, 2006; Kraus et al., 2013).
3.2 Carbon and hydrogen isotope analysis
Carbon isotope analysis in this study includes analysis of bulk organic matter δ13Corg, paleosol carbonate δ13Cc, and leaf wax n-alkanes δ13Cn-alk. Bulk paleosol and mudstone samples were collected every 0.5–1.0 m from the floodplain facies throughout the measured sections, and pedogenic carbonate nodules were collected where available. Fresh bulk paleosol and mudstone samples were collected after removing the surface layers to avoid any possible contamination from recent organic material. Pedogenic carbonate nodules were collected at a depth greater than 30 cm below the paleosol surface in order to reduce the influence of atmospheric CO2 on δ13Cc. Petrographic analysis and X-ray diffraction analysis have been done to these pedogenic carbonate nodules in our earlier study (Gao and Fan, 2018), and the results show that these paleosol carbonates are dominated by low-magnesium calcite, predominantly micritic, suggesting minimal diagenetic influence.
For δ13Corg analysis, the samples were examined under a microscope and any obvious modern organic matter was removed by hand picking. Samples were then powdered using a ceramic mortar and pestle and weighted into open silver capsules. Carbonate in the powdered samples was removed using hydrogen chloride fumigation method. Samples were loaded into silver capsules and wetted by adding one drop of deionized water. Open silver capsules were placed in a sealed desiccator containing a beaker of 12 N fuming HCl for at least 4 days, then dried in oven at 75°C for at least 12 h. Each silver capsule was then carefully placed in a tin capsule and tightly packed and loaded into a Costech ECS 4010 Analyzer, which was connected to a Delta V Advantage Mass Spectrometer via ConFlo IV, at the University of Texas at Arlington. The isotope ratios were calibrated using USGS 40, USGS 41, and the precision of δ13Corg is better than ±0.2‰ (1σ) based on repeated analysis of standards. The δ13Corg values are reported relative to Vienna Pee Dee Belemnite (VPDB).
For δ13Cc analysis, the carbonate samples were powdered using a ceramic mortar and pestle. Powdered samples were weighed and loaded into sample vials. After flushing the vials using ultrapure helium, dehydrated phosphoric acid was injected into the vials to react with the samples at 70°C. The δ13C values of the resulted CO2 were analyzed using a Gasbench II and a Delta V Advantage Mass Spectrometer at the University of Texas at Arlington. The isotope ratios were calibrated using NBS-19, NBS-18, and the precision of δ13C values is better than ±0.2‰ (1σ) based on repeated analysis of standards. All the isotope values of carbonate were reported relative to VPDB.
Based on the trend of δ13Corg data and potential PETM, six paleosol samples were selected to analyze δ13Cn-alk and δDn-alk at the Louisiana State University to verify the presence of PETM in our record. These six samples include four within and two outside of the interpreted PETM. Lipids were extracted from 30 to 60 g of powdered rock samples using Soxhlet extractors with a solvent mixture of dichloromethane (DCM) and methanol (MeOH) 2:1 (v/v) for over 48 h. Total lipid extracs (TLE) were evaporated using a TurboVap II evaporator under a stream of purified nitrogen. TLE was separated into compound classes using ∼4.0 g of pre-extracted, activated (@200°C for 2 h) silica gel. Organic compounds in TLE were separated into apolar, intermediate, and polar fractions by using 4 mL hexane, 4 mL DCM, and 4 ml methanol, respectively. n-Alkanes abundances were determined using a Thermal Trace 1,310 Ga Chromatography (GC)-flame ionization detector (FID) fitted with a programmable temperature vaporization (PTV) injector and a fused silica, TG-1MS column (60 m long, 0.25 mm i. d., 0.25 µm film thickness). Samples were carried by helium at a rate of 2 mL/min. GC oven temperature was ramped from 60°C (holding for 1 min) to 320°C at 15°C/min (holding for 20 min).
Measurements of compound-specific δ13Cn-alk values were performed using a Thermal Trace 1,310 Ga Chromatography (GC) coupled to a Thermo Delta V Advantage isotope ratio mass spectrometer (IRMS) interfaced with a Thermo Isolink interface. The GC column and carrier flow conditions were identical to above. Compounds were separated on the GC with a temperature program from 60°C (held for 1 min) to 170°C at 14°C/min, to 300°C at 3°C/min, and then to 325 at 14°C/min with an isothermal holding of 10 min. Carbon isotope ratio values were determined relative to a reference, calibrated against Mix A6 (n-C16 to n-C30; Arndt Schimmelmann, Indiana University), and reported relative to VPDB and with two standard deviations.
Measurements of compound-specific δDn-alk values were performed using a Thermo Trace 1310 GC coupled to a Delta V Advantage isotope ratio mass spectrometer (IRMS) interfaced with an Isolink interface. The GC column and carrier flow conditions were identical to carbon isotope analysis. Compounds were separated on the GC with a temperature program from 60°C (held for 2 min) to 170°C at 14°C/min, to 300°C at 3°C/min, and then to 325°C at 14°C/min with an isothermal holding of 10 min. The H3+ factor (Sessions, 2001) was monitored daily prior to δD analysis and was less than eight for the measurement periods. The drift of the instrument was routinely monitored, and individual n-alkane isotope ratios were corrected to n-alkane reference materials (Mix A3, A. Schimmelmann, Indiana University, Bloomington). δDn-alk values are reported relative to Vienna Standard Mean Ocean Water (VSMOW) and with two standard deviations (Table 1).
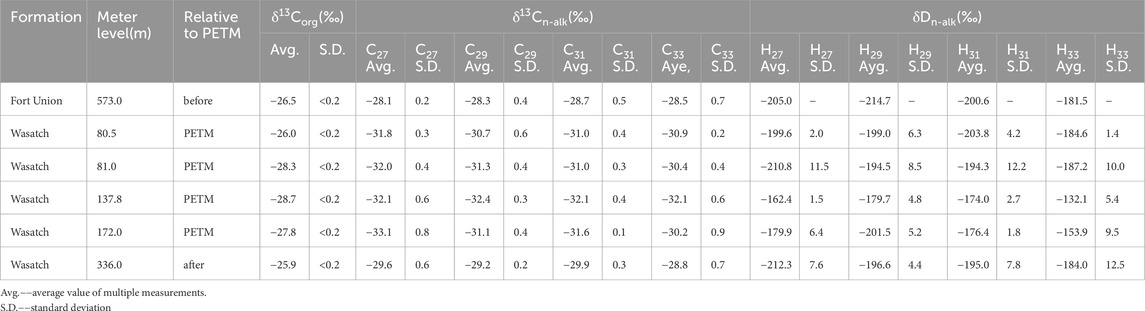
Table 1. Leaf wax δ13C n-alk and δD n-alk values of the six samples in this study.
3.3 pCO2 reconstruction
We followed Equation 1 that was presented in Cerling and Harris, (1999) for atmospheric pCO2 reconstruction.
In the equation, pCO2 is the concentration of atmospheric CO2, S(z) is the concentration of soil-respired CO2, δ13Cs is the carbon isotope composition of soil CO2, δ13Cr is the carbon isotope composition of soil-respired CO2, δ13Ca is the carbon isotope composition of atmospheric CO2. δ13Cs is determined from the paleosol carbonate δ13Cc and paleosol carbonate precipitation temperature using the temperature-sensitive equilibrium isotope fractionation factor between calcite and CO2 Equation 2 (Romanek et al., 1992):
δ13Cr was traditionally represented by paleosol δ13Corg values (e.g., Cerling, 1992; Retallack, 2009). However, several studies have shown that bulk δ13Corg values in modern soils are comparable to those found in surface litter, but they tend to increase with soil depth (e.g., Torn et al., 2002; Wynn et al., 2005; Wynn and Bird, 2007). Therefore, organic carbon in soil B-horizons, which are typically sampled when working with paleosol carbonate, have δ13Corg values higher than the average biomass, and the δ13Cr in Equation 1 can be approximated by measured δ13Corg values minus 1‰ (Bowen and Beerling, 2004; Breecker, 2013). δ13Ca was −6.1‰ during the early Eocene (Tipple et al., 2010). S(z) is commonly assumed as summer minimum soil-respired CO2 in this equation because soil carbonates are likely to precipitate preferentially during warm seasons (Breecker et al., 2009; Passey et al., 2010; Quade et al., 2013; Hough et al., 2014). We use the value of 2,500 ppm for S(z) as it is commonly used for the subhumid temperature and tropical climates (Breecker et al., 2010).
3.4 MAP reconstruction
Bulk paleosol samples from the B-horizons were analyzed for major element concentrations using a Shimadzu EDX-7000 X-ray fluorescence (XRF) spectrometer at the University of Texas at Arlington. The reported weight percentages were calibrated using three USGS standards: SDO-1 (Devonian Ohio Shale), SBC-1 (Brush Creek Shale), and SGR-1 (Green River Shale) (Supplementary Table S2). The weight percentages were then recalculated to molar ratios, following Sheldon et al. (2002). Since the intensity of chemical weathering of paleosols depends in part on precipitation, Sheldon et al. (2002) developed an empirical relationship (Equation (3)) relating the mean annual precipitation (MAP) to the chemical index of alteration without potassium (CIA-K). The error associated with the regression analysis is ±181 mm (Sheldon et al., 2002; Sheldon and Tabor, 2009).
The chemical index CIA-K, which excludes potassium (K), is derived from Equation 4. K is excluded in calculation because diagenesis can yield elevated K concentrations in paleosols (McLennan, 1993). CIA-K is calculated based on the molar ratio of Al2O3, to the sum of Al2O3, CaO*, and Na2O. CaO* is the smaller value between CaO and Na2O to account for CaO derived from the silicate fraction, excluding the carbonate fraction (McLennan, 1993).
4 Results
4.1 Paleosol classification
4.1.1 Fort Union Formation
The floodplain facies in this formation contains many coal beds. Figure 3a shows a typical succession that contains a coal bed in the Fort Union Formation. Below each coal bed a sequence of mudstone with color changes from light grey to dark grey toward the coal is commonly observed, representing upward increase of organic matter content. Above each coal bed is usually a short sequence of tan or greyish mudstone, which gradually changes upward into very fine- to fine-grained and laminated sandstone. Beds with the presence of coals in this formation are classified as histosols according to the definition that each coal originated as a water-logged surface horizon containing a high concentration of plant debris, called histic epipedon (Soil Survey Staff, 1975; Buol et al., 1980; Mack et al., 1993).
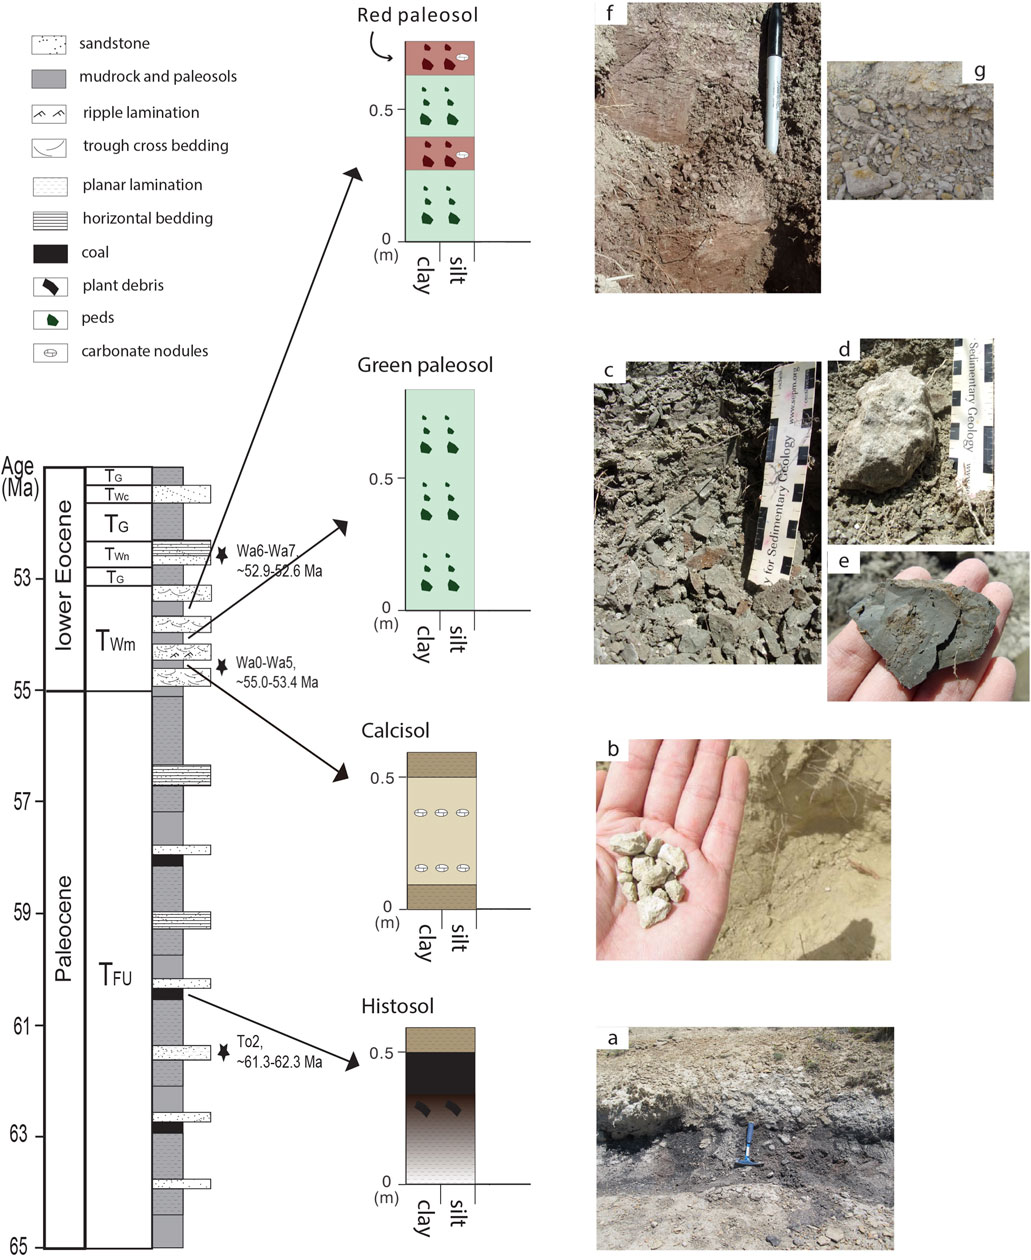
Figure 3. Field pictures and conceptual sketch of the four types of paleosol in this study. The simplified stratigraphic column of the studied strata is based on Figure 2, and stars represent stratigraphic levels of the age constraints summarized in the text. (a) field picture of a histosol; (b) field picture of a calcisol with soil carbonate nodules; (c) field picture of a green paleosol with (d) carbonate nodules and (e) peds structure; and (f) field pictures of a red paleosol with (g) carbonate horizon. TFU: Fort Union Formation; TWm: main body of the Wasatch Formation; TWn, Niland Tongue of the Wasatch Formation; TWc, Cathedral Bluffs Tongue of the Wasatch Formation; TG, Green River Formation. Field pictures (a,b) are from Gao and Fan (2018), © Yale University-AJS, used with permission.
4.1.2. Main body of the Wasatch Formation
Three types of paleosols are observed in this formation: the calcic paleosol (Figure 3b), the green paleosol (Figures 3c–e), and the red paleosol (Figures 3f–g). The calcic paleosols were mostly found at about 80–100 m above the base of the Wasatch Formation, coincident with the ∼4‰ negative CIE on δ13Corg record (Figures 3, 4). The B-horizons of these calcic paleosols typically have tan color with small, white and hard carbonate nodules, and lack peds or slickenside structures, suggesting low precipitation and poor drainage. The green paleosols and the red paleosols contain high clay content and vertic features including wedge-shaped peds, hummock and swale structure, and slickensides. The green paleosols are the most prevalent in the main body of the Wasatch Formation, while the red paleosols are mostly present in two segments of the section: one is at 80–180 m above the formation base, and the other is in the upper part of the section within about 100 m below the early Eocene lacustrine facies. Carbonate accumulations can be found in the B-horizons of both the green paleosols and red paleosols, while more common and developed as nodules in the red paleosols.
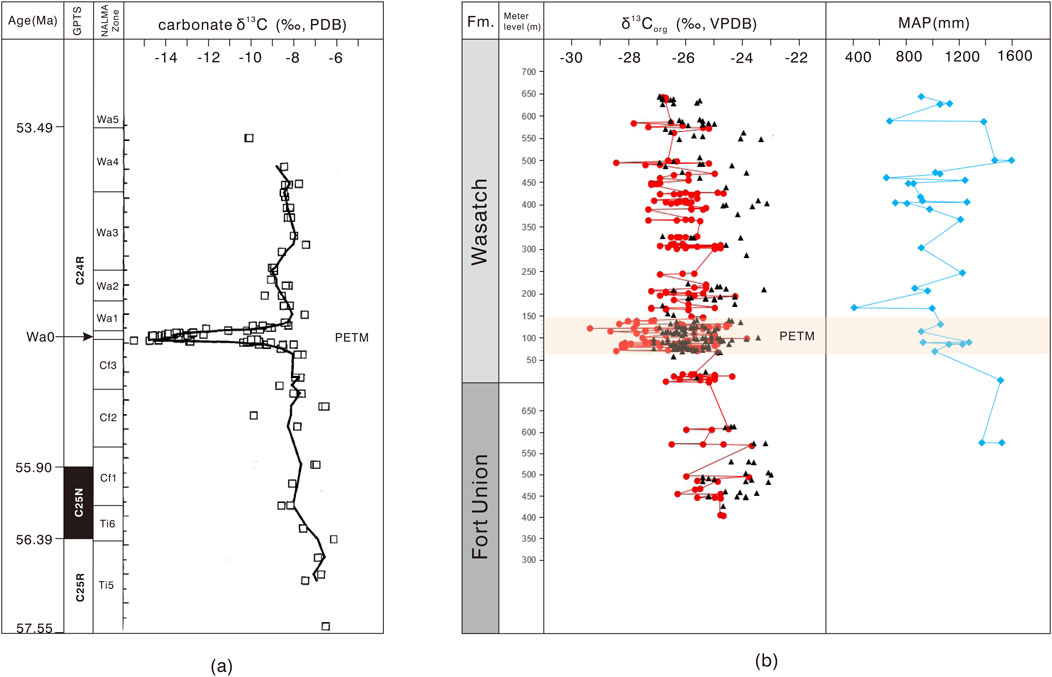
Figure 4. Carbon isotope record and MAP estimates for the late Paleocene-early Eocene hydroclimate. (a) Carbon isotope record from paleosol carbonates in the Bighorn Basin (Koch et al., 2003, © The Geological Society of America, used with permission); (b) δ13Corg record and MAP estimates (this study). Red dots represent the δ13Corg values of paleosol samples, and black triangles represent the δ13Corg values of non-pedogenic mudstone samples. Please note that the low MAP at 168.8 m of Wasatch Formation is due to elevated Na2O level, likely originating from diagenetic salt, and is therefore not accurate.
The calcic paleosols found in this formation are classified as calcisols based on their combined features of soil structure and the presence of carbonate nodules. Since calcisols are commonly formed in semi-arid to arid climate (e.g., Badía-Villas and del Moral, 2016; Elidrissi et al., 2018), the accumulation of calcisols here might indicate a transient drying during the PETM. The green paleosols and the red paleosols were classified to be ancient analogs to vertisols, based on their mottled colors and vertic features (e.g., Mack et al., 1993; Nettleton et al., 2000; Driese et al., 2005).
4.2 Isotope record, reconstructed MAP, and atmospheric pCO2
The δ13Corg values of the organic-rich pedogenic mudstone that is usually accompanied with coal beds in the Paleocene Fort Union Formation vary between −23.2‰ and −26.5‰, with an average of −25.0‰ (Supplementary Table S1; Figure 4b). The δ13Corg values of the paleosol B-horizons in the main body of the lower Eocene Wasatch Formation vary between −24.0‰ and −29.4‰, with an average of −26.3‰ (Supplementary Table S1; Figure 4b).
The δ13Corg values of the non-pedogenic mudstone samples have similar variations as the δ13Corg values of paleosols. In the Fort Union Formation, the δ13Corg values of non-pedogenic mudstone samples vary between −22.8‰ and −26.1‰, with an average of −24.5‰ (Supplementary Table S1; Figure 4b). In the main body of the Wasatch Formation, these δ13Corg values vary between −22.5‰ and −27.2‰, with an average value of −25.7‰ (Supplementary Table S1; Figure 4b).
At ∼70 m above the base of the Wasatch Formation, the δ13Corg values show a transient drop of ∼4‰, and the CIE spans ∼70 m on the record (Figure 4b). The δ13Cn−alk values in this interval show a negative excursion on the order of ∼4‰–5‰ on long−chain n−alkanes with 27, 29, 31, and 33 carbon atoms (Table 1; Figure 5), δDn−alk values in this interval show increases of 30‰–50‰ (Table 1; Figure 6). Another CIE of ∼2‰ is documented in the δ13Corg record after the Paleocene−Eocene boundary, at the 490–590 m level above the base of Wasatch Formation, and is older than ∼53 Ma based on the biostratigraphic age constraint of our studied strata (Figure 4b).
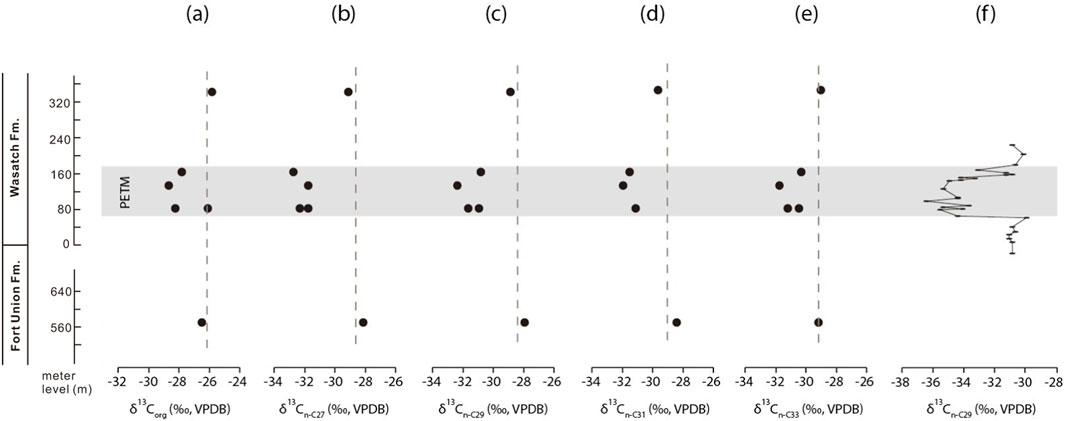
Figure 5. Bulk organic δ13Corg values (a) and compound−specific leaf wax δ13Cn−alk values (b–e) of the six selected samples in this study are compared to a record (f) in the Bighorn Basin (Baczynski et al., 2016).
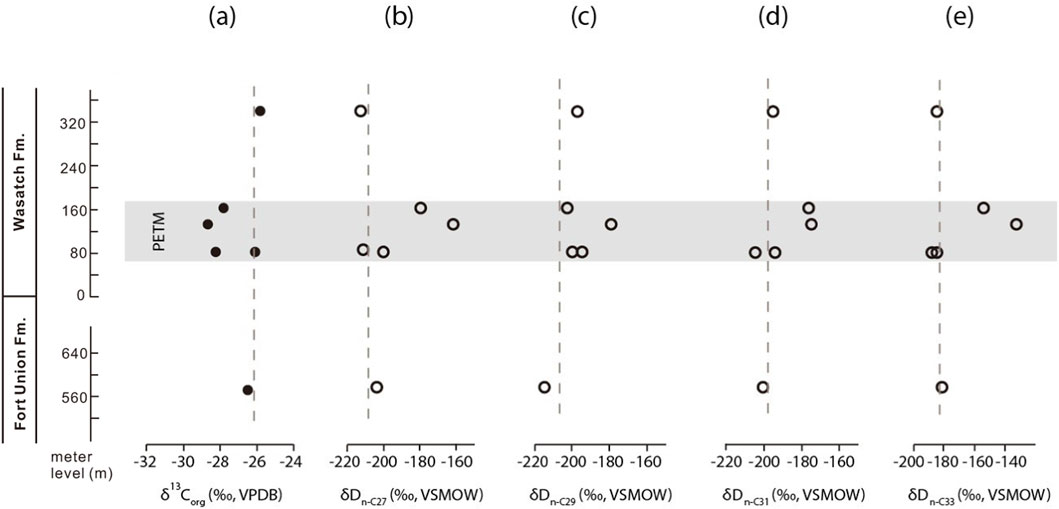
Figure 6. Compound−specific leaf wax δDn−alk values (b–e) in our study. Bulk organic δ13Corg values of the samples are also shown (a).
Based on the well calibrated major element data (Table 2; Supplementary Table S2), the reconstructed MAP throughout the Paleocene and the earliest Eocene is generally high, in the range of 800–1,500 mm (Table 2; Figure 4b). An extremely low value of 408 mm occurs at 168.8 m of Wasatch Formation, however, this estimate is not accurate due to its high Na2O content (5.1 wt%) compared to the other samples (<2.8 wt%). The elevated Na2O is likely due to diagenetic salt, rather than a contribution from silicate. The other two samples at 405 m and 588 m of Wasatch Formation, where Na2O content is greater than 2.0 wt%, also show low MAP estimates. The atmospheric pCO2 during the early Eocene was estimated to be in the range of 600–900 ppm from the six selected paleosol samples in the Wasatch Formation (Table 3).
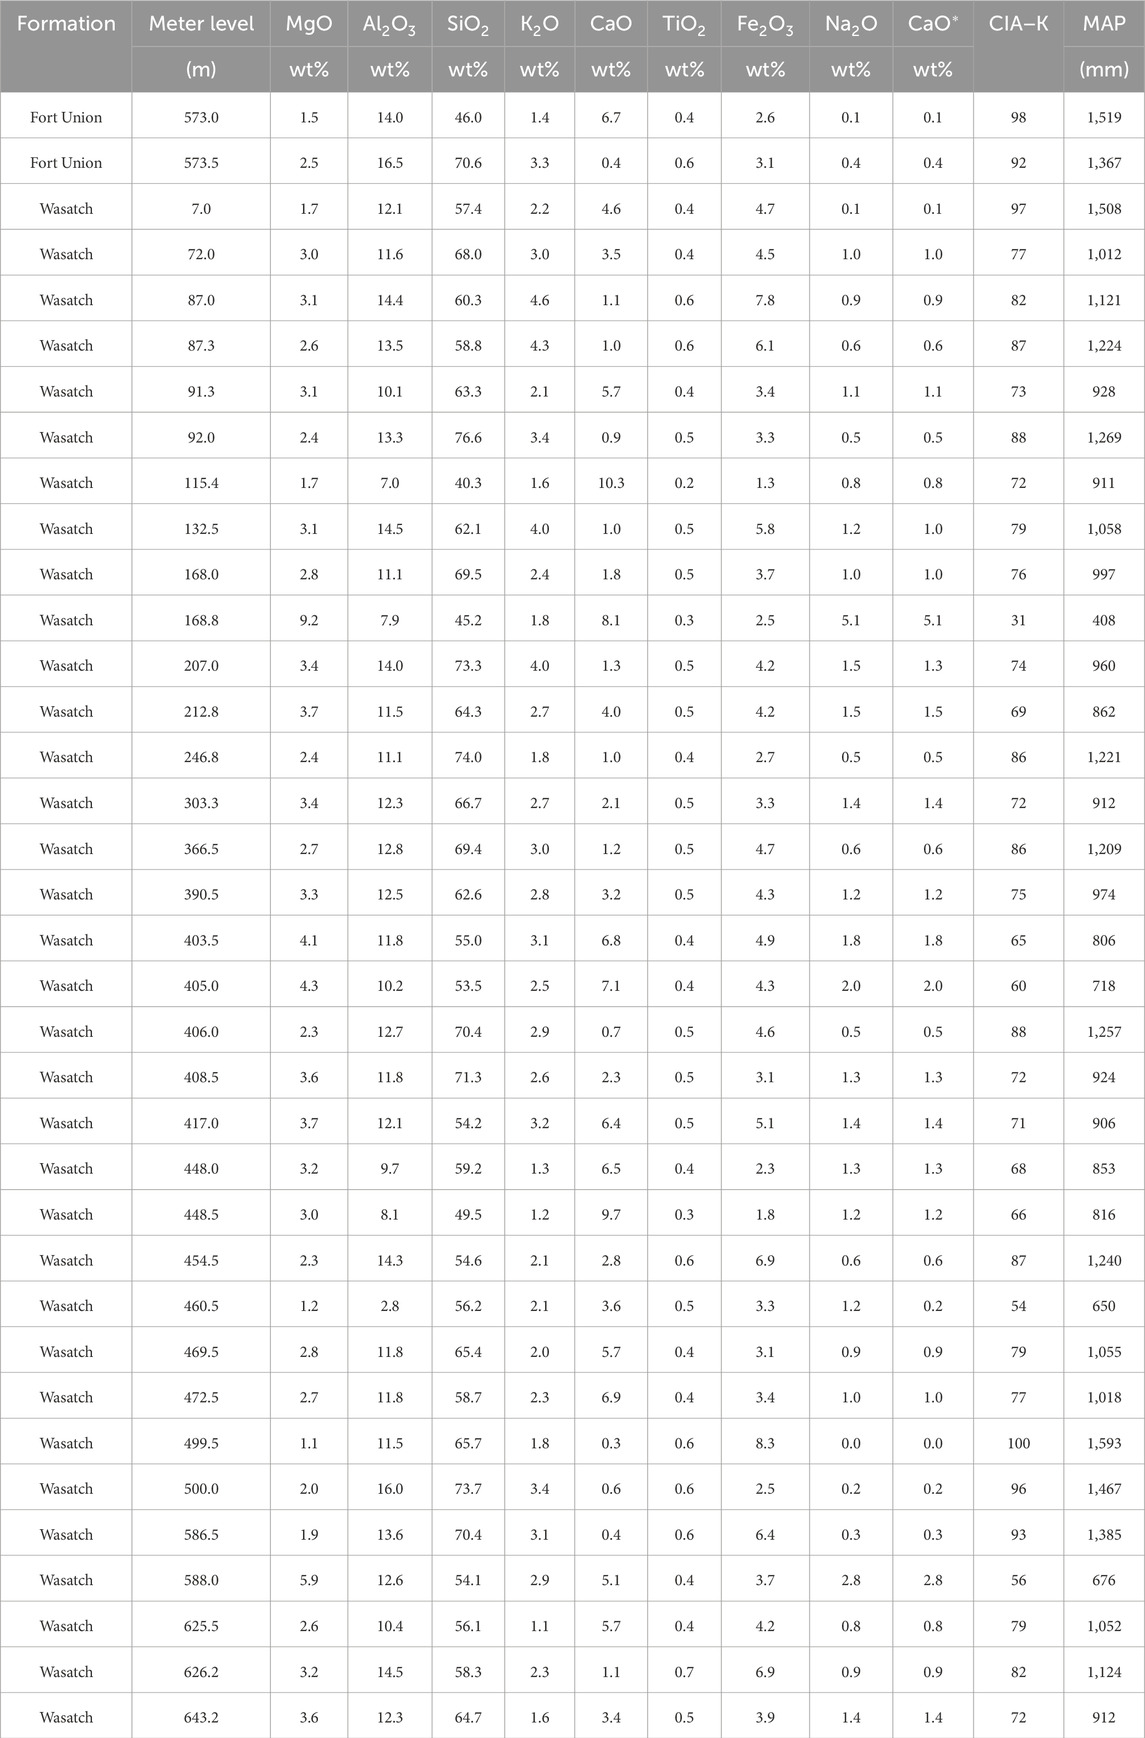
Table 2. Major elements weight percentages and calculated CIA−K and MAP.
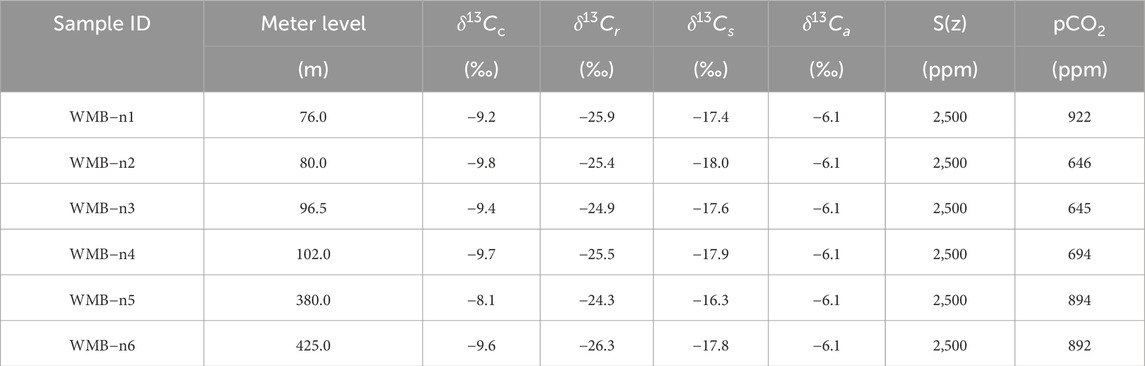
Table 3. Reconstructed atmospheric pCO2 based on isotopic analysis of paleosols.
5 Discussion
5.1 Recognition of PETM
We identify CIEs in both the δ13Cn−alk and δ13Corg records near the Paleocene−Eocene boundary in the greater Green River Basin (Figures 4b, 5). The magnitude is on the order of 4–5‰, which is consistent with, or smaller than those of CIEs of the PETM in marine and other continental records. In marine benthic foraminifera δ13Cc record, the PETM is expressed as a ∼3‰ CIE (e.g., Zachos et al., 2001). Continental records show that the CIE during the PETM has variable magnitude, depending on the type of samples studied. Such CIE records include a ∼6‰ drop based on studies of bulk organic δ13Corg in the Paris Basin, France (Magioncalda et al., 2001), a ∼6‰–8‰ drop based on studies of paleosol carbonates δ13Cc in the Bighorn Basin (Bowen et al., 2001; Koch et al., 2003; Abels et al., 2016), a ∼5‰ drop based on a study of mammalian tooth enamel δ13C in the Bighorn Basin (Secord et al., 2012), and a 4‰–5‰ drop based on studies of bulk organic δ13Corg and leaf wax δ13Cn−alk in the Bighorn Basin (Baczynski et al., 2013; 2016). The depositional duration of the ∼4–5‰ CIE in our record seems also to match the duration of PETM in the Bighorn Basin. Our CIE spans ∼70 m, aligning with the stratigraphic interval of PETM in the Bighorn Basin, which varies between 40 m and 100 m depending on the specific study location (Bowen et al., 2001; Koch et al., 2003; Secord et al., 2012; Baczynski et al., 2013; 2016). Therefore, we suggest that the ∼4–5‰ CIE in our record is the PETM. The variations in CIE magnitude in different locations could reflect differences in soil properties, the type of C3 vegetation (e.g., Cerling and Quade, 1993), the mixing of carbon from different sources (e.g., autochthonous or allochthonous), and different degrees of organic matter degradation (Baczynski et al., 2013; 2016).
The second CIE on our δ13Corg record, with a magnitude of ∼2‰, occurred after the PETM but before ∼53 Ma (Figure 4b). This CIE most likely represents the ETM−2 hypothermal event. The ETM−2 is the most pronounced early Eocene hyperthermal event and is expressed as a ∼1‰ negative CIE in marine bulk sediment records (Zachos et al., 2010). In the continental environment, ETM−2 has been documented as a ∼3‰ drop in paleosol carbonate δ13Cc in the Bighorn Basin (Abels et al., 2016). Although our δ13Corg record does not show an ideal CIE that could precisely represent the ETM−2, the timing and magnitude of this excursion resemble those of the ETM−2, or a combination of ETM−2 and other smaller hyperthermals that happened within the next ∼500 kyr of the ETM−2 (e.g., Cramer et al., 2003; Lourens et al., 2005).
5.2 Humid LPEE and transient drying during the PETM
Kraus et al. (2013) reconstructed the MAP in the Bighorn Basin based on a ∼70 m thick interval of paleosols covering the PETM, their results show that the MAP values in the pre− and post−PETM intervals are generally high, in the range of 1,100–1,500 mm, and the values dropped to 800–1,100 mm during the main phase of PETM. However, our estimated MAP remains relatively stable, ranging between 800–1,500 mm during the entire LPEE (Figure 4b). The absence of a decrease in MAP during the PETM in this studied section contrasts with records from other basins and the transient drying observed in leaf wax δDn−alk and changes in paleosol morphology in this study. For example, a dry PETM was also suggested from a sedimentology study in the Axehandle Basin in central Utah (Bowen and Bowen, 2008) and a leaf physiognomy study in the Bighorn Basin (Wing et al., 2005). Several studies have questioned the accuracy of MAP estimates based on CIA−K, particularly for thinner paleosols (B horizon less than 1 m thick), as they had less time for weathering and may not have a cation distribution representative of precipitation (e.g., Adams et al., 2011). The possibility that the low sampling resolution in our record is responsible for the absence of decreasing MAP cannot be completely ruled out.
The 30‰–50‰ increase in leaf wax δDn−alk values in our record show transient drying during the PETM (Figure 6). Studies of terrestrial plants and soils have suggested that leaf waxes are refractory, and their δDn−alk values primarily reflect meteoric water δD values (e.g., Sauer et al., 2001; Smith and Freeman, 2006). The increase in δDn−alk values during the PETM most likely reflects a combination of increasing meteoric water δD due to decreasing precipitation amount, increasing soil evaporation, and reducing hydrogen isotope fractionation between water and leaf wax during climate drying. It has been suggested that soil evaporation enriches deuterium in soil water and decrease the apparent fractionation factor, especially in arid climate (e.g., Smith and Freeman, 2006). The development of different types of paleosols throughout our measured section further supports the inferred transient drying. During the Paleocene, the floodplains were generally water−logged and had histosols (coal beds) developed, indicating that the climate was wet. During the early Eocene, paleosol types within the PETM are different compared to those in the rest of the section. Within the PETM, poorly drained red paleosols and calcisols developed, indicating dry environment. Outside of the hyperthermal, the floodplain deposition was dominated by well drained green paleosols, indicating wet climate. Soil type representing wet paleoclimate changed from histosols during the Paleocene to green paleosols during the early Eocene, possibly reflecting a change in ecosystem when climate became very hot during the early Eocene.
The transient drying during the PETM may be explained by the mid−latitude bypass mechanism, which was proposed to explain the elevated runoff and deuterium−enriched precipitation in the Arctic during the PETM (Pagani et al., 2006). Decreased meridional temperature gradients during the PETM might have reduced rainout of water vapor by synoptic eddies in the mid−latitudes, and increased moisture delivery to the high latitudes, because a decreased temperature gradient provides a smaller energy supply for synoptic eddies (Pierrehumbert, 2002; Pagani et al., 2006). This mechanism predicts temporally drier conditions during the PETM than other times during the early Paleogene in the mid−latitudes, and spatially drier conditions in the southerly sites than in the northerly sites in Wyoming during the PETM (Bowen and Bowen, 2008). Bowen and Bowen (2008) found that the CIE in central Utah was ∼2‰ smaller than the ∼6‰–8‰ drop in the Bighorn Basin during the PETM, both determined from paleosol carbonates δ13Cc, and suggested that the smaller CIE could have been caused by drier conditions. The speculative correlation of the PETM with a ∼15−m−thick evaporite sequence deposited in the Flagstaff lake system in central Utah also supports a significant increase in regional aridity during the PETM at this location compared to the Bighorn Basin (Bowen and Bowen, 2008). The CIE magnitude in the greater Green River Basin is consistent with that based on leaf wax δ13Cn−alk in the Bighorn Basin (Baczynski et al., 2013; 2016), indicating no evidence of southward aridification.
The general wet climate during the LPEE is consistent with climate model predictions. However, the model also predicts that the PETM, with higher pCO2 levels compared to the rest of the LPEE, should be wetter. By using the Community Climate System Model (CCSM3) with atmospheric CO2 concentrations of 4×, 8×, and 16× the preindustrial value, Winguth et al. (2010) demonstrated that precipitation during the PETM slightly increases, and evaporation minus precipitation slightly decreases in mid to high latitudes with increased surface temperatures, and attributed the changes to responses to CO2 radiative forcing (also seen in Sloan and Rea, 1996; Shellito et al., 2003). This prediction is not supported by the observed transient drying. The discrepancy between model predictions and proxy data could arise from several uncertainties. These include, but are not limited to, that model simulations may overestimate CO2 radiative forcing, as our records show that the pCO2 levels during the PETM were only 1–2 times higher, not at least 4 times higher, than preindustrial levels; model simulations may not fully account for the topography development in the western U.S.A. during the early Paleogene; and seasonal distribution of precipitation and potential biases in leaf wax records towards growing season precipitation.
6 Conclusion
This study presents an extensive record of continental hydroclimate responses to the warm late Paleocene−early Eocene global climate, including the extremely hot PETM. At our site in the greater Green River Basin, the reconstructed MAP during the entire LPEE is 800–1,500 mm, which is wetter than present conditions. The reconstructed atmospheric pCO2 during the early Eocene is 600–900 ppm. The PETM is marked by a ∼4‰ negative CIE in our bulk organic δ13Corg record and a ∼4‰–5‰ negative CIE in our leaf wax n-alkanes δ13Cn−alk record. During the PETM, the leaf wax n-alkanes δDn−alk increased by 30‰–50‰, indicating a phase of transient drying. Overall, our records show that the continental hydroclimate in the greater Green River Basin during the LPEE was generally warm and humid, but transient drying occurred during the PETM. The humid LPEE climate promoted formation of well drained green paleosols and water−logged histosols. In contrast, transient drying during the PETM resulted in the development of poorly drained red paleosols and carbonate−rich calcisols. This study contributes to the growing body of knowledge in understanding the continental hydroclimate responses to the global warming during the LPEE.
Data availability statement
The original contributions presented in the study are included in the article/Supplementary Material, further inquiries can be directed to the corresponding author. All the data supporting the conclusions can be found in the article/Supplementary Material and the cited references.
Author contributions
MG: Investigation, Formal analysis, Writing – original draft, Writing – review and editing. MF: Conceptualization, Supervision, Writing – review and editing. GZ: Formal analysis, Writing – review and editing. DC: Writing – review and editing.
Funding
The author(s) declare that financial support was received for the research, and/or publication of this article. This study is funded by American Chemical Society Petroleum Research Fund (grant number: PRF−54673−DNI8) to M. Fan, and is partially supported by a GSA graduate student research grant to M. Gao.
Acknowledgments
Acknowledgments are made to the donors of the American Chemical Society Petroleum Research Fund (grant number: PRF−54673−DNI8) awarded to M. Fan and the GSA graduate student research grant awarded to M. Gao. We are grateful to the journal editors and reviewers for their comments and suggestions that improved the earlier version of this manuscript.
Conflict of interest
Author MG was employed by PetroChina.
The remaining authors declare that the research was conducted in the absence of any commercial or financial relationships that could be construed as a potential conflict of interest.
Generative AI statement
The author(s) declare that no Generative AI was used in the creation of this manuscript.
Publisher’s note
All claims expressed in this article are solely those of the authors and do not necessarily represent those of their affiliated organizations, or those of the publisher, the editors and the reviewers. Any product that may be evaluated in this article, or claim that may be made by its manufacturer, is not guaranteed or endorsed by the publisher.
Supplementary material
The Supplementary Material for this article can be found online at: https://www.frontiersin.org/articles/10.3389/feart.2025.1507500/full#supplementary-material
References
Abels, H. A., Clyde, W. C., Gingerich, P. D., Hilgen, F. J., Fricke, H. C., Bowen, G. J., et al. (2012). Terrestrial carbon isotope excursions and biotic change during Palaeogene hyperthermals. Nat. Geosci. 5, 326–329. doi:10.1038/ngeo1427
Abels, H. A., van Yperen, A. E., Zachos, J. C., Lourens, L. J., Gingerich, P. D., Bowen, G. J., et al. (2016). Environmental impact and magnitude of paleosol carbonate carbon isotope excursions marking five early Eocene hyperthermals in the Bighorn Basin, Wyoming. Clim. Past 12, 1151–1163. doi:10.5194/cp−12−1151−2016
Adams, J. S., Kraus, M. J., and Wing, S. L. (2011). Evaluating the use of weathering indices for determining mean annual precipitation in the ancient stratigraphic record. Palaeogeogr. Palaeoclimatol. Palaeoecol. 309, 358–366. doi:10.1016/j.palaeo.2011.07.004
Baczynski, A. A., McInerney, F. A., Wing, S. L., Kraus, M. J., Bloch, J. I., Boyer, D. M., et al. (2013). Chemostratigraphic implications of spatial variation in the paleocene-eocene thermal maximum carbon isotope excursion, SE Bighorn Basin, Wyoming. Geochem. Geophys. Geosystems 14 (10), 4133–4152. doi:10.1002/ggge.20265
Baczynski, A. A., McInerney, F. A., Wing, S. L., Kraus, M. J., Morse, P. E., Bloch, J. I., et al. (2016). Distortion of carbon isotope excursion in bulk soil organic matter during the Paleocene−Eocene thermal maximum. Geol. Soc. Am. Bull. 128, 1352–1366. doi:10.1130/b31389.1
Badía−Villas, D., and del Moral, F. (2016). Soils of the arid areas. Soils Spain, 145–161. doi:10.1007/978−3−319−20541−0_4
Bowen, G. J., and Beerling, D. J. (2004). An integrated model for soil organic carbon and CO2: implications for paleosol carbonate pCO2 paleobarometry. Glob. Biogeochem. Cycles 18. doi:10.1029/2003gb002117
Bowen, G. J., and Bowen, B. B. (2008). Mechanisms of PETM global change constrained by a new record from central Utah. Geology 36, 379–382. doi:10.1130/g24597a.1
Bowen, G. J., Koch, P. L., Gingerich, P. D., Norris, R. D., Bains, S., and Corfield, R. M. (2001). Refined isotope stratigraphy across the continental paleocene−eocene boundary on polecat bench in the northern Bighorn Basin: paleocene−eocene stratigraphy and biotic change in the Bighorn and clarks fork basins, 33. Wyoming: University of Michigan Papers on Paleontology, 73–88.
Breecker, D. (2013). Quantifying and understanding the uncertainty of atmospheric CO2 concentrations determined from calcic paleosols. Geochem. Geophys. Geosystems 14, 3210–3220. doi:10.1002/ggge.20189
Breecker, D., Sharp, Z., and McFadden, L. D. (2009). Seasonal bias in the formation and stable isotopic composition of pedogenic carbonate in modern soils from central New Mexico, USA. Geol. Soc. Am. Bull. 121, 630–640. doi:10.1130/b26413.1
Breecker, D. O., Sharp, Z. D., and McFadden, L. D. (2010). Atmospheric CO2 concentrations during ancient greenhouse climates were similar to those predicted for AD 2100. Proc. Natl. Acad. Sci. 107 (2), 576–580. doi:10.1073/pnas.0902323106
Caldeira, K. (1992). Enhanced Cenozoic chemical weathering and the subduction of pelagic carbonate. Nature 357 (6379), 578–581. doi:10.1038/357578a0
Carmichael, M. J., Inglis, G. N., Badger, M. P., Naafs, B. D. A., Behrooz, L., Remmelzwaal, S., et al. (2017). Hydrological and associated biogeochemical consequences of rapid global warming during the Paleocene−Eocene Thermal Maximum. Glob. Planet. Change 157, 114–138. doi:10.1016/j.gloplacha.2017.07.014
Carmichael, M. J., Pancost, R. D., and Lunt, D. J. (2018). Changes in the occurrence of extreme precipitation events at the Paleocene−Eocene thermal maximum. Earth Planet. Sci. Lett. 501, 24–36. doi:10.1016/j.epsl.2018.08.005
Cerling, T. E. (1992). Use of carbon isotopes in paleosols as an indicator of the P (CO2) of the paleoatmosphere. Glob. Biogeochem. Cycles 6, 307–314. doi:10.1029/92gb01102
Cerling, T. E., and Harris, J. M. (1999). Carbon isotope fractionation between diet and bioapatite in ungulate mammals and implications for ecological and paleoecological studies. Oecologia 120, 347–363. doi:10.1007/s004420050868
Cerling, T. E., and Quade, J. (1993). Stable carbon and oxygen isotopes in soil carbonates. Clim. Change Cont. Isotopic Rec., 217–231. doi:10.1029/gm078p0217
Clyde, W. C., Zonneveld, J., Stamatakos, J., Gunnell, G. F., and Bartels, W. S. (1997). Magnetostratigraphy across the Wasatchian/Bridgerian NALMA boundary (early to middle Eocene) in the western Green River basin, Wyoming. J. Geol. 105, 657–670. doi:10.1086/515970
Cramer, B. S., Wright, J. D., Kent, D. V., and Aubry, M. (2003). Orbital climate forcing of δ13C excursions in the late Paleocene–early Eocene (chrons C24n–C25n). Paleoceanography 18. doi:10.1029/2003pa000909
Cramwinckel, M. J., Burls, N. J., Fahad, A. A., Knapp, S., West, C. K., Reichgelt, T., et al. (2023). Global and zonal-mean hydrological response to early Eocene warmth. Paleoceanogr. Paleoclimatology 38 (6), e2022PA004542. doi:10.1029/2022pa004542
Daniels, W. L., and Haering, K. C. (2006). Concepts of basic soil science. The MidAtlantic nutrient management handbook, 31.
DeCelles, P. G. (2004). Late Jurassic to Eocene evolution of the Cordilleran thrust belt and foreland basin system, western USA. Am. J. Sci. 304, 105–168. doi:10.2475/ajs.304.2.105
Dickens, G. R. (2003). A methane trigger for rapid warming? Science 299, 10171017. doi:10.1126/science.1080789
Dickinson, W. R., Klute, M. A., Hayes, M. J., Janecke, S. U., Lundin, E. R., McKITTRICK, M. A., et al. (1988). Paleogeographic and paleotectonic setting of Laramide sedimentary basins in the central Rocky Mountain region. Geol. Soc. Am. Bull. 100, 1023–1039. doi:10.1130/0016−7606(1988)100<1023:papsol>2.3.co;2
Driese, S. G., Nordt, L. C., Lynn, W. C., Stiles, C. A., Mora, C. I., and Wilding, L. P. (2005). Distinguishing climate in the soil record using chemical trends in a Vertisol climosequence from the Texas Coast Prairie, and application to interpreting Paleozoic paleosols in the Appalachian Basin, USA. J. Sediment. Res. 75, 339–349. doi:10.2110/jsr.2005.027
Elidrissi, S., Daoudi, L., and Fagel, N. (2018). Palygorskite occurrences and genesis in calcisol and groundwater carbonates of the Tensift Al Haouz area, Central Morocco. Geoderma 316, 78–88. doi:10.1016/j.geoderma.2017.12.013
Fan, M., DeCelles, P. G., Gehrels, G. E., Dettman, D. L., Quade, J., and Peyton, S. L. (2011). Sedimentology, detrital zircon geochronology, and stable isotope geochemistry of the lower Eocene strata in the Wind River Basin, central Wyoming. Geol. Soc. Am. Bull. 123, 979–996. doi:10.1130/b30235.1
Gao, M., and Fan, M. (2018). Depositional environment, sediment provenance and oxygen isotope paleoaltimetry of the early Paleogene greater Green River Basin, southwestern Wyoming, USA. Am. J. Sci. 318 (10), 1018–1055. doi:10.2475/10.2018.02
Gao, M., Fan, M., and Moucha, R. (2016). Southwestward weakening of Wyoming lithosphere during the Laramide orogeny. J. Geophys. Res. Solid Earth 121, 6219–6234. doi:10.1002/2016jb013130
Guo, Z., Wilson, M., Dingwell, D. B., and Liu, J. (2021). India−Asia collision as a driver of atmospheric CO2 in the Cenozoic. Nat. Commun. 12 (1), 3891. doi:10.1038/s41467−021−23772−y
Hollis, C. J., Dunkley Jones, T., Anagnostou, E., Bijl, P. K., Cramwinckel, M. J., Cui, Y., et al. (2019). The DeepMIP contribution to PMIP4: methodologies for selection, compilation and analysis of latest Paleocene and early Eocene climate proxy data, incorporating version 0.1 of the DeepMIP database. Geosci. Model Dev. 12 (7), 3149–3206. doi:10.5194/gmd−12−3149−2019
Honey, J. (1988). A mammalian fauna from the base of the Eocene cathedral Bluffs Tongue of the Wasatch Formation: cottonwood Creek area, southeast Wasatch basin, 1669. Wyoming: US Geological Survey Bulletin C, 1–13.
Hough, B. G., Fan, M., and Passey, B. H. (2014). Calibration of the clumped isotope geothermometer in soil carbonate in Wyoming and Nebraska, USA: implications for paleoelevation and paleoclimate reconstruction. Earth Planet. Sci. Lett. 391, 110–120. doi:10.1016/j.epsl.2014.01.008
Hren, M. T., Pagani, M., Erwin, D. M., and Brandon, M. (2010). Biomarker reconstruction of the early Eocene paleotopography and paleoclimate of the northern Sierra Nevada. Geology 38, 7–10. doi:10.1130/g30215.1
Hyland, E., Sheldon, N. D., and Fan, M. (2013). Terrestrial paleoenvironmental reconstructions indicate transient peak warming during the early Eocene climatic optimum. Geol. Soc. Am. Bull. 125, 1338–1348. doi:10.1130/b30761.1
Kennett, J., and Stott, L. (1991). Abrupt deep sea warming, paleoceanographic changes and benthic extinctions at the end of the Paleocene.
Kent, D. V., and Muttoni, G. (2008). Equatorial convergence of India and early Cenozoic climate trends. Proc. Natl. Acad. Sci. U. S. A. 105, 16065–16070. doi:10.1073/pnas.0805382105
Koch, P. L., Clyde, W. C., Hepple, R. P., Fogel, M. L., Wing, S. L., and Zachos, J. C. (2003). “Carbon and oxygen isotope records from paleosols spanning the Paleocene−Eocene boundary, Bighorn Basin, Wyoming,” in Causes and Consequences of Globally Warm Climates in the Early Paleogene. Editor S. L. Wing, P. D. Gingerich, B. Schmitz, and E. Thomas (Boulder, Colorado: Geological Society of America Special Paper), 49–64. doi:10.1130/0-8137-2369-8.49
Koch, P. L., Zachos, J. C., and Dettman, D. L. (1995). Stable isotope stratigraphy and paleoclimatology of the Paleogene Bighorn Basin (Wyoming, USA). Palaeogeogr. Palaeoclimatol. Palaeoecol. 115, 61–89. doi:10.1016/0031−0182(94)00107−j
Kraus, M. J. (1999). Paleosols in clastic sedimentary rocks: their geologic applications. Earth−Science Rev. 47 (1−2), 41–70. doi:10.1016/s0012−8252(99)00026−4
Kraus, M. J., McInerney, F. A., Wing, S. L., Secord, R., Baczynski, A. A., and Bloch, J. I. (2013). Paleohydrologic response to continental warming during the paleocene–eocene thermal maximum, Bighorn Basin, Wyoming. Palaeogeogr. Palaeoclimatol. Palaeoecol. 370, 196–208. doi:10.1016/j.palaeo.2012.12.008
Lourens, L. J., Sluijs, A., Kroon, D., Zachos, J. C., Thomas, E., Röhl, U., et al. (2005). Astronomical pacing of late Palaeocene to early Eocene global warming events. Nature 435, 1083–1087. doi:10.1038/nature03814
Machlus, M., Hemming, S. R., Olsen, P. E., and Christie−Blick, N. (2004). Eocene calibration of geomagnetic polarity time scale reevaluated: evidence from the Green River Formation of Wyoming. Geology 32, 137–140. doi:10.1130/g20091.1
Mack, G. H., James, W. C., and Monger, H. C. (1993). Classification of paleosols. Geol. Soc. Am. Bull. 105, 129–136. doi:10.1130/0016−7606(1993)105<0129:cop>2.3.co;2
Magioncalda, R., Dupuis, C., Blamart, D., Fairon−Demaret, M., Perreau, M., Renard, M., et al. (2001). L'excursion isotopique du carbone organique (delta 13Corg) dans les paleoenvironnements continentaux de l'intervalle Paleocene/Eocene de Varangeville (Haute−Normandie). Bull. Sociéte géologique Fr. 172 (3), 349–358. doi:10.2113/172.3.349
Mauger, R. L. (1977). K−Ar ages of biotites from tuffs in Eocene rocks of the Green River, Washakie, and Uinta basins, Utah, Wyoming, and Colorado. Rocky Mt. Geol. 15, 17–41.
McInerney, F. A., and Wing, S. L. (2011). The Paleocene−Eocene Thermal Maximum: a perturbation of carbon cycle, climate, and biosphere with implications for the future. Annu. Rev. Earth Planet. Sci. 39, 489–516. doi:10.1146/annurev−earth−040610−133431
McLennan, S. M. (1993). Weathering and global denudation. J. Geol. 101 (2), 295–303. doi:10.1086/648222
Nettleton, W., Olson, C., and Wysocki, D. A. (2000). Paleosol classification: problems and solutions. Catena 41, 61–92. doi:10.1016/s0341−8162(00)00109−0
Pagani, M., Caldeira, K., Archer, D., and Zachos, J. C. (2006). An ancient carbon mystery. Science−New York then Washingt−. 314, 1556–1557. doi:10.1126/science.1136110
Passey, B. H., Levin, N. E., Cerling, T. E., Brown, F. H., and Eiler, J. M. (2010). Hightemperature environments of human evolution in East Africa based on bond ordering in paleosol carbonates. Proc. Natl. Acad. Sci. U. S. A. 107, 11245–11249. doi:10.1073/pnas.1001824107
Pierrehumbert, R. T. (2002). The hydrologic cycle in deep−time climate problems. Nature 419 (6903), 191–198. doi:10.1038/nature01088
Quade, J., Eiler, J., Daeron, M., and Achyuthan, H. (2013). The clumped isotope geothermometer in soil and paleosol carbonate. Geochimica Cosmochimica Acta 105, 92–107. doi:10.1016/j.gca.2012.11.031
Retallack, G. J. (2009). Greenhouse crises of the past 300 million years. Geol. Soc. Am. Bull. 121, 1441–1455. doi:10.1130/b26341.1
Rigby, J. K. (1980). Swain quarry of the Fort Union Formation, middle Paleocene (torrejonian), carbon county, Wyoming, geologic setting and mammalian fauna. Evolutionary Monographs, University of Chicago.
Rind, D. (1998). Latitudinal temperature gradients and climate change. J. Geophys. Res. Atmos. 103, 5943–5971. doi:10.1029/97jd03649
Robert, C., and Kennett, J. P. (1994). Antarctic subtropical humid episode at the Paleocene−Eocene boundary: clay−mineral evidence. Geology 22, 211. doi:10.1130/0091−7613(1994)022<0211:asheat>2.3.co;2
Roehler, H. W. (1992). in Greater Green River Basin, Wyoming, Utah, and Colorado.Correlation, composition, areal distribution, and thickness of Eocene stratigraphic units.
Roehler, H. W., and Martin, P. (1987). Geological investigations of the vermillion Creek coal bed in the Eocene Niland Tongue of the Wasatch Formation. Wyoming: Sweetwater County.
Röhl, U., Bralower, T., Norris, R., and Wefer, G. (2000). New chronology for the late Paleocene thermal maximum and its environmental implications. Geology 28, 927–930. doi:10.1130/0091−7613(2000)28<927:ncftlp>2.0.co;2
Röhl, U., Westerhold, T., Bralower, T. J., and Zachos, J. C. (2007). On the duration of the Paleocene−Eocene thermal maximum (PETM). Geochem. Geophys. Geosystems 8. doi:10.1029/2007gc001784
Romanek, C. S., Grossman, E. L., and Morse, J. W. (1992). Carbon isotopic fractionation in synthetic aragonite and calcite: effects of temperature and precipitation rate. Geochimica Cosmochimica Acta 56, 419–430. doi:10.1016/0016−7037(92)90142−6
Rush, W. D., Kiehl, J. T., Shields, C. A., and Zachos, J. C. (2021). Increased frequency of extreme precipitation events in the North Atlantic during the PETM: observations and theory. Palaeogeogr. Palaeoclimatol. Palaeoecol. 568, 110289. doi:10.1016/j.palaeo.2021.110289
Sauer, P. E., Eglington, T. I., Hayes, J. M., Schimmelman, A., and Sessions, A. L. (2001). Compound−specific D/H ratios of lipid biomarkers from sediments as a proxy for environmental and climatic conditions. Geochimica Cosmochimica Acta 65 (2), 213–222. doi:10.1016/s0016−7037(00)00520−2
Schmitz, B., and Andreasson, F. P. (2001). Air humidity and lake δ18O during the latest Paleocene–earliest Eocene in France from recent and fossil fresh−water and marine gastropod δ18O, δ13C, and 87Sr/86Sr. Geol. Soc. Am. Bull. 113, 774–789. doi:10.1130/0016−7606(2001)113<0774:ahalod>2.0.co;2
Schmitz, B., and Pujalte, V. (2003). Sea−level, humidity, and land−erosion records across the initial Eocene thermal maximum from a continental−marine transect in northern Spain. Geology 31, 689–692. doi:10.1130/g19527.1
Schneider−Mor, A., and Bowen, G. J. (2013). Coupled and decoupled responses of continental and marine organic−sedimentary systems through the PaleoceneEocene thermal maximum, New Jersey margin, USA. Paleoceanography 28, 105–115. doi:10.1002/palo.20016
Secord, R., Bloch, J. I., Chester, S. G., Boyer, D. M., Wood, A. R., Wing, S. L., et al. (2012). Evolution of the earliest horses driven by climate change in the Paleocene−Eocene Thermal Maximum. Sci. (New York, N.Y.) 335, 959–962. doi:10.1126/science.1213859
Sessions, A. L. (2001). “Hydrogen isotope ratios of individual organic compounds,” in (Doctoal dissertation) (Bloomington, IN: Indiana University), 149.
Sewall, J. O., and Sloan, L. C. (2006). Come a little bit closer: a high−resolution climate study of the early Paleogene Laramide foreland. Geology 34, 81–84. doi:10.1130/g22177.1
Sexton, P. F., Norris, R. D., Wilson, P. A., Pälike, H., Westerhold, T., Röhl, U., et al. (2011). Eocene global warming events driven by ventilation of oceanic dissolved organic carbon. Nature 471, 349–352. doi:10.1038/nature09826
Sheldon, N. D., Retallack, G. J., and Tanaka, S. (2002). Geochemical climofunctions from North American soils and application to paleosols across the Eocene Oligocene boundary in Oregon. J. Geol. 110, 687–696. doi:10.1086/342865
Sheldon, N. D., and Tabor, N. J. (2009). Quantitative paleoenvironmental and paleoclimatic reconstruction using paleosols. Earth−Science Rev. 95, 1–52. doi:10.1016/j.earscirev.2009.03.004
Shellito, C. J., Sloan, L. C., and Huber, M. (2003). Climate model sensitivity to atmospheric CO2 levels in the Early–Middle Paleogene. Palaeogeogr. Palaeoclimatol. Palaeoecol. 193 (1), 113–123. doi:10.1016/s0031−0182(02)00718−6
Shuster, M. W., and Steidtmann, J. R. (1988). Tectonic and sedimentary evolution of the northern Green River basin, western Wyoming. Geol. Soc. Am. Memoirs 171, 515–530. doi:10.1130/mem171−p515
Sinha, A., and Stott, L. D. (1994). New atmospheric pCO2 estimates from palesols during the late Paleocene/early Eocene global warming interval. Glob. Planet. Change 9, 297–307. doi:10.1016/0921−8181(94)00010−7
Sloan, L. C., Huber, M., and Ewing, A. (1999). “Polar stratospheric cloud forcing in a greenhouse world,” in Reconstructing Ocean history (Springer), 273–293.
Sloan, L. C., and Rea, D. K. (1996). Atmospheric carbon dioxide and early Eocene climate: a general circulation modeling sensitivity study. Palaeogeogr. Palaeoclimatol. Palaeoecol. 119 (3−4), 275–292. doi:10.1016/0031−0182(95)00012−7
Sloan, L. C., Walker, J. C., Moore, T., Rea, D. K., and Zachos, J. C. (1992). Possible methane−induced polar warming in the early Eocene. Nature 357, 320–322. doi:10.1038/357320a0
Sluijs, A., Schouten, S., Donders, T. H., Schoon, P. L., Röhl, U., Reichart, G., et al. (2009). Warm and wet conditions in the arctic region during Eocene thermal maximum 2. Nat. Geosci. 2, 777–780. doi:10.1038/ngeo668
Smith, F. A., and Freeman, K. H. (2006). Influence of physiology and climate on δD of leaf wax n−alkanes from C3 and C4 grasses. Geochimica Cosmochimica Acta 70, 1172–1187. doi:10.1016/j.gca.2005.11.006
Snell, K. E., Thrasher, B. L., Eiler, J. M., Koch, P. L., Sloan, L. C., and Tabor, N. J. (2013). Hot summers in the Bighorn Basin during the early Paleogene. Geology 41, 55–58. doi:10.1130/g33567.1
Soil Survey Staff (1975). Soil taxonomy: a basic system of soil classification for making and interpreting soil surveys. Washington, D.C: U.S. Department of Agriculture, Soil Conservation Service.
Stott, L. D., Sinha, A., Thiry, M., Aubry, M. P., and Berggren, W. A. (1996). Global δ13C changes across the Paleocene−Eocene boundary: criteria for terrestrial−marine correlations. Geol. Soc. 101 (1), 381–399. doi:10.1144/gsl.sp.1996.101.01.19
Svensen, H., Planke, S., Malthe−Sørenssen, A., Jamtveit, B., Myklebust, R., Eidem, T. R., et al. (2004). Release of methane from a volcanic basin as a mechanism for initial Eocene global warming. Nature 429, 542–545. doi:10.1038/nature02566
Tauxe, L., Gee, J., Gallet, Y., Pick, T., and Bowen, T. (1994). Magnetostratigraphy of the willwood formation, Bighorn Basin, Wyoming: new constraints on the location of paleocene/eocene boundary. Earth Planet. Sci. Lett. 125, 159–172. doi:10.1016/0012−821x(94)90213−5
The Cenozoic CO2 Proxy Integration Project (CenCO2PIP) Consortium, Hönisch, B., Royer, D. L., Breecker, D. O., Polissar, P. J., Bowen, G. J., Henehan, M. J., et al. (2023). Toward a Cenozoic history of atmospheric CO2. Science 382, eadi5177. doi:10.1126/science.adi5177
Tipple, B. J., Meyers, S. R., and Pagani, M. (2010). Carbon isotope ratio of Cenozoic CO2: a comparative evaluation of available geochemical proxies. Paleoceanography 25. doi:10.1029/2009pa001851
Torn, M. S., Lapenis, A. G., Timofeev, A., Fischer, M. L., Babikov, B. V., and Harden, J. W. (2002). Organic carbon and carbon isotopes in modern and 100−year−oldsoil archives of the Russian steppe. Glob. Change Biol. 8, 941–953. doi:10.1046/j.1365−2486.2002.00477.x
Tripati, A., and Elderfield, H. (2005). Deep−sea temperature and circulation changes at the paleocene−eocene thermal maximum. Sci. (New York, N.Y.) 308, 1894–1898. doi:10.1126/science.1109202
Wing, S. L., Harrington, G. J., Smith, F. A., Bloch, J. I., Boyer, D. M., and Freeman, K. H. (2005). Transient floral change and rapid global warming at the Paleocene−Eocene boundary. Science 310 (5750), 993–996. doi:10.1126/science.1116913
Winguth, A., Shellito, C., Shields, C., and Winguth, C. (2010). Climate response at the paleocene–eocene thermal maximum to greenhouse gas forcing—a model study with CCSM3. J. Clim. 23, 2562–2584. doi:10.1175/2009jcli3113.1
Woodburne, M. O. (2004). Late cretaceous and cenozoic mammals of north America: biostratigraphy and geochronology. Columbia University Press.
Wynn, J. G., and Bird, M. I. (2007). C4−derived soil organic carbon decomposes faster than its C3 counterpart in mixed C3/C4 soils. Glob. Change Biol. 13, 2206–2217. doi:10.1111/j.1365−2486.2007.01435.x
Wynn, J. G., Bird, M. I., and Wong, V. N. (2005). Rayleigh distillation and the depth profile of 13C/12C ratios of soil organic carbon from soils of disparate texture in Iron Range National Park, Far North Queensland, Australia. Geochimica Cosmochimica Acta 69, 1961–1973. doi:10.1016/j.gca.2004.09.003
Zachos, J., Pagani, M., Sloan, L., Thomas, E., and Billups, K. (2001). Trends, rhythms, and aberrations in global climate 65 Ma to present. Sci. (New York, N.Y.) 292, 686–693. doi:10.1126/science.1059412
Zachos, J. C., Dickens, G. R., and Zeebe, R. E. (2008). An early Cenozoic perspective on greenhouse warming and carbon−cycle dynamics. Nature 451, 279–283. doi:10.1038/nature06588
Zachos, J. C., McCarren, H., Murphy, B., Röhl, U., and Westerhold, T. (2010). Tempo and scale of late Paleocene and early Eocene carbon isotope cycles: implications for the origin of hyperthermals. Earth Planet. Sci. Lett. 299, 242–249. doi:10.1016/j.epsl.2010.09.004
Keywords: carbon isotope, leaf wax n-alkanes, paleosol, precipitation, pCO2, Paleocene-Eocene Thermal Maximum
Citation: Gao M, Fan M, Zhuang G and Chiarella D (2025) Continental hydroclimate during the late Paleocene-early Eocene in the central Rockies: insights from sedimentological and geochemical records preserved in the greater Green River Basin, southwestern Wyoming, U.S.A.. Front. Earth Sci. 13:1507500. doi: 10.3389/feart.2025.1507500
Received: 08 October 2024; Accepted: 06 March 2025;
Published: 22 July 2025.
Edited by:
Yifan Li, China University of Geosciences, ChinaReviewed by:
Youwei Wang, University of Virginia, United StatesYibo Yang, Chinese Academy of Sciences (CAS), China
Shun Li, Shanghai Jiao Tong University, China
Copyright © 2025 Gao, Fan, Zhuang and Chiarella. This is an open-access article distributed under the terms of the Creative Commons Attribution License (CC BY). The use, distribution or reproduction in other forums is permitted, provided the original author(s) and the copyright owner(s) are credited and that the original publication in this journal is cited, in accordance with accepted academic practice. No use, distribution or reproduction is permitted which does not comply with these terms.
*Correspondence: Min Gao, emhlbm5pZ2FvODlAZ21haWwuY29t
†Present address: Domenico Chiarella, Biological, Geological and Environmental Sciences Department, Alma Mater Studiorum University of Bologna, Bologna, Italy