 Alessandro Bonaccorso
 Luigi Carleo
 Gilda Currenti
 Antonino Sicali
- Istituto Nazionale di Geofisica e Vulcanologia, Osservatorio Etneo, Catania, Italy
Mount Etna is well known for its frequent lava fountains, or paroxysms, characterized by their intense explosive activity. Over the past decades, the Southeast Crater has been the most prolific, generating over a hundred events. More recently, three sequences of particularly powerful lava fountains were erupted from the Voragine Crater: four episodes between 3 and 5 December 2015, three between 18 and 21 May 2016, and six between 4 July and 15 August 2024. This intense eruptive activity, accompanied by significant ash dispersal and fallout, severely impacted the infrastructure and accessibility of eastern Sicily, causing disruptions to air services and the temporary closure of Catania’s international airport. In this study, we investigated these intriguing phenomena through the high-precision strain data recorded by Etna’s network of borehole dilatometers. We modelled and interpreted the source of these paroxysmal events, examining its position, the magnitude of its volumetric change during the paroxysms, and its relationship with the volcano’s plumbing system, thereby advancing our understanding of these dynamic processes.
1 Introduction
Lava fountains are a common eruption style of basaltic volcanism. They are generated by the rapid exsolution of volatiles from magma during its ascent along the shallow portion of the plumbing system (i.e., Wilson et al., 1995; Sparks, 2003). The resulting effect is a jet of gas and pyroclasts that rises vertically into an eruptive column up to several kilometers high, forming a low-level lava fountain (0–3 km) with fast ascent velocity (∼15 m s-1), and a higher convective plume reaching a height of several kilometers with lower ascent velocity and lateral transport driven by wind (i.e., Sparks et al., 1997; Calvari et al., 2018 and references therein). As reported in their classification paper, Bonadonna et al. (2016) underline that in recent years the lava fountains frequently observed at Etna usually have been characterized by eruption columns >2 km above the cone (Figure 1a) and so mostly fit in the violent Strombolian to sub-Plinian field of Walker (1973). The greatest number of observations and studies on such eruptions have been conducted at Kilauea (i.e., Head and Wilson, 1987; Wolfe et al., 1998; Heliker and Wright, 1991; Mangan et al., 2014; Namiki et al., 2021; Moyer and Sahagian, 2024 and reference therein) and Etna (i.e., Calvari et al., 2018; Calvari and Nunnari, 2024 and references thereinafter). In Iceland, several studies have been carried out on the activities of lava fountains produced in different eruptions such as that of Holuhraun during 2014–15 (Witt et al., 2018), Geldingadalir in 2021 (Eibl et al., 2023), and Fagradalsfjall in 2021 (Scott et al., 2023). Lava fountains can also occur through sequences comprising numerous events repeating over time, and this aspect further increases the critical impact on the population, human infrastructure, public health and air traffic (i.e., Andronico et al., 2008; Martin et al., 2009; Baxter, 2010; Horwell et al., 2017; Calvari et al., 2018). The Etna’s lava fountains, also called paroxysms due to their explosive power, are frequent and often cause problems and dangers for the infrastructure of the city of Catania and the villages around the volcano, and above all often disrupt air traffic (Calvari et al., 2018 and references thereinafter). The Etna summit cone is composed of four main craters: Voragine (VOR), the oldest and also named Central Crater, North East Crater (NEC), Bocca Nuova Crater (BNC), and South East Crater (SEC), namely, the youngest one formed in 1971 (Figure 1b). Over recent decades, the SEC was the most active and generated several sequences of lava fountain events. Since 2011, it has erupted more than 110 lava fountains of which 44 episodes took place from January 2011 to December 2013 and 68 episodes from 13 December 2020 to 1 December 2023 (i.e., Bonaccorso et al., 2013; Bonaccorso et al., 2021; Calvari and Nunnari, 2022; 2024). In the past, VOR mainly displayed single sporadic paroxysmal events rather than eruptive sequences, with previous powerful episodes occurring on 22 July 1998 (Aloisi et al., 2002; Bonaccorso, 2006) and 4 September 1999 (GPV - Global Volcanism Program, 1999; Harris and Neri, 2002; Calvari et al., 2002). Besides these two isolated episodes, more recently VOR generated three sequences of intense lava fountains: four episodes between 3 and 5 December 2015 (Aloisi et al., 2017; Bonaccorso and Calvari, 2017), three episodes between 18 and 21 May 2016, and six episodes between 4 July and 15 August 2024 (Calvari and Nunnari, 2024). This last sequence, due to the significant ash air-dispersal and fall-out, caused major problems to the infrastructures and disturbances within eastern Sicily, disruptions to air services and the temporary closure of the Catania international airport.
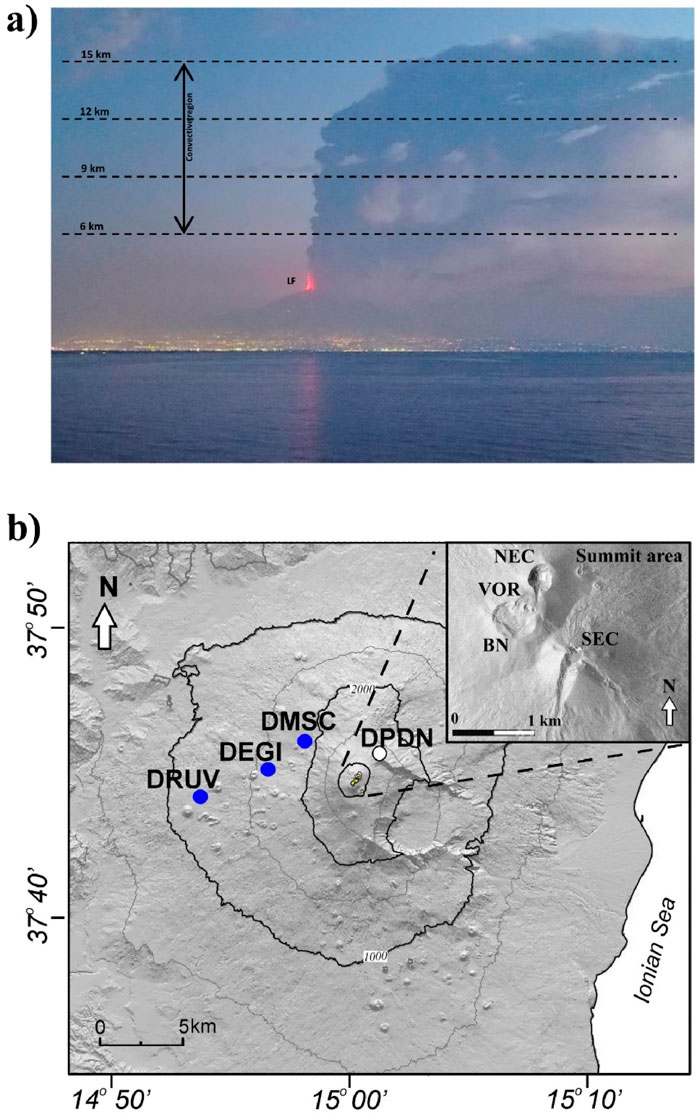
Figure 1. (a) Photo of the lava fountain from the South, taken early morning on 4 August 2024. (b) Etna borehole dilatometer network. The DPDN station was out of order in the period of this study. The inset shows the main summit craters: Voragine (VOR), Bocca Nuova (BN), NE crater (NEC) and SE crater (SEC).
Numerous multidisciplinary studies have been undertaken on the lava fountains generated by the SEC (a complete overview and full list of references can be found in Calvari et al., 2018; Calvari and Nunnari, 2022; Corsaro et al., 2024). Despite its explosive nature, a single lava fountain usually produces ultra-small volumetric deformation (<1 microstrain = 10−6 m3/m3) that is difficult to detect by GNSS (Global Navigation Satellite System) or InSAR (Interferometric Synthetic Aperture Radar) techniques. Instead, the borehole dilatometers provided valuable information thanks to the instruments’ high sensitivity (∼10−12, Roeloffs and Linde, 2007). Since 2011, these instruments have revealed strain changes accompanying the lava fountains. These changes allowed modelling the source that discharged the gas-magma mixture during the explosive activity (a detailed description and review of the results can be found in Bonaccorso et al., 2013; Bonaccorso et al., 2016; Bonaccorso et al., 2020; Bonaccorso et al., 2021). Moreover, recently, the strain changes also enabled better characterization of the lava fountains by identifying different clusters (Carleo et al., 2023) and inferring the total volumes erupted from this crater (Bonaccorso et al., 2023).
On the other hand, fewer studies have been made on the activity of lava fountains from the VOR, such as the episodes taking place on 22 July 1998 (Aloisi et al., 2002; Bonaccorso, 2006), 4 September 1999 (GPV - Global Volcanism Program, 1999; Calvari et al., 2002), the sequences of 3–5 December 2015 (Aloisi et al., 2022; Bonaccorso and Calvari, 2017; Cannata et al., 2018), and of 18–21 May 2016 (Edwards et al., 2018). Recently, the July-August 2024 sequence has been investigated by permanent thermal cam images to obtain insights into the evolution of its paroxysmal episodes (Calvari and Nunnari, 2024). However, for the paroxysmal activity of the VOR, an overall picture of these sequences of lava fountains is still incomplete. Above all, interpreting the source that generated these paroxysmal events, mainly in terms of position and dimension of its volumetric change during the paroxysms and its relation to the plumbing system, remains to better explore. In this study, we investigated these open issues through the high precision strain recorded by the borehole dilatometers network operating on Etna by addressing two main points: i) considering the observation time interval strictly related to the paroxysmal phase and ii) by using advanced numerical modelling.
In this work, first we introduce the characteristics of the borehole dilatometer network and its high data accuracy, and we present the data and the strain changes revealed by the dilatometers during the lava fountain sequences in December 2015 May 2016 and June-August 2024. Then, the strain changes are modelled using a numerical finite element method (FEM) to infer the source producing the lava fountains and investigate its mechanisms. Finally, in the discussion, we comment on the obtained results that providfe an improved picture of the intermediate-shallow plumbing system of Etna volcano.
2 Network
Sacks-Evertson dilatometers (Sacks et al., 1971) are borehole instruments that measure the volumetric deformation of the ground. They are usually installed in deep drilled holes (depths >100 m) to attenuate the environmental noise and detect strain changes mainly induced by volcanic and tectonic activity. Expansive cement is poured between the strainmeter and the walls of the hole to create close coupling between the sensor and the surrounding rock. Sacks-Evertson dilatometers are powerful instruments since they operate in a wide frequency band (10−7 – >20 Hz) and have the highest resolution (10−12) among geophysical sensors (Roeloffs and Linde, 2007). Thanks to these characteristics, borehole strainmeters are employed in many volcanic areas worldwide (e.g., Linde et al., 1993; Johnston et al., 2001; Voight et al., 2006; Bonaccorso et al., 2012; 2016; 2020).
At Etna, four Sacks-Evertson strainmeters have been installed over time (Figure 1b). The first installation was done in October–November 2011 when two sensors were installed at Mt. Ruvolo (DRUV) and Mt. Egitto (DEGI). The other two dilatometers (DPDN and DMSC) were installed in October-November 2014. In this work, we use the signals recorded by the DRUV, DEGI and DMSC stations as DPDN strainmeter was malfunctioning during the analyzed periods. These three strainmeters have different sensitivities to ground deformation because of the diverse mechanical properties of the surrounding rock and the rock-sensor couplings. Three calibration methods were used to estimate the in-situ sensor response (Bonaccorso et al., 2013; Bonaccorso et al., 2016; Currenti et al., 2017). The calibration showed that the DRUV strainmeter is the most sensitive, with a stable calibration factor over time of 0.005 nstrain/counts (Bonaccorso et al., 2016). DEGI and DMSC are less sensitive than DRUV. The DEGI strainmeter has a stable calibration factor over time of 0.1 nstrain/counts. In the period 2015-2016, the DMSC strainmeter showed a calibration factor of 0.2 nstrain/counts (Bonaccorso et al., 2016), which decreased in subsequent years up to 0.075 nstrain/counts (Bonaccorso et al., 2020) indicating an improvement of the rock-sensor coupling at the station. The signal recorded by the strainmeters is affected by rock deformation, largely due to Earth tides and barometric pressure variations which reduce the signals’ capacity to detect strain changes related to volcanic activity. However, we estimate that, at time scales of 3 h, which represents a typical duration of an Etna lava fountain, the noise of the strain signal recorded by the DRUV strainmeter is in the order of 10−9 (Carleo et al., 2022). At DEGI and DMSC stations, whose strainmeters are less sensitive than the DRUV one, we estimate a noise value of 10−8. During VOR lava fountains, the signals at all the stations recorded strain variations in the range of 10−6-10−7 (see Sect. 3), much larger than the estimated noise. We can therefore efficiently retrieve the strain amplitudes induced by VOR lava fountains from the recorded signals, preserving the precision of the recorded estimates at all the stations.
3 High precision strain recording during lava fountain sequences from VOR
After the two powerful single paroxysms of 22 July 1998 and 4 September 1999, VOR was in a quiescent state with regular degassing until the sudden activity of four powerful lava fountains that occurred unexpectedly in just 3 days between 3 and 5 December 2015. This sequence was investigated using images from cameras and strain data (Bonaccorso and Calvari, 2017). The most powerful event–with the shortest duration of one and a half hours–was the first (3 December) with a maximum height of the lava fountain above the rim of the VOR of 4.100 m. During this event, strain variations at dilatometer stations were also recorded (Figure 2 top-left). The following three other events decreased in power, as evidenced by the decreasing heights of the fountain and the amplitude of the strain (Bonaccorso and Calvari, 2017). In 2016, another short sequence of three consecutive events occurred between 18 and 21 May (Andronico et al., 2021). Also for this sequence the most powerful event, with associated larger strain variations, was the first one on 18 May with a duration of about 3 hours (Figure 2 top-middle), while the subsequent ones had decreasing amplitudes. After 8 years, a sequence of 6 events took place between 4 July and 14 August 2024 (Calvari and Nunnari, 2024). This sequence had a more complex evolution (Figure 2 bottom), characterized by a powerful first event with a prolonged duration of over 8 h, 3 subsequent events with decreasing amplitude and then a fifth event on 4 August lasting about 6 h and producing a lava fountain with a greater strain amplitude (Figure 2 top-right).
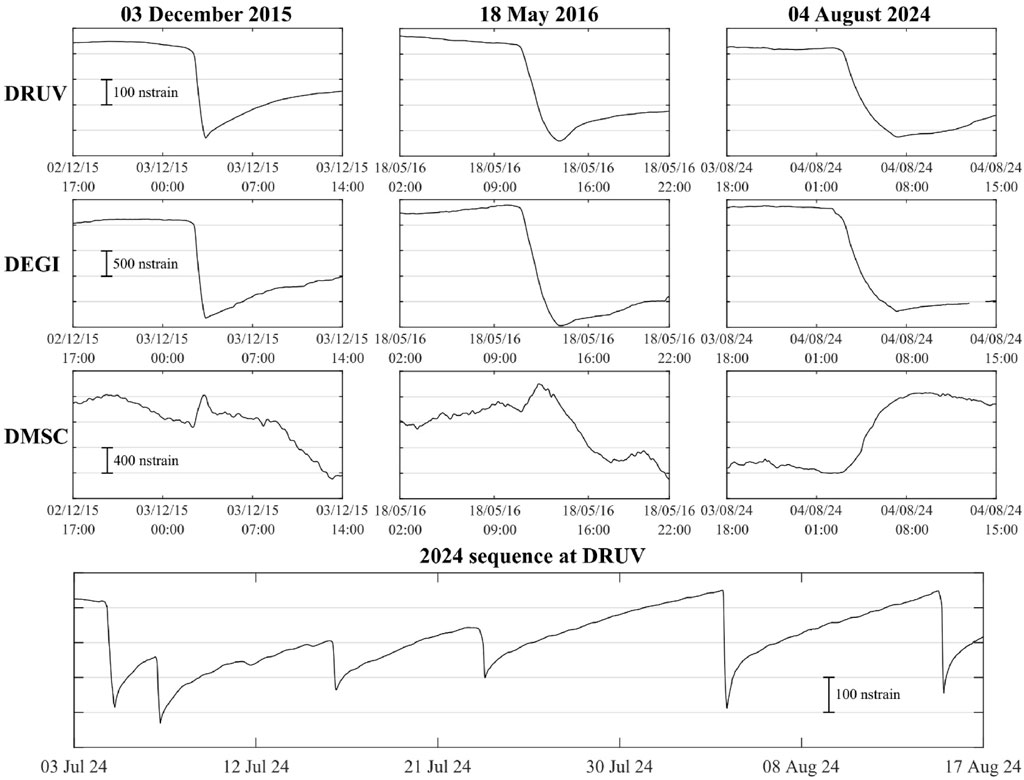
Figure 2. Top: Strain changes recorded at the three stations DRUV, DEGI and DMSC during the lava fountains of 3 December 2015 (left), 18 May 2016 (center), 4 August 2024 (right). A negative strain change corresponds to an expansion of the surrounding medium. Bottom: Strain recorded during the sequence of six lava fountain paroxysms from VOR in July-August 2024 at the DRUV station. For each eruptive event the dilatometer records a clear ultra-small change lasting from the start to the end of the eruption. The DRUV signal is filtered from the barometric and the tidal components (Carleo et al., 2022).
The three events of 3 December 2015, 18 May 2016, and 4 August 2024, namely, the most intense events in their respective sequences, have strain amplitude variations that show a high degree of similarity between the shape of each signal (Figure 2 top). Therefore, they can be associated with a similar source that fed the fountains from the VOR. These events were on average more intense than those emitted by the SEC in the 2011-2013 and 2021–2023 sequences. In particular, if we consider the DRUV station–the most precise and considered the reference one–the three largest events of the VOR sequences recorded an average variation of about 0.3 microstrain, about double the average value of the variations recorded during the SEC fountains (Bonaccorso et al., 2013; Bonaccorso et al., 2021).
4 Data modelling
The strain variations observed during the lava fountain events reflect the decompression associated with the magma release. The volcano edifice is affected by the decompression due to the emptying of the source that feeds the lava fountains, and the strainmeters are able to measure the associated deformation (Roeloffs and Linde, 2007; Bonaccorso et al., 2013). The pattern of the strain changes at the three dilatometer stations, both in sign and in amplitude, remains consistent across all events (Supplementary Figure S1; Supplementary Table S1), with clear step-like changes, positive at DMSC and negative at DRUV and DEGI (Figure 2 top). Also the ratio between the strain amplitudes at the stations is almost constant over time (Supplementary Figure S1). Given this recurring pattern and the similar dynamics of the eruptive events at the VOR, it is reasonable to conclude that the source of decompression has not changed position over time. As reported in Bonaccorso et al. (2020), at shallow depths the strain pattern for a decompression source is almost concentric going from contraction (positive strain dilatometer changes) in the centre to dilatation (negative strain dilatometer changes) toward the lower flank of the volcano. The transition from contraction to dilatation is mainly regulated by the source depth (Bonaccorso et al., 2020). The DEGI station, positioned about 6 km away from the VOR crater and on the mid flank, therefore provides important constraints on the source depth. Due to the limited number of available observations, we simplified the modelling to provide a first-order estimate of the source that may explain the observed strain changes. We computed the expected strain changes by simulating the contraction of a spheroidal magma chamber located at different depths. Finite element computations were performed to consider the topographic profile of the Etna western flank, which may influence the deformation (Currenti et al., 2008). A simple 2D axial symmetry model was used whose symmetry axis is centered at the VOR crater and whose profile runs from the summit toward the DRUV station (Bonaccorso et al., 2013; 2021). The domain is meshed into isoparametric and arbitrarily distorted triangular elements. Around the source, a finer mesh is built up, which then gradually increases going toward the external boundaries, where infinite mapped elements are used to force the displacement to vanish toward infinity and avoid numerical artifacts. Quadratic elements are used to warrant a good accuracy in the computations of the strain tensor, obtained as first spatial derivative of the displacement fields. From the simulation results it emerges that the source should lie at a depth between −500 and – 1,000 m below the sea level in order to explain the positive and negative strain changes recorded at DMSC and DEGI, respectively (Figure 3). Simulations were performed by varying the shape of the source from oblate to prolate spheroids. The results show that the source shape has a minor effect. However, prolate sources are preferred because they engender lower vertical displacements in accord with the absence of significant displacements from GNSS signals. The results in Figure 3 refer to the major events, i.e., 3 December 2015, 18 May 2016, and 4 August 2024 (Figure 2), but similar findings are obtained for the other events since the strain amplitudes scale linearly with the intensity of the source (Supplementary Figure S1).
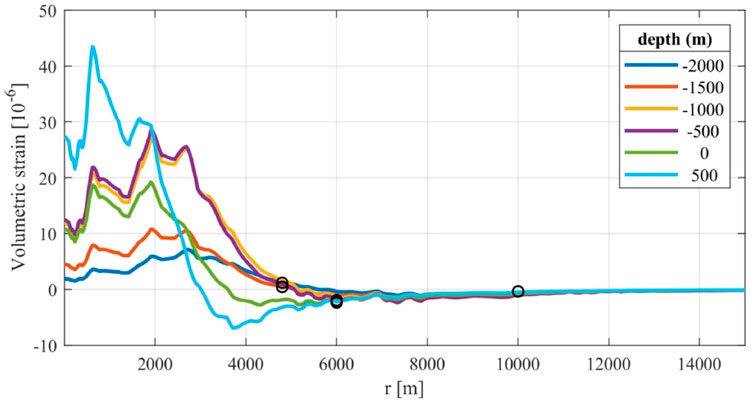
Figure 3. FEM modelled volumetric strain changes (colored lines) caused by a depressurizing prolate source positioned below the VOR, with a 0.5 aspect ratio and 4 × 10⁶ m3 volume change calculated for different depths of the source along a profile running westward from the summit crater area. Volumetric strain changes (black circles) observed at the dilatometer stations during the three main events at VOR are also reported (see Figure 2). The recorded strain changes are almost overlapping (Supplementary Table S1).
5 Discussion
5.1 Previous results on Etna’s intermediate-shallow plumbing system
On Etna, mid-term deformation from geodetic and satellite measurements in the periods (months to years) that preceded and accompanied the numerous major effusive flank eruptions were interpreted as a response to an intermediate storage at 4–8 km below the sea level (b.s.L.) in which magma can accumulate before the eruptions, deforming the volcanic edifice (e.g., Bonforte et al., 2008; Aloisi et al., 2011; Bonaccorso and Aloisi, 2021; Palano et al., 2024). The intermediate storage level found coincides approximately with the separation between the Hyblean carbonate platform and the upper flyshoid units of the Apennine chain (Lentini, 1982). In particular, Aloisi et al. (2018) noted that the mean centroid of the recharging/inflation sources is located at ∼ 6.5 km b.s.L, and the mean centroid of the discharging/deflation sources is located at ∼ 4.5 km b.s.L. Furthermore, Aloisi et al. (2018) highlighted that the position of these two different source positions are coincident with the depths of different levels of magmatic environments (Figure 4) as constrained by petrological analysis of olivine content (Cannata et al., 2018).
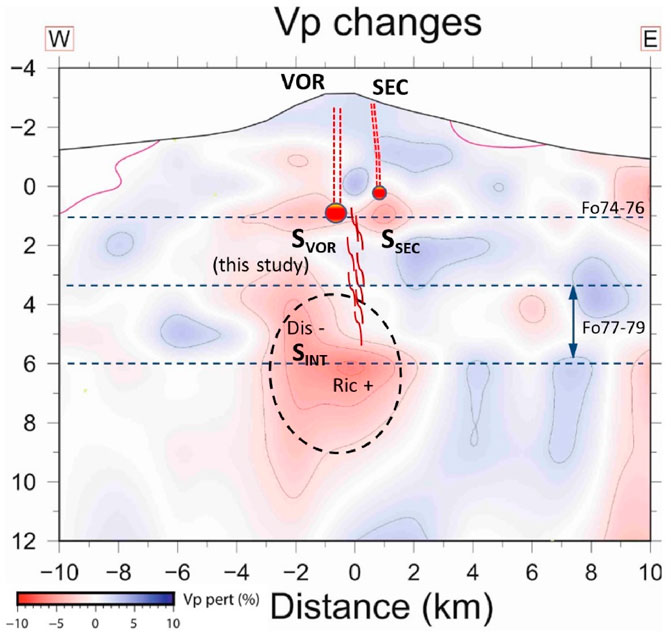
Figure 4. Sketch section of Etna’s plumbing system based on the Vp changes seismic tomography obtained by De Gori et al. (2021), where the pink colour indicates a significant reduction of seismic wave velocity related to the presence of new melt. The picture shows an intermediate storage zone (SINT) centred at – 6 km b.s.L., as inferred by the deformation sources modeled for the mid-long term recharging-discharging phases investigated in several previous studies. Inside the intermediate storage, Aloisi et al. (2018) noted that the zone comprising the sources of the recharging phases (Ric+) is deeper than the one of the eruptive discharging phases (Dis-). Two shallower storages have been inferred by strain changes for short-term lava fountain eruptions, in previous studies for SEC activity (SSEC) and in this study for VOR activity (SVOR). Levels of different kinds of olivine types are also reported (Giuffrida et al., 2023).
Since 2011, Etna has shown a more explosive eruptive style characterized by lava fountain sequences emitted from the summit craters. The strain changes recorded during the SEC lava fountain events indicated the response to a decompression of the volcano edifice due to the magma release and emptying of the source during these explosive events. The depressurizing source was inferred approximately at sea level below the SEC. This depth level fits the structural discontinuity between the Apennine-Maghrebian chain and the volcanic edifice positioned at about sea level (Monaco et al., 2011).
At Etna, the geochemistry of volcanic gases measured during lava fountains from remote sensing spectroscopy (Allard et al., 2005) supports the interpretation that the lava fountains are driven by the separate ascent of a gas layer previously accumulated at shallow depth. This scenario concurs with the “foam collapse” model of Jaupart and Vergniolle (1988), Jaupart and Vergniolle (1989), who consider the lava fountains as generated by the ascent of magma forming a bubble foam layer that remains trapped in a shallow portion of the plumbing system and whose final collapse generates the explosive phase. Therefore, this shallower source represents a sort of accumulation/discharge valve through which the magma, previously resident in the intermediate storage, is released and re-balanced through violent episodes of lava fountains (Bonaccorso et al., 2013). This picture fits with the seismic tomography (De Gori et al., 2021) that revealed two seismic anomalies in the plumbing system at approximately 6/4 km b.s.L. and 1/0 km b.s.L., respectively.
GNSS measurements do not detect the micro-deformation induced by single lava fountains. However, it is interesting to note that GNSS is able to detect the cumulative effect over time on multiple events, such as in the first phase of February–March 2021 sequence, when 17 lava fountain episodes (Bruno et al., 2022) occurred. In the case of a progressive and cumulative effect, these measurements are able to record a deflation that extends over the entire volcano with a depressurization centroid of approximately 2 km b.s.L., deeper than that constrained for the single lava fountain episode. To reconcile these two results, it can be deduced that the single valve-source action event generating the lava fountain has a centroid with depth at about sea level, while the effect of multiple closely spaced events, which cumulatively decompresses even the deeper plumbing system, results in a lowering of the depressurizing centroid. This interpretation is also supported by the strain variations during the lava fountain phase of February-March 2021 that showed a decrease in amplitudes over time, indicating a progressively lower efficiency of the eruptive source leading to the waning of the explosive sequence (Bonaccorso et al., 2021). In general, this is consistent with the ‘magma collection’ model proposed by Harris and Neri (2002), which considers the depressurization of a shallow reservoir as a possible mechanism of a paroxysmal sequence. This causes decreasing volumes erupted over time by the lava fountains, which are generated by the foam collapse at the reservoir roof. Here, an important aspect comes to light, namely, that the source feeding the fountain is constrained by the single paroxysmal event, while the accumulation of a sequence of events gradually contributes to a more extensive depressurization, i.e., involving a larger portion of the plumbing system, which is related to a deeper depressurization centroid.
5.2 Evidences of Etna’s shallow plumbing system from VOR activity
The VOR sequences of 3–5 December 2015, 18–21 May 2016 and June-August 2024, had fewer eruptive events spanning shorter time intervals than the SEC ones. Regarding the eruptive activity from the VOR crater, several questions have yet to be answered regarding the depth of the source and its volumetric decompression. Aloisi et al. (2017) considered the entire period comprising the four events of the December 2015 sequence and found a depressurization centroid at about 4.5 km b.s.L. Similar to what was discussed for the SEC eruptions, we believe that this greater depth of the source is determined by considering the cumulative effect of more eruptive events than that of the single one. In the case of 2015, the cumulative effect over time provides a more extensive final depressurization, which also involves the response and gradual re-equilibrium of the plumbing system, providing a deeper centroid than the source of the individual fountains. Also in this case, the interpretation is supported by the strain variations that during 3–5 December 2015 sequence showed an exponential decrease in amplitudes, indicating a progressive waning of the eruptive sequence (Bonaccorso et al., 2021).
With reference to the VOR source modelling, from the strain variations recorded during the event of 3 December 2015, Calvari et al. (2002) provided evidences that the decompression source has a greater depth, inferred at 3.3 km below the reference surface of the homogeneous half-space medium used in the application of the centre of pressure model (Mogi, 1958). Considering the reference surface at the mean altitude of the dilatometer stations of 1.5 km above sea level, the depth constrained by the simple analytical model for a single eruption of 3 December 2015 would be about 1.8 km b.s.L. However, the simple Mogi model does not take account of the topographic cover of the volcano and this tends to amplify the expected deformation, hence the modelling leads to a lowering of the source (for the comparison between simple analytical and numerical FEM models see Figure 3 in Bonaccorso et al., 2013). We used the FEM approach to overcome the limit of the simple analytical model of the depressurizing spherical source. For each of the three sequences of December 2015 May 2016 and July-August 2024, we focused on the event of greatest intensity. The three events show a good overlap, highlighting that the variations associated with the three cases come from the same source. This robust information allows modelling the source for the part strictly related to the paroxysmal phase. A source located below the VOR at a depth of about 1 km b.s.L. is able to generate the strain changes recorded during the single lava fountains ejected from this crater. This result matches the picture provided by the recent seismic tomography (De Gori et al., 2021). The time-repeated tomography showed evidence of fresh melts accumulated since 2019 in reservoirs located at different depths in the central feeding system (Figure 4). A broad volume with a strong Vp reduction, centred at 6 km b.s.L., coincides well with the intermediate storage inferred by geodetic measurements over the last decades (i.e., Bonforte et al., 2008; Bonaccorso and Aloisi, 2021). Moreover, a small volume with clear Vp reduction is centred beneath the summit craters at about 1 km b.s.L. indicating fresh melt storage in a shallower reservoir. This depth is in agreement with the superficial storage level indicated by the olivine component Fo74-76 for the period 2015–2022 during which both SEC and VOR erupted (Giuffrida et al., 2023). This shallower storage level, highlighted by the recent tomography, is W-E elongated spanning between the position of the VOR and the SEC.
6 Conclusion
The modelling of the strain changes during the VOR and the SEC lava fountains helps constraining shallow reservoirs located in the recently inferred seismic anomaly zone between 1 and 0 km b.s.L. (Figure 4). A picture of the Etna plumbing system therefore emerges in which there are two ponding zones: the well-known intermediate one where the largest storage is located and a shallower one, slightly elongated in the W-E direction, where the smaller storages are located, that rapidly empty and feed the lava fountains from the SEC and the VOR. The new results from the modelling of the data collected by the high precision strainmeters provide a picture that correlated well with the information coming from geodesy, seismic tomography and petrology. Our findings thus enrich the description of the shallower plumbing system and advance the knowledge of the eruptive dynamics involved in VOR lava fountains.
Data availability statement
The raw data supporting the conclusions of this article will be made available by the authors, without undue reservation.
Author contributions
AB: Writing – review and editing, Formal Analysis, Writing – original draft, Supervision, Conceptualization, Investigation, Funding acquisition. LC: Writing – review and editing, Writing – original draft, Visualization, Formal Analysis. GC: Investigation, Writing – original draft, Software, Writing – review and editing, Visualization, Formal Analysis. AS: Data curation, Writing – review and editing.
Funding
The author(s) declare that financial support was received for the research and/or publication of this article. The Etna borehole strainmeter network originally benefited from the financial support of the Italian FIRB project “Development of new technologies for the protection and defense of the territory from natural hazards” (acronym FUMO) and PON project “Development of research centers for the study of volcanic areas at high risk and their geothermal potential in the context of Mediterranean geological and environmental dynamic” (acronym VULCAMED). The dilatometers network received funding by the 2019–2021 Agreement between INGV and Italian Presidenza del Consiglio dei Ministri–Dipartimento della Protezione Civile (DPC), All. B2- WP2 -Task 9“Optimization of the acquisition of high-precision signals from the borehole strainmeters installed at Etna volcano”. This research also benefited from the EC H2020-FET OPEN project “SiC optical nano-strain-meters for pico-detection in Geosciences” (acronym: SiC nano for picoGeo) grant agreement n. 863220. LC is supported by the project “SiciliAn MicronanOTecH Research and innovation Center” (acronym: Samothrace) funded by NextGenerationEU under the National Recovery and Resilience Plan (NRRP) ECS_00000022. The English language of the text was revised by Stephen Conway, mother tongue consultant of INGV-OE.
Acknowledgments
We sincerely thank the colleagues of the Carnegie Institution of Washington, A. Linde and S. Sacks, who actively supported and coordinated the start of the dilatometer installations on Etna and contributed to the first fundamental studies. From the same Institution, we also thank M. Acierno and B. Schleigh who implemented the instrumentation and provided useful and precious assistance. We also thank Stephen Conway, English mother tongue consultant, for revising the English form of the manuscript.
Conflict of interest
The authors declare that the research was conducted in the absence of any commercial or financial relationships that could be construed as a potential conflict of interest.
Generative AI statement
The author(s) declare that no Generative AI was used in the creation of this manuscript.
Publisher’s note
All claims expressed in this article are solely those of the authors and do not necessarily represent those of their affiliated organizations, or those of the publisher, the editors and the reviewers. Any product that may be evaluated in this article, or claim that may be made by its manufacturer, is not guaranteed or endorsed by the publisher.
Supplementary material
The Supplementary Material for this article can be found online at: https://www.frontiersin.org/articles/10.3389/feart.2025.1606006/full#supplementary-material
References
Allard, P., Burton, M., and Murè, F. (2005). Spectroscopic evidence for a lava fountain driven by previously accumulated magmatic gas. Nature 433, 407–410. doi:10.1038/nature03246
Aloisi, M., Bonaccorso, A., Cannavò, F., and Currenti, G. M. (2018). Coupled short- and medium-term geophysical signals at Etna volcano: using deformation and strain to infer magmatic processes from 2009 to 2017. Front. Earth Sci. 6, 109. doi:10.3389/feart.2018.00109
Aloisi, M., D’Agostino, M., Dean, K. G., Mostaccio, A., and Neri, G. (2002). Satellite analysis and PUFF simulation of the eruptive cloud generated by the Mount Etna paroxysm of 22 July 1998. J. Geophys. Res. 107 (B12), 2373. doi:10.1029/2001JB000630
Aloisi, M., Gambino, S., Mattia, M., Ferlito, C., and Rossi, M. (2022). The most intense deflation of the last two decades at Mt. Etna: the 2019– 2021 evolution of ground deformation and modeled pressure sources. Geophys. Res. Lett. 49, e2021GL095195. doi:10.1029/2021GL095195
Aloisi, M., Jin, S., and Pulvirenti, F. S. A. (2017). The December 2015 Mount Etna eruption: an analysis of inflation/deflation phases and faulting processes. J. Geodyn. 107, 34–45. doi:10.1016/j.jog.2017.03.003
Aloisi, M., Mattia, M., Ferlito, C., Palano, M., Bruno, V., and Cannavò, F. (2011). Imaging the multi-level magma reservoir at Mt. Etna volcano (Italy). Geophys. Res. Lett. 38, L16306. doi:10.1029/2011GL048488
Andronico, D., Cannata, A., Di Grazia, G., and Ferrari, F. (2021). The 1986–2021 paroxysmal episodes at the summit craters of Mt. Etna: insights into volcano dynamics and hazard. Earth-Sci. Rev. 220, 103686. doi:10.1016/j.earscirev.2021.103686
Andronico, D., Scollo, S., Caruso, S., and Cristaldi, A. (2008). The 2002–03 Etna explosive activity: tephra dispersal and features of the deposits. J. Geophys. Res. 113, B04209. doi:10.1029/2007JB005126
Baxter, P. J. (2010). “Impacts of eruptions on human health,” in Encyclopedia of volcanoes. Editors H. Sigurdsson, B. Houghton, S. McNutt, H. Rymer, and J. Stix (San Diego, CA: Academic Press), 1035–1043.
Bonaccorso, A. (2006). Explosive activity at Mt. Etna summit craters and source modeling by using high-precision continuous tilt. J. Volcanol. Geotherm. Res. 158, 221–234. doi:10.1016/j.jvolgeores.2006.05.007
Bonaccorso, A., and Aloisi, M. (2021). Tracking magma storage: new perspectives from 40 Years (1980–2020) of ground deformation source modeling on Etna volcano. Front. Earth Sci. 9, 638742. doi:10.3389/feart.2021.638742
Bonaccorso, A., and Calvari, S. (2017). A new approach to investigate an eruptive paroxysmal sequence using camera and strainmeter networks: lessons from the 3–5 December 2015 activity at Etna volcano. Earth Planet. Sci. Lett. 475, 231–241. doi:10.1016/j.epsl.2017.07.020
Bonaccorso, A., Calvari, S., Linde, A. T., Sacks, S. I., and Boschi, E. (2012). Dynamics of the shallow plumbing system investigated from borehole strainmeters and cameras during the 15 March, 2007 Vulcanian paroxysm at Stromboli volcano. Earth Planet. Sci. Lett. 357 (358), 249–256. doi:10.1016/j.epsl.2012.09.009
Bonaccorso, A., Carleo, L., Currenti, G., Bilotta, G., Cappello, A., and Ganci, G. (2023). A new approach for real-time erupted volume estimation from high-precision strain detection validated by satellite topographic monitoring. Geophys. Res. Lett. 50, e2023GL105424. doi:10.1029/2023GL105424
Bonaccorso, A., Carleo, L., Currenti, G., and Sicali, A. (2021). Magma migration at shallower levels and lava fountains sequence as revealed by borehole dilatometers on Etna volcano. Front. Earth Sci. 9, 740505. doi:10.3389/feart.2021.740505
Bonaccorso, A., Currenti, G., Linde, A., Sacks, S., and Sicali, A. (2020). Advances in understanding intrusive, explosive and effusive processes as revealed by the borehole dilatometer network on Mt. Etna volcano. Front. Earth Sci. 7, 357. doi:10.3389/feart.2019.00357
Bonaccorso, A., Currenti, G., Linde, A. T., and Sacks, S. I. (2013). New data from borehole strainmeters to infer lava fountain sources (Etna 2011–2012). Geophys. Res. Lett. 40 (14), 3579–3584. doi:10.1002/grl.50692
Bonaccorso, A., Linde, A., Currenti, G., Sacks, S., and Sicali, A. (2016). The borehole dilatometer network of Mount Etna: a powerful tool to detect and infer volcano dynamics. J. Geophys. Res. Solid Earth 121, 4655–4669. doi:10.1002/2016JB012914
Bonadonna, C., Cioni, R., Costa, A., Druitt, T., Phillips, J., Pioli, L., et al. (2016). MeMoVolc report on classification and dynamics of volcanic explosive eruptions. Bull. Volcanol. 78, 84. doi:10.1007/s00445-016-1071-y
Bonforte, A., Bonaccorso, A., Guglielmino, F., Palano, M., and Puglisi, G. (2008). Feeding system and magma storage beneath Mt. Etna as revealed by recent inflation/deflation cycles. J. Geophys. Res. 113, B05406. doi:10.1029/2007jb005334
Bruno, V., Aloisi, M., Gambino, S., Mattia, M., Ferlito, C., and Rossi, M. (2022). The most intense deflation of the last two decades at Mt. Etna: The 2019–2021 evolution of ground deformation and modeled pressure sources. Geophys. Res. Lett. 49 (6), e2021GL095195. doi:10.1029/2021GL095195
Calvari, S., Cannavò, F., Bonaccorso, A., Spampinato, L., and Pellegrino, A. G. (2018). Paroxysmal explosions, lava fountains and ash plumes at Etna volcano: eruptive processes and hazard implications. Front. Earth Sci. 6, 107. doi:10.3389/feart.2018.00107
Calvari, S., Neri, M., and Pinkerton, H. (2002). Effusion rate estimations during the 1999 summit eruption on Mount Etna, and growth of two distinct lava flow fields. J. Volcanol. Geotherm. Res. 119, 107–123. doi:10.1016/s0377-0273(02)00308-6
Calvari, S., and Nunnari, G. (2022). Etna output rate during the last decade (2011–2022): insights for hazard assessment. Remote Sens. 14, 6183. doi:10.3390/rs14236183
Calvari, S., and Nunnari, G. (2024). Reawakening of voragine, the oldest of Etna’s summit craters: insights from a recurrent episodic eruptive behavior. Remote Sens. 16 (22), 4278. doi:10.3390/rs16224278
Cannata, A., Di Grazia, G., Giuffrida, M., Gresta, S., Palano, M., Sciotto, M., et al. (2018). Space-time evolution of magma storage and transfer at Mt. Etna volcano (Italy): the 2015–2016 reawakening of Voragine crater. Geochem. Geophys. Geosyst. 19, 471–495. doi:10.1002/2017gc007296
Carleo, L., Bonaccorso, A., Currenti, G., and Sicali, A. (2022). Near real-time filtering of high precision borehole strainmeter signals for volcano surveillance. Ann. Of Geophys. 65 (4), VO428. doi:10.4401/ag-8787
Carleo, L., Currenti, G., and Bonaccorso, A. (2023). Clustering of eruptive events from high-precision strain signals recorded during the 2020–2022 lava fountains at the Etna volcano (Italy). Nat. Hazards Earth Syst. Sci. 23 (5), 1743–1754. doi:10.5194/nhess-23-1743-2023
Corsaro, R. A., Miraglia, L., Arlenzo, I., and Di Renzo, V. (2024). The 2020–2022 paroxysmal episodes of the South-East Crater (Mt. Etna): insights into high-frequency eruptive activity from petrological monitoring. Bull. Volcanol. 86, 85. doi:10.1007/s00445-024-01770-4
Currenti, G., Del Negro, C., Ganci, G., and Scandura, D. (2008). 3D numerical deformation model of the intrusive event forerunning the 2001 Etna eruption. Phys. Earth Planet. Inter. 168 (1-2), 88–96. doi:10.1016/j.pepi.2008.05.004
Currenti, G., Zuccarello, L., Bonaccorso, A., and Sicali, A. (2017). Borehole volumetric strainmeter calibration from a nearby seismic broadband array at Etna volcano. J. Geophys. Res. Solid Earth 112 (10), 7729–7738. doi:10.1002/2017JB014663
De Gori, P., Giampiccolo, E., Cocina, O., Branca, S., Doglioni, C., and Chiarabba, C. (2021). Re-pressurized magma at Mt. Etna, Italy, may feed eruptions for years. Commun. Earth Environ. 2, 216. doi:10.1038/s43247-021-00282-9
Edwards, M. J., Pioli, L., Andronico, D., Scollo, S., Ferrari, F., and Cristaldi, A. (2018). Shallow factors controlling the explosivity of basaltic magmas: the 17–25 May 2016 eruption of Etna Volcano (Italy). J. Volcanol. Geotherm. Res. 357, 425–436. doi:10.1016/j.jvolgeores.2018.05.015
Eibl, E. P. S., Thordarson, T., Hoskuldsson, Á., Gudnason, E. Á., Dietrich, T., Hersir, G. P., et al. (2023). Evolving shallow conduit revealed by tremor and vent activity observations during episodic lava fountaining of the 2021 Geldingadalir eruption, Iceland. Bull. Volcanol. 85, 10. doi:10.1007/s00445-022-01622-z
Giuffrida, M., Cardone, M., Zuccarello, F., and Viccaro, M. (2023). Etna 2011–2022: discoveries from a decade of activity at the volcano. Earth-Sci. Rev. 245, 104563. doi:10.1016/j.earscirev.2023.104563
GPV - Global Volcanism Program (1999). “Bulletin of the global volcanism network,” 24:9. Washington, DC: Smithsonian Institution. doi:10.5479/si.GVP.BGVN199909-211060
Harris, A. J. L., and Neri, M. (2002). Volumetric observations during paroxysmal eruptions at Mount Etna: pressurized drainage of a shallow chamber or pulsed supply? J. Volcanol. Geotherm. Res. 116, 79–95. doi:10.1016/S0377-0273(02)00212-3
Head, J. W., and Wilson, L. (1987). Lava fountain heights at Pu’u ‘O’o, Kilauea, Hawaii: indicators of amount and variations of exsolved magma volatiles. J. Geophys. Res. Solid Earth 92, 13715–13719. doi:10.1029/JB092iB13p13715
Heliker, C., and Wright, T. J. (1991). The Pu’u ‘O’o-Kupaianaha Eruption of Kilauea. EOS Trans. Am. Geophys. Union 72, 521–530. doi:10.1029/90eo00372
Horwell, C. J., Sargent, P., Andronico, D., Castro, M. D. L., Tomatis, M., Hillman, S. E., et al. (2017). The iron-catalysed surface reactivity and health-pertinent physical characteristics of explosive volcanic ash from Mt. Etna, Italy. Italy. J. appl.volcanol. 6, 12. doi:10.1186/s13617-017-0063-8
Jaupart, C., and Vergniolle, S. (1988). Laboratory models of Hawaiian and Strombolian eruptions. Nature 331, 58–60. doi:10.1038/331058a0
Jaupart, C., and Vergniolle, S. (1989). The generation and collapse of a foam layer at the roof of a basaltic magma chamber. J. Fluid Mech. 203, 347–380. doi:10.1017/s0022112089001497
Johnston, M. J. S., Lisowski, M., Hill, D. P., and Power, J. (2001). Mechanics of volcanic activity in Long Valley and Kilauea/Mauna Loa volcanic areas from multi-parameter borehole measurements. Trans. Am. Geophys. Un. 82, F1309.
Linde, A. T., Agustsson, K., Sacks, S. I., and Ragnar, S. (1993). Mechanism of the 1991 eruption of Hekla from continuous borehole strain monitoring. Nature 365, 737–740. doi:10.1038/365737a0
Mangan, M. T., Cashman, K. V., and Swanson, D. A. (2014). The dynamics of Hawaiian-style eruptions: a century of study. Charact. Hawaii. Volcanoes 323, 323–354. doi:10.3133/pp18018
Martin, R. S., Watt, S. F. L., Pyle, D. M., Mather, T. A., Matthews, N. E., Georg, R. B., et al. (2009). Environmental effects of ashfall in Argentina from the 2008 Chaitén volcanic eruption. J. Volcanol. Geother. Res. 184, 462–472. doi:10.1016/j.jvolgeores.2009.04.010
Mogi, K. (1958). Relations between the eruptions of various volcanoes and the deformations of the ground surfaces around them. Bull. Earthq. Res. Inst. 36, 99–134.
Monaco, C., De Guidi, G., and Ferlito, C. (2011). The morphotectonic map of Mt.Etna. It. J. Geosci. 129, 409–428. doi:10.3301/IJG.2010.11
Moyer, S., and Sahagian, D. (2024). Use of Pele’s tears and spheres as an indicator of lava fountain height in Hawaiian volcanoes. Front. Earth Sci. 31, 12. doi:10.3389/feart.2024.1379985
Namiki, A., Patrick, M. R., Manga, M., and Houghton, B. F. (2021). Brittle fragmentation by rapid gas separation in a Hawaiian fountain. Nat. Geosci. 14, 242–247. doi:10.1038/s41561-021-00709-0
Palano, M., pezzo, G., and Chiarabba, C. (2024). Magma budget, plutonic growth and lateral spreading at Mt. Etna. Commun. earth and Environ. 5, 95. doi:10.1038/s43247-024-01267-0
Roeloffs, E. A., and Linde, A. T. (2007). “Borehole observations and continuous strain and fluid pressure,” in Volcano deformation geodetic measurments tecniques. Editor D. Dzurisin (Berlin: Springer), 305–322.
Sacks, I. S., Suyehiro, S., Evertson, D. W., and Yamagishi, Y. (1971). Sacks-evertson strainmeter, its installation in Japan and some preliminary results concerning strain steps. Meteorol. Geophys. 22, 195–208. doi:10.2467/mripapers1950.22.3-4_195
Scott, S., Pfeffer, M., Oppenheimer, C., Bali, E., Lamb, O. D., Barnie, T., et al. (2023). Near-surface magma flow instability drives cyclic lava fountaining at Fagradalsfjall, Iceland. Nat. Commun. 14, 6810. doi:10.1038/s41467-023-42569-9
Sparks, R. S. J. (2003). Dynamics of magma degassing. London: Geological Society, Special Publication. 213, 5–22. doi:10.1144/GSL.SP.2003.213.01.02
Sparks, R. S. J., Bursik, M. I., Carey, S. N., Gilbert, J. S., Glaze, L. S., Sigurdsson, H., et al. (1997). Volcanic plumes. Chichester: John Wiley and Sons.
Voight, B., Linde, A. T., Sacks, S. I., Mattioli, G. S., Sparks, R. S. J., Elsworth, D., et al. (2006). Unprecedented pressure increase in deep magma reservoir triggered by lava-dome collapse. Geophys. Res. Lett. 33 (3), L03312. doi:10.1029/2005GL024870
Walker, G. P. L. (1973). Explosive volcanic eruptions—a new classification scheme. Geol. Rundsch 62, 431–446. doi:10.1007/bf01840108
Wilson, L., Parfitt, E. A., and Head, J. W. (1995). Explosive volcanic eruptions-VIII. The role of magma recycling in controlling the behaviour of Hawaiian-style lava fountains. Geophys. J. Int. 121, 215–225. doi:10.1111/j.1365-246X.1995.tb03522.x
Witt, T., Walter, T. R., Muller, D., Gudmundsson, M. T., and Schopa, A. (2018). The relationship between lava fountaining and vent morphology for the 2014–2015 Holuhraun eruption, Iceland, analyzed by video monitoring and topographic mapping. Front. Earth Sci. 6, 235. doi:10.3389/feart.2018.00235
Wolfe, E. W., Neal, C. A., Banks, N. G., and Duggan, T. J. (1988). “Geologic observations and chronology of eruptive events”, The Puu Oo eruption of Kilauea Volcano, Hawaii: Episodes 1 through 20, January 3, 1983, through June 8, 1984. Editor E. W. Wolfe. U.S. Geological Survey Professional Paper, 1463, 1–98. doi:10.3133/pp1463
Keywords: Etna volcano, lava fountains, volcano monitoring, borehole strainmeters, eruption modeling
Citation: Bonaccorso A, Carleo L, Currenti G and Sicali A (2025) The intense explosive activity of lava fountain sequences from Voragine crater at Etna volcano: new insights through high-precision borehole strain recordings. Front. Earth Sci. 13:1606006. doi: 10.3389/feart.2025.1606006
Received: 04 April 2025; Accepted: 30 June 2025;
Published: 10 July 2025.
Edited by:
Nick Varley, University of Colima, MexicoReviewed by:
Marisa Giuffrida, University of Catania, ItalyMaurizio Mulas, ESPOL Polytechnic University, Ecuador
Dork Sahagian, Lehigh University, United States
Copyright © 2025 Bonaccorso, Carleo, Currenti and Sicali. This is an open-access article distributed under the terms of the Creative Commons Attribution License (CC BY). The use, distribution or reproduction in other forums is permitted, provided the original author(s) and the copyright owner(s) are credited and that the original publication in this journal is cited, in accordance with accepted academic practice. No use, distribution or reproduction is permitted which does not comply with these terms.
*Correspondence: Luigi Carleo, bHVpZ2kuY2FybGVvQGluZ3YuaXQ=