 Alix Vidal1*
 Juliane Hirte2
 S. Franz Bender3
 Jochen Mayer2Andreas Gattinger4,5
 Carmen Höschen1Sebastian Schädler6Toufiq M. Iqbal7
 Carsten W. Mueller1
- 1Lehrstuhl für Bodenkunde, Technische Universität München, Munich, Germany
- 2Plant-Soil Interaction Group, Division, Agroecology and Environment, Agroscope, Zurich, Switzerland
- 3Department of Land, Air and Water Resources, University of California, Davis, Davis, CA, United States
- 4Departement für Bodenwissenschaften, FiBL, Frick, Switzerland
- 5Organic Farming, Justus-Liebig-Universität Giessen, Giessen, Germany
- 6Global Applications Support Crossbeam, Carl Zeiss Microscopy GmbH, ZEISS Group, Oberkochen, Germany
- 7Department of Agronomy and Agricultural Extension, University of Rajshahi, Rajshahi, Bangladesh
Plant roots are major transmitters of atmospheric carbon into soil. The rhizosphere, the soil volume around living roots influenced by root activities, represents hotspots for organic carbon (OC) inputs, microbial activity, and carbon turnover. Rhizosphere processes remain poorly understood and the observation of key mechanisms for carbon transfer and protection in intact rhizosphere microenvironments are challenging. We deciphered the fate of photosynthesis-derived OC in intact wheat rhizosphere, combining stable isotope labeling at field scale with high-resolution 3D-imaging. We used nano-scale secondary ion mass spectrometry and focus ion beam-scanning electron microscopy to generate insights into rhizosphere processes at nanometer scale. In immature wheat roots, the carbon circulated through the apoplastic pathway, via cell walls, from the stele to the cortex. The carbon was transferred to substantial microbial communuties, mainly represented by bacteria surrounding peripheral root cells. Iron oxides formed bridges between roots and bigger mineral particles, such as quartz, and surrounded bacteria in microaggregates close to the root surface. Some microaggregates were also intimately associated with the fungal hyphae surface. Based on these results, we propose a conceptual model depicting the fate of carbon at biogeochemical interfaces in the rhizosphere, at the forefront of growing roots. We observed complex interplays between vectors (roots, fungi, bacteria), transferring plant-derived OC into root-free soil and stabilizing agents (iron oxides, root and microorganism products), potentially protecting plant-derived OC within microaggregates in the rhizosphere.
Introduction
Soils harbor a huge fraction of the global terrestrial carbon (C) pool. While belowground C transfer by plants represents a major pathway of atmospheric C into the soil, soils also represent a major source of atmospheric C. Understanding the complex interactions that govern C storage in and release from soils is a major challenge to develop strategies to mitigate climate change (Lal, 2004).
Soils are composed of a wide diversity of organic and mineral compounds, forming a complex mosaic of microenvironments (Ranjard and Richaume, 2001). The volume of soil directly affected by living roots, i.e., the rhizosphere, represents an important hotspot for microbial activity, organic carbon (OC) inputs, and C turnover in soils (Hinsinger et al., 2009; Philippot et al., 2013; Finzi et al., 2015). Root products (mucilage, exudates, cell fragments) and dead roots, represent a major source of OC in soils (Rasse et al., 2005; Bardgett et al., 2014). Around 30% of the photosynthetically fixed C is transferred below ground, but this proportion can vary widely depending on environmental conditions, plant species, and the plant growing stage (Kuzyakov and Domanski, 2000). While half of the C transferred below ground is allocated to the root biomass, around one-third is respired in the rhizosphere (Jones et al., 2009), in equal proportions by roots and microorganisms (Kuzyakov and Larionova, 2005). Finally, more than 10% of the C transported below ground is allocated to soil microorganisms and soil organic matter (Jones et al., 2009; Kaiser et al., 2015). Alive or dead, microorganisms inhabiting the rhizosphere represent a major sink for plant-derived C and foster the development of soil microstructures (Liang and Balser, 2011; Kallenbach et al., 2016; Lehmann et al., 2017). These microorganisms include arbuscular mycorrhizal (AM) fungi, soil fungi that form symbiotic associations with the majority of land plants, including wheat (Van der Heijden et al., 1998; Dickie et al., 2013). These fungi can receive up to 20% of a plant's photosynthetic C intake in return for delivery of nutrients to the plant (Jakobsen and Rosendahl, 1990). Specific surface binding properties of organic soil components (roots, plant-derived compounds, and microorganisms) together with adsorption capacities of soil minerals are drivers of the formation of complex organo-mineral assemblages as microaggregates (Baldock and Skjemstad, 2000; Bronick and Lal, 2005). The association of OC in complex microaggregate structures stabilizes C against degradation and reduces its turnover in soil, hence representing a pathway of C sequestration (Kögel-Knabner and Amelung, 2014). Rhizosphere processes have a determinant impact on the global soil C pool that is still not fully understood (Schmidt et al., 2011; Pett-Ridge and Firestone, 2017). Enhancing rhizosphere processes, such as C transfer from roots to microorganisms and soil, can increase soil C storage (White et al., 2013; Lange et al., 2015), one of the challenges of the Twenty-firstt century to mitigate climate change (Lal, 2004; Lehmann, 2007).
The complexity of biogeochemical processes occurring in the rhizosphere requires observations at process-relevant scales, i.e., at the interface of root cells, microorganisms, and soil (Hallett et al., 2013; Oburger and Schmidt, 2016). The microscopic observation of intact soil structures as embedded thin sections has been applied since the 1930s (Kubiena, 1938; Alexander and Jackson, 1954) and has enabled the observation of the rhizosphere at the scale of organism interactions (Martin and Foster, 1985). Despite the descriptive quality of such imaging approaches, the absence of techniques to trace specific elements and isotopes hampered the direct in situ study of C allocation at biogeochemical interfaces in the rhizosphere. Since then, strong efforts have been made to observe undisturbed soil-root-microorganism assemblages at the microscale under controlled laboratory conditions, in some cases using 13C and 15N tracers (Nunan et al., 2001; Li et al., 2003; Castorena et al., 2016; Vidal et al., 2016). In the present study, we collected undisturbed rhizosphere samples in an agricultural field and considered in situ interactions of plants, microorganisms, and soil mineral particles at the microscale.
We qualitatively explored the pathway of photosynthetically fixed C from roots to microorganisms and soil, as well as how roots determine the structural and compositional 3D architecture of the rhizosphere at nanometer resolution. To meet this objective, we combined 2D elemental and isotopic information (nano-scale secondary ion mass spectrometry-NanoSIMS) with 3D structural information (Focused ion beam-scanning electron microscopy-FIB-SEM) highlighting biogeochemical interfaces and processes in the rhizosphere. We expected the highest enrichment in the close vicinity of roots, as well as a transfer of plant-derived C to microorganisms surrounding roots and forming intimate associations with minerals.
Materials and Methods
In Situ 13C-Labeling and Sampling
Samples were collected in 2015 on winter wheat (Triticum aestivum, var. Wiwa) plots of the Swiss long-term field trial “DOK” (Therwil, CH) (Mayer et al., 2015). Two microplots (stainless steel tubes, 0.35 m diameter, 0.55 m length) were inserted into the soil to 0.5 m depth to segregate wheat sub-populations (approximately 50 plants in two rows) from surrounding field populations below ground. The first microplot corresponded to a full-fertilized bio-organic management system (i.e., in compliance with the subsidiary scheme “Bio Suisse”). The second microplot corresponded to a full-fertilized conventional management system (i.e., in compliance with the subsidiary scheme “Proof of Ecological Performance”). The wheat was fertilized according to Swiss standards for the respective managements (Flisch et al., 2009). The present study did not aim at comparing organic and conventional treatments but at depicting rhizosphere processes through qualitative microscale observations. Thus, the samples collected from these two microplots were not separated by treatments for NanoSIMS analyses. In order to keep labeled plants as undisturbed as possible, the use of multiple-pulse labeling was chosen instead of a more invasive method (Kuzyakov and Domanski, 2000). From advanced tillering to maturity (beginning of April to end of June according to Zadoks et al., 1974), the headspace over each microplot was enclosed with a gas-tight Plexiglas® hood once per week and plants were exposed to 99 atom-% 13C-CO2 (Figure 1). Before the labeling campaign, the necessary amount of label, the number of pulse events during the vegetation period, and the duration of each pulse event were calculated. For this purpose, three parameters were considered: the strength of the label (99%), the daily assimilation rate of wheat, and the targeted bulk soil enrichment. The gas was injected in repeated pulses during 4 h between late morning and early afternoon while the CO2 concentration was regularly tracked using a portable LI-COR (LI820, re-calibrated for 13C-sensitivity) and allowed to fluctuate between 150 and 800 ppm. Closed ventilation by PC fans and cooling with 4 kg ice packs ensured similar climatic conditions inside and outside the labeling hoods. The microplot plants received approximately 9.5 g 13C over the entire labeling period. Considering the qualitative microscale approach of the present study, we did not include a bare fallow control to account for the autotrophic CO2 fixation. Indeed, we focused on rhizosphere processes and assumed autotrophic microorganisms to be negligible compared to heterotrophic ones (Kuzyakov and Larionova, 2005). For minimal destruction of microplots by the root and soil sampling before plant maturity, one root-ingrowth cylinder (PVC tubes, 30 mm diameter, 200 mm length) was inserted into the topsoil of each microplot (cylinder 1 and 2, for the organic and conventional treatments, respectively). Cylinders had an ingrowth window of 150*30 mm on one side and were covered with a 1 mm mesh on openings. Sieved and homogenized topsoil was filled into the cylinders and re-compacted to a density of 1.3 g.cm−3, which was estimated from the cylinder volume and the fresh soil mass. At the beginning of the labeling period, one hole per microplot was drilled in 20–30 mm distance from the wheat rows by means of a gouge auger (30 mm diameter; Eijkelkamp, Netherlands). The two ingrowth cylinders were gently pushed inside the holes so that the bottom and side walls were in close contact with the surrounding soil and the ingrowth windows faced wheat rows. Only new wheat roots that grew after the beginning of the labeling period could thereby enter ingrowth cylinders. Plants were labeled 10 times with the last labeling being conducted 3 days before sampling. At anthesis (Zadoks' scale 69; Zadoks et al., 1974, mid-June), the cylinders were removed from the soil, transported to the laboratory, and immediately processed or deep-frozen for further analyses.
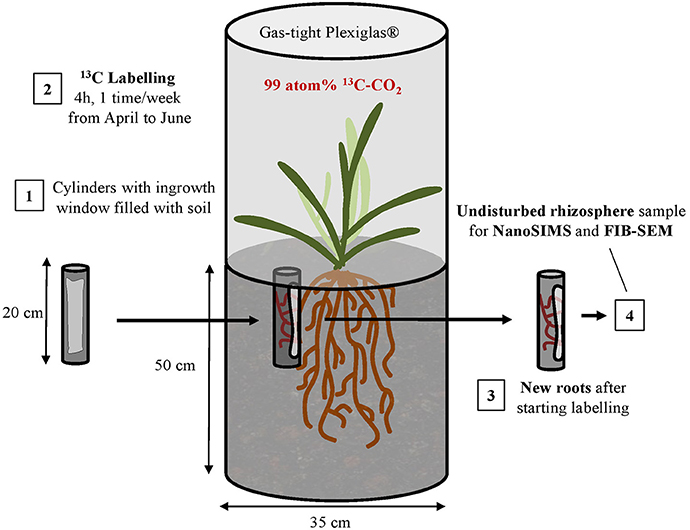
Figure 1. Simplified representation of the experimental design applied to obtain undisturbed rhizosphere samples for NanoSIMS and FIB-SEM analyses. The cylinder represents a microplot. Numbers indicate the sequence of steps to obtain samples.
Sample Processing
The two ingrowth cylinders were opened at the top and bottom and the complete soil core within the cylinder was removed. Soil was carefully broken by hand into several pieces. Larger soil aggregates including root fragments (approximately 1 cm−3) were sampled. Two samples from each cylinder, i.e., four samples in total, were chemically fixed using Karnovsky fixative (Morris, 1965) and dehydrated in graded acetone series and embedded in araldite resin (Araldite 502) until complete polymerization, according to the method described by Mueller et al. (2012). Samples were cut and polished to obtain intact rhizosphere cross sections. In order to analyze the fine soil fraction containing microaggregates and fungal hyphae, a fungal hypha was extracted from cylinder 1, which showed a higher percentage of hyphal root colonization (Table 1). This sample was prepared on a silica wafer according to Mueller et al. (2012). Briefly, 1 mg of dried soil from the chemically fixed and dried rhizosphere was dispersed in 10 mL of analytical water ACS. A 100 μL drop was deposited on a silica wafer and dried overnight.
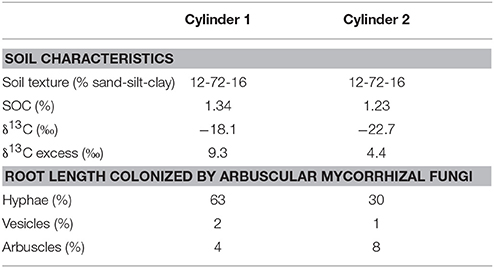
Table 1. General characteristics of soil and colonization with arbuscular mycorrhizal fungi of roots extracted from the two cylinders, considered as replicated in the present study and used for the NanoSIMS and FIB-SEM analyses.
The remaining soil from cylinders was separated from roots and other organic materials by 0.5 mm wet-sieving, oven-dried at 80°C and analyzed for total C and 13C abundance using an elemental analyzer coupled with an isotope ratio mass spectrometer (EA 1110; Carlo Erba; coupled with Delta S; Thermo Finnigan). The root colonization by AM fungi was assessed by microscopy using a modified line-intersection method for 100 intersections after clearing and staining with an ink-vinegar mixture as described by Wagg et al. (2011). The general characteristics of the soil are presented in Table 1 for the two cylinders, as well as the percentage of root length colonized by AM fungal hyphae, vesicles, and arbuscles.
NanoSIMS Analyses
We analyzed intact rhizosphere sections (four transversal and longitudinal sections) and a rhizosphere derived fungal hypha with NanoSIMS. At first, the scanning electron microscope (SEM in backscatter mode; JEOL JSM 5900LV, Garching, Germany) was used to identify areas for subsequent NanoSIMS analyses. Areas of interest corresponded to intact rhizosphere area containing root cells, microorganisms, and soil minerals/microaggregates. The sample surface was sputtered by a Cs+ beam to obtain 30 × 30 μm2 images (acquired using a NanoSIMS 50L Cameca, Germany) at 256 × 256 pixels. Secondary ion images of 12C, 13C, 16O, 12C14N, and 56Fe16O were obtained and 20 planes were accumulated for each final image, with a dwell time of 1 ms.pixel−1. Measurements on the sample dispersed on the silica wafer were realized in the same manner, recording 22 planes. Higher resolution images were obtained acquiring 40 × 40 μm2 images at 512 × 512 pixels for 12C, 13C, 12C14N, and 16O secondary ions. Measurements were processed using the ImageJ software (Abràmoff et al., 2004). OpenMIMS and MosaicJ plugins (Thévenaz and Unser, 2007) were used to display images and create mosaics, respectively. For RGB mosaic images, images were first uploaded individually, composite RGB images were created (56Fe16O in red, 12C14N in green, 16O in blue) and adjusted to remove the resin contribution using the color adjustment. Images were then uploaded in the MosaicJ plugin for mosaic creation. Mosaics including 3–32 NanoSIMS measurements were created. The 13C:12C ratio images were generated to follow the distribution of 13C enrichment. The enrichment was estimated by comparing 13C:12C ratio values to the approximate soil natural abundance (0.011). For 13C:12C ratio mosaic images, images were first uploaded individually to obtain the 13C:12C ratio distribution and uploaded in the MosaicJ plugin for the mosaic creation. The interactive regions of interest (ROIs) definition tool of Look@NanoSIMS program (Polerecky et al., 2012) was used to draw ROIs on selected 12C14N images, in order to obtain their isotopic composition. ROIs were drawn either by using the threshold function according to 12C14N counts (microbes and hyphae), the freehand drawing option (plant cell walls) or by drawing ellipses (resin spots). The resin, which presented a 13C:12C ratio equal to the soil natural abundance was considered as natural background.
FIB-SEM Analyses
FIB-SEM imaging was performed using a Zeiss Crossbeam 550 L microscope with a primary beam operated at a landing energy of 1.8 keV. Backscattered electrons were recorded at an energy-selective backscattered electron detector with the grid voltage set to 1,000 V. The Carl Zeiss ATLAS 5 package was used for the identification of the adequate sample position by precise spatial correlation of sample stage coordinates to the previously acquired NanoSIMS analysis, and for the control of the FIB-SEM acquisition. Images were collected at 15 μs dwell time, at 10 nm pixel resolution, and at slice intervals of 10 nm. EDS maps were collected at 40 nm pixel resolution at a Z interval of 160 nm.
For the FIB sample preparation, first a 1.5 μm thick protective platinum layer was deposited on the surface of the sample's volume of interest using a 3 nA FIB beam current. The characteristic ATLAS 3D tracking marks, which are used to dynamically correct for drifts of the sample with respect to the SEM beam in x- and y-directions, and for drifts of the sample with respect to the FIB milling in z-direction, were milled into this platinum layer with a 50 pA FIB beam, filled in with a layer of C (100 pA FIB beam current) and then covered with a 1 μm thick C pad (3 nA FIB beam current). The cross-section in front of the volume of interest was opened using a 30 nA FIB beam current and then polished using a 7 nA FIB beam current.
During the collection of the imaging dataset, the FIB (3 nA beam current) and the SEM (1.8 kV, 1.0 nA) were operated simultaneously. FIB-SEM imaging was paused and the SEM ramped to analytical conditions (6 kV, 2 nA) at z intervals of 160 nm for the acquisition of EDS maps.
The 3D data set was created from the datasets using ORS Dragonfly software. Images were not aligned after the acquisition because the quality of the alignment achieved during the acquisition of the dataset was considered sufficient. The direction of image acquisition for both the FIB-SEM dataset and EDS maps is perpendicular to that for the NanoSIMS analysis and 2D surface imaging. To highlight the volumes of interest without additional segmentation steps, window levels of the images were adjusted and saturated black values made transparent in the volume view.
Statistical Analyses
The R software, version × 64 3.3.2 (R Core Team, 2017), was used for boxplot representations of ROI 13C:12C ratio values of NanoSIMS images and statistical analyses. The application of Shapiro–Wilk test revealed that data were not normally distributed. Thus, the non-parametric Kruskal–Wallis test was performed, followed by multiple pairwise comparisons with Dunn test. Statistical significance was set as α = 0.05 for all tests.
Results
Arrangement of Organic and Mineral Structures in Roots and Rhizosphere
We analyzed an immature wheat root close to the root tip (Figures 2, 3, and Supplementary Figure 1) as this is the location of highest activity in terms of mucilage production and effects on soil structure due to pressure of the growing roots. The root tip has a stele diameter of less than 100 μm and no identifiable phloem and xylem cells. The cortex cells, located at the periphery of the root and in direct contact with the soil particles, present a marked deformation (Figure 2). This phenomenon is also observed on a longitudinal section of another root (Supplementary Figure 2).
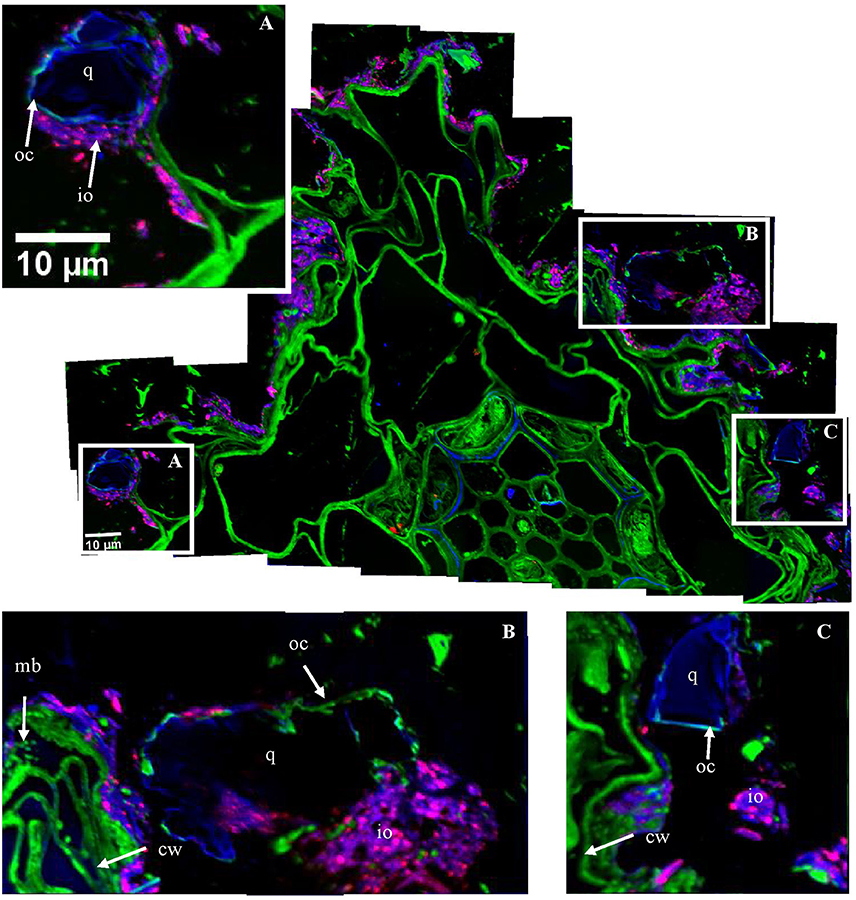
Figure 2. Organo-mineral associations surrounding the root cells. Mosaic of NanoSIMS composite images of the area indicated in Supplementary Figure 1A; with 12C14N in green, 16O in blue, 56Fe16O in red. The mosaic was built up from 32 NanoSIMS measurements (one image −30 × 30 μm, 256 × 256 pixels, 20 planes, 1 ms.pixel−1). (A–C) Illustrate the intimate association between large mineral particles (>10 μm) (i.e., q, quartz grain); io, iron oxides; cw, plant cell walls; mb, microorganisms; and oc, organic coating. The black area represents the resin. White squares correspond to the areas used to obtain the boxplot in Figure 8.
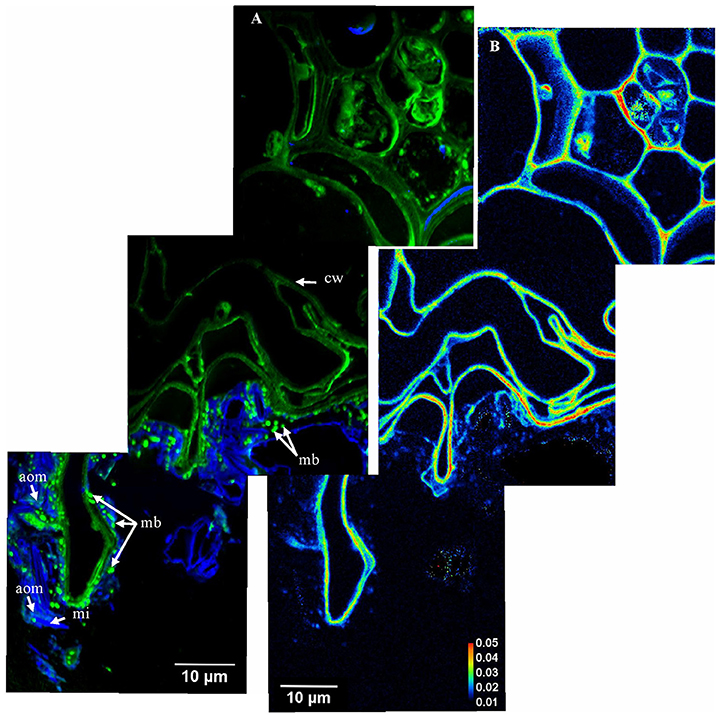
Figure 3. From stele to cortex and rhizosphere–carbon transfer and organo-mineral associations. (A) Mosaic of NanoSIMS composite images of the area indicated in Supplementary Figure 1B; with 12C14N in green and 16O in blue; aom, amorphous organic matter; cw, plant cell walls; mb, microorganisms; mi, mineral particle. The mosaic was created from 3 NanoSIMS images (one image- 40 × 40 μm, 512 × 512 pixels, 20 planes, 1 ms.pixel−1); (B) The 13C:12C ratio of the same area presented in (A).
Organic structures surrounding the root (Figures 2, 3A) are mainly represented by unicellular microorganisms (bacteria or archaea) and particulate organic matter (POM). We were able to detect the round shape of microorganisms with an approximate diameter of 1 μm and high nitrogen content reflected by the 12C14N clearly indicating its microbial origin (Figure 3A). The microorganisms are mainly concentrated at the close surrounding of peripheral root cells and/or in direct contact with root cell walls (Figures 3A, 4D). From some micrometer distance to the rhizoplane, microorganisms, as well as laces of N rich POM, are identified in soil microaggregates (Figures 2, 5B). These microorganisms appear as separated cells (Figure 2) or forming microbial cell assemblages (Figure 5B) at the surrounding of roots or within soil aggregates. By using FIB-SEM we were able to demonstrate the direct association of microbial cells with clay sized soil minerals forming microaggregate precursors directly at the rhizoplane (Figure 4C). Microbial cells forming the microbial assemblage are directly bound to the root cell surface on one side and enclosed within a dense layer of mineral soil constituents.
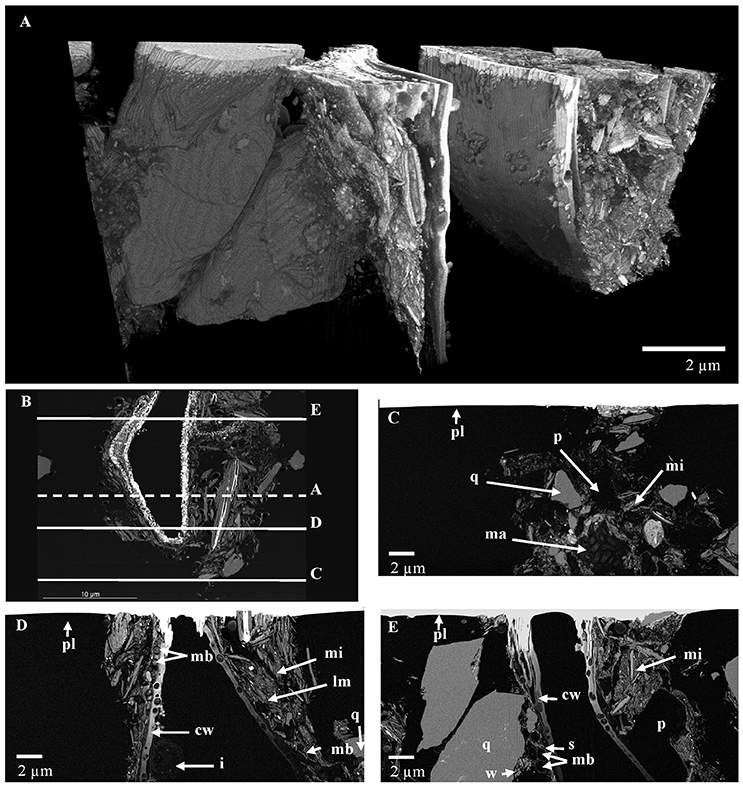
Figure 4. Structural assembly of the intact rhizosphere at a subcellular resolution- FIB-SEM (area indicated in Supplementary Figure 1C). (A) Volume visualization of the FIB-SEM dataset representing the interaction between mineral particles and a root cell; (B) Virtual perpendicular slice through the FIB-SEM 3D dataset. Letters indicate the position of the selected images; (C) Microaggregate at the root periphery; (D) Intimate organo-mineral associations; (E) Larger mineral particles at the root periphery; cw, cell wall; i, inner cell organic structure; lm, laminar microaggregate; mi, mineral particle; ma, microbial cell assemblage; mb, microorganisms; p, pore; pl, platinum layer; q, quartz grain; s, space between the root cell wall and mineral particles; w, weathering of quartz grain. The overlay of EDS images corresponding to (C–E) images are presented in Supplementary Figure 3.
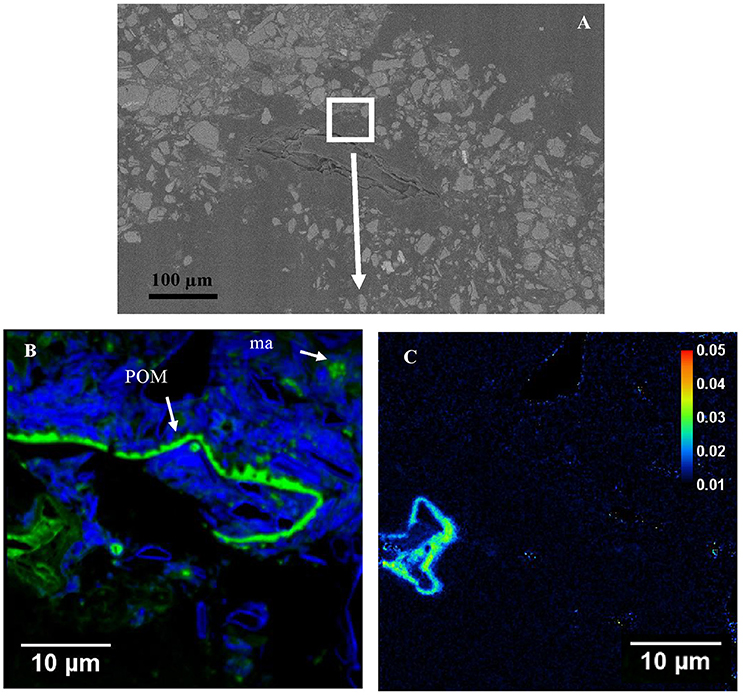
Figure 5. Organo-mineral aggregates surrounding a 13C enriched root cell. (A) SEM image of a root surrounded by microaggregates. This image was used to identify areas for subsequent NanoSIMS analyses represented in (B,C) images; (B) NanoSIMS composite image (40 × 40 μm, 512 × 512 pixels, 20 planes, 1 ms.pixel−1); with 12C14N in green and 16O in blue; POM, particulate organic matter; ma, microbial cell assemblage. (C) The 13C:12C ratio of the same area presented in (B).
We also extracted a fungal hypha from the rhizosphere soil to study the direct effect of fungi on microaggregate assemblages in the rhizosphere (Figure 6). Microaggregates (high 16O and 56Fe16O signals) are directly attached to the hyphal surface.
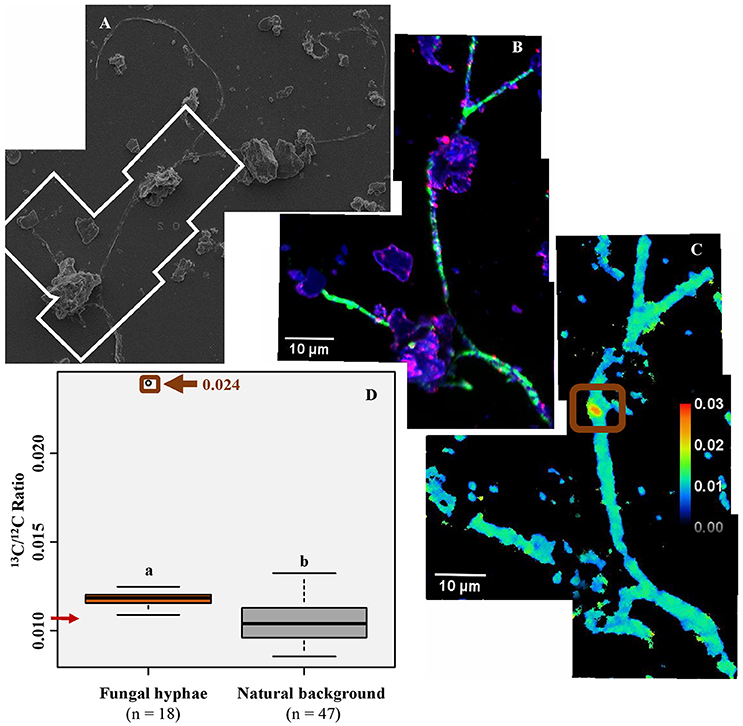
Figure 6. Suspension of soil particles associated with the fungal hypha. The suspension was deposited on a silica wafer, observed with scanning electron microscopy (A) and NanoSIMS (B,C); (B) Mosaic of NanoSIMS composite images; with 12C14N in green, 16O in blue, 56Fe16O in red; The mosaic was created from 4 images (one image- 30 × 30 μm, 256 × 256 pixels, 22 planes, 1 ms.pixel−1); (C) The 13C:12C ratio of the same area; the brown square indicates a 13C enriched spot on the fungal hyphae. (D) The 13C:12C ratio for the fungal hypha–Regions of interest (ROIs) was obtained on 12C14N images, either by using the thresholding function (fungal hypha) or drawing ellipses (natural background); n indicates the number of ROIs drawn. The letters above boxes represent statistical results of Dunn test. The red arrow indicates the 13C:12C ratio corresponding to natural abundance. The brown square corresponds to the structure highlighted in (C). Boxplots represent the third quartile, the median, the first quartile range of the data, and data outliers.
Inorganic structures are represented both by larger mineral particles (>5 μm), with high 16O content (Figures 2A–C, 4E, and Supplementary Figure 3C), assignable to quartz grains and iron oxides, with high 56Fe16O content (Figure 2). Clay sized minerals are oriented tangentially along the rhizoplane (Figures 4A,D). Some quartz grains are connected to root cells via iron oxides (Figures 2A, 4E). Quartz grains located at the periphery of root cells and close to microbes are frequently surrounded by an organic coating (Figures 2A–C). Amorphous organic matter, reflected by its 12C14N content (Figure 3), was also identified close to root cells and surrounding mineral particles.
Carbon Transfer at the Root-Rhizosphere Vicinity
Root cell walls are highly enriched in 13C (Figures 3B, 7A–C, 8), with a mean 13C:12C ratio of 0.024 (SD = 0.004). Within the same section, the13C:12C ratio measured in root cell walls varies from 0.018 to 0.032 (Figure 8). The enrichment is not homogeneously distributed in the root, as other areas presented a lower 13C:12C ratio, varying between 0.015 and 0.020 (Supplementary Figure 2).
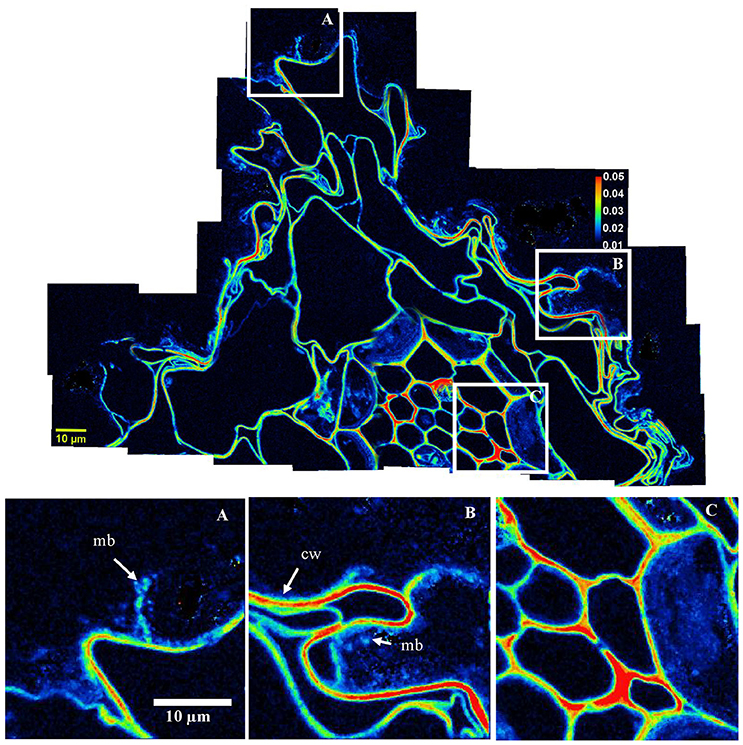
Figure 7. Carbon transfers occurring in the rhizosphere–NanoSIMS images of 13C:12C ratio of areas highlighted in Figure 2. The scale ranges from natural abundance (0.011; dark blue) to highly enriched (0.050; red). The mosaic was created from 32 NanoSIMS images. Three areas (indicated with white scares on the mosaic) are represented below the mosaic for closer observation; (A,B)- highlight the transfer of carbon from roots toward the microbial community, intimately associated with the cortex root cells; cw, plant cell walls; mb, microbes. (C) Underlines the enrichment of stele cells.
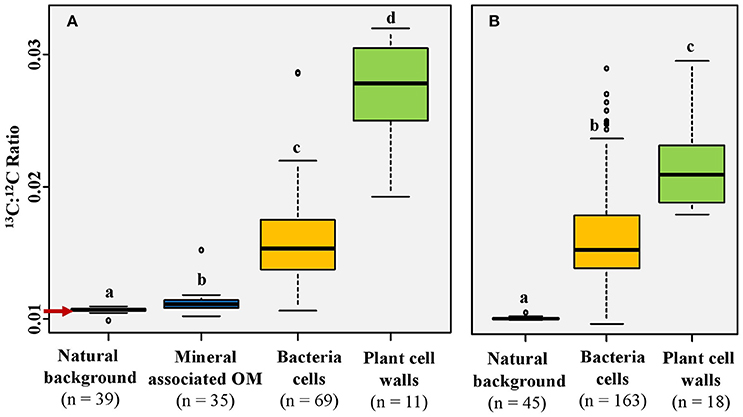
Figure 8. The 13C:12C ratio distribution according to the type of organic matter. (A) 13C:12C values from areas indicated as white squares in Figure 2; (B) 13C:12C values from areas depicted in Figure 3A. Regions of interest (ROIs) were obtained on 12C14N images, either by using the thresholding function (mineral associated OM and bacteria cells), by drawing ellipses (natural background), or by freehand drawing (plant cell walls); n indicates the number of ROIs drawn. The letters above boxes represent statistical results of Dunn test. The red arrow indicates the 13C:12C ratio corresponding to natural abundance (0.011). Boxplots represent the third quartile, the median, the first quartile range of the data, and data outliers.
The mean 13C:12C ratio of microorganisms is highly variable (0.010-0.029). It is significantly higher than the natural background but lower than the 13C:12C ratio of plant cell walls, which is 0.016 (SD = 0.004) (Figures 3B, 7A,B, 8). The fungal hypha detected in the soil suspension is, on average, slightly 13C enriched (mean 13C:12C ratio: 0.012), with a significantly higher 13C:12C ratio compared with the natural background (Figure 6C). A highly labeled spot, potentially a hypha-associated microbe, is observed (13C:12C ratio: 0.024) (Figure 6D). The OC forming a coating around quartz grains is on average not 13C enriched (mean 13C:12C ratio: 0.011), with a slight enrichment in a distinct spot (13C:12C ratio: 0.015; Figure 8A).
Discussion
The Apoplastic Pathway of Carbon at the Root Tip
Some root cell walls are highly enriched in 13C compared with other organic soil compartments (e.g., microorganisms; Figures 3B, 7, 8). This illustrates that in the immature root tip, the C transfer is achieved through cell walls, as previously shown at the lab scale by Kaiser et al. (2015). At the root tips, the absence of a Casparian strip enables the flow of recently fixed C (McCully and Canny, 1985) from the stele toward the cortex via the apoplastic pathway, i.e., along cell walls (Farrar et al., 2003; Jones et al., 2009; Kaiser et al., 2015). The C translocated to the rhizosphere by roots, e.g., root exudates, can be used as substrates by rhizosphere microbial communities (Bertin et al., 2003; Kuzyakov and Blagodatskaya, 2015). In the present study, we focused on root tips described as maximal exudate loss areas along the roots (Jones et al., 2009). It has to be noted that root elongation zones and root hairs are also important locations for root exudation (Rovira, 1973; Sauer et al., 2006).
Active Microbial Communities Close to Root Cells
Microbes surrounding or residing at the rhizoplane were highly enriched in photosynthate-derived 13C (Figures 3B, 7, 8), although lower than root cells. This observation supports our hypothesis that microorganisms surrounding roots incorporated plant-derived C. The lower 13C enrichment observed for microorganisms, compared with root cells reflects a parallel consumption of native soil OC (natural abundance 13C) by microorganisms in the rhizosphere (Kuzyakov and Blagodatskaya, 2015), resulting in the dilution of 13C in bacteria cells. During this process, plant cell walls, which are structural plant components, remained highly 13C enriched (Cotrufo et al., 2015; Vidal et al., 2016). Root-derived C taken up by soil microorganisms is either assimilated, released as metabolites, or respired (Six et al., 2006). Marx et al. (2007) showed in an incubation experiment with root exudates from labeled wheat and maize plants, that more than 50% of the retrieved exudate C was respired as CO2 by microorganisms. Thus, the lower 13C enrichment observed for microbes may also have resulted from the release of the plant-derived 13C in form of 13CO2 and /or other metabolic products.
The transfer of C to microorganisms is highly dependent on the position of microorganisms in relation to root cells, forming a gradient of foraging on rhizodeposition. As expected, 13C labeled microbes were located at a few micrometers from the root cells (Figures 3B, 7). More distant microbes did not present any enrichment (Figure 5), which is in accordance with previous work on microbial communities in the rhizosphere of beech trees (Esperschütz et al., 2009). It has been reported that microbes of the rhizosphere are generally located within a dozen micrometers of the root surface, directly at the rhizoplane or at its close surrounding (Watt et al., 2006a). This distance parameter is directly related to the time of diffusion of a solute from roots to microorganisms (e.g., glucose diffusivity in soil: around 20 μm2.s−1) (Watt et al., 2006b). This indicates that the closer microbes are to root cells, the higher their chance to receive C-containing substrates.
Fungal Hyphae in the Rhizosphere
The extracted hypha presented a significantly higher 13C:12C ratio compared with the natural background. This illustrates the role of fungal hyphae as vectors for plant-derived OC into the bulk soil. However, the 13C enrichment was lower compared with plant cell walls and bacteria cells, with the exception of a 13C enriched spot (Figure 6C). The lower 13C:12C ratio might result from the 13C dilution process, as described for bacteria cells. It has been shown that most of the plant C allocated to AM fungal hyphae is lost through respiration within 24 h (Johnson et al., 2002; De Deyn et al., 2011). Therefore, the fungal hypha might have been 13C enriched in the past and the 13C enriched signal was probably rapidly diluted by new, non-enriched C coming from the root (De Deyn et al., 2011). We assume that the highly enriched spot represents bacterial cells bound to the fungal hypha. Such strong association of bacterial cells to the hyphal surface was shown before (Artursson et al., 2006; Scheublin et al., 2010; Worrich et al., 2017). As the turnover rate of bacteria is generally considered to be higher compared to fungi (Rousk and Bååth, 2011), the bacteria or group of bacteria might have been transferred to the fungal hypha. It has been shown that bacteria are able to move on fungal hyphae thanks to the production of biofilms (Warmink et al., 2011), the so called “fungal highway.”
The key role of fungal activity in soils is demonstrated by the presence of numerous microaggregates intimately associated with the hyphal surface (Figure 6B). We highlight the direct effect of fungal hyphae on the soil microstructure formation, a process which is still poorly understood (Rillig and Mummey, 2006; Lehmann et al., 2017). Mycorrhizal fungi strongly influence soil structure formation through biological (enhancing microbial activity), physical (exerting pressure on the mineral particles), and biochemical (excretion of hyphal products) processes (Chenu, 1989; Rillig and Mummey, 2006; Lehmann et al., 2017). Thus, the mycorrhizal fungal hyphae extend the rhizosphere volume into the root-free bulk soil, acting as a vector for plant-derived OC and fostering soil structure development in root-free bulk soil.
Binding Agents at the Root Surface
The observation of NanoSIMS and FIB-SEM images confirmed our expectations of intimate interactions between mineral particles, microorganisms, and root cells. The deformation of cortex root cells (Figure 2) was associated with the tangential orientation of mineral particles along these cells (Figures 4A,D). This illustrated the physical compression of soil occurring around roots during the root growth (Foster and Rovira, 1976; Jones et al., 2004). While growing, microorganisms can also exert a pressure on mineral particles at their surroundings, which participate to mediate mineral orientation around microbial aggregates (Foster and Rovira, 1976), as observed in the present study (Figure 5C). Thus, the root and microbial growth enhance the intimate association of OC with minerals, probably leading to an increased sorption of OC to mineral surfaces. There is evidence of the association between exudates and soil particles forming a rhizosheath, an aggregated layer around the roots which remains physically stable (Ghezzehei and Albalasmeh, 2015). This process enhances the residence time of OC in the soil, which may contribute to OC sequestration (Rasse et al., 2005; Schmidt et al., 2011).
We assume that the amorphous 12C14N observed in between the mineral particles close to root cells (Figure 3) represents remnants of mucilage, a layer of highly bioavailable C surrounding root tips and acting as a binding agent for soil minerals at the root surface (Jones et al., 2009). This layer can also be seen in the FIB-SEM sections (Figure 4), highlighting microbial cells surrounded by a layer of presumably extracellular polymeric substances. Interestingly, most of the microbial cells were found within soil microaggregates, dominated by iron oxides (Figure 2). A counteracting process was proposed by Keiluweit et al. (2015) with a dissolution of iron (hydr)oxides and thus release and loss of mineral-associated OM due to the exudation of relatively high amounts of organic acids in artificial rhizospheres. In contrast, our data indicate the presence of iron (hydr)oxides, at natural exudate concentrations, under oxic soil conditions in the vicinity of roots. Oxidizing conditions in the rhizosphere can indeed contribute to the formation of an iron layer made of iron oxidation products, i.e., ferric hydroxide precipitates, at the root surface (Emerson et al., 1999; Kölbl et al., 2017). Ferrous ions, which represent the essential source for iron oxidation, were probably produced in anaerobic microsites created in the rhizosphere (Keiluweit et al., 2016). The large surface area and the high sorption capacity of iron (hydr)oxides, compared with larger particles such as quartz, facilitates the fixation and protection of microbes within microaggregates (Kögel-Knabner et al., 2008), thus creating a favorable environment for bacteria, which can be found in soil pores not bigger than 1 μm (Watt et al., 2006b), i.e., the typical size of a bacterium.
In the present study, iron oxides were identified as significant binding agents at the root-soil interface by (1) forming bridges between quartz grains and root cells (Figure 2A) and (2) being building constituents of organo-mineral microaggregates in the rhizosphere (Figure 2). The binding of organic matter to mineral surfaces, including oxides, has been reviewed in the literature (Kögel-Knabner et al., 2008) and more recently directly observed at the microscale (Xiao et al., 2015; Mueller et al., 2017). Iron oxides also represent an essential source of iron for plants and microorganisms in the rhizosphere. Specific mechanisms, such as acidification, reduction, and/or chelation increase iron dissolution and bioavailability in the rhizosphere (Robin et al., 2008). Thus, iron oxides were identified as key components of the rhizosphere, serving as binding agent as well as a potential source of iron for plants and microorganisms. Interestingly, quartz grains, normally described as minor agents for organo-mineral associations, showed patches of organic coatings at their surroundings (Figures 2A–C). Those patches had 13C:12C ratios close to natural abundance with a single spot slightly enriched in 13C (Figure 8). Thus, most of the mineral associated OC is represented by native OC rather than derived from the labeled wheat root. This observation supports the idea that most of the C released by the plant is directly transferred to the living microbial community without being directly sorbed to the mineral phase (Kaiser et al., 2015). This indicates a lag phase between the release of OC by rhizodeposition and the allocation of microbial-derived OC into organo-mineral associated OC in the rhizosphere.
We confirmed that photosynthesis-derived OC was transferred to microorganisms located in the direct root vicinity. As expected, microorganisms, together with soil particles, especially iron oxides, formed microaggregates close to the root surface. We are proposing a conceptual model depicting the fate of carbon at biogeochemical interfaces in the rhizosphere at the forefront of the growing root (Figure 9). There is a complex interplay between stabilizing agents which protect plant-derived OC in the rhizosphere, and vectors leading to a transfer of plant-derived OC into root-free soil. Vectors of carbon are represented by (1) roots, transferring the carbon through their cell walls, (2) fungi, extending the root exploration space, and (3) microorganisms, including bacteria, feeding on plant-derived C at the root surface and participating to form a favorable environment for carbon protection in soil microstructures. These microstructures arise from the intimate association of organic substances (e.g., bacteria and their exudates, rhizodeposits) and mineral particles (e.g., quartz grains, clay particles, iron (hydr)oxides). Iron (hydr)oxides located around roots have a tremendous role in the rhizosphere by closely associating with microorganisms enclosed within microaggregates and by forming bridges with larger mineral particles. Thus, iron oxides can be assumed to have a stabilizing effect on the soil structure in natural rhizospheres. These processes, favoring the transfer and the potential protection of carbon in soil microstructures, are magnified by the physical pressure exerted by roots, enhancing the close contact of soil minerals and soil organic compartments.
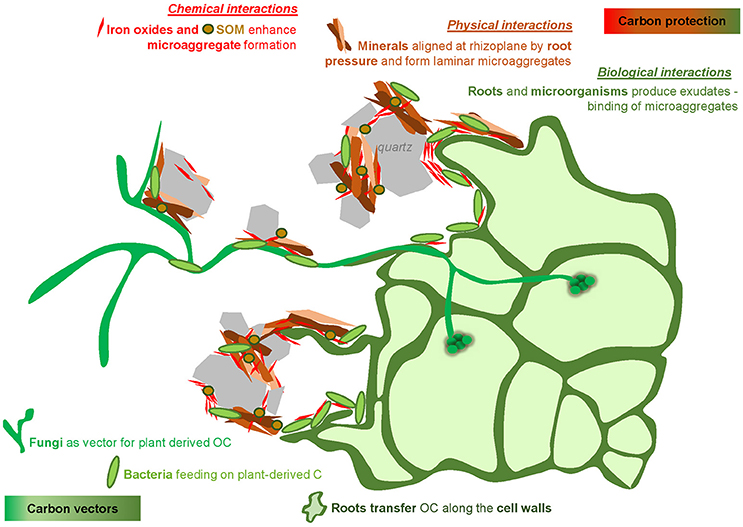
Figure 9. Conceptual model illustrating the complex interplay between vectors (roots, fungi, bacteria) leading to a transfer of plant-derived OC into root-free soil and stabilizing agents (iron oxides, root and microorganism products) which protect plant-derived OC in the rhizosphere.
Author Contributions
AV collected and analyzed nanoSIMS data, wrote the manuscript, and insured the exchange between all co-authors. JH designed and performed field experimentation and wrote the paper, JH and SFB designed sampling procedures and processed samples, TI processed and analyzed samples, JM and AG supervised the field experiment from which the samples were collected. CH performed nanoSIMS analyses and gave technical support. SS conducted FIB-SEM analyses and output data. CM prepared the samples for nanoSIMS, supervised the analyses, and wrote the manuscript. All authors discussed the results and commented on the manuscript.
Funding
Funding by the Swiss National Science Foundation (SNSF), grant No. 406840-143060, as part of the National Research Program NRP68 “Soil as a Resource” is greatly acknowledged. SFB was funded with the latter program [grant no. 143097] and TI was funded by an International short visit grant of the SNSF [grant no. IZK0Z3_164397]. The work was also funded by the Deutsche Forschungsgemeinschaft (DFG), grant No.: MU3021-4/2, as part of the research unit “FOR1806: The Forgotten Part of Carbon Cycling: Organic Matter Storage and Turnover in Subsoils.” We also thank the DFG for funding the nanoSIMS instrument [KO 1035/38-1].
Conflict of Interest Statement
There are no personal, professional or financial relationships that could potentially be construed as a conflict of interest in the present study.
Acknowledgments
We thank Barbara Orth and Swidran Kanapathipillai for support during field work. Johann Lugmeier is acknowledged for the assistance on the NanoSIMS analyses. We thank Andreas Pfeifer for giving us the access to the FIB-SEM at the ZEISS Microscopy Customer Center Europe in Oberkochen.
Supplementary Material
The Supplementary Material for this article can be found online at: https://www.frontiersin.org/articles/10.3389/fenvs.2018.00009/full#supplementary-material
References
Abràmoff, M. D., Magalhães, P. J., and Ram, S. J. (2004). Image processing with imagej. Biophoton. Int. 11, 36–42. Available online at: https://dspace.library.uu.nl/handle/1874/204900
Alexander, F. E., and Jackson, R. M. (1954). Examination of soil micro-organisms in their natural environment. Nature 174, 750–751. doi: 10.1038/174750b0
Artursson, V., Finlay, R. D., Jansson, J. K., Artursson, V., Finlay, R. D., and Jansson, J. K. (2006). Interactions between arbuscular mycorrhizal fungi and bacteria and their potential for stimulating plant growth. Environ. Microbiol. 8, 1–10. doi: 10.1111/j.1462-2920.2005.00942.x
Baldock, J., and Skjemstad, J. (2000). Role of the soil matrix and minerals in protecting natural organic materials against biological attack. Org. Geochem. 31, 697–710. doi: 10.1016/S0146-6380(00)00049-8
Bardgett, R. D., Mommer, L., and De Vries, F. T. (2014). Going underground: root traits as drivers of ecosystem processes. Trends Ecol. Evol. 29, 692–699. doi: 10.1016/j.tree.2014.10.006
Bertin, C., Yang, X., and Weston, L. A. (2003). The role of root exudates and allelochemicals in the rhizosphere. Plant Soil 256, 67–83. doi: 10.1023/A:1026290508166
Bronick, C. J., and Lal, R. (2005). Soil structure and management: a review. Geoderma 124, 3–22. doi: 10.1016/j.geoderma.2004.03.005
Castorena, E. V. G., del Carmen Gutiérrez-Castorena, M., Vargas, T. G., Bontemps, L. C., Martínez, J. D., Méndez, E. S., et al. (2016). Micromapping of microbial hotspots and biofilms from different crops using digital image mosaics of soil thin sections. Geoderma 279, 11–21. doi: 10.1016/j.geoderma.2016.05.017
Chenu, C. (1989). Influence of a fungal polysaccharide, scleroglucan, on clay microstructures. Soil Biol. Biochem. 21, 299–305. doi: 10.1016/0038-0717(89)90108-9
Cotrufo, M. F., Soong, J. L., Horton, A. J., Campbell, E. E., Haddix, M. L., and Partonet, W. J. (2015). Formation of soil organic matter via biochemical and physical pathways of litter mass loss. Nat. Geosci. 8, 776–779. doi: 10.1038/ngeo2520
De Deyn, G., Quirk, H., Oakley, S., Ostle, N., and Bardgett, R. D. (2011). Rapid transfer of photosynthetic carbon through the plant-soil system in differently managed species-rich grasslands. Biogeosciences 8, 1131–1139. doi: 10.5194/bg-8-1131-2011
Dickie, I. A., Martínez-García, L. B., Koele, N., Grelet, G.-A., Tylianakis, J. M., Peltzer, D. A., et al. (2013). Mycorrhizas and mycorrhizal fungal communities throughout ecosystem development. Plant Soil 367, 11–39. doi: 10.1007/s11104-013-1609-0
Emerson, D., Weiss, J. V., Megonigal, J. P., Emerson, D., Weiss, J. V., and Megonigal, J. P. (1999). Iron-oxidizing bacteria are associated with ferric hydroxide precipitates (fe-plaque) on the roots of wetland plants. Appl. Environ. Microbiol. 65, 2758–2761.
Esperschütz, J., Buegger, F., Winkler, J. B., Munch, J. C., Schloter, M., and Gattinger, A. (2009). Microbial response to exudates in the rhizosphere of young beech trees (fagus sylvatica l.) after dormancy. Soil Biol. Biochem. 41, 1976–1985. doi: 10.1016/j.soilbio.2009.07.002
Farrar, J., Hawes, M., Jones, D., and Lindow, S. (2003). How roots control the flux of carbon to the rhizosphere. Ecology 84, 827–837. doi: 10.1890/0012-9658(2003)084[0827:HRCTFO]2.0.CO;2
Finzi, A. C., Abramoff, R. Z., Spiller, K. S., Brzostek, E. R., Darby, B. A., Kramer, M. A., et al. (2015). Rhizosphere processes are quantitatively important components of terrestrial carbon and nutrient cycles. Glob. Chang. Biol. 21, 2082–2094. doi: 10.1111/gcb.12816
Flisch, R., Sinaj, S., Charles, R., and Richner, W. (2009). Grundlagen für die düngung im acker- und futterbau. Agrarforschung 16, 6–31. Available online at: https://www.agrarforschungschweiz.ch/archiv_11de.php?id_artikel=1449
Foster, R., and Rovira, A. (1976). Ultrastructure of wheat rhizosphere. New Phytol. 76, 343–352. doi: 10.1111/j.1469-8137.1976.tb01469.x
Ghezzehei, T. A., and Albalasmeh, A. A. (2015). Spatial distribution of rhizodeposits provides built-in water potential gradient in the rhizosphere. Ecol. Modell. 298, 53–63. doi: 10.1016/j.ecolmodel.2014.10.028
Hallett, P. D., Karim, K. H., Glyn Bengough, A., and Otten, W. (2013). Biophysics of the vadose zone: from reality to model systems and back again. Vadose Zone J. 12:vzj2013.05.0090. doi: 10.2136/vzj2013.05.0090
Hinsinger, P., Bengough, A. G., Vetterlein, D., and Young, I. M. (2009). Rhizosphere: biophysics, biogeochemistry and ecological relevance. Plant Soil 321, 117–152. doi: 10.1007/s11104-008-9885-9
Jakobsen, I., and Rosendahl, L. (1990). Carbon flow into soil and external hyphae from roots of mycorrhizal cucumber plants. New Phytol. 115, 77–83. doi: 10.1111/j.1469-8137.1990.tb00924.x
Johnson, D., Leake, J. R., Ostle, N., Ineson, P., and Read, D. J. (2002). In situ13co2 pulse-labelling of upland grassland demonstrates a rapid pathway of carbon flux from arbuscular mycorrhizal mycelia to the soil. New Phytol. 153, 327–334. doi: 10.1046/j.0028-646X.2001.00316.x
Jones, D. L., Hodge, A., and Kuzyakov, Y. (2004). Plant and mycorrhizal regulation of rhizodeposition. New Phytol. 163, 459–480. doi: 10.1111/j.1469-8137.2004.01130.x
Jones, D. L., Nguyen, C., and Finlay, R. D. (2009). Carbon flow in the rhizosphere: carbon trading at the soil–root interface. Plant Soil 321, 5–33. doi: 10.1007/s11104-009-9925-0
Kaiser, C., Kilburn, M. R., Clode, P. L., Fuchslueger, L., Koranda, M., Cliff, J. B., et al. (2015). Exploring the transfer of recent plant photosynthates to soil microbes: mycorrhizal pathway vs direct root exudation. New Phytol. 205, 1537–1551. doi: 10.1111/nph.13138
Kallenbach, C. M., Frey, S. D., and Grandy, A. S. (2016). Direct evidence for microbial-derived soil organic matter formation and its ecophysiological controls. Nat. Commun. 7:13630. doi: 10.1038/ncomms13630
Keiluweit, M., Bougoure, J. J., Nico, P. S., Pett-Ridge, J., Weber, P. K., and Kleber, M. (2015). Mineral protection of soil carbon counteracted by root exudates. Nat. Clim. Chang. 5, 588–595. doi: 10.1038/nclimate2580
Keiluweit, M., Nico, P. S., Kleber, M., and Fendorf, S. (2016). Are oxygen limitations under recognized regulators of organic carbon turnover in upland soils? Biogeochemistry 127, 157–171. doi: 10.1007/s10533-015-0180-6
Kögel-Knabner, I., and Amelung, W. (2014). “12.7-Dynamics, chemistry, and preservation of organic matter in soils,” in Treatise on Geochemistry, 2nd Edn., eds K. Turekian and H. Holland (Oxford: Elsevier), 157–215. doi: 10.1016/B978-0-08-095975-7.01012-3
Kögel-Knabner, I., Guggenberger, G., Kleber, M., Kandeler, E., Kalbitz, K., Scheu, S., et al. (2008). Organo-mineral associations in temperate soils: integrating biology, mineralogy, and organic matter chemistry. J. Plant Nutr. Soil Sci. 171, 61–82. doi: 10.1002/jpln.200700048
Kölbl, A., Schweizer, S. A., Mueller, C. W., Höschen, C., Said-Pullicino, D., Romani, M., et al. (2017). Legacy of rice roots as encoded in distinctive microsites of oxides, silicates, and organic matter. Soils 1:2. doi: 10.3390/soils1010002
Kuzyakov, Y., and Blagodatskaya, E. (2015). Microbial hotspots and hot moments in soil: concept and review. Soil Biol. Biochem. 83, 184–199. doi: 10.1016/j.soilbio.2015.01.025
Kuzyakov, Y., and Domanski, G. (2000). Carbon input by plants into the soil. Rev. J. Plant Nutr. Soil Sci. 163, 421–431. doi: 10.1002/1522-2624(200008)163:4<421::AID-JPLN421>3.0.CO;2-R
Kuzyakov, Y., and Larionova, A. A. (2005). Root and rhizomicrobial respiration: a review of approaches to estimate respiration by autotrophic and heterotrophic organisms in soil. J. Plant Nutr. Soil Sci. 168, 503–520. doi: 10.1002/jpln.200421703
Lal, R. (2004). Soil carbon sequestration impacts on global climate change and food security. Science 304, 1623–1627. doi: 10.1126/science.1097396
Lange, M., Eisenhauer, N., Sierra, C. A., Bessler, H., Engels, C., Griffiths, R. I., et al. (2015). Plant diversity increases soil microbial activity and soil carbon storage. Nat. Commun. 6:6707. doi: 10.1038/ncomms7707
Lehmann, A., Zheng, W., and Rillig, M. C. (2017). Soil biota contributions to soil aggregation. Nat. Ecol. Evol. 1, 1828–1835. doi: 10.1038/s41559-017-0344-y
Li, Y., Dick, W. A., and Tuovinen, O. H. (2003). Evaluation of fluorochromes for imaging bacteria in soil. Soil Biol. Biochem. 35, 737–744. doi: 10.1016/S0038-0717(02)00196-7
Liang, C., and Balser, T. C. (2011). Microbial production of recalcitrant organic matter in global soils: implications for productivity and climate policy. Nat. Rev. Microbiol. 9, 75–75. doi: 10.1038/nrmicro2386-c1
Martin, J., and Foster, R. (1985). A model system for studying the biochemistry and biology of the root-soil interface. Soil Biol. Biochem. 17, 261–269. doi: 10.1016/0038-0717(85)90058-6
Marx, M., Buegger, F., Gattinger, A., Zsolnay, Á., and Munch, J. C. (2007). Determination of the fate of 13c labelled maize and wheat exudates in an agricultural soil during a short-term incubation. Eur. J. Soil Sci. 58, 1175–1185. doi: 10.1111/j.1365-2389.2007.00911.x
Mayer, J., Gunst, L., Mäder, P., Samson, M.-F., Carcea, M., Narducci, V., et al. (2015). Productivity, quality and sustainability of winter wheat under long-term conventional and organic management in switzerland. Eur. J. Agron. 65, 27–39. doi: 10.1016/j.eja.2015.01.002
McCully, M., and Canny, M. (1985). Localisation of translocated 14c in roots and root exudates of field-grown maize. Physiol. Plant. 65, 380–392. doi: 10.1111/j.1399-3054.1985.tb08661.x
Morris, J. K. (1965). A formaldehyde glutaraldehyde fixative of high osmolality for use in electron microscopy. J. Cell Biol. 27, 137.
Mueller, C. W., Hoeschen, C., Steffens, M., et al. (2017). Microscale soil structures foster organic matter stabilization in permafrost soils. Geoderma 293, 44–53. doi: 10.1016/j.geoderma.2017.01.028
Mueller, C. W., Kölbl, A., Hoeschen, C., Hillion, F., Heister, K., Herrmann, A. M., et al. (2012). Submicron scale imaging of soil organic matter dynamics using nanosims - from single particles to intact aggregates. Org. Geochem. 42, 1476–1488. doi: 10.1016/j.orggeochem.2011.06.003
Nunan, N., Ritz, K., Crabb, D., Harris, K., Wu, K., Crawford, J. W., et al. (2001). Quantification of the in situ distribution of soil bacteria by large-scale imaging of thin sections of undisturbed soil FEMS Microbiology. Ecology 37, 67–77. doi: 10.1111/j.1574-6941.2001.tb00854.x
Oburger, E., and Schmidt, H. (2016). New methods to unravel rhizosphere processes. Trends Plant Sci. 21, 243–255. doi: 10.1016/j.tplants.2015.12.005
Pett-Ridge, J., and Firestone, M. K. (2017). Using stable isotopes to explore root-microbe-mineral interactions in soil. Rhizosphere 3(Pt 2), 244–253. doi: 10.1016/j.rhisph.2017.04.016
Philippot, L., Raaijmakers, J. M., Lemanceau, P., and van der Putten, W. H. (2013). Going back to the roots: the microbial ecology of the rhizosphere. Nat. Rev. Microb. 11, 789–799. doi: 10.1038/nrmicro3109
Polerecky, L., Adam, B., Milucka, J., Musat, N., Vagner, T., and Kuypers, M. M. (2012). Look@nanosims–a tool for the analysis of nanosims data in environmental microbiology. Environ. Microbiol. 14, 1009–1023. doi: 10.1111/j.1462-2920.2011.02681.x
Ranjard, L., and Richaume, A. (2001). Quantitative and qualitative microscale distribution of bacteria in soil. Res. Microbiol. 152, 707–716. doi: 10.1016/S0923-2508(01)01251-7
Rasse, D. P., Rumpel, C., and Dignac, M.-F. (2005). Is soil carbon mostly root carbon? Mechanisms for a specific stabilisation. Plant Soil 269, 341–356. doi: 10.1007/s11104-004-0907-y
R Core Team (2017). R: A Language and Environment for Statistical Computing. Vienna: R Foundation for Statistical Computing. Available online at: www.R-project.org
Rillig, M. C., and Mummey, D. L. (2006). Mycorrhizas and soil structure. New Phytol. 171, 41–53. doi: 10.1111/j.1469-8137.2006.01750.x
Robin, A., Vansuyt, G., Hinsinger, P., Meyer, J. M., Briat, J. F., and Lemanceau, P. (2008). Iron dynamics in the rhizosphere: consequences for plant health and nutrition. Adv. Agron. 99, 183–225. doi: 10.1016/S0065-2113(08)00404-5
Rousk, J., and Bååth, E. (2011). Growth of saprotrophic fungi and bacteria in soil. FEMS Microbiol. Ecol. 78, 17–30. doi: 10.1111/j.1574-6941.2011.01106.x
Rovira, A. D. (1973). Zones of exudation along plant roots and spatial distribution of micro-organisms in the rhizosphere. Pest Manag. Sci. 4, 361–366. doi: 10.1002/ps.2780040313
Sauer, D., Kuzyakov, Y., and Stahr, K. (2006). Short communication spatial distribution of root exudates of five plant species as assessed by 14c labeling. J. Plant Nutr. Soil Sci. 169, 360–362. doi: 10.1002/jpln.200621974
Scheublin, T. R., Sanders, I. R., Keel, C., van der Meer, J. R., and Scheublin, T. R. (2010). Characterisation of microbial communities colonising the hyphal surfaces of arbuscular mycorrhizal fungi. ISME J. 4, 752–763. doi: 10.1038/ismej.2010.5
Schmidt, M. W., Torn, M. S., Abiven, S., Dittmar, T., Guggenberger, G., Janssens, I. A., et al. (2011). Persistence of soil organic matter as an ecosystem property. Nature 478, 49–56. doi: 10.1038/nature10386
Six, J., Frey, S., Thiet, R., and Batten, K. M. (2006). Bacterial and fungal contributions to carbon sequestration in agroecosystems. Soil Sci. Soc. Am. J. 70, 555–569. doi: 10.2136/sssaj2004.0347
Thévenaz, P., and Unser, M. (2007). User-friendly semiautomated assembly of accurate image mosaics in microscopy. Microsc. Res. Tech. 70, 135–146. doi: 10.1002/jemt.20393
Van der Heijden, M. G., Klironomos, J. N., Ursic, M., Moutoglis, P., Streitwolf-Engel, R., Boller, T., et al. (1998). Mycorrhizal fungal diversity determines plant biodiversity, ecosystem variability and productivity. Nature 396, 69–72. doi: 10.1038/23932
Vidal, A., Remusat, L., Watteau, F., Derenne, S., and Quenea, K. (2016). Incorporation of 13c labelled shoot residues in lumbricus terrestris casts: a combination of transmission electron microscopy and nanoscale secondary ion mass spectrometry. Soil Biol. Biochem. 93, 8–16. doi: 10.1016/j.soilbio.2015.10.018
Wagg, C., Jansa, J., Stadler, M., Schmid, B., and van der Heijden, M. G. (2011). Mycorrhizal fungal identity and diversity relaxes plant-plant competition. Ecology 92, 1303–1313. doi: 10.1890/10-1915.1
Warmink, J. A., Nazir, R., Corten, B., and van Elsas, J. D. (2011). Hitchhikers on the fungal highway: the helper effect for bacterial migration via fungal hyphae. Soil Biol. Biochem. 43, 760–765. doi: 10.1016/j.soilbio.2010.12.009
Watt, M., Hugenholtz, P., White, R., and Vinall, K. (2006a). Numbers and locations of native bacteria on field-grown wheat roots quantified by fluorescence in situ hybridization (fish). Environ. Microbiol. 8, 871–884. doi: 10.1111/j.1462-2920.2005.00973.x
Watt, M., Silk, W. K., and Passioura, J. B. (2006b). Rates of root and organism growth, soil conditions, and temporal and spatial development of the rhizosphere. Ann. Bot. 97, 839–855. doi: 10.1093/aob/mcl028
White, P. J., George, T. S., Gregory, P. J., Bengough, A. G., Hallett, P. D., and McKenzie, B. M. (2013). Matching roots to their environment. Ann. Bot. 112, 207–222. doi: 10.1093/aob/mct123
Worrich, A., Stryhanyuk, H., Musat, N., König, S., Banitz, T., Centler, F., et al. (2017). Mycelium-mediated transfer of water and nutrients stimulates bacterial activity in dry and oligotrophic environments. Nat. Commun. 8:15472. doi: 10.1038/ncomms15472
Xiao, J., Wen, Y., Li, H., Hao, J., Shen, Q., Ran, W., et al. (2015). In situ visualisation and characterisation of the capacity of highly reactive minerals to preserve soil organic matter (som) in colloids at submicron scale. Chemosphere 138, 225–232. doi: 10.1016/j.chemosphere.2015.05.089
Keywords: rhizosphere, microorganisms, iron oxides, organo-mineral associations, NanoSIMS, FIB-SEM, undisturbed samples, 13C enrichment
Citation: Vidal A, Hirte J, Bender SF, Mayer J, Gattinger A, Höschen C, Schädler S, Iqbal TM and Mueller CW (2018) Linking 3D Soil Structure and Plant-Microbe-Soil Carbon Transfer in the Rhizosphere. Front. Environ. Sci. 6:9. doi: 10.3389/fenvs.2018.00009
Received: 17 November 2017; Accepted: 26 January 2018;
Published: 09 February 2018.
Edited by:
Maria Luz Cayuela, Centro de Edafología y Biología Aplicada del Segura (CSIC), SpainReviewed by:
Eoin L. Brodie, Lawrence Berkeley National Laboratory (LBNL), United StatesLukas Van Zwieten, New South Wales Department of Primary Industries, Australia
Copyright © 2018 Vidal, Hirte, Bender, Mayer, Gattinger, Höschen, Schädler, Iqbal and Mueller. This is an open-access article distributed under the terms of the Creative Commons Attribution License (CC BY). The use, distribution or reproduction in other forums is permitted, provided the original author(s) and the copyright owner are credited and that the original publication in this journal is cited, in accordance with accepted academic practice. No use, distribution or reproduction is permitted which does not comply with these terms.
*Correspondence: Alix Vidal, YWxpeC52aWRhbEB3encudHVtLmRl