 Ling Zhou1
 Jiang-Bo Geng2*
- 1College of Mechanic and Electrical Engineering, Tarim University, Xinjiang, China
- 2School of Finance, Zhongnan University of Economics and Law, Wuhan, China
This paper decomposes daily crude oil shocks into demand shock, supply shock and risk shock. Then, it employs Diebold and Yilmaz connectedness index approach to explore the differences for the time-varying effect of different types of structural shocks on new energy stock markets in China, Europe and the United States during the period 10 June 2009–30 October 2018. The new findings show that: 1) There are time-varying features of structural shocks to all new energy markets. 2) The crude oil demand shock and risk shock have a large explanatory ability on the returns of all new energy stock markets, while the crude oil supply shock has a small impact. 3) The influences of crude oil demand shocks on the market returns of new energy in China, Europe and the United States are 1.31%, 8.64%, and 4.47%, respectively; however, the affection of crude oil risk shocks to the market returns of new energy in the same markets are 3.17%, 7.91%, and 21.51%, respectively. 4) The crude oil demand shock and supply shock have little impact on any new energy market volatilities, but the effects of crude oil risk shocks to China and the United States’ new energy market volatilities are 2.44% and 3.14%, respectively.
Introduction
The complex linkage mechanism for crude oil prices and new energy markets has always been of concern in various countries. Since crude oil acts as one of the significantly important primary energy for the economic activities of various countries, its price has an impact on new energy markets (Shi and Sun, 2017; Cheng et al., 2019). Crude oil prices remained high until August 2014, even reaching more than $135 per barrel. High crude oil prices prompted many countries to adopt active new energy policies to rapidly develop their own new energy. Beginning in August 2014, crude oil prices experienced a rapid decline, from over US$100 per barrel in August 2014 to just over $30 per barrel by February 2016, which to some extent alleviated the supply of fossil energy and restrained the rapid development of new energy (Albulescu et al., 2020; Ji et al., 2020; Luo et al., 2020; Shi and Shen, 2021). At the same time, in the context of global efforts to reduce climate emissions, increasing the rapid growth of new energy has become an important energy policy for many countries (Yu et al., 2021). However, due to differences in economic development level, energy and resource endowment, primary energy consumption structure and new energy policies, the effect of crude oil price shocks to new energy markets in various countries or regions may vary. Market investors pay special attention to the reaction of new energy markets in different countries or regions to the influence of crude oil prices. In particular, the evolution characteristics of the response of a new energy market to crude oil price shocks is of great concern when the level of oil prices stay high, low or in rapid decline. Therefore, the study of the dynamic effect of oil price shocks to new energy stock markets for different countries is conducive to a comprehensive grasp of the connectedness mechanism for oil market changes and the growth of the new energy industry. This is of value to market investors but also to new energy policymakers, to assist them in risk management of new energy markets and in optimizing new energy development policies.
There has been a great deal of literature analyzing the influence of crude oil prices to the new energy industry using various econometric models. Considering that the rapid growth of new energy is dependent on technological breakthroughs to a large extent, some scholars have combined crude oil prices, technology stocks and new energy for research. Kumar et al. (2012) found that both crude oil prices and technology stocks had an impact on new energy stocks. Sadorsky (2012) used a multiple GARCH model to analyze the volatility spillover between crude oil prices, new energy stocks and technology stocks, and the research found that the correlation for new energy and technology stocks was higher than that for new energy stocks and crude oil prices. Managi and Okimoto (2013) analyzed the linakge between crude oil prices, new energy and technology stocks using a Markov-regime switching vector autoregression model and found that after 2007, there was a positive linkage for crude oil prices and new energy stocks. Many other scholars have focused on the role of oil prices in changes in new energy markets. Reboredo (2015) found that crude oil prices devoted 30% to the downside and upside risks for renewable energy stocks. Dutta (2017) analyzed the effect of crude oil volatility index on a new energy stock market and found that the new energy stock market was highly sensitive to the effect of the crude oil price volatility index. Reboredo and Ugolini (2018) analyzed the quantile impact of crude oil, natural gas, coal and electricity to new energy stocks using the Vine–Copula dependence method and found that crude oil played an important role in dynamic changes of new energy stocks for the United States and Europe. Shah et al. (2018) found a strong correlation for crude oil and renewable energy in Norway and the United States but not in the United Kingdom. Pham (2019) analyzed whether the linkage of the prices of crude oil and the different categories of new energy stocks was homogeneous; this study found that the link between the prices of crude oil and the different categories of new energy stocks was heterogeneous. Corbet et al. (2020) showed that the decline of crude oil prices during the COVID-19 period had a positive spillover effect on the new energy market. Dawar et al. (2021) used the quantile regression method to analyze the dependency link between WTI crude oil prices and new energy stocks; they showed that the affection of the lag return of crude oil prices to new energy stocks was significant and also found that the affection of crude oil returns on new energy stocks was asymmetric.
Furthermore, due to the fact that investors consider different portfolio strategies on short-term and long-term timescales, some scholars analyzed the impact mechanism of crude oil prices on new energy markets from the perspective of multiple timescales. Bondia et al. (2016) analyzed the link between new energy stocks and crude oil prices by the threshold co-integration test and found that crude oil prices had an affection on new energy in the short term but did not have such an impact in the long term. Reboredo et al. (2017) used the wavelet analysis model to investigate the correlation and causal link for crude oil and renewable energy, and they showed that the correlation of crude oil and renewable energy stocks was weak on a short timescale, however, the correlation gradually increased as the timescale grew longer. Ferrer et al. (2018) analyzed the time-frequency connectivity between U.S. new energy stocks and oil prices, and found that crude oil prices did not appear to be the main driver of new energy on the short or long scales. Maghyereh et al. (2019) used the wavelet analysis and multiple GARCH methods to investigate the link between oil prices and new energy stocks on multi-dimensional timescales and found that there was a significant return and risk transmission relationship from crude oil to new energy stock markets, which was found to be more significant on a long timescale. Nasreen et al. (2020) analyzed the dynamic connectivity of crude oil prices and new energy stocks by using wavelet analysis and spillover analysis methods; they found that crude oil prices and new energy stocks showed a weak correlation in the time–frequency domains. Zhang et al. (2020) analyzed the affection of structural oil price shocks on new energy stocks by using the quantile regression method based on the wavelet analysis and quantile Granger causality methods and showed that oil supply shocks had a strong affection on new energy stocks in both the short and long terms.
The above literature has analyzed the relationship mechanism between the crude oil price and new energy stock markets and drawn many meaningful conclusions. In this study, the new decomposition method of crude oil shocks proposed by Ready (2018) is adopted to expand the research perspective of the previous literature. Oil price shocks are decomposed into demand shock, supply shock and risk shock. Meanwhile, daily data—not used in previous studies—are used to analyze the affection of various types of crude oil price shocks to the new energy markets. Furthermore, unlike previous studies that mainly focused on the new energy markets in the United States and Europe, this paper also includes the new energy market in China, so that the information transmission mechanism of the decomposed crude oil price shocks to different new energy markets can be more comprehensively compared. Moreover, the DY connectedness index method is adopted to capture the evolutionary characteristics of the affection of different types of crude oil price shocks on new energy stock markets (Diebold and Yilmaz, 2014). At the same time, considering that the reaction of a new energy market to the structural shocks of crude oil prices may be quite different during periods of high, rapid decline and low crude oil prices, this paper further divides the research samples into high, rapid decline and low periods of crude oil prices in the light of the evolution characteristics of crude oil prices. Compared with the previous literature, this paper makes the following four contributions. 1) From a new insight, this study analyses the shocks of crude oil prices on new energy markets adopting a new decomposition method of structural crude oil price shocks. 2) Considering the differences of new energy development across Asian, North American and European regions, this paper selects China, Europe and the United States and as the research samples in order to comprehensively understand the oil shock mechanism. 3) This paper captures the time-varying trend of the structural oil price shocks on new energy markets. 4) This paper compares the impact of demand shock, supply shock and risk shock of crude oil prices on different new energy markets during periods of high, rapid decline and low crude oil prices.
Method and Data Sources
DY Connectedness Index
In this paper, the DY connectedness index is used to analyze the affection of different types of structural crude oil price shocks on the new energy markets in China, Europe and the United States. The DY connectedness index is based on the generalized variance decomposition obtained by the vector autoregression (VAR) model (Diebold and Yilmaz, 2014), which can clearly analyze the complex relationships between financial variables (Zhang et al., 2018; Geng et al., 2020; Hu et al., 2020; Geng et al., 2021). In this paper, a VAR model is firstly constructed to analyze the dynamic link between different types of crude oil price shocks and new energy markets. The constructed VAR model is as follows:
where
The connectedness matrix is obtained based on the generalized forecast error variance decomposition (Pesaran and Shin, 1998). Then, θij(H) can be expressed as follows:
θij(H) indicates the contribution of the variable j to the variable i. Referring to the study of Diebold and Yilmaz (2014), the total connectedness degree is expressed as
Data Sources
In this paper, the new energy stock indices of China, Europe and the United States are adopted to represent the development level of their new energy industries, namely China’s New Energy Index (CNNE), the European Renewable Energy Index (ERIX) for E.U. and the WilderHill Clean Energy Index (ECO) for the U.S.A. Considering the availability of data, China’s New Energy Index started at the beginning of 10 June 2009, so the data range of the research sample in this paper is from 10 June 2009 to 30 October 2018. China’s New Energy Index is extracted from the Great Wisdom market software, and all other data is extracted from the Datastream database (Malik and Umar, 2019). The return series is obtained by multiplying logarithmic difference by 100, and the volatility series is obtained from the square of returns. Table 1 shows the descriptive statistics of the demand shock, supply shock and risk shock series of crude oil prices and the new energy index return series of China, Europe and the United States. It can be seen that the standard deviation of risk shock is the largest, and the significance of the Jarque–Bera value of all time series is less than 5%, indicating that none of the time series obeys the normal distribution. Table 2 shows the results of a unit root test for all the time series. The unit root test mainly includes the ADF unit root test, the PP unit root test and Zivot–Andrews unit root test with one structural break point (Zivot and Andrews, 1992). The results of the three types of unit root test show that all of time series are stationary.

TABLE 1. Descriptive analysis of oil shocks and new energy returns.
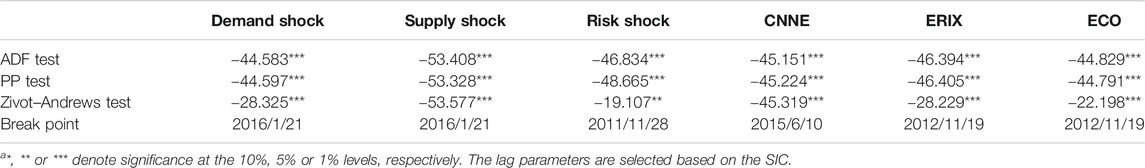
TABLE 2. The results of the three types of unit root test.
Empirical Results and Analysis
Connectedness Analysis for Returns
Table 3 shows the connectedness matrix for the crude oil price shocks and the new energy indices, and the total connectedness index of the connectedness matrix is 25.22%. CNNE, ERIX and ECO are explained to 1.31%, 8.64%, and 4.47% by the demand shock, respectively. These results show that the affection of demand shock on the new energy markets in China, Europe and the United States is 1.31%, 8.64%, and 4.47%, respectively. CNNE, ERIX, and ECO are explained to 0.56%, 0.05%, and 1.86% by the supply shock, respectively. These results show that the supply shock has little impact on these new energy markets in China, Europe and the United States. The explanations of crude oil price risk shock for CNNE, ERIX, and ECO are 3.17%, 7.91%, and 21.51%, respectively. These results show that the risk shock has a great impact on the new energy market of the United States but a small impact on the new energy market of China. In general, the risk shock has the greatest impact on the new energy markets followed by the crude oil demand shock, and the crude oil supply shock has a smaller impact. These conclusions are consistent with the studies of Reboredo and Ugolini (2018) and Dawar et al. (2021) finding that crude oil prices played an important role in dynamic changes of new energy stocks.
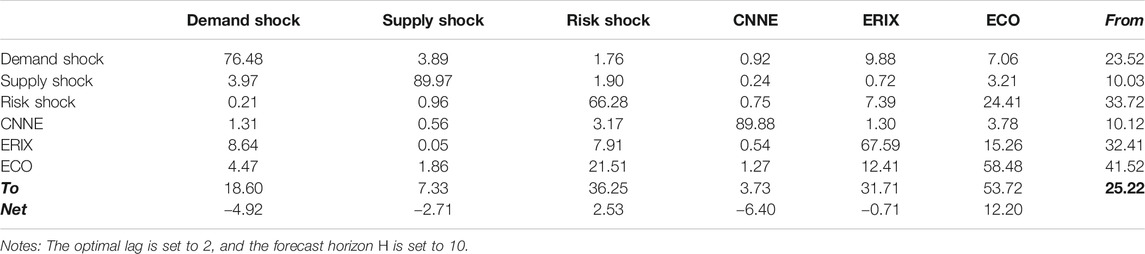
TABLE 3. The connectedness matrix for crude oil price shocks and new energy returns.
Figure 1 shows the connectedness for the crude oil price shocks and the new energy markets. The connectedness network diagram shows the impact of oil demand shock, supply shock and risk shock on the new energy indices in China, Europe and the United States. The arrows of the risk shock on the new energy indices are thick, which indicates that the risk shocks have a large impact on the new energy markets, having the largest effect on the ECO. Second, the crude oil demand shock also has an impact on the new energy indices in China, Europe and the United States, having the largest impact on the European ERIX. Finally, the arrows on the new energy indices for China, Europe and the United States. are thin, suggesting that the impact of the supply shock on all new energy markets is small. These conclusions are consistent with those in Table 1. The results using the sample data from the static perspective shows the degree of influence of the different crude oil price shocks on new energy markets. In order to further capture the dynamic of the crude oil price shocks for new energy, this paper will use the rolling window method to capture the evolutionary impacts of crude oil shocks on new energy.
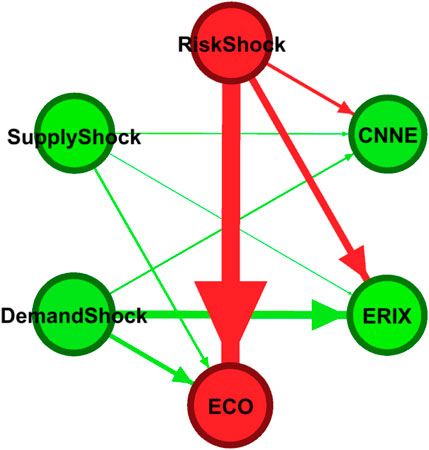
FIGURE 1. Directional net connectedness network of oil shocks and new energy returns.
Figure 2 shows the dynamic characteristics of the total connectedness index for the crude oil price shocks and the new energy indices under the rolling window condition. The rolling windows is set to 200 days. It can be found that the connection between crude oil shocks and new energy markets has obvious time-varying characteristics. During the study sample period, the total connectedness index shows an overall downward trend. With this, from April 2010 to June 2011, it shows a downward trend; from June 2011 to the beginning of 2012, it shows a rapid growth trend; from the beginning of 2012 to the beginning of 2015, it shows a rapid downward trend; from the beginning of 2015 to the middle of 2016, it shows a rapid upward trend; from the middle of 2016 to the middle of 2017, it shows a rapid downward trend; from mid-2017 to October 2018, it shows an upward trend.
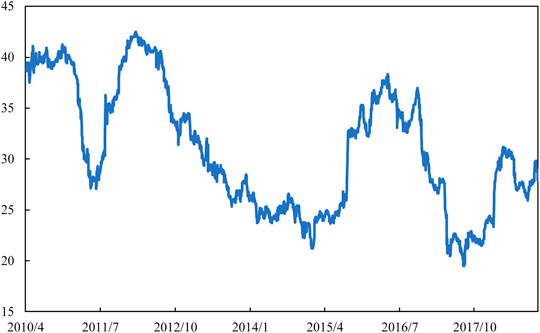
FIGURE 2. Total connectedness index between crude oil price shocks and new energy returns over time (The rolling window is set to 200 days1).
Figure 3 shows the time-varying connectedness characteristics of crude oil price demand shock, supply shock and risk shock, respectively. We can see that the influence of the crude oil price risk shocks on the new energy markets during most of the research sample stays at a high level, followed by the impact of oil demand shocks. The impact of oil supply shocks in most of the sample period stays at a lower level. This suggests that for most of the period in the research sample, crude oil price risk shocks could explain much of the change in the new energy markets, particularly as they have increased after 2018. The crude oil price demand shock partly explains the changes in the new energy markets between April 2010 and mid-2012, while its interpretation extent for new energy markets fell away after 2012. The degree to which the supply shock of crude oil prices explains the new energy markets is lower throughout the study sample period.
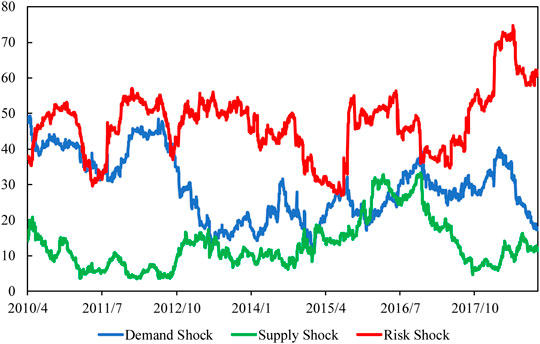
FIGURE 3. Demand, supply and risk shocks connectedness over time (The rolling window is set to 200 days)
Figure 4 shows the time-varying characteristics of the influence of different oil shocks on China’s CNNE, Europe’s ERIX and the United State’s ECO. The impacts of crude oil demand shock, supply shock and risk shock on China’s new energy market are relatively small during most of the study sample. From 2010 to the end of 2012, the European new energy market was greatly impacted by the crude oil price demand shock, and the risk shock impact on the European new energy market was larger than that on the Chinese new energy market; the impact of the supply shock on the European new energy market was smaller throughout the study period. The new energy market of the United States was most impacted by the crude oil price risk shock during the whole study sample. The impact of the demand shock from 2010 to the end of 2012 is similar to the demand shock impact on the European new energy market. The United State’s new energy market was relatively less impacted by the demand shock in other periods of the study sample. The influence of oil price supply shock to the United State’s new energy market is small in the study sample period, but at some points the crude oil price supply shock has a certain influence to this market.
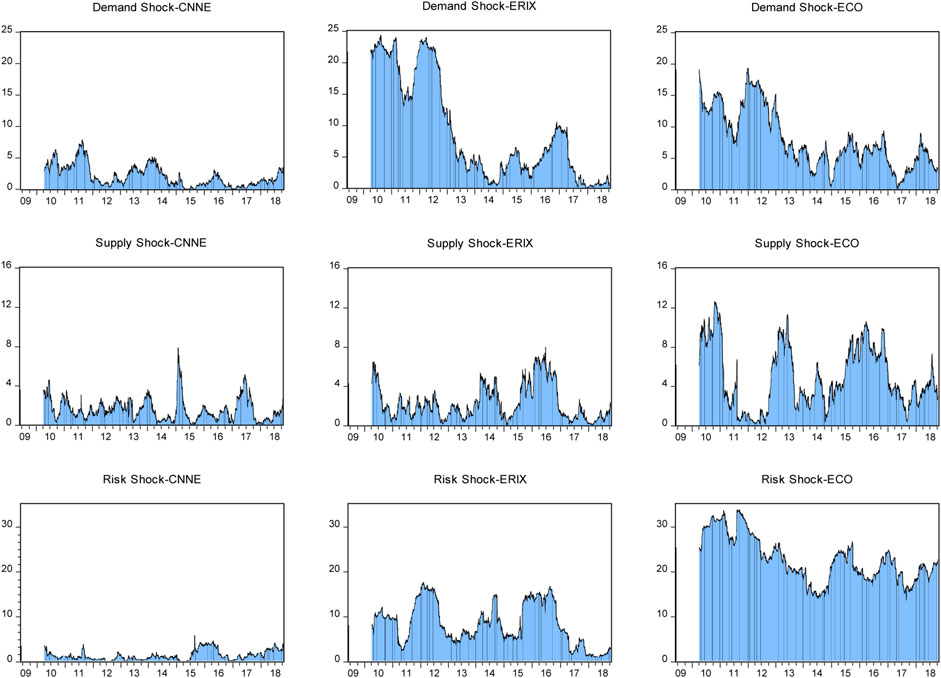
FIGURE 4. Dynamic directional connectedness from oil shocks to new energy returns.
Connectedness Analysis for Volatility
In addition, this study analyses the influence of structural crude oil price shocks to new energy markets’ volatilities. Table 4 shows the connectedness matrix between structural crude oil price shocks and new energy market’s volatilities. Its total connectedness index is 8.63%, significantly lower than the connectedness index of 25.22% in the return system. The explanation degree of crude oil price demand shock for China’s CNNE, Europe’s ERIX and the United State’s ECO is 0.06%, 0.30%, and 0.14% respectively. The explanation degree of crude oil price supply shock to China’s CNNE, Europe’s ERIX and America’s ECO is 0.23%, 0.11%, and 0.36%, respectively. These show that the demand shock and supply shock of crude oil prices have very little influence on the volatility of any new energy markets. The interpretation degree of crude oil price risk shock on China’s CNNE, Europe’s ERIX and the United State’s ECO is 2.44%, 0.58%, and 3.14%, respectively, indicating that crude oil price risk shock has almost no impact on Europe’s ERIX, while it has a small impact on China’s CNNE and the United State’s ECO. On the whole, the demand shock and supply shock of crude oil price have little affection to the volatilities of new energy markets, while the risk shock of crude oil prices has a small affection to the volatility of China’s CNNE and the United State’s ECO.
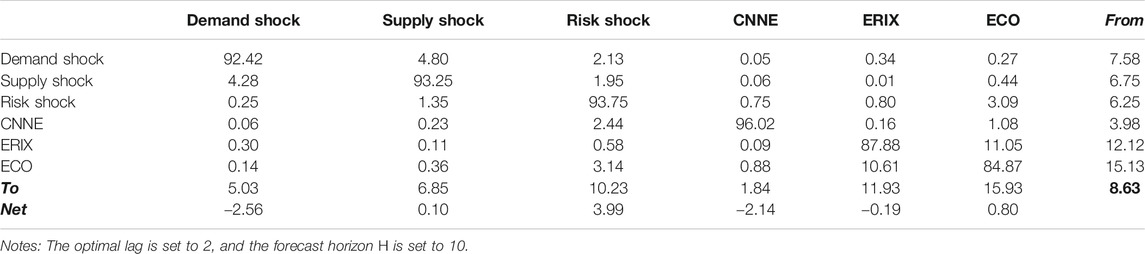
TABLE 4. Oil shocks and new energy volatility connectedness matrix.
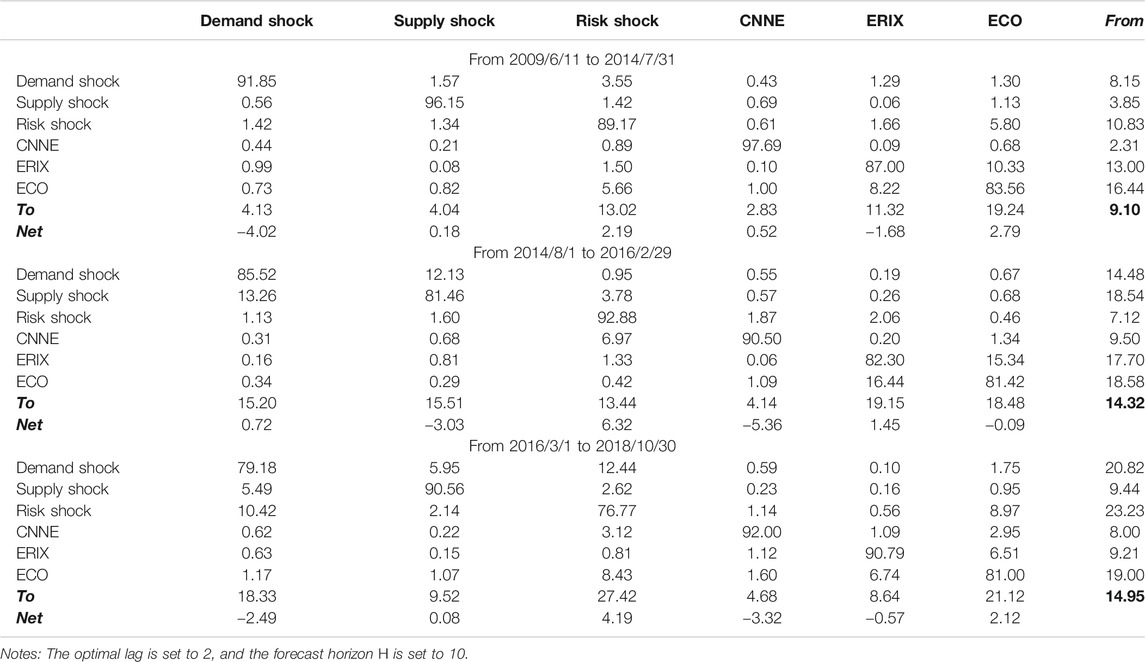
TABLE 5. Oil shocks and new energy returns connectedness matrix for different sub-samples.
Connectedness Analysis for Different Sub-Samples
Taking into account the period from June 11, 2009 to October 30, 2018 in the study sample, crude oil prices began a rapid decline from over $100 per barrel in August 2014 and did not begin their gradual recovery until March 2016. Starting from August 2014, crude oil entered the era of low oil prices, which was completely different from the period before August 2014. Based on the reference of Singh et al. (2018), the research samples of this paper were divided into three stages to capture the influence of crude oil price shocks to new energy markets at different stages. The study samples were divided as follows: the first stage is 11 June 2009–31 July 2014; the second stage is 1 August 2014–29 February 2016; the third stage is from March 3, 2016 to October 30, 2018. The sub-stages of crude oil prices are shown in Figure 5.
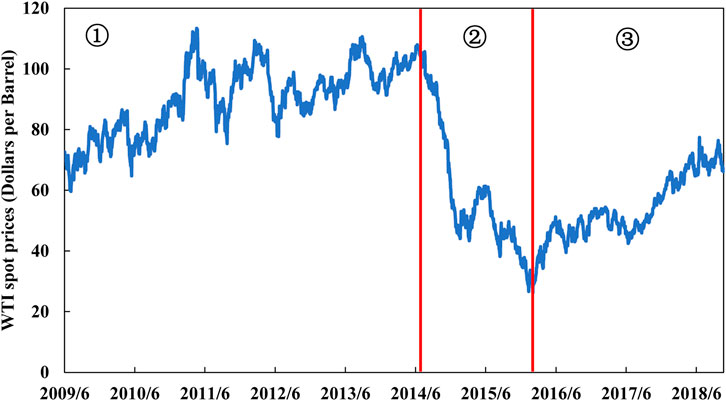
FIGURE 5. Trend of WTI prices.
Table 5 shows the connectedness matrix for oil price shocks and the new energy markets during the sub-samples. During the three sub-samples, the demand shock and supply shock of crude oil prices had little influence to the returns of all new energy markets. During the period of high crude oil prices (11 June 2009–31 July 2014), the crude oil price risk shock had little impact on the new energy markets in China and Europe, while its impact on the United State’s ECO new energy market was relatively large. During the period of rapid decline in crude oil prices (1 August 2014–29 February 2016), the crude oil price risk shock had a greater influence to the new energy market in China, while it had a lesser influence to the new energy market in Europe and the United States. During the period when crude oil prices were low (March 3, 2016 to October 30, 2018), the crude oil price risk shock had a greater influence to the new energy market in the United States, while it had a lesser influence to the new energy market in Europe and had a certain impact on the new energy market in China. In general, when the crude oil price is high, the crude oil risk shock has the greatest impact on the United State’s new energy market but has little impact on the Chinese new energy market. When crude prices fall rapidly, crude oil price risk shock has little impact on the United State’s new energy market but has the greatest impact on China’s new energy market. Whether crude prices are high, low or falling fast, the influence of crude price risk shocks to the European new energy market is minimal.
Figure 6 shows the connectedness network for crude oil price shocks and new energy market returns across the sub-samples. The influence of the crude oil price risk shock to the United State’s ECO is greatest during the period of high crude oil prices (11 June 2009–31 July 2014). During the period when crude oil prices are in rapid decline (1 August 2014–29 February 2016), crude oil price risk shock has the greatest impact on China’s CNNE. During the period when crude oil prices are low (March 3, 2016 to October 30, 2018), the crude oil price risk shock has the greatest impact on the United State’s ECO. These findings keep up with that of the connectedness matrix in the sub-stages above.
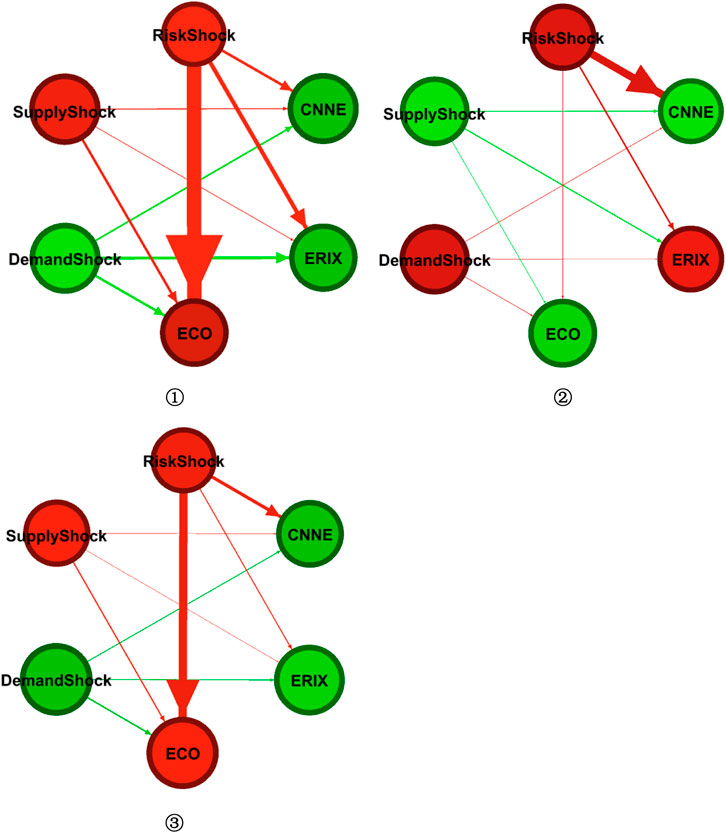
FIGURE 6. Directional net connectedness network of oil shocks and new energy returns for different sub-samples.
Robustness Check
In this paper, different H values and different rolling windows are used to analyze the robustness of the above results. The H value is set to 5, 10, and 15 days, respectively, and the rolling window is set to 150, 200, and 250 days, respectively. The total connectedness index results obtained with different H values and different rolling windows are shown in Figure 7. It can be seen from the results that the overall trends of the total connectedness index obtained with different H values and different rolling windows are consistent with that in Figure 2, which indicates that the results obtained with different H values and different rolling windows are basically consistent. In general, the results obtained in this paper are robust.
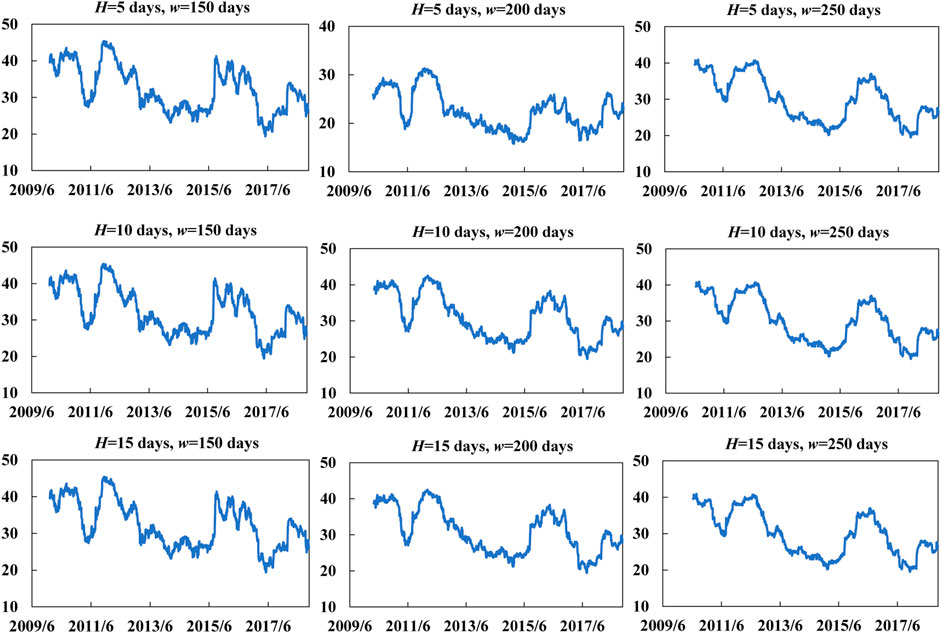
FIGURE 7. Sensitivity of total return connectedness to forecast horizons H and window widths w. (H = 5, 10, 15; w = 150, 200, 250).
Conclusion
This study adopts the new decomposition method of crude oil price shocks proposed by Ready (2018) to expand the linkage mechanism between structural crude oil prices and new energy markets in the previous literature. This study uses daily data to examine how different types of structural crude oil price shocks have affected the new energy stock markets in China, Europe and the United States from June 10, 2009 to October 30, 2018. This study finds that the demand shock of crude oil prices can explain all the changes of new energy stock markets, but the supply shock of crude oil prices has little explanatory power. The explanatory abilities of the crude oil price demand shock to the new energy stock markets in China, Europe and the United States are 1.31%, 8.64%, and 4.47%, respectively. However, the explanatory abilities of the crude oil price risk shock to the same markets are 3.17%, 7.91%, and 21.51% respectively. Meanwhile, the demand and supply shocks of crude oil prices have little influence to the volatilities of all new energy stock markets, but the risk shock of crude oil prices has a certain influence to the volatilities of the new energy stock markets in China and United States. Furthermore, the rolling window method is used to find that the influence of structural crude oil price shocks to the new energy markets is time-varying. In the staged analysis, when the crude oil price was high, the risk shock had the greatest impact on the U.S. new energy market but had little impact on the Chinese new energy market. When crude prices fall rapidly, crude oil price risk shock has little impact on the United State’s new energy market but has the greatest impact on China’s new energy market. Whether crude oil prices are high, low or falling fast, the influence of crude price risk shocks to the European new energy market is minimal.
The findings of this study have implications for financial market participants and relevant new energy policy makers. For financial market participants, it is necessary to identify the sources of structural crude oil price shocks to construct a portfolio of crude oil and new energy, so as to avoid market risks. Especially, they should pay attention to the demand and risk shocks of crude oil prices on the new energy markets. Then, they should formula the appropriate risk management measures in advance response to these shocks. They also should make a full-scale investment framework for new energy and crude oil markets to manage the market risk for different countries or regions. For the policy makers of new energy, they need to distinguish the sources of structural crude oil price shocks and the different degree of different shocks according to their own new energy development level. Furthermore, they also should focus on the levels of the crude oil prices and the level changes of crude oil prices, so as to formulate new energy policies suitable for their own characteristics and to promote the rapid development of new energy.
Data Availability Statement
The raw data supporting the conclusions of this article will be made available by the authors, without undue reservation.
Author Contributions
LZ: Conceptualization, Data curation, Methodology, Visualization, Writing-Reviewing and Editing. JG: Conceptualization, Software, Methodology, Visualization, Writing-Original draft preparation, Writing-Reviewing and Editing.
Funding
This work was supported by the Fundamental Research Funds for the Central Universities, Zhongnan University of Economics and Law.
Conflict of Interest
The authors declare that the research was conducted in the absence of any commercial or financial relationships that could be construed as a potential conflict of interest.
Supplementary Material
The Supplementary Material for this article can be found online at: https://www.frontiersin.org/articles/10.3389/fenvs.2021.636270/full#supplementary-material.
Footnotes
1According to Diebold and Yilmaz (2012); Diebold and Yilmaz (2014), we choose a window of 200 days.
References
Ahmad, W. (2017). On the dynamic dependence and investment performance of crude oil and clean energy stocks. Res. Int. Bus. Finance 42, 376–389. doi:10.1016/j.ribaf.2017.07.140
Albulescu, C. T., Tiwari, A. K., and Ji, Q. (2020). Copula-based local dependence among energy, agriculture and metal commodities markets. Energy 117762. doi:10.1016/j.energy.2020.117762
Bondia, R., Ghosh, S., and Kanjilal, K. (2016). International crude oil prices and the stock prices of clean energy and technology companies: evidence from non-linear cointegration tests with unknown structural breaks. Energy 101, 558–565. doi:10.1016/j.energy.2016.02.031
Cheng, D., Shi, X., Yu, J., and Zhang, D. (2019). How does the Chinese economy react to uncertainty in international crude oil prices?. Int. Rev. Econ. Finance 64, 147–164. doi:10.1016/j.iref.2019.05.008
Corbet, S., Goodell, J. W., and Günay, S. (2020). Co-movements and spillovers of oil and renewable firms under extreme conditions: new evidence from negative WTI prices during COVID-19. Energy Econ. 92, 104978. doi:10.1016/j.eneco.2020.104978
Dawar, I., Dutta, A., Bouri, E., and Saeed, T. (2021). Crude oil prices and clean energy stock indices: lagged and asymmetric effects with quantile regression. Renew. Energy 163, 288–299. doi:10.1016/j.renene.2020.08.162
Diebold, F. X., and Yilmaz, K. (2012). Better to give than to receive: predictive directional measurement of volatility spillovers. Int. J. Forecast 28, 57–66. doi:10.1016/j.ijforecast.2011.02.006
Diebold, F. X., and Yılmaz, K. (2014). On the network topology of variance decompositions: measuring the connectedness of financial firms. J. Econom. 182, 119–134. doi:10.1016/j.jeconom.2014.04.012
Dutta, A. (2017). Oil price uncertainty and clean energy stock returns: new evidence from crude oil volatility index. J. Clean. Prod. 164, 1157–1166. doi:10.1016/j.jclepro.2017.07.050
Ferrer, R., Shahzad, S. J. H., López, R., and Jareño, F. (2018). Time and frequency dynamics of connectedness between renewable energy stocks and crude oil prices. Energy Econ. 76, 1–20. doi:10.1016/j.eneco.2018.09.022
Geng, J.-B., Chen, F.-R., Ji, Q., and Liu, B.-Y. (2020). Network connectedness between natural gas markets, uncertainty and stock markets. Energy Econ., 105001. doi:10.1016/j.eneco.2020.105001
Geng, J.-B., Du, Y.-J., Ji, Q., and Zhang, D. (2021). Modeling return and volatility spillover networks of global new energy companies. Renew. Sustain. Energy Rev. 135, 110214. doi:10.1016/j.rser.2020.110214
Hu, M., Zhang, D., Ji, Q., and Wei, L. (2020). Macro factors and the realized volatility of commodities: a dynamic network analysis. Resour. Pol. 68, 101813. doi:10.1016/j.resourpol.2020.101813
Ji, Q., Zhang, D., and Zhao, Y. (2020). Searching for safe-haven assets during the COVID-19 pandemic. Int. Rev. Financ. Anal. 71, 101526. doi:10.1016/j.irfa.2020.101526
Kumar, S., Managi, S., and Matsuda, A. (2012). Stock prices of clean energy firms, oil and carbon markets: a vector autoregressive analysis. Energy Econ. 34 (1), 215–226. doi:10.1016/j.eneco.2011.03.002
Luo, J., Ji, Q., Klein, T., Todorova, N., and Zhang, D. (2020). On realized volatility of crude oil futures markets: forecasting with exogenous predictors under structural breaks. Energy Econ. 89, 104781. doi:10.1016/j.eneco.2020.104781
Maghyereh, A. I., Awartani, B., and Abdoh, H. (2019). The co-movement between oil and clean energy stocks: a wavelet-based analysis of horizon associations. Energy 169, 895–913. doi:10.1016/j.energy.2018.12.039
Malik, F., and Umar, Z. (2019). Dynamic connectedness of oil price shocks and exchange rates. Energy Econ. 84, 104501. doi:10.1016/j.eneco.2019.104501
Managi, S., and Okimoto, T. (2013). Does the price of oil interact with clean energy prices in the stock market?. Jpn. World Econ. 27, 1–9. doi:10.1016/j.japwor.2013.03.003
Nasreen, S., Tiwari, A. K., Eizaguirre, J. C., and Wohar, M. E. (2020). Dynamic connectedness between oil prices and stock returns of clean energy and technology companies. J. Clean. Prod. 260, 121015. doi:10.1016/j.jclepro.2020.121015
Pesaran, H. H., and Shin, Y. (1998). Generalized impulse response analysis in linear multivariate models. Econ. Lett. 58 (1), 17–29. doi:10.1016/s0165-1765(97)00214-0
Pham, L. (2019). Do all clean energy stocks respond homogeneously to oil price?. Energy Econ. 81, 355–379. doi:10.1016/j.eneco.2019.04.010
Ready, R. C. (2018). Oil prices and the stock market*. Rev. Finance 22 (1), 155–176. doi:10.1093/rof/rfw071
Reboredo, J. C. (2015). Is there dependence and systemic risk between oil and renewable energy stock prices?. Energy Econ. 48, 32–45. doi:10.1016/j.eneco.2014.12.009
Reboredo, J. C., and Ugolini, A. (2018). The impact of energy prices on clean energy stock prices. A multivariate quantile dependence approach. Energy Econ. 76, 136–152. doi:10.1016/j.eneco.2018.10.012
Reboredo, J. C., Rivera-Castro, M. A., and Ugolini, A. (2017). Wavelet-based test of co-movement and causality between oil and renewable energy stock prices. Energy Econ. 61, 241–252. doi:10.1016/j.eneco.2016.10.015
Sadorsky, P. (2012). Correlations and volatility spillovers between oil prices and the stock prices of clean energy and technology companies. Energy Econ. 34 (1), 248–255. doi:10.1016/j.eneco.2011.03.006
Shah, I. H., Hiles, C., and Morley, B. (2018). How do oil prices, macroeconomic factors and policies affect the market for renewable energy?. Appl. Energy. 215, 87–97. doi:10.1016/j.apenergy.2018.01.084
Shi, X., and Shen, Y. (2021). Macroeconomic uncertainty and natural gas prices: revisiting the Asian Premium. Energy Econ., 94. 105081. doi:10.1016/j.eneco.2020.105081
Shi, X., and Sun, S. (2017). Energy price, regulatory price distortion and economic growth: a case study of China. Energy Econ. 63, 261–271. doi:10.1016/j.eneco.2017.02.006
Singh, V. K., Nishant, S., and Kumar, P. (2018). Dynamic and directional network connectedness of crude oil and currencies: evidence from implied volatility. Energy Econ. 76, 48–63. doi:10.1016/j.eneco.2018.09.018
Yu, J., Shi, X., Guo, D., and Yang, L. (2021). Economic policy uncertainty (EPU) and firm carbon emissions: evidence using a China provincial EPU index. Energy Econ. 94, 105071. doi:10.1016/j.eneco.2020.105071
Zhang, D., Shi, M., and Shi, X. (2018). Oil indexation, market fundamentals, and natural gas prices: an investigation of the Asian premium in natural gas trade. Energy Econ. 69, 33–41. doi:10.1016/j.eneco.2017.11.001
Zhang, H., Cai, G., and Yang, D. (2020). The impact of oil price shocks on clean energy stocks: fresh evidence from multi-scale perspective. Energy 196, 117099. doi:10.1016/j.energy.2020.117099
Keywords: demand shock, supply shock, risk shock, new energy market, DY connectedness index
Citation: Zhou L and Geng J-B (2021) Dynamic Effect of Structural Oil Price Shocks on New Energy Stock Markets. Front. Environ. Sci. 9:636270. doi: 10.3389/fenvs.2021.636270
Received: 01 December 2020; Accepted: 18 January 2021;
Published: 23 February 2021.
Edited by:
Elie Bouri, Lebanese American University, LebanonReviewed by:
Xunpeng Shi, University of Technology Sydney, AustraliaKun Guo, University of Chinese Academy of Sciences, China
Copyright © 2021 Zhou and Geng. This is an open-access article distributed under the terms of the Creative Commons Attribution License (CC BY). The use, distribution or reproduction in other forums is permitted, provided the original author(s) and the copyright owner(s) are credited and that the original publication in this journal is cited, in accordance with accepted academic practice. No use, distribution or reproduction is permitted which does not comply with these terms.
*Correspondence: Jiang-Bo Geng, amlhbmdib2dAenVlbC5lZHUuY24=