 Ayan De
 Deepanjan Mridha
 Iravati Ray
 Madhurima Joardar
 Antara Das
 Nilanjana Roy Chowdhury
 Tarit Roychowdhury*
- School of Environmental Studies, Jadavpur University, Kolkata, India
The present study investigates the magnitude of fluoride (F−) contamination in agricultural land soil and food crops from F− endemic regions of Bankura and Purulia districts in West Bengal. Mean fluoride level in agricultural soil was 114 ± 59 mg/kg (n = 41) and 126 ± 65 mg/kg (n = 47) in Bankura and Purulia districts, respectively. Considering the food crops cultivated in Bankura (n = 79) and Purulia (n = 108), the mean fluoride concentration in nonleafy vegetables (18.1 ± 6.51 mg/kg and 15.6 ± 5.93 mg/kg) and leafy vegetables (12.8 ± 2.8 mg/kg and 18.4 ± 6.33 mg/kg) from the two studied districts was comparatively higher than that in the cereal (2 ± 1.05 mg/kg and 2.01 ± 1.01 mg/kg) and pulses (3.35 ± 1.42 mg/kg and 4.82 ± 1.19 mg/kg). The BCF values of fluoride in food crops (n = 27) from Bankura (range: 0.007–0.377) and Purulia (range: 0.005–0.319) were much lower than the optimum value of 1. Estimated daily intake (EDI) of fluoride was the highest for children in both Bankura (EDIcumulative = 0.0291 mg/kg bw/day) and Purulia (EDIcumulative = 0.0326 mg/kg bw/day) among all the studied age groups. The nonleafy vegetables contributed the highest exposure of fluoride (approximately 55.5%) to EDIcumulative among all the food crops. The uncertainty analysis for assessment of probabilistic health risk was carried out for all the studied age groups through hazard index (HI), total hazard index (THI), and lifetime noncarcinogenic risk (HILTNR). However, HI value was found to be <1 for all the age groups resulting in no such kind of potential health risk of fluorosis through consumption of individual food crops, and the trend of THI from all the food crops was found in the order of children > adults > adolescents > teenagers from both districts. The lifetime noncarcinogenic risk (HILTNR) of fluoride with percentile doses from P5 to P95 (exploring the model of Monte Carlo simulation) in all the studied age groups (4–70 years) was found to be >1 indicating that the inhabitants were more vulnerable for their total lifetime period of fluoride exposure through consumption of food crops.
Introduction
Fluoride (F−) is the 13th most abundant element present in the natural environment (Thippeswamy et al., 2021; Tian et al., 2021) and one of the 12th most hazardous elements in the biosphere (Kimambo et al., 2019; Toolabi et al., 2020). In recent times, more than 200 million people in 29 countries across the world including India, China, Saudi Arabia, United States, Uganda, Tanzania, and Ethiopia are affected due to fluoride toxicity and the number is increasing gradually with time (Amini et al., 2008; Brindha and Elango, 2011; Brindha and Elango, 2013; Vithanage and Bhattacharya, 2015; Ali et al., 2016; Kimambo et al., 2019). The fluoride toxicity was first reported from Nalgonda district of Andhra Pradesh, India, in 1937 (Brindha et al., 2011). Presently, more than 66 million people including 6 million children below the age of 14 years from 20 out of 29 states are at risk from fluoride toxicity through consumption of fluoride-contaminated drinking water beyond the desirable limit of 1.5 mg/L, and a large number of populations, approximately 401 million (40% of Indian populations), live in fluoride endemic 201 districts of India (Ayoob and Gupta, 2006; Brindha et al., 2011; Chakraborti et al., 2016). The geogenic weathering of fluoride-enriched minerals like fluorite, mica, apatite, topaz, etc., followed by its subsequent leaching through mineralization under different hydrogeochemical conditions, amplifies the higher level of fluoride in the underground aquifer (Yadav et al., 2018).
Fluoride-contaminated drinking water along with the cultivated crops and vegetables from endemic zones contributed to a major source of fluoride toxicity through dietary intakes on human health (Bhattacharya et al., 2017; Miri et al., 2018). The dietary intake of fluoride enriched crops and vegetables was found to stimulate chronic toxic effect on both the human and animal body system who feed in fluoride-contaminated soil (Abugri and Pelig-Ba, 2011; Saini et al., 2013; Bhattacharya and Samal, 2018). Cooking of foodstuffs with fluoridated water also assimilated additional fluoride in foods (Gautam et al., 2010). However, long-term ingestion of fluoridated foodstuffs incorporated from either geogenic or anthropogenic sources of fluoride ion caused adverse health effects (Okibe et al., 2010; Abugriand and Pelig-Ba, 2011; Liu et al., 2014; Naik et al., 2017). Fluoride being an essential micronutrient possesses both beneficial and detrimental effects on human health through the consumption of dietary intakes (Chavoshi et al., 2011; Kimambo et al., 2019). Intake of high doses of fluoride can cause several diseases such as ligaments calcification, liver and kidney dysfunction, nerve weakness, developmental disorder, organ tissue damage, and pathological changes in addition to deleterious dental along with skeletal fluorosis, dense, and brittle bone problems in children (Ding et al., 2011; Sun et al., 2013; Susheela et al., 2013; Bhattacharya et al., 2020; Mridha et al., 2021).
In West Bengal, about 12% of populations from eight districts, out of 23 districts, are affected due to fluoride exposure (PHED, 2007; Chatterjee et al., 2008). The fluoride toxicity is considerably higher in the western part of West Bengal mainly covering three districts, namely, Bankura, Purulia, and Birbhum, compared to the eastern parts due to its geographical location (Mondal and Nath, 2015; Samal et al., 2015). Moreover, semiarid and arid climatic conditions occur along with the presence of lateritic soil throughout the area (Mondal and Gupta, 2015). The soil fluoride contamination exists due to the lateritic soil character in these regions (Samal et al., 2015). Datta et al. (2000) reported that the chemical weathering of silicate minerals initiated an important role behind fluoride leachability into groundwater from the Bengal delta. More than 90% of natural fluoride in the soil is in insoluble condition and tightly bound with soil particles (Hong et al., 2016). Only the water-soluble fluoride comes into the soil system which then initiates food chain contamination (He et al., 2021). The entry of fluoride in the plant body system depends on the cultivating mediums, i.e., soil, water, and fertilizer (Kazi et al., 2019). Excessive usage of fluoridated water and fertilizers in agricultural media adversely influences the growth and yield of the crops (Chakrabarti et al., 2013). All crops and vegetables do not uptake fluoride in a similar pattern from soil or other cultivation media (Yadav et al., 2012; Kumar and Anshumali, 2015; Hong et al., 2016).
Previous studies on Bankura and Purulia districts of West Bengal only exposed the groundwater fluoride-contamination scenario and determined the extent of fluorosis to some extent (Bhattacharya et al., 2017; Mondal and Kumar, 2017; Bera and Ghosh, 2019). Groundwater was reported with contamination of fluoride much higher than its recommended value in drinking water from both Purulia (range: 0.126–8.16 mg/L) and Bankura (range: 0.1–12.2 mg/L) (Chakrabarti and Ray, 2013; Mondal and Kumar, 2017; Mandal and Sanyal, 2019). Apart from ingestion of fluoride-contaminated water, the crops and vegetables cultivated using fluoride-contaminated groundwater contribute a significant amount of fluoride to the daily dietary intake of the local inhabitants (Pal et al., 2012; Bhattacharya et al., 2017); thus, the evaluation of fluoride from different food sources and health risk assessment needs to be further investigated.
The present study aims to address the issues related to exposure to fluoride in cultivated food crops and its adverse health effects through dietary intakes of the local inhabitants from the two studied districts. Investigations have been carried out on the concentration and spatial variation of fluoride in agricultural land soil; fluoride uptake by different food crops (cereals, pulses, and nonleafy and leafy vegetables) locally grown using fluoride-contaminated groundwater and bioconcentration factor (BCF) of fluoride in crops and vegetables; toxicity assessment of fluoride exposure through estimated daily intake (EDI) from different food crops and related health risk assessment of the studied populations. In this study, a probabilistic health risk assessment was conducted on the available data to account for the variability and uncertainty that can arise due to the heterogeneity of the population and environment. The probabilistic method (Monte Carlo simulation) is initiated to find out the probability for all the plausible outcomes with the help of probability distribution. This allows minimizing the uncertainty which is inevitable in such studies. It overcomes the failure of the deterministic method, where consideration of mean, median, or maximum (i.e., a single point) values may lead to misestimating of risk. Here, we assessed the 5th, 50th, and 95th percentiles of hazard indices and noncarcinogenic health risk. This works to eliminate the drawback of considering mean values as they can be greater than the 95th percentile values due to a small group of the population being exposed to high concentrations of the toxin. However, the 95th percentile value characterizes the risk of the maximum population. The studied populations were divided into four different age groups (children, 4–8 years; adolescents, 9–13 years; teenagers, 14–18 years; and adults, 19–70 years) to estimate the fluoride exposure and potential probabilistic health risk assessment through estimation of hazard index (HI), total hazard index (THI), and lifetime noncarcinogenic risk (HILTNR) of fluoride from consumption of food crops locally cultivated in the two studied districts.
Materials and Methods
Study Area
The study area has been comprised of eight out of 22 blocks in Bankura district (Bankura-I, Bankura-II, Barjrora, Chhatna, Simlapal, Raipur, Ranibandh, and Hirbandh) and 14 out of 20 blocks in Purulia district (Manbazar-I, Manbazar-II, Puncha, Hura, Purulia-I, Arsha, Balarampur, Bagmundi, Jhalda-I, Jhalda-II, Jaipur, Purulia-II, Para, and Raghunathpur) (Figure 1). Geographically, both Bankura and Purulia districts are situated in the western side of West Bengal and at 78 m and 228 m above sea level, respectively. Bankura is situated between latitude 22°38ʹ–23°38ʹ N and longitude 86°36ʹ–87°46ʹ E. The total area of Bankura is 6,882 sq. km with a population of 3,596,674 (Census, 2011). The location of Purulia district is in between latitude 22°42ʹ–23°42ʹ N and longitude 85°49′–86°54ʹ E with an area of 6,259 sq. km and population of 2,930,115 (Census, 2011). According to the census report, 91.7 and 71.3% of the populations live in rural areas of Bankura and Purulia, respectively (Census, 2011), and most of the local inhabitants depend on agricultural activities. A wide part of these two districts is covered with lateritic nodules and rocky soil (Chakrabarti and Ray, 2013; Samal et al., 2015). The occurrence of both old and new alluvial soil has been observed in the southern and eastern parts of Bankura district. Usually, the regional weather of these two districts is dry with seasonal variation of high and low temperature; however, that in Purulia district is more extreme than that in Bankura district. Due to the presence of rocky, lateritic soil, and extreme weather, a selected group of crops are grown in this region. Basically, rice, potato, tomato, lentils, mustard, and various seasonal vegetables are grown in both areas.
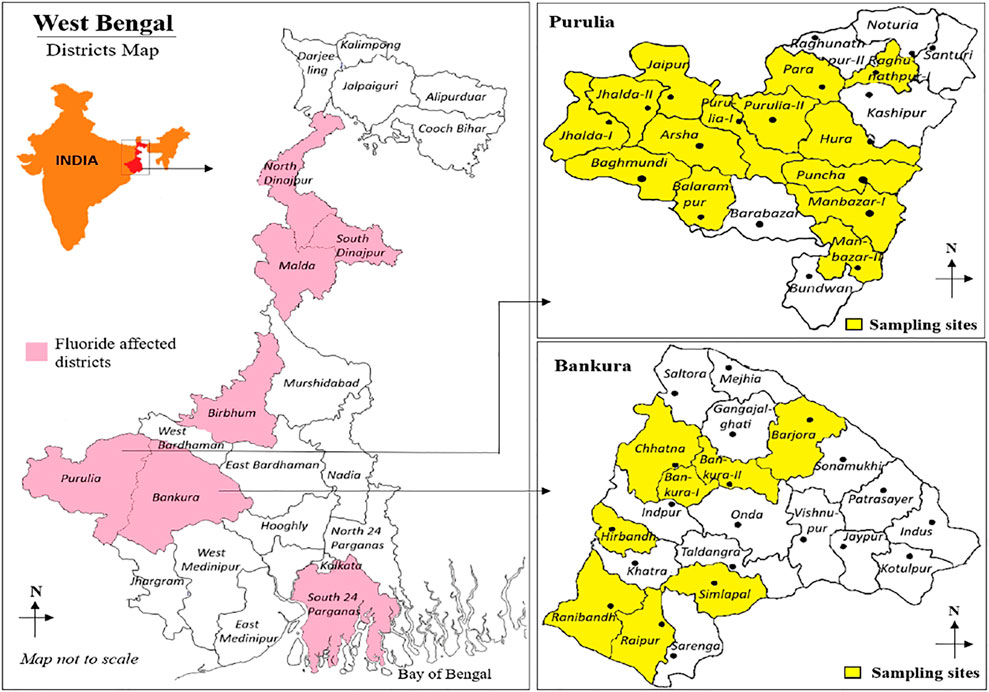
FIGURE 1. Selected blocks in studied areas of Purulia and Bankura districts.
Collection and Preservation of Food Crops, Vegetables, and Soil Samples
Locally cultivated fresh food crops and vegetables were collected from the agricultural fields which include cereal like rice (Oryza sativa) and wheat (Triticum aestivum); pulses like pigeon pea (Cajanus cajan), lentils (Lens culinaris), chana (Cicer arietinum), and lentils arhar (Lens culinaris); nonleafy vegetables like sweet potato (Ipomoea batatas), potato (Solanum tuberosum), turmeric (Curcuma longa), ginger (Zingiber officinale), onion (Allium cepa), carrot (Daucus carota), shim/broad beans (Vicia faba), beans (Vicia faba), radish (Raphanus sativus), cauliflower (Brassica juncea), chilli (Capsicum frutescens), pumpkin (Cucurbita pepo), brinjal (Solanum melongena), cucumber (Cucumis sativus), bitter guard (Momordica charantia), mustard seed (Brassica juncea), and tomato (Lycopersicon esculentum); and leafy vegetables like cabbage (B. oleracea var. capitata), coriander (Coriandrum sativum), spinach (Spinacia oleracea), and methi saag/fenugreek leaves (Trigonella foenum-graecum). Collected samples were individually packed into polythene zip locks and labeled, respectively. Soil samples were collected in triplicates from the upper surface of respective agricultural fields (a distance of approximately 600 cm between each other). All the collected samples were transported to the laboratory keeping in an icebox to prevent degradation of the organic substances.
The Moisture Percentage in Food Crops, Vegetables, and Soil
The edible parts of crops and vegetables were washed properly with laboratory tap water followed by double-distilled water. About 100 g of each of washed food crops, vegetables, and collected soil samples was placed into a hot air oven at 60°C for 72 h and taken out to determine the moisture content (Bhattacharya et al., 2017). The moisture content was evaluated using the following equation:
Chemicals and Reagents
All the chemicals and reagents used during this experiment were of laboratory grade. Double-distilled water was used throughout the chemical analysis procedures. The reagents like NaOH and HCl were purchased from Merck (Mumbai, India). The fluoride standard solution (NaF) of 100 mg/L was available from Thermo Fisher Scientific, Waltham, MA (United States, Orion 940907). A buffer grade solution, TISAB-III (Total Ionic Strength Adjusting Buffer) used for sample preparation in 1:10 ratio for estimation of fluoride, was purchased from Thermo Fisher Scientific, Waltham, MA (United States, Orion 940911).
Digestion and Analysis
The collected food crops and soil samples were digested following the protocol of the alkali fusion process (Malde et al., 2001; Mridha et al., 2021). About 0.5 g of dried sample was taken in a 25 ml nickel crucible followed by the addition of 0.5 ml double-distilled water to maintain the moist condition and 6 ml of 8 (M) NaOH solutions. The crucible was placed at 150°C for 2 h inside a hot air oven. The crucible was taken out and placed inside a muffle furnace initially at 400°C, with a gradual rise in temperature up to 600°C for 1 h. The crucible was allowed to cool at room temperature and about 10 ml of double-distilled water was added for dissolution of fusion cake and placed on a hotplate. For maintaining the pH at 7–9, concentrated HCl was added dropwise with continuous stirring and made up the volume to 25 ml with distilled water. Finally, the solution was filtrated through Whatman 42 filter paper and the samples were stored in a cooled place for fluoride estimation.
Fluoride concentration in digested soil and foodstuffs was measured electrochemically using an ion-selective electrode (ISE) meter (Thermo Scientific Orion Star A214) combined with fluoride ion-selective electrode (Orion ISE model no. 9609BNWP) following the recommended protocol by the American Society for Testing and Materials (ASTM, 2010). Aliquots of 0.1, 1, and 10 mg/L were prepared directly from the standard stock solution of sodium fluoride (100 mg/L) through serial dilutions. A mixture solution of TISAB-III with fluoride aliquot in a 1:10 ratio was used daily for calibration. Prior to the measurement of fluoride, the ion meter was calibrated to a slope of −59.2 ± 2.0. TISAB-III and digested samples in the same ratio (1:10) were used for the estimation of fluoride.
Quality Control and Quality Assurance
The reliability, accuracy, and precision of the generated analytical data were inferred through precise standardization, routine blank experiments, spiked sample recovery, and interlaboratory testing (Das et al., 2020). Quality control tests were also performed by duplicate analysis of 15–20% of digested crops and vegetable samples and calculating spiked fluoride recovery (97 ± 3%) in water/digested samples.
Estimation of BCF
BCF is presented to show the amount of fluoride accumulated in plant systems through the soil. The BCF of fluoride in the collected food crops was calculated using the formula of Pal et al. (2012).
Nutritional Status and Exposure Dose Determination
A preliminary survey was conducted on food habits, food consumption patterns, and body weight of 57 households from Bankura and Purulia districts comprising different age groups. Based on the surveyed data, an average value for the consumption rates of cereals, pulses, green leafy vegetables, and nonleafy vegetables has been placed for health risk evaluation. The populations in the study area have been grouped into four categories according to their ages, i.e., children (4–8 years), adolescents (9–13 years), teenagers (14–18 years), and adults (19–70 years). The diet of the studied populations mainly depends on rice and wheat with periodical changes and alteration of pulses and vegetables.
EDI of fluoride is an indicator that expressed how much fluoride a person ingested through the daily consumption of different food crops. The generic equation of EDI was based on the given formula by US Environmental Protection Agency (USEPA, 1992) as follows:
where C = concentration of fluoride in foodstuff (mg/kg); IR = ingestion or intake rate of fluoride (mg/day); EF = exposure frequency (days/year); ED = exposure duration (year); BW = average body weight (kg); and AT = average lifetime (days) that is equal to ED times 365 days/year (Erdal and Buchanan, 2005).
To calculate the exposure dose of four different aged populations in this study, average body weight was considered as 22 kg, 40 kg, 60 kg, and 70 kg for children, adolescents, teenagers, and adults, respectively (based on our preliminary survey in the studied areas). EDIcumulative is a summative expression of fluoride exposure pathway through different dietary sources, which has been calculated with the following equation:
Health Risk Assessment
Health risk assessment is a quantitative model for evaluation of possible risk through different toxic exposure on human (USEPA, 1992). The health risk assessment of four different age groups has been carried out by comparing the exposure dose and reference dose (RfD) of fluoride to determine the HI. HI represents the ratio of EDI to the oral RfD for noncarcinogenic health risk from individual food crops.
where the oral RfD value for fluoride is 0.06 mg/kg bw/day (USEPA, 2003). It is derived from the NOAEL (no observed adverse effect level) of 0.06 mg/kg-day which is divided by the uncertainty factor (UF) and modifying factor (MF); the value of both UF and MF is 1 (USEPA, 2003). If the obtained HI value of fluoride is <1, then chances of noncarcinogenic effects are hardly present, whereas HI > 1 designates potential noncarcinogenic human health effects (USEPA, 2009). The THI of the inhabitants through the dietary intake of food crops has been measured with the following equation:
The lifetime noncarcinogenic risk (LTNR) assessment for the populations (4–70 years) of the study areas due to lifelong exposure to fluoride is calculated using the following equation (USEPA, 2003):
Probabilistic Risk Assessment
Probabilistic health risk assessment is performed by the Monte Carlo simulation method which is used for probabilistic and statistical theory to evaluate the uncertainty of huge random samples of each variable (Bazeli et al., 2020; Kaur et al., 2020). In this study, the Monte Carlo simulation technique is used to analyze the probabilistic health risk due to dietary intake of food crops (cereals, pulses, and nonleafy and leafy vegetables). The fluoride concentration of individual food crops (cereals, pulses, and nonleafy and leafy vegetables), ingestion rate, and body weight were used to determine the potential futuristic risk distribution. Through this technique, 10,000 iterations were run by Oracle Crystal Ball programming software in Excel to estimate HI and measure the inherent uncertainty risk distribution in upper boundary: 95th percentile (P95), lower boundary: 5th percentile (P5), and middle boundary: 50th percentile (P50). The variability of the noncarcinogenic effect depends on independent variables or factors (C, IR, and BW). The risk uncertainty analysis was also accomplished with the Monte Carlo simulation practice to find out all input parameters having expressed data with a significant impact on the model (Pirsaheb et al., 2021).
Spatial Distribution of Soil Fluoride and Statistical Data Analysis
The spatial distribution of fluoride in soil collected from the studied areas was analyzed using Arc-GIS l 10.4.1 software application through Inverse Distance Weighing (IDW) model system. IDW model is a deterministic interpolation method that determines using variables and the distance between points. The uncertainty of noncancerous risk was calculated using Crystal Ball (Fusion edition version 11.1.1.1.00) and other graphical and statistical data were analyzed by Microsoft Excel 2019.
Results
Concentration and Distribution of Fluoride in Agricultural Land Soil
Fluoride concentration status in the studied agricultural field soil from eight and 14 blocks of Bankura and Purulia districts was shown in Supplementary Table 1. Mean fluoride concentrations in soil samples collected from Bankura and Purulia were 114 ± 59 mg/kg (range: 22.8–267 mg/kg, n = 41) and 126 ± 65 mg/kg (range: 47.9–297 mg/kg, n = 47), respectively. Spatial variation of fluoride concentration in soil from Bankura and Purulia was shown in Figure 2. According to the interpolation mapping, the soil surrounding the area of Bankura-II (267 mg/kg) (Lat: 23°17′58.42″ N and long: 87°11′45.50″ E) and Jaipur (297 mg/kg) (Lat: 23°18′13.64″ N and Long: 87°11′35.88″ E) in Bankura and Purulia districts, respectively, may have been heavily lodged with higher amount of fluoride (Figure. 2A,B). Similarly, the lowest concentration of fluoride in the soil of Bankura and Purulia was found in Barjora (22.8 mg/kg) (Lat: 23°31′35.60″ N and Long: 86°37′52.25″ E) and Purulia-II (47.9 mg/kg) (Lat: 23°30′11.70″ N and Long: 86°31′04.94″ E), respectively (Figure. 2A,B). The mean fluoride concentration in soil from Purulia district was found to be 4% higher than that of Bankura district. The interpolation map shows that distribution characteristics of fluoride in the soil of Purulia varied significantly. The concentration and diverse distribution of fluoride in the soils of Purulia and Bankura mainly occurred due to the geogenic (mineral composition of rocks) and anthropogenic activities. The IDW method suggested that the magnitude of fluoride contamination in soils of Purulia and Bankura mainly existed between Lat: 23°18′13.64″ N and Long: 87°11′35.88″ E and Lat: 23°18′13.64″ N and Long: 87°11′35.88″ E, respectively.
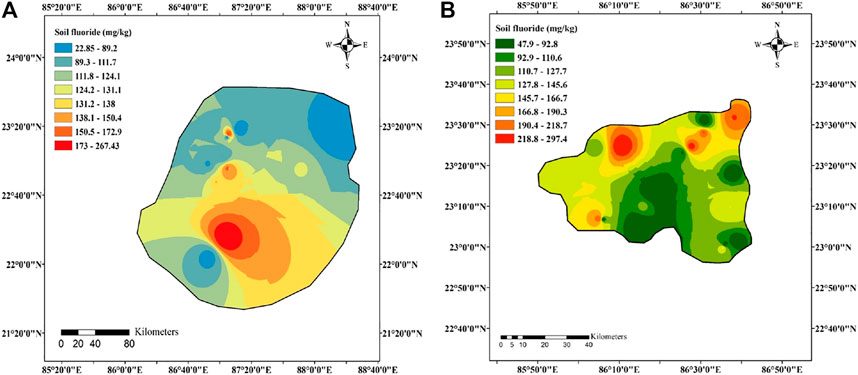
FIGURE 2. Spatial distribution of fluoride concentration in soil from (A) eight blocks of Bankura district and (B) 14 blocks of Purulia district.
Presence of Fluoride in Crops and Vegetables
The concentration of fluoride in cereal, pulses, and nonleafy and leafy vegetables cultivated in the studied area was shown in Supplementary Table 2. The concentration of fluoride in collected food crops ranged between 0.68–54 mg/kg (n = 79) and 0.31–58.9 mg/kg (n = 108) in Bankura and Purulia district, respectively (Supplementary Table 2). Among all the collected food crops, the maximum fluoride concentration was found in onion from both Bankura (mean: 43 ± 7 mg/kg dw, range: 2.11–54 mg/kg, n = 8) and Purulia (mean: 40.3 ± 1.08 mg/kg dw, range: 3.02–58.9 mg/kg, n = 9). Moreover, the least amount of fluoride concentrations was observed in rice compared to any other foodstuff from both the studied districts, Bankura (range: 0.68–1.71 mg/kg, n = 3) and Purulia (range: 0.48–3.31 mg/kg, n = 4). The fluoride concentration in rice cultivated in Purulia district was found to be ∼2 times higher than that in Bankura district. The cultivated nonleafy and leafy vegetables in Purulia district contributed to higher fluoride (range: 0.31–58.9 mg/kg, n = 66 and 0.33–48 mg/kg, n = 23) than that of Bankura district (range: 1.2–54 mg/kg, n = 50 and 0.78–19.11 mg/kg, n = 19). The mean concentration of fluoride in pigeon pea, lentils, chana, potato, turmeric, chilli, cucumber, tomato, cabbage, coriander, spinach, and fenugreek leaves cultivated in Purulia district was found to be higher than that in Bankura district. Comparatively, fluoride concentration in wheat, lentils (arhar), ginger, onion, carrot, shim/broad beans, cauliflower, pumpkin, brinjal, bitter guard, and mustard seed was found to be much higher in Bankura than in Purulia district.
BCF of Fluoride in Crops and Vegetables
The BCF value of fluoride concentration in different crops and vegetables collected from the studied areas is presented in Figure 3. The observed BCF values for all the collected food crops were found to be <1, which indicates that none of the crops and vegetables were hyper- or good accumulator of fluoride. The highest BCF of fluoride was found in onion, i.e., 0.37 and 0.31 in Bankura and Purulia, respectively. The minimum BCF was observed in lentils (0.007) and shim/broad beans (0.005) from Bankura and Purulia districts, respectively. However, among the cereals, the BCF of fluoride was found to be more in rice than in wheat in Purulia and vice versa in Bankura district (Figure 3). Among the pulses, the order of BCF of fluoride was found to be lentils arhar > pigeon pea > chana > lentils in Bankura and pigeon pea > chana > lentils > lentils arhar in Purulia. Nonleafy vegetables showed the sequence of BCF in the order of onion > carrot > radish > bitter guard > pumpkin > brinjal > tomato > cucumber > potato > cauliflower > sweet potato > chilli > ginger > mustard seed > turmeric > beans > shim/broad beans and onion > reddish > carrot > bitter guard > tomato > sweet potato > cucumber > potato > pumpkin > chilli > brinjal > cauliflower > turmeric > beans > ginger > master seed > shim/broad beans in Bankura and Purulia, respectively. Among the leafy vegetables, the BCF of fluoride was found in the order of coriander > cabbage > spinach > fenugreek leaves and coriander > spinach > cabbage > fenugreek leaves in Bankura and Purulia, respectively. The estimated BCF of fluoride was found in the order of nonleafy vegetables > leafy vegetables > pulses > cereal in both the studied areas (Supplementary Table 2).
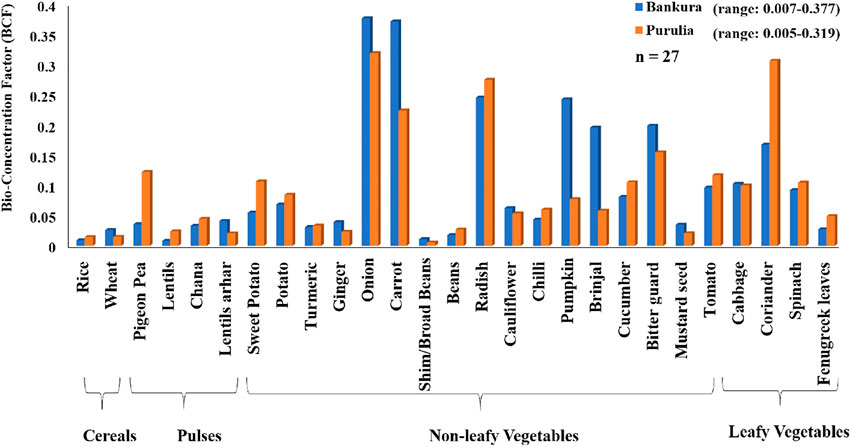
FIGURE 3. Average bioconcentration factor (BCF) of fluoride on cereals, pulses, and nonleafy and leafy vegetable items at Bankura and Purulia districts.
Estimated Consumption of Crops and Vegetables
Average daily intake frequency (g fresh weight/day) and exposure frequency (day/year) of the dietary food crops by the studied populations according to their food habits were presented in Supplementary Table 3. The average intake of cereal, pulses, and nonleafy and leafy vegetables (dry weight basis) in different age groups of the studied populations was shown in Supplementary Table 4. Rice is a staple food crop considered as the most highly consumed food (g dry weight/day) among the studied inhabitants (Supplementary Table 4). Cereal is a major contributor to the daily dietary intake among all the food crops, while the requirement of pulses and nonleafy and leafy vegetables depends on the body’s needs. The consumption range of the dietary food crops in different age groups of the studied populations was for children (0.2–70.6 g dw/day), adolescents (0.3–82 g dw/day), teenagers (0.42–92.61 g dw/day), and adults (0.63–145 g dw/day) (Supplementary Table 4).
Exposure Dose of Fluoride Due To Consumption of Different Food Crops
Exposure dose helps to measure the health risk assessment in the studied populations. EDI value was evaluated based on the food crops consumed by different age groups and their respective fluoride concentrations from both the studied areas. The relevant EDI value from different food crops for the different age groups in the studied populations was presented in Supplementary Table 5. Due to the highest accumulation pattern of fluoride (Supplementary Table 2), maximum EDI value was observed in onion. Average EDI (mg/kg bw/day) for onion was found to be 0.00678, 0.00609, 0.00564, and 0.00658 and 0.00636, 0.00571, 0.00529, and 0.00617 in children, adolescents, teenagers, and adults in Bankura and Purulia, respectively. Among the cereals, rice was a major food item that was consumed daily and the EDI was found to be ∼1.5 to ∼2 times higher than wheat in Purulia and vice versa in Bankura. Minimum EDI value was observed in beans from all the age groups in the studied districts. The pie chart diagram shown in Figure 4 depicts that nonleafy vegetables were the major contributor to fluoride exposure among all the groups of food crops in both the studied districts Bankura (60–63%) and Purulia (48–52%) and the observed ∑EDI was in the order of nonleafy vegetables > cereal > pulses > leafy vegetables. The cumulative EDI value showed that the children from both the studied districts were exposed to the highest dietary intake of fluoride compared to other age groups (Supplementary Table 5) and observed EDIcumulative for the studied populations was in the order of children > adults > adolescents > teenagers from both districts.
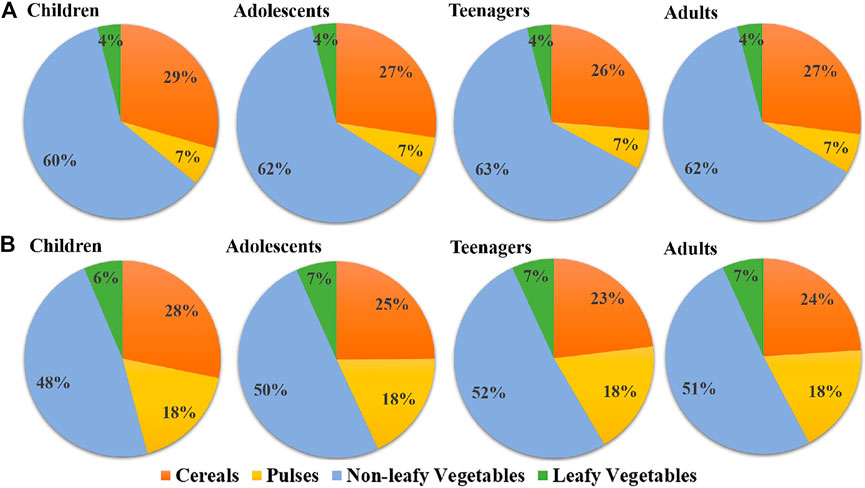
FIGURE 4. Fluoride exposure through dietary intake of cereals, pulses, and nonleafy and leafy vegetables in the studied age group from (A) Bankura and (B) Purulia districts.
Potential Probabilistic Noncancerous Health Risk Assessment
The present study revealed that the calculated HI values of all the age groups from cultivated food crops were less than 1 in both Bankura and Purulia (Supplementary Table 6). The HI values of the children in both districts were found to be the highest compared to adolescents, teenagers, and adults. However, the calculated values of the THI for all the age groups in both districts were greater than 1 (Supplementary Table 6). The uncertainty upper bound (P95), the uncertainty lower bound (P5), and average uncertainty (P50) of HI and THI using the Monte Carlo simulation model for estimation of probabilistic health risk assessment of fluoride at four different age groups in different cultivated crops from Bankura and Purulia were shown in Supplementary Table 7, 8; Figure 5, respectively. The HI and THI values remained within the allowable limit of less than 1 even at the uncertainty upper bound (P95) for all the age groups in Bankura and Purulia. It is evident from Table 7 and Table 8 that the children were exposed to a greater amount of noncarcinogenic risk in both districts. A similar result was observed in the case of THI (Figure 5). However, the uncertainty analysis of lifetime noncarcinogenic risk (HILTNR) yielded values greater than 1 at P5, P50, and P95 in both districts (Figure 6). The HILTNR values at Purulia were around 11% greater than those in Bankura (Figure 6).
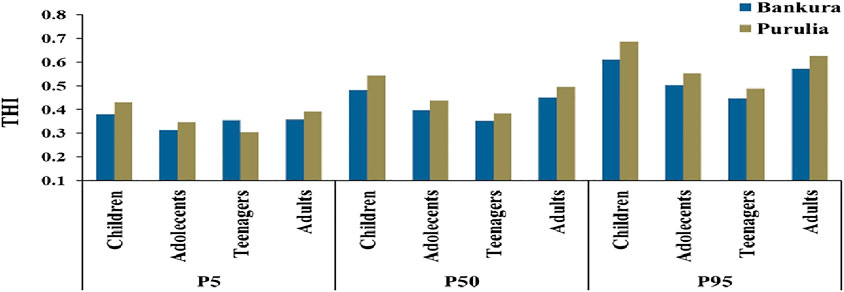
FIGURE 5. Total Hazard Index (THI) determined at P5, P50, and P95 by a probabilistic health risk assessment of fluoride exposure at four different age groups in different cultivated crops from Bankura and Purulia.
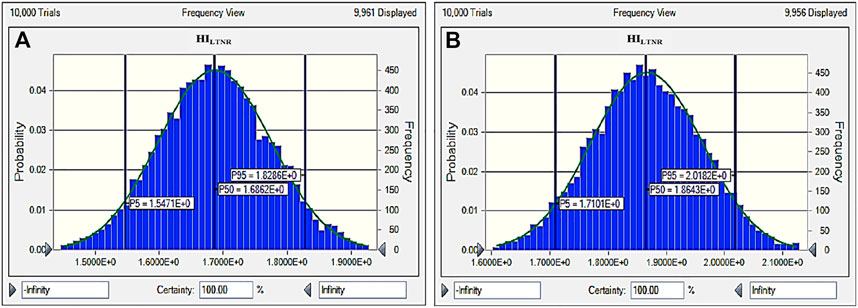
FIGURE 6. Probabilistic health risk assessment of fluoride for lifetime exposure (HILTNR) for percentile doses from P5 to P95 in (A) Bankura and (B) Purulia.
Discussion
The presence of fluoride in soil depends on geographical location, weather, and climatic conditions. The soil fluoride content in Purulia was observed higher than Bankura (Supplementary Table 1) corroborated with the findings of Bhattacharya et al. (2017). However, the observed fluoride concentrations in agricultural land soil from the two studied districts (Supplementary Table 1) were ∼1.4 and ∼1.3 times lower than the observed concentrations from Bankura (range: 51–372 mg/kg, n = 47) and Purulia (range: 60–399 mg/kg, n = 32) (Bhattacharya et al., 2017). IDW methods used to determine the proper distribution of fluoride present in collected soil samples from two districts with GIS-aided georeference and interpolation mapping showed high fluoride concentration mainly localized in Bankura-II and Jaipur block of Bankura and Purulia districts, respectively (Figure 2). The bioavailability of soil fluoride concentration in Purulia was higher than that of Bankura due to the geological and climatic conditions. Bera and Ghosh (2019) reported that about 941 sq. km in Purulia district (15% of the total area) has high fluoride-enriched soil and this entire area is based on the edge of Chota Nagpur Plateau with small hilly regions (Datta et al., 2014). Based on the survey of 8,500 tube wells from Bankura district, 612 tube-wells were found to have fluoride concentration over 1 mg/L, while 247 had fluoride concentrations over 1.5 mg/L (Chakrabarti and Bhattacharya, 2013). Out of these 247 tube wells, 183 were located within our study area (Chhatna, Hirabandh, Barjora, and Simlapal). About 37% of groundwater samples collected from Simlapal of Bankura district during premonsoonal season contained fluoride above 1.5 mg/L (Mondal et al., 2017). In the postmonsoonal season, 30% of the samples had fluoride concentrations above the permissible limit. The maximum fluoride concentrations in agricultural land soils from our studied areas were found to be in the range of 78–344 mg/kg in Bankura and 145–399 mg/kg in Purulia. Raghunathpur in Purulia and Bankura-II recorded the highest concentrations. A significant correlation was also found between fluoride concentration in soil and deep tube well water from those locations (Samal et al., 2015). Bankura and Purulia are dependent on groundwater for irrigation purposes; the concentration of fluoride in groundwater above the permissible level is therefore a factor that contributes to the accumulation of fluoride in agricultural soil and crops.
Granite, gneiss, and pegmatite are responsible minerals from which fluoride mobilizes and enters into the soil (Bera and Ghosh, 2019). In Bankura, mica and silicate minerals might be the potent sources from where fluoride leaches out into the soil (Mondal and Kumar, 2017). The various phosphate soluble fertilizers used in agricultural fields were also considered a source of soil fluoride (Chavoshi et al., 2011).
The fluoride concentrations in cereal, pulses, and leafy and nonleafy vegetables depend on the fluoride content in the soil, irrigation water, and fertilizers used. Plants cannot directly absorb fluoride from soil; only the soluble fluoride of soil enters into the plant body system (Hong et al., 2016; Jha et al., 2011; Singh et al., 2018). However, the observed fluoride concentrations in agricultural crops and vegetables from the two studied districts (Supplementary Table 2) were found to be higher than the observed concentrations in rice, pulses, and vegetables from Bankura (range: 0.56–63 mg/kg, n = 210) and Purulia (range: 0.37–52 mg/kg, n = 75) (Bhattacharya et al., 2017). Fluoride concentration was found to be maximum in onion than in the other collected food crops (Table 2). Jha et al. (2008) reported that the accumulation of fluoride was more in onion root than bulb. The amount of fluoride in onion from the studied areas was comparatively higher than the previous study in Birbhum district (Mondal and Gupta, 2015). The accumulation of fluoride in cultivated crops (cereal, pulses, and leafy and nonleafy vegetables) depends on their outer and inner state of affairs of the cultivation system (Paul et al., 2011; Mondal and Gupta, 2015; Bhattacharya et al., 2017). The observed fluoride content in coriander and spinach was found to be higher than that in the study reported in the fluoride endemic Gaya district of Bihar (Ranjan and Yasmin, 2015). The observed fluoride concentration in radish, carrot, and spinach was found much higher compared to the studied vegetables from Nawa Tehsil village, Nagaur district of Rajasthan in India (Gautam et al., 2010). In the case of cereals, the fluoride accumulation was found to be higher in wheat than in rice from both the studied districts which was supported by another study (Jha et al., 2011). Accumulation of fluoride in rice was much lesser than that in the nonleafy and leafy vegetables in this study which contrasted the observed values in rice (range: 0.53–3.62 mg/kg) and vegetables (0.08–3.53 mg/kg) reported in European region (Jaudenes et al., 2020). The mean fluoride content in cabbage and carrot cultivated on the bank of river Galma, Zaria, Nigeria, was reported to be ∼216 and ∼233 times lower than that in the present study (Okibe et al., 2010).
The BCF values of fluoride in cultivated food crops (range: 0.005–0.377, n = 27) from the two studied districts were much lower than the optimum value of 1. The mean BCF value of fluoride in onion was ∼2.5–3.0 times lower than the optimum value and a similar trend of the result was reported by other studies (Bhattacharya et al., 2017; Zhang et al., 2013). The lower BCF value of fluoride was found in cereal than that in most of the cultivated food crops from both districts due to the geological soil characteristic issues and growth rate which strongly influenced the BCF (Figure 3). Higher BCF value in onion, carrot, radish, and coriander (range: 0.15–0.38) indicates that plants have more affinity to accumulate fluoride. A higher level of BCF was reported in radish and carrot (range: 0.29–0.48) in the two studied districts (Bhattacharya et al., 2017). Jha et al. (2011) reported that the BCF value is not constant for specific cereal, pulses, and nonleafy and leafy vegetables and is influenced by lateritic soil and old and new alluvial soil properties in the study areas. BCF is controlled by several soil properties like pH, clay (%), and organic matter as well as several plant factors like plant type and growth rate (Swartjes et al., 2007). The bioavailability of fluoride was found to be maximum for root vegetables compared to cereals (Kusa et al., 2004; Khandare and Rao, 2006; Agarwal and Chauhan, 2014) which supported our findings. However, in case of cereal, the BCF value of fluoride was found to be higher in wheat than in rice in Bankura and the trend was similar to the finding of Jha et al. (2011). The leafy vegetables (cabbage, coriander, spinach, and fenugreek leaves) in the study areas also indicated much lower ability in translocation of fluoride from the soil, contrary to the several other findings in West Bengal reported earlier (Gupta and Banerjee, 2011; Pal et al., 2012).
The consumption pattern of cereal, pulses, and leafy and nonleafy vegetables of the studied four age groups was more significant according to the body need among the studied populations (Supplementary Table 3). Rice is widely eaten and the main source of diet for the studied populations. So, the consumption pattern was significantly responsible on the basis of easy availability of seasonal crops and vegetables in the studied areas (Bhattacharya et al., 2017; Jha et al., 2011). The variation in the consumption pattern among the different age groups was mainly due to the difference in their body weight and physiological need. The average dietary intake of food crops consumed by the adults was ∼2–3 times higher than that consumed by the children (Supplementary Table 4). The EDI value from the equation number 3 and 4 expressed the doses of fluoride that is entrapped into the gastrointestinal tract of the human body system through the consumption of cereal, pulses, and nonleafy and leafy vegetables. The EDI values obtained in this study were based on the consumption of 27 different food crops cultivated in the studied areas. Onion was a major contributor behind fluoride exposure compared to other food crops which increased the risk assessment of the studied population (Supplementary Table 5). The nonleafy vegetables contributed the highest exposure of fluoride (approximately 55.5%) to EDIcumulative among all the cultivated food crops (Figure 4; Supplementary Table 5) which was supported by other studies (Adimalla and Li, 2019; Kazi et al., 2019; Yadav et al., 2019). The cereal (rice and wheat) contributed low exposure of fluoride to EDIcumulative (approximately 26.2%) which contrasted the previous studies reported by Jha et al. (2011) and Bhattacharya et al. (2017). The cumulative EDI values of fluoride through dietary food crops among all the age groups in Bankura (range: 0.021–0.029 mg/kg bw/day) and Purulia (range: 0.023–0.032 mg/kg bw/day) were much lower than the observed values (range: 0.06–0.19 mg/kg bw/day) reported earlier from the same study areas considering the major pathway of fluoride exposure contributed through drinking water (Bhattacharya et al., 2017). Drinking water contributed approximately 96% of fluoride to EDIcumulative with respect to all the dietary sources of the studied populations with various age groups from fluoride endemic districts in Bihar, India (Mridha et al., 2021). A similar kind of observation was also reported earlier from fluoride endemic Jilin province, China (Bo et al., 2003). The children (4–8 years) from both the studied districts were exposed with the highest EDIcumulative value of fluoride compared to the other three studied age groups (adolescents, teenagers, and adults) (Supplementary Table 5) which was supported by previous studies reported from fluoride endemic regions in Bihar (Mridha et al., 2021), West Bengal, India (Bhattacharya et al., 2017), and Dayyer, Iran (Keshavarz et al., 2015). The children (1–3 years) were highly exposed to the daily intake of fluoride from different foods commercialized in a European region compared to adolescents (15–17 years) and adults (Jaudenes et al., 2020). The recommended Tolerable Upper Intake Level (UL) of fluoride ingestion considering all sources for infants, toddlers, and children up to 8 years is 0.1 mg/kg bw/day and for children >8 years old and adults is 0.15–0.2 mg/kg bw/day, irrespective of their body weights (IOM, 1997; NHMRC, 2017). The cumulative EDI values of fluoride through cultivated food crops for all the studied age groups were found to be lower than the recommended UL limits (Supplementary Table 5).
Supplementary Table 6 explains the fact that there was no such kind of potential risk of fluorosis from individual food crops among the exposed populations. The HI of fluoride for the inhabitants of Purulia was higher than that of Bankura due to the higher EDI values of fluoride from cultivated food crops in Purulia. The HI values for the four different studied age groups were much lower than 1 and the children were exposed more to fluoride toxicity than adults, adolescents, and teenagers through consumption of most of the cultivated food crops from both the studied districts. The mean HI value of fluoride in children was ∼1.81- and 2.22-fold higher than that in the teenagers and adults, respectively, in a study from Bangladesh (Rahman et al., 2020). About 72 and 60% of the infants and children had mean HI > 1 and the values were much higher than adults from a study conducted in Northwest of China (Chen et al., 2017). Higher HI values of children were also reported than that of teenagers and adults from fluoride endemic Birbhum district of West Bengal (Mukherjee et al., 2019) and Bankey Bazar and Rajauli blocks of Bihar, India (Mridha et al., 2021). Drinking water accounted for high HI due to increasing consumption of water under hot climatic conditions, which was not accounted for in this study. The estimated exposure dose of fluoride through water, contributing to HI, was reported to be much higher than the foodstuffs in the populations from the fluoride endemic zones of several countries (Bo et al., 2003; Battaleb-Looie et al., 2013; Keshavarz et al., 2015; Mridha et al., 2021). Other exposure pathways may also contribute to intake fluoride such as fluoridated water, climatic factor, fluoride supplement, and inhalation which poses highly risk reported elsewhere (Yuan et al., 2020).
The uncertainty analysis using Monte Carlo simulation demonstrated that the HI and THI values of the studied population were in the order of children > adults > adolescents > teenagers (Supplementary Table 1, 2; Figure 5) in both Bankura and Purulia. Thus, the results reveal that the children are the most vulnerable population exposed to fluoride contamination due to their low body weight. This finding corroborates with that of Pirsaheb et al. (2021) and Rahman et al. (2020). The HI and THI values of less than 1 at P5, P50, and P95 for all the age groups indicate that exposure to an individual vegetable or cereal does not pose a significant noncarcinogenic health risk to the population. The combined effect of the noncarcinogenic risks posed by all the vegetables and cereals can be depicted from the HILTNR values. The HILTNR values being higher than the IOM (US) recommended upper limit of fluoride >1 (IOM, 1997) even at the lower bound (P5) in both Bankura and Purulia districts pose a significant noncarcinogenic risk to the entire population (Figure 6). Thus, long-time exposure to fluoride may lead to the development of chronic fluoride-related disorders among the population. Moreover, several other studies reported similarly that the inhabitants were more vulnerable with HILTNR value >1 for their total lifetime period of fluoride exposure due to the consumption of food crops (Sofuoglu and Kavcar, 2008; Chen et al., 2017; Narsimha and Rajitha, 2018).
Conclusion
This study evaluated the magnitude of fluoride contamination in surface soil from fluoride endemic two districts, Bankura and Purulia, of West Bengal, India. The crops and vegetables grown in fluoride intoxicated agricultural fields also accumulated a substantial amount of fluoride in their edible parts and fluoride accumulation in food crops was found to be higher in Purulia than in Bankura district. The accumulation of fluoride was found to be higher in vegetables (nonleafy and leafy) than in pulses and cereals from both the studied districts and the maximum accumulation was found in onion, while being minimum in rice. The calculated BCF values for all the crops and vegetables were found to be <1 which indicate that none of the food crops were hyper- or good accumulator of fluoride. The lower BCF value of fluoride was found in cereal than that in the pulses and leafy and nonleafy vegetables. The nonleafy vegetables were the major contributor of fluoride exposure among all the groups of food crops and the observed ∑EDI was in the order of nonleafy vegetables > cereals > pulses > leafy vegetables in both the studied districts. The cumulative EDI values (EDIcumulative) of fluoride through cultivated food crops for all the studied age groups were found to be lower than the recommended UL limits and children were exposed to the highest dietary intake of fluoride compared to the other studied age groups in the order of children > adults > adolescents > teenagers from both districts. The HI values for the four different studied age groups were much lower than 1 resulting in no such kind of potential health risk of fluorosis among the exposed populations through consumption of individual food crops. The HI of fluoride for the inhabitants of Purulia was higher than that of Bankura and the children were exposed more to fluoride toxicity compared to adults, adolescents, and teenagers from both the studied districts. Probabilistic health risk assessment of fluoride for lifetime noncarcinogenic risk (HILTNR) with percentile doses from P5 to P95 (exploring the model of Monte Carlo simulation) in all the studied age groups (4–70 years) was >1 indicating that the inhabitants were more vulnerable for their total lifetime period of fluoride exposure through consumption of food crops.
So, all these conclusory remarks finally indicate the need for proper guidelines and remedial technologies for the minimization of soil fluoride concentration and its subsequent uptake in cultivated food crops. Constant monitoring of these fluoride endemic regions was needed on a regular basis to reduce the potential risk lingering upon the residing population. Proper watershed management through the treatment of surface water and rainwater harvesting for the supplement of fluoride-safe water for drinking purposes at a community level as well for cultivation purposes and awareness campaigns among the endangered populations is badly needed to combat the fluoride crisis situation in the studied areas. Rainwater harvesting can be thought of as a process to eliminate the use of fluoride-contaminated groundwater for irrigation purposes. The harvested rainwater can also be mixed with contaminated groundwater to bring down the fluoride level within the permissible limit. Apparently, biological remediation techniques using bacteria, fungi, algae, and higher plants (hyperaccumulators) can be used to remediate soil fluoride and improve crop productivity.
Data Availability Statement
The raw data supporting the conclusions of this article will be made available by the authors, without undue reservation.
Author Contributions
AYD: research planning, sample collection, analytical work, statistical presentation, initial draft preparation, and revision work; DM: statistical presentation, analytical work, and initial draft preparation; IR: statistical presentation, analytical work; MJ: initial draft checking and editing; AND: initial draft checking, revision work, and editing; NC: initial draft checking and editing; TR: overall supervision of the entire research study and manuscript revision. All authors who contributed to this work agreed to approve its publication in this journal.
Funding
Financial supports from “Water & Sanitation Support Organization” (WSSO), Public Health Engineering Department, Government of West Bengal (research project grant Memo No. PHE/WSSO/37 (Pt-II)/157, dated January 29, 2018), and Inter-University Research Project, RUSA (R-11/1092/19, dated August 06, 2019) are highly acknowledged.
Conflict of Interest
The authors declare that the research was conducted in the absence of any commercial or financial relationships that could be construed as a potential conflict of interest.
The handling editor declared a past coauthorship with one of the authors (TR).
Publisher’s Note
All claims expressed in this article are solely those of the authors and do not necessarily represent those of their affiliated organizations, or those of the publisher, the editors and the reviewers. Any product that may be evaluated in this article, or claim that may be made by its manufacturer, is not guaranteed or endorsed by the publisher.
Acknowledgments
The authors thank the local farmers and villagers of the studied blocks in Bankura and Purulia districts for showing their willingness to involve in the work and providing the samples and related information to carry forward the research study.
Supplementary Material
The Supplementary Material for this article can be found online at: https://www.frontiersin.org/articles/10.3389/fenvs.2021.713148/full#supplementary-material
References
Abugri, D. A., and Pelig-Ba, K. B. (2011). Assessment of Fluoride Content in Tropical Surface Soils Used for Crop Cultivation. Afr. J. Environ. Sci. Tech. 5 (9), 653–660. doi:10.4314/ajest.v5i9.72064
Adimalla, N., and Li, P. (2019). Occurrence, Health Risks, and Geochemical Mechanisms of Fluoride and Nitrate in Groundwater of the Rock-Dominant Semi-arid Region, Telangana State, India. Hum. Ecol. Risk Assess. Int. J. 25 (1–2), 81–103. doi:10.1080/10807039.2018.1480353
Agarwal, R., and Chauhan, S. S. (2014). Bioaccumulation of Sodium Fluoride Toxicity in Triticum Aestivum Var. Raj. 3077. Int. J. Food Agric. Vet. Sci. 4 (1), 98–101.
Ali, S., Thakur, S. K., Sarkar, A., and Shekhar, S. (2016). Worldwide Contamination of Water by Fluoride. Environ. Chem. Lett. 14, 291–315. doi:10.1007/s10311-016-0563-5
Amini, M., Mueller, K., Abbaspour, K. C., Rosenberg, T., Afyuni, M., Møller, K. N., et al. (2008). Statistical Modeling of Global Geogenic Fluoride Contamination in Groundwaters. Environ. Sci. Technol. 42, 3662–3668. doi:10.1021/es071958y
ASTM (2010). ASTM D1179-10 Standard Test Methods for Fluoride Ion in Water. Philadelphia, PA: American Society for Testing Materials, Book of Standards Volume: 11.01. doi:10.1520/D1179-10
Ayoob, S., and Gupta, A. K. (2006). Fluoride in Drinking Water: a Review on the Status and Stress Effects. Crit. Rev. Environ. Sci. Tech. 36 (6), 433–487. doi:10.1080/10643380600678112
Battaleb-Looie, S., Moore, F., Malde, M. K., and Jacks, G. (2013). Fluoride in Groundwater, Dates and Wheat: Estimated Exposure Dose in the Population of Bushehr, Iran. J. Food Compost. Anal. 29, 94–99. doi:10.1016/j.jfca.2012.08.001
Bazeli, J., Ghalehaskar, S., Morovati, M., Soleimani, H., Masoumi, S., Rahmani Sani, A., et al. (2020). Health Risk Assessment Techniques to Evaluate Non-carcinogenic Human Health Risk Due to Fluoride, Nitrite and Nitrate Using Monte Carlo Simulation and Sensitivity Analysis in Groundwater of Khaf County, Iran. Int. J. Environ. Anal. Chem., 1–21. doi:10.1080/03067319.2020.1743280
Bera, B., and Ghosh, A. (2019). Fluoride Dynamics in Hydrogeological Diversity and Fluoride Contamination Index Mapping: a Correlation Study of North Singbhum Craton, India. Arabian J. Geosciences 12 (24), 1–15. doi:10.1007/s12517-019-4994-8
Bhattacharya, P., Adhikari, S., Samal, A. C., Das, R., Dey, D., Deb, A., et al. (2020). Health Risk Assessment of Co-occurrence of Toxic Fluoride and Arsenic in Groundwater of Dharmanagar Region, North Tripura (India). Groundwater Sust. Dev. 11, 100430. doi:10.1016/j.gsd.2020.100430
Bhattacharya, P., Samal, A. C., Banerjee, S., Pyne, J., and Santra, S. C. (2017). Assessment of Potential Health Risk of Fluoride Consumption through rice, Pulses, and Vegetables in Addition to Consumption of Fluoride-Contaminated Drinking Water of West Bengal, India. Environ. Sci. Pollut. Res. 24 (25), 20300–20314. doi:10.1007/s11356-017-9649-2
Bhattacharya, P., and Samal, A. C. (2018). Fluoride Contamination in Groundwater, Soil and Cultivated Foodstuffs of India and its Associated Health Risks: a Review. Res. J. Recent Sci. 7 (4), 36–47.
Bo, Z., Mei, H., Yongsheng, Z., Xueyu, L., Xuelin, Z., and Jun, D. (2003). Distribution and Risk Assessment of Fluoride in Drinking Water in the West plain Region of Jilin Province, China. Environ. Geochem. Health 25, 421–431. doi:10.1023/b:egah.0000004560.47697.91
Brindha, K., and Elango, L. (2011). “Fluoride in Groundwater: Causes, Implications and Mitigation Measures,” in Fluoride Properties, Applications and Environmental Management. Editor S. D. Monroy (New York: Nova Publishers), 111–136.
Brindha, K., and Elango, L. (2013). Geochemistry of Fluoride Rich Groundwater in a Weathered Granitic Rock Region, Southern India. Water Qual. Expo. Health 5 (3), 127–138. doi:10.1007/s12403-013-0096-0
Brindha, K., Rajesh, R., Murugan, R., and Elango, L. (2011). Fluoride Contamination in Groundwater in Parts of Nalgonda District, Andhra Pradesh, India. Environ. Monit. Assess. 172 (1-4), 481–492. doi:10.1007/s10661-010-1348-0
Census (2011). Bankura District: Census 2011 Data, Government of India. Available at: http://www.census2011.co.in/census/district/13-bankura.html.
Chakrabarti, S., and Bhattacharya, H. N. (2013). Inferring the Hydro-Geochemistry of Fluoride Contamination in Bankura District, West Bengal: A Case Study. J. Geol. Soc. India 82, 379–391. doi:10.1007/s12594-013-0165-9
Chakrabarti, S., Patra, P. K., and Mondal, B. (2013). Uptake of Fluoride by Two Paddy (Oryza Sativa L.) Varieties Treated with Fluoride-Contaminated Water. Paddy Water Environ. 11 (1), 619–623. doi:10.1007/s10333-012-0342-2
Chakrabarti, S., and Ray, S. (2013). Fluoride Contamination in a Hard Rock Terrain: A Case Study of Purulia District, West Bengal, India. J. Chem. Biol. Phys. Sci. 3 (4), 2931–2941.
Chakraborti, D., Rahman, M. M., Chatterjee, A., Das, D., Das, B., Nayak, B., et al. (2016). Fate of over 480 Million Inhabitants Living in Arsenic and Fluoride Endemic Indian Districts: Magnitude, Health, Socio-Economic Effects and Mitigation Approaches. J. Trace Elem. Med. Biol. 38, 33–45. doi:10.1016/j.jtemb.2016.05.001
Chatterjee, A., Roy, R. K., Ghosh, U. C., Pramanik, T., Kabi, S. P., and Biswas, K. (2008). Fluoride in Water in Parts of Raniganj Coalfield, West Bengal. Curr. Sci. 94 (3), 309–311.
Chavoshi, E., Afyuni, M., Hajabbasi, M. A., Khoshgoftarmanesh, A. H., Abbaspour, K. C., Shariatmadari, H., et al. (2011). Health Risk Assessment of Fluoride Exposure in Soil, Plants, and Water at Isfahan, Iran. Hum. Ecol. Risk Assess. Int. J. 17 (2), 414–430. doi:10.1080/10807039.2011.552397
Chen, J., Wu, H., Qian, H., and Gao, Y. (2017). Assessing Nitrate and Fluoride Contaminants in Drinking Water and Their Health Risk of Rural Residents Living in a Semiarid Region of Northwest China. Expo. Health 9 (3), 183–195. doi:10.1007/s12403-016-0231-9
Das, A., Das, S. S., Chowdhury, N. R., Joardar, M., Ghosh, B., and Roychowdhury, T. (2020). Quality and Health Risk Evaluation for Groundwater in Nadia District, West Bengal: An Approach on its Suitability for Drinking and Domestic Purpose. Groundwater Sust. Dev. 10, 100351. doi:10.1016/j.gsd.2020.100351
Datta, A. S., Chakrabortty, A., De Dalal, S. S., and Lahiri, S. C. (2014). Fluoride Contamination of Underground Water in West Bengal, India. Fluoride 47 (3), 241–248.
Datta, D. K., Gupta, L. P., and Subramanian, V. (2000). Dissolved Fluoride in the Lower Ganges-Brahmaputra-Meghna River System in the Bengal Basin, Bangladesh. Environ. Geology. 39 (10), 1163–1168. doi:10.1007/s002549900094
Ding, Y., Sun, H., Han, H., Wang, W., Ji, X., Liu, X., et al. (2011). The Relationships between Low Levels of Urine Fluoride on Children's Intelligence, Dental Fluorosis in Endemic Fluorosis Areas in Hulunbuir, Inner Mongolia, China. J. Hazard. Mater. 186 (2-3), 1942–1946. doi:10.1016/j.jhazmat.2010.12.097
Erdal, S., and Buchanan, S. N. (2005). A Quantitative Look at Fluorosis, Fluoride Exposure, and Intake in Children Using a Health Risk Assessment Approach. Environ. Health Perspect. 113, 111–117. doi:10.1289/ehp.7077
Gautam, R., Bhardwaj, N., and Saini, Y. (2010). Fluoride Accumulation by Vegetables and Crops Grown in Nawa Tehsil of Nagaur District (Rajasthan, India). J. Phytology 2 (2), 80–85.
Gupta, S., and Banerjee, S. (2011). Fluoride Accumulation in Crops and Vegetables and Dietary Intake in a Fluoride-Endemic Area of West Bengal. Fluoride 44 (3), 153–157.
He, L., Tu, C., He, S., Long, J., Sun, Y., Sun, Y., et al. (2021). Fluorine Enrichment of Vegetables and Soil Around an Abandoned Aluminium Plant and its Risk to Human Health. Environ. Geochem. Health 43 (3), 1137–1154. doi:10.1007/s10653-020-00568-5
Hong, B. D., Joo, R. N., Lee, K. S., Lee, D. S., Rhie, J. H., Min, S. W., et al. (2016). Fluoride in Soil and Plant. Korean J. Agric. Sci. 43 (4), 522–536. doi:10.7744/kjoas.20160054
IOM (1997). Dietary Reference Intakes for Calcium, Phosphorus, Magnesium, Vitamin D, and Fluoride. Institute of Medicine (US). Washington DC: National Academies Press.
Jaudenes, J. R., Gutiérrez, Á. J., Paz, S., Rubio, C., and Hardisson, A. (2020). Fluoride Risk Assessment from Consumption of Different Foods Commercialized in a European Region. Appl. Sci. 10, 6582–6589. doi:10.3390/app10186582
Jha, S. K., Mishra, V. K., Sharma, D. K., and Damodaran, T. (2011). Fluoride in the Environment and its Metabolism in Humans. Rev. Environ. Contam. Toxicol. 211, 121–142. doi:10.1007/978-1-4419-8011-3_4
Jha, S. K., Nayak, A. K., Sharma, Y. K., Mishra, V. K., and Sharma, D. K. (2008). Fluoride Accumulation in Soil and Vegetation in the Vicinity of brick fields. Bull. Environ. Contam. Toxicol. 80 (4), 369–373. doi:10.1007/s00128-008-9391-z
Kaur, L., Rishi, M. S., and Siddiqui, A. U. (2020). Deterministic and Probabilistic Health Risk Assessment Techniques to Evaluate Non-carcinogenic Human Health Risk (NHHR) Due to Fluoride and Nitrate in Groundwater of Panipat, Haryana, India. Environ. Pollut. 259, 113711. doi:10.1016/j.envpol.2019.113711
Kazi, T. G., Brahman, K. D., Baig, J. A., and Afridi, H. I. (2019). Bioaccumulation of Arsenic and Fluoride in Vegetables from Growing media: Health Risk Assessment Among Different Age Groups. Environ. Geochem. Health 41 (3), 1223–1234. doi:10.1007/s10653-018-0207-8
Keshavarz, S., Ebrahimi, A., and Nikaeen, M. (2015). Fluoride Exposure and its Health Risk Assessment in Drinking Water and Staple Food in the Population of Dayyer, Iran, in 2013. J. Educ. Health Promot. 4 (72), 72–77. doi:10.4103/2277-9531.171785
Khandare, A. L., and Rao, G. S. (2006). Uptake of Fluoride, Aluminum and Molybdenum by Some Vegetables from Irrigation Water. J. Hum. Ecol. 19 (4), 283–288. doi:10.1080/09709274.2006.11905892
Kimambo, V., Bhattacharya, P., Mtalo, F., Mtamba, J., and Ahmad, A. (2019). Fluoride Occurrence in Groundwater Systems at Global Scale and Status of Defluoridation - State of the Art. Groundwater Sust. Dev. 9, 100223. doi:10.1016/j.gsd.2019.100223
Kumar, B. A., and Anshumali, (2015). Fluoride in Agricultural Soil: a Review on its Sources and Toxicity to Plants. Glob. Sustainability Transitions: Impacts Innov. 29–37.
Kusa, Z., Wardas, W., Sochacka, J., and Pawleowska-Goral, K. (2004). Fluoride Accumulation in Selected Vegetables during Their Vegetation. Polish J. Environ. Stud. 13 (1), 55–58.
Liu, X., Wang, B., and Zheng, B. (2014). Geochemical Process of Fluorine in Soil. Chin. J. Geochem. 33 (3), 277–279. doi:10.1007/s11631-014-0688-9
Malde, M. K., Bjorvatn, K., and Julshamn, K. (2001). Determination of Fluoride in Food by the Use of Alkali Fusion and Fluoride Ion-Selective Electrode. Food Chem. 73 (3), 373–379. doi:10.1016/S0308-8146(01)00118-2
Mandal, J., and Sanyal, S. (2019). Geospatial Analysis of Fluoride Concentration in Groundwater in Purulia District, West Bengal. Space Cult. India 6 (5), 71–86. doi:10.20896/saci.v6i5.369
Miri, M., Bhatnagar, A., Mahdavi, Y., Basiri, L., Nakhaei, A., Khosravi, R., et al. (2018). Probabilistic Risk Assessment of Exposure to Fluoride in Most Consumed Brands of tea in the Middle East. Food Chem. Toxicol. 115, 267–272. doi:10.1016/j.fct.2018.03.023
Mondal, D., and Gupta, S. (2015). Influence of Fluoride Contaminated Irrigation Water on Biochemical Constituents of Different Crops and Vegetables with an Implication to Human Risk through Diet. J. Mater. Environ. Sci. 6 (11), 3134–3142.
Mondal, K., and Nath, S. (2015). Fluoride Contamination on Aquatic Organisms and Human Body at Purulia and Bankura District of West Bengal, India. Bull. Environ. Pharmacol. Life Sci. 4, 112–114.
Mondal, S., and Kumar, S. (2017). Investigation of Fluoride Contamination and its Mobility in Groundwater of Simlapal Block of Bankura District, West Bengal, India. Environ. Earth Sci. 76 (22), 778. doi:10.1007/s12665-017-7122-7
Mridha, D., Priyadarshni, P., Bhaskar, K., Gaurav, A., De, A., Das, A., et al. (2021), Fluoride Exposure and its Potential Health Risk Assessment in Drinking Water and Staple Food in the Population from Fluoride Endemic Regions of Bihar, India, Groundwater Sust. Dev., 13. 100558. doi:10.1016/j.gsd.2021.100558
Mukherjee, I., Singh, U. K., and Patra, P. K. (2019). Exploring a Multi-Exposure-Pathway Approach to Assess Human Health Risk Associated with Groundwater Fluoride Exposure in the Semi-arid Region of East India. Chemosphere 233, 164–173. doi:10.1016/j.chemosphere.2019.05.278
Naik, R. G., Dodamani, A. S., Vishwakarma, P., Jadhav, H. C., Khairnar, M. R., Deshmukh, M. A., et al. (2017). Level of Fluoride in Soil, Grain and Water in Jalgaon District, Maharashtra, India. J. Clin. Diagn. Res. 11 (2), ZC05. doi:10.7860/JCDR/2017/23223.9175
Narsimha, A., and Rajitha, S. (2018). Spatial Distribution and Seasonal Variation in Fluoride Enrichment in Groundwater and its Associated Human Health Risk Assessment in Telangana State, South India. Hum. Ecol. Risk Assess. Int. J. 24 (8), 2119–2132. doi:10.1080/10807039.2018.1438176
National Health and Medical Research Council (2017). Human Research Ethics Committees (HRECs). Available at: http://www.nhmrc.gov.au/health-ethics/human-research-ethics-committees-hrecs.
Okibe, F. G., Ekanem, E. J., Paul, E. D., Shallangwa, G. A., Ekwumemgbo, P. A., Sallau, M. S., et al. (2010). Fluoride Content of Soil and Vegetables from Irrigation Farms on the Bank of River Galma, Zaria, Nigeria. Aust. J. Basic Appl. Sci. 4 (5), 779–784.
Pal, K. C., Mondal, N. K., Bhaumik, R., Banerjee, A., and Datta, J. K. (2012). Incorporation of Fluoride in Vegetation and Associated Biochemical Changes Due to Fluoride Contamination in Water and Soil: a Comparative Field Study. Ann. Environ. Sci. 6, 123–129.
Paul, E. D., Gimba, C. E., Kagbu, J. A., Ndukwe, G. I., and Okibe, F. G. (2011). Spectrometric Determination of Fluoride in Water, Soil and Vegetables from the Precinct of River Basawa, Zaria, Nigeria. J. Basic Appl. Chem. 1 (6), 33–38.
PHED (2007). A Note on Fluoride Contamination of Ground Water in West Bengal. Govt. of West Bengal, Kolkata: Public Health Engineering Department. Available at: www.wbphed.gov.in/flroride_cont.html.
Pirsaheb, M., Hadei, M., and Sharafi, K. (2021). Human Health Risk Assessment by Monte Carlo Simulation Method for Heavy Metals of Commonly Consumed Cereals in Iran- Uncertainty and Sensitivity Analysis. J. Food Compost. Anal. 96, 103697. doi:10.1016/j.jfca.2020.103697
Rahman, M. M., Bodrud-Doza, M., Siddiqua, M. T., Zahid, A., and Islam, A. R. M. T. (2020). Spatiotemporal Distribution of Fluoride in Drinking Water and Associated Probabilistic Human Health Risk Appraisal in the Coastal Region, Bangladesh. Sci. Total Environ. 724, 138316. doi:10.1016/j.scitotenv.2020.138316
Ranjan, S., and Yasmin, S. (2015). Assessment of Fluoride Intake through Food Chain and Mapping of Endemic Areas of Gaya District, Bihar, India. Bull. Environ. Contam. Toxicol. 94 (2), 220–224. doi:10.1007/s00128-014-1396-1
Saini, P., Khan, S., Baunthiyal, M., and Sharma, V. (2013). Mapping of Fluoride Endemic Area and Assessment of F−1 Accumulation in Soil and Vegetation. Environ. Monit. Assess. 185 (2), 2001–2008. doi:10.1007/s10661-012-2683-0
Samal, A. C., Bhattacharya, P., Mallick, A., Ali, M. M., Pyne, J., and Santra, S. C. (2015). A Study to Investigate Fluoride Contamination and Fluoride Exposure Dose Assessment in Lateritic Zones of West Bengal, India. Environ. Sci. Pollut. Res. 22 (8), 6220–6229. doi:10.1007/s11356-014-3817-4
Singh, G., Kumari, B., Sinam, G., Kriti Kumar, N., and Mallick, S. (2018). Fluoride Distribution and Contamination in the Water, Soil and Plants Continuum and its Remedial Technologies, an Indian Perspective- a Review. Environ. Pollut. 239, 95–108. doi:10.1016/j.envpol.2018.04.002
Sofuoglu, S. C., and Kavcar, P. (2008). An Exposure and Risk Assessment for Fluoride and Trace Metals in Black tea. J. Hazard. Mater. 158 (2-3), 392–400. doi:10.1016/j.jhazmat.2008.01.086
Sun, L., Gao, Y., Liu, H., Zhang, W., Ding, Y., Li, B., et al. (2013). An Assessment of the Relationship between Excess Fluoride Intake from Drinking Water and Essential Hypertension in Adults Residing in Fluoride Endemic Areas. Sci. Total Environ. 443, 864–869. doi:10.1016/j.scitotenv.2012.11.021
Susheela, A. K., Mondal, N. K., and Singh, A. (2013). Exposure to Fluoride in Smelter Workers in a Primary Aluminum Industry in India. Int. J. Occup. Environ. Med. 4 (2), 61–72.
Swartjes, F. A., Dirven-Van Breemen, E. M., Otte, P. F., Van Beelen, P., Rikken, M. G. J., Uinstra, J., et al. (2007). Human Health Risks Due to Consumption of Vegetables from Contaminated Sites: Towards a Protocol for Site-specific assessmentRIVM Report 711701040. Netherlands: Bilthoven.
Thippeswamy, H. M., Devananda, D., Nanditha Kumar, M., Wormald, M. M., and Prashanth, S. N. (2021). The Association of Fluoride in Drinking Water with Serum Calcium, Vitamin D and Parathyroid Hormone in Pregnant Women and Newborn Infants. Eur. J. Clin. Nutr. 75 (1), 151–159. doi:10.1038/s41430-020-00707-2
Tian, L., Zhu, X., Wang, L., Peng, F., Pang, Q., He, F., et al. (2021). Distribution, Occurrence Mechanisms, and Management of High Fluoride Levels in the Water, Sediment, and Soil of Shahu Lake, China. Appl. Geochem. 126, 104869. doi:10.1016/j.apgeochem.2021.104869
Toolabi, A., Bonyadi, Z., Paydar, M., Najafpoor, A. A., and Ramavandi, B. (2020). Spatial Distribution, Occurrence, and Health Risk Assessment of Nitrate, Fluoride, and Arsenic in Bam Groundwater Resource, Iran. Groundwater Sust. Dev. 12, 100543. doi:10.1016/j.gsd.2020.100543
USEPA (1992). Guidelines for Exposure Assessment. Federal 957 Register Notice 57. Washington, DC: Environmental Protection Agency, 22887–22938.
USEPA (2003). Integrated Risk Information System. Cincinnati, OH: U.S. Environmental Protection Agency. Environmental Criteria and Assessment Office. Available: http://www.epa.gov/iris.
USEPA (2009). National Primary Drinking Water Regulations. Washington, D.C: U.S. Environmental Protection Agency. U.S. Environmental Protection Agency.
Vithanage, M., and Bhattacharya, P. (2015). Fluoride in the Environment: Sources, Distribution and Defluoridation. Environ. Chem. Lett. 13 (2), 131–147. doi:10.1007/s10311-015-0496-4
Yadav, K. K., Gupta, N., Kumar, V., Khan, S. A., and Kumar, A. (2018). A Review of Emerging Adsorbents and Current Demand for Defluoridation of Water: Bright Future in Water Sustainability. Environ. Int. 111, 80–108. doi:10.1016/j.envint.2017.11.014
Yadav, K. K., Kumar, V., Gupta, N., Kumar, S., Rezania, S., and Singh, N. (2019). Human Health Risk Assessment: Study of a Population Exposed to Fluoride through Groundwater of Agra City, India. Regul. Toxicol. Pharmacol. 106, 68–80. doi:10.1016/j.yrtph.2019.04.013
Yadav, R. K., Shipra, S., Megha, B., Ajay, S., Vivek, P., and Raaz, M. (2012). Effects of Fluoride Accumulation on Growth of Vegetables and Crops in Dausa District, Rajasthan, India. Adv. Bio Res. 3 (4), 14–16.
Yuan, L., Fei, W., Jia, F., Jun-Ping, L., Qi, L., Fang-Ru, N., et al. (2020). Health Risk in Children to Fluoride Exposure in a Typical Endemic Fluorosis Area on Loess Plateau, north China, in the Last Decade. Chemosphere 243, 125451. doi:10.1016/j.chemosphere.2019.125451
Keywords: fluoride, agricultural land soil and spatial variation, food crops, bio-concentration factor, estimated daily intake, probabilistic health risk
Citation: De A, Mridha D, Ray I, Joardar M, Das A, Chowdhury NR and Roychowdhury T (2021) Fluoride Exposure and Probabilistic Health Risk Assessment Through Different Agricultural Food Crops From Fluoride Endemic Bankura and Purulia Districts of West Bengal, India. Front. Environ. Sci. 9:713148. doi: 10.3389/fenvs.2021.713148
Received: 21 May 2021; Accepted: 07 July 2021;
Published: 18 August 2021.
Edited by:
Mohammad Mahmudur Rahman, The University of Newcastle, AustraliaReviewed by:
Alok Chandra Samal, University of Kalyani, IndiaSunil Kumar, National Environmental Engineering Research Institute (CSIR), India
Copyright © 2021 De, Mridha, Ray, Joardar, Das, Chowdhury and Roychowdhury. This is an open-access article distributed under the terms of the Creative Commons Attribution License (CC BY). The use, distribution or reproduction in other forums is permitted, provided the original author(s) and the copyright owner(s) are credited and that the original publication in this journal is cited, in accordance with accepted academic practice. No use, distribution or reproduction is permitted which does not comply with these terms.
*Correspondence: Tarit Roychowdhury, cmN0YXJpdEB5YWhvby5jb20=