 Preet Lal
 Ankit Shekhar
 Amit Kumar
- 1Department of Geoinformatics, Central University of Jharkhand, Ranchi, India
- 2Department of Environmental Systems Science, ETH Zürich, Zürich, Switzerland
The large-scale Land-Uses and Land-Cover Changes (LULCC) in India in the past several decades is primarily driven by anthropogenic factors that influence the climate from regional to global scales. Therefore, to understand the LULCC over the Indian region from 2002 to 2015 and its implications on temperature and precipitation, we performed Weather Research Forecast (WRF) model simulation using the European Centre for Medium-Range Weather Forecast (ECMWF) reanalysis data for the period 2009 to 2015 as a boundary condition with 2009 as spin-up time. The results showed moderate forest cover loss in major parts of northeast India, and the Himalayan region during 2002–2015. Such large LULC changes, primarily significant alteration of grassland and agriculture from the forest, led to increased precipitation due to increasing evapotranspiration (ET) similar to the forest-dominated regions. An increase in the precipitation patterns (>300 mm) was observed in the parts of eastern and western Himalayas, western Ghats, and the northwestern part of central India, while most parts of northeast Himalayas have an exceptional increase in precipitation (∼100–150 mm), which shows similar agreement with an increase of leaf area index (LAI) by ∼15%. The overall phenomenon leads to a greening-induced ET enhancement that increases atmospheric water vapor content and promotes downwind precipitation. In the case of temperature, warming was observed in the central to eastern parts of India, while cooling was observed in the central and western parts. The increase in vegetated areas over northwest India led to an increase in ET, which ultimately resulted in decreased temperature and increased precipitation. The study highlights the changes in temperature and precipitation in recent decades because of large LULCC and necessitates the formulation of sustainable land use-based strategies to control meteorological variability and augment ecological sustainability.
1 Introduction
The global climate change is greatly associated with land use/land cover changes (LULCC) (Bonan, 2008; Halder et al., 2016). Globally, approximately 68% of the earth’s landmass is altered by anthropogenic land-use practices, related to an increased transformation to cropland from forests during 1700–2000 globally (Foley et al., 2005; Pielke et al., 2011). LULCC affects biogeochemistry (Mahowald et al., 2017), biophysical (Duveiller et al., 2020), and biogeographical (Hibbard et al., 2010) attributes of the terrestrial surface (Kabat et al., 2004; Govorushko, 2016) and also modifies the concentration of greenhouse gases (GHGs) in the atmosphere, thereby affecting the atmospheric chemical composition (Pielke et al., 1998; Hibbard et al., 2010; Lal et al., 2020a; Lal et al., 2021a). The changes in biodiversity in the form of alteration of flora and fauna by the introduction of invasive species aggravate the bio-geographical composition on the surface (Clavero, 2016; Forstmaier et al., 2020; Saikia et al., 2020; Lal et al., 2021b). The significant change in the bio-geophysical properties largely by anthropogenic activities leads to the imbalance in surface energy budget by modifications of albedo cover, surface roughness, evapotranspiration (ET), and leaf area index (LAI) (Lee et al., 2011; Lal et al., 2019; Zhang and Ye, 2021). The large land-use alterations such as changes in forest cover and intensive agriculture practices lead to changes in the roughness and turbulent energy flux (Kueppers et al., 2008; Phillips et al., 2009), while urbanization influences the lower atmosphere by increased temperature, thereby increasing the Bowen ratio (Wang et al., 2014).
The assessment of LULCC impact on regional climate started back in the 1970s by considering only physical parameters. Later, in the 1980s, researchers realized that only physical parameters were not sufficient to examine these effects. This resulted in the inclusion of the biochemical process to examine the effect of the carbon cycle and greenhouse gases emission on global/regional climate (Dirmeyer and Shukla, 1994; Pongratz et al., 2010; Shekhar et al., 2020). For this, climate models emerged as a tool to quantify the changes due to alteration in boundary conditions and future simulations of climate changes (Jacob and Podzun, 1997; Rinke and Dethloff, 2000). Climate models consist of seven fundamental equations of conservation of mass and energy in three dimensions to dynamically simulate mass and energy flow in the atmosphere (Navon, 1987). Initially, researchers started using Global Circulation Models (GCMs) for sensitivity tests with land use and biophysical parameters (Kang et al., 2002). Later, GCMs were widely used for climatic simulations with various parameters such as ET (Lawrence et al., 2007), LAI (Hales et al., 2004), carbon dioxide concentrations (Field et al., 1995), surface roughness (Sud et al., 1988), LULCC (Betts et al., 1996; Salmun and Molod, 2016), and atmospheric trace gases (Pielke et al., 2002). However, the horizontal resolution of these GCMs was too low (∼1°–2°) and, thus, was less valuable for the heterogeneous land area (Brovkin et al., 2006). To resolve this subgrid-scale heterogeneity problem (due to coarse horizontal resolution), the Regional Circulation Models (RCMs) were developed in the early 1990s, which became one of the most important tools for climate researchers for sensitivity analysis at a finer scale, due to strong regional forcing (von Storch et al., 1993; Jin et al., 2010).
There is recent evidence of climate change-attributed variability in precipitation patterns and temperature trends in India primarily due to anthropogenic influences (Kumar G. et al., 2020; Raghavan et al., 2020). This has led to increasing incidences of various climatic extremes and meteorological disasters in the Indian region, viz., flood (Lal et al., 2020b, 2020c; Ahmad et al., 2021), tropical cyclones (Kumar S. et al., 2020; Kumar et al., 2021 A.), heat waves (Chakraborty et al., 2019; Dubey et al., 2021), drought (Lu et al., 2019), and cloud bursting (Dimri et al., 2017). In India, an increase in minimum temperature (by 0.15°C), maximum temperature (by 0.15°C), and mean temperature (by 0.13°C) were evident during 1986–2015 with high significance (Sanjay et al., 2020; Kumar S. et al., 2021); in contrast, decrease in precipitation (1–2 mm/day) was observed notably in the Indo-Gangetic plain, western Ghats, and northeastern part of India due to anthropogenic influences (Kulkarni et al., 2020). Previous studies have also reported an increase in the maximum temperature by 0.71°C and annual mean temperature by 0.5°C during 1971–2003 in India (Kothawale and Kumar, 2005). Additionally, extreme precipitation has significantly increased, whereas moderate precipitation has significantly decreased over the half-century (1951–2000) (Goswami et al., 2006; Rajeevan and Bhate, 2009). Previous research has also shown a sensitivity of land properties to regional or local scale climate change for the Indian region specifically on summer monsoon (Paul et al., 2016; Paul et al., 2018; Chawla et al., 2018; Maharana et al., 2019; Parida et al., 2020) and yearly temperature variations (Cao et al., 2020) using Weather Research Forecast (WRF) and Regional Climatic Model (RegCM). Weather Research Forecast–Advanced Weather Forecast (WRF–ARW) is a mesoscale and numerical weather prediction (NWP) for atmospheric research and forecasting systems (Skamarock et al., 2005). The model consists of a set of advanced physics equations with the numerical scheme, which is fully compressible, Eulerian, and non-hydrostatic with a run-time hydrostatic option, which is used for better sensitive analysis or predictions. Considering the role of large LULCC in regulating the climatic parameters, this present study is focused on simulating and downscaling annual precipitation and temperature using a state-of-the-art RCM and ultimately quantifying the changes in temperature and precipitation due to LULCC for the Indian subcontinent region.
2 Materials and Methods
2.1 WRF Model Configuration
The simulation has been conducted using Weather Research Forecast–Advanced Weather Forecast (WRF–ARW) model version 3.9.1 (https://www2.mmm.ucar.edu/wrf/users/docs/user_guide_V3/user_guide_V3.9/contents.html). The model uses terrain-following, hydrostatic-pressure vertical coordinate with the top of the model at constant pressure surface. The horizontal grid is the Arakawa-C grid (Skamarock et al., 2005). The WRF-ARW model consists of two parts, namely, the WRF pre-processing system (WPS) and WRF sections (Figure 1). The three parts related to geogrid, ungrib, and metgrib were combined in WPS in which geogrid was used to define the model domain and grid size, and interpolates the land surface boundary condition, i.e., LULC, into the grids (Figure 1). The model has to itself define the LULC categories and external LULC are reclassified as per defined classes as per USGS 24-category Land Use. Ungrib was used to extract information from meteorological variables, and it interpolates horizontal grids into the model grid, which is processed from static data in geogrid and accomplished in metgrib. The level-4 MODIS LAI are developed every 8 days at a 1-km resolution on a sinusoidal grid, which is used directly by the “Noah” land surface model within WRF (Kumar et al., 2014). The Noah land surface scheme gets modified with land use data that adjust the parameters of the vegetation fraction, vaporization, surface roughness (albedo cover), and so on for each grid and each domain. These parameters work for downscaling the data as per new scenarios of LULC. There are various tools like NCL, GrADS, or CDO that can be used for post-processing visualizations (Samie et al., 2020).
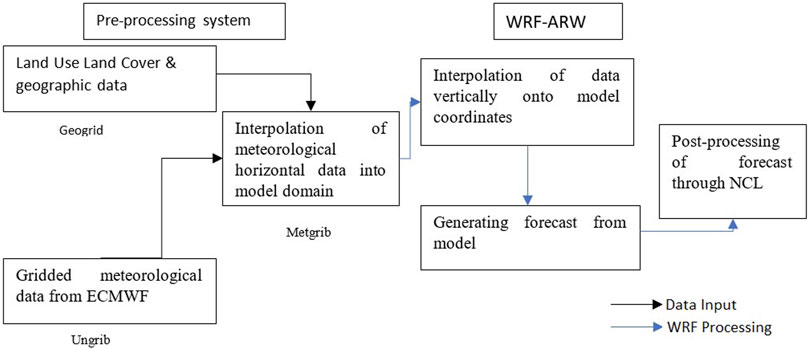
FIGURE 1. Workflow of the WRF model. The model consists of two sections, namely, the WRF pre-processing system (WPS) and WRF-ARW section.
2.2 WRF Simulations Setup
In the study, the nested domain with ratio 1:3 was used, in which D-01 referred to as a parent domain, D-02 as an intermediate domain, and D-03 as the main domain (Figure 2A). The parent domain (first nested domain) D-01 was fixed between 40°E–117°E and 5°S–45°N with 81 km grid spacing, comprising 8,560 grids (56,162,160 km2). The intermediate domain (second nested domain) D-02 was fixed between 58°E–110°E and 1°S–43.5°N with 27 km grid spacing, comprising 44,037 grids. The main domain (third nested domain) D-03, which covered the entire Indian sub-continent and fixed between 75°E–111°E and 15°N–40°N with 9 km grid spacing, comprises a total of 210,202 grids. These three domains were used at 30 vertical pressure levels with 50 hPa as top vertical level.
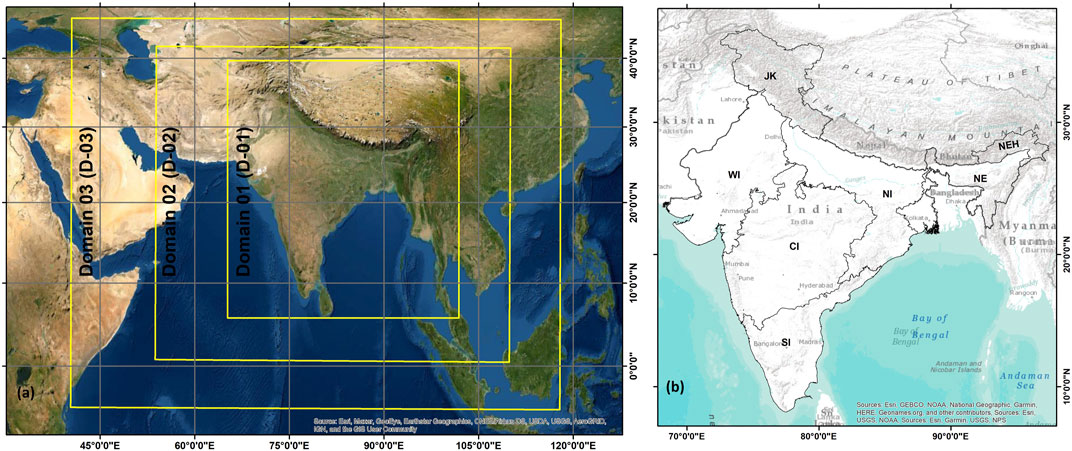
FIGURE 2. (A) Model domain, D-01 (8,560 grids with 81 km grid spacing); D-02 (44,037 grids with 27 km grid spacing); D-03 (210,202 grids with 9 km grid spacing)—used in WRF simulation and (B) Indian Meteorological Department (IMD)-based classified climatological regions.
The WRF model uses a large-scale forcing atmosphere and land for initialization of initial and lateral boundary conditions, and land surface boundary conditions. For WRF simulation, National Centres for Environmental Prediction (NCEP) global forecast system (GFS) reanalysis data at 1° horizontal resolution (Saha et al., 2010a; Decker et al., 2012), NCEP Climate Forecast System Reanalysis at 0.50° horizontal resolution (Saha et al., 2010b), and European Centre for Medium-Range Weather Forecast (ECMWF) reanalysis datasets at 0.75° horizontal resolution, which are available at 6-h intervals (i.e., at 00:00, 06:00, 12:00, and 18:00 h UTC), were used as boundary conditions. The details about various types and availability of boundary conditions can be found on the WRF user page WRF NCEP-NCAR GRIB DATA. In the study, initial and lateral boundary conditions were taken from ECMWF datasets (Dee et al., 2011) at a 6-hourly time scale for 7 years from 2009 to 2015 and 2009 was considered as a spin-up time.
This boundary condition at 6-h intervals in WRF was interpolated and updated as per grid spacing and model domain. The land surface boundary condition is already present in the WRF model as “Noah-modified 21-category IGBP-MODIS land use” with a horizontal grid spacing of 10 min, but it was replaced by MODIS—IGBP LULC of years 2002 and 2015. Due to the difference in the classification of WRF IGBP LULC and external LULC, it has been modified to make it conformal for analysis as shown in Table 1. The WRF model has varieties of physical parameterization schemes, which are used for different types of sensitivity analysis or simulations. Parameterization based on the various previous studies (Li et al., 2012; Paul et al., 2016; Paul et al., 2018) was considered for simulations. The model configuration and parameterization used are shown in Table 2. Finally, we conducted simulations for two different time periods of LULC, i.e., of 2002 and 2015 with an ECMWF reanalysis climatic data. The first simulation was performed with LULC of 2002, while the second simulation was performed with LULC of 2015 using the ECMWF climatic reanalysis data to quantify anthropogenic influences. Any differences in climatic conditions between 2002 and 2015 are automatically taken into consideration by the WRF model, and the resulting mean difference between the WRF simulated data for precipitation and temperature change of 2002 and 2015 was considered as changes due to LULC as a footprint of anthropogenic activities.
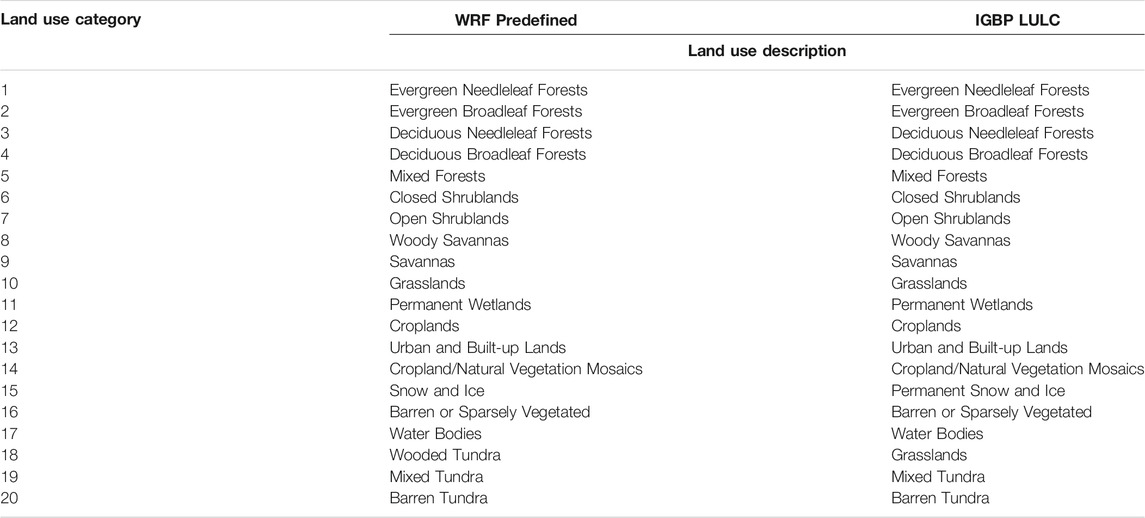
TABLE 1. Pre-defined WRF LULC and IGBP LULC.

TABLE 2. Model configuration used for WRF simulation.
To test the correlation between WRF simulated output and observed data from IMD for both temperature and precipitation, the spatial correlation method has been used using Eq. 1.
rxy is the correlation coefficient; xi is the sample x-variable; x̅ is the mean value of x-variable; yi is the sample y-variable; ȳ is the mean value of y-variable. The LAI changes were estimated in terms of percentage change (relative to 2002) using yearly mean of LAI for 2002 and 2015. The significance of the mean and median, temperature, and precipitation change across different LULC types between 2002 and 2015 was checked using a two-sided t-test (for mean) and Wilcoxon signed-rank test (for median).
3 Results and Discussion
3.1 Validation of Simulated Data
The reanalysis datasets as acquired from NCEP-CFSR and ECMWF were used as boundary conditions to simulate in WRF models. The time-series daily datasets of precipitation (GPM) and temperature (IMD) for the year 2015 were used for validation of these simulated datasets. Since 2009 was considered as a spin-up time, it was not included in the analysis. The high correlation in precipitation was observed in the eastern, central, southeastern, and western parts of India in contrast to the low correlation in the extreme northern parts (Figure 3). In case of temperature, a very high correlation was evident in the major parts of India that may be attributed to high anthropogenic influence in the form of LULC alterations. A similar observation of precipitation pattern was observed in all observed and simulated datasets for the year 2015. The low precipitation (∼>200 mm) was observed in the extreme northern parts, as observed in both GPM and IMD datasets, while simulated, and ERA-5 exhibited conformity of moderate precipitation (∼600 mm) in the major parts of the country (Figures 4D–G). Simulated precipitation was overestimated compared to observed datasets primarily in northeast (NE) India. While simulated precipitation was higher in the upper parts of western Ghats compared to the other three datasets (GPM, IMD, and ERA5) due to the LULC alterations (dense forest cover), IMD, ERA-5, and simulated datasets exhibited similar patterns in the remaining parts of the country, in contrast to GPM datasets. The observed (IMD), reanalysis (ERA-5), and simulated temperature data exhibited a similar pattern in major parts of India, except for a purely different pattern in extreme northern India. A comparatively less number of observations of IMD stations over the Himalayan region may lead to an error in interpolation in IMD datasets (Kishore et al., 2016; Li et al., 2018). Furthermore, the changes may be simulated more accurately as, in 2015, there was a larger snow cover area that increases the albedo and reduces the temperature over the region.
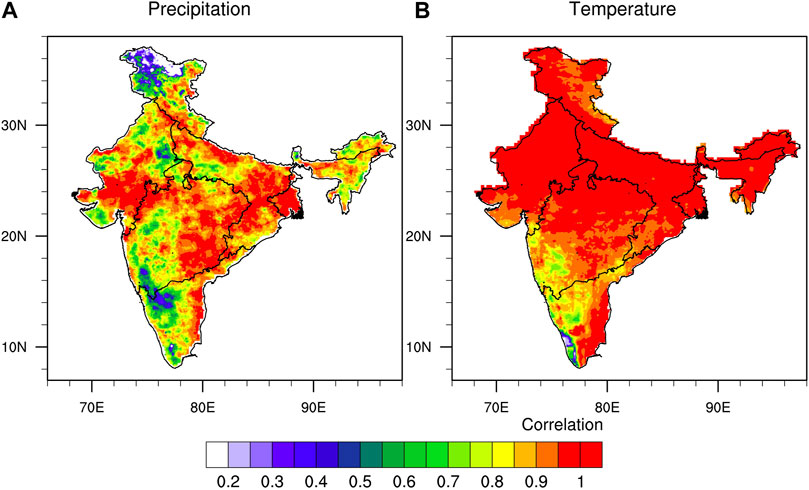
FIGURE 3. Correlation between observed (GPM for precipitation and IMD for temperature) and simulated (from WRF model) daily datasets of (A) precipitation (B) temperature in 2015.
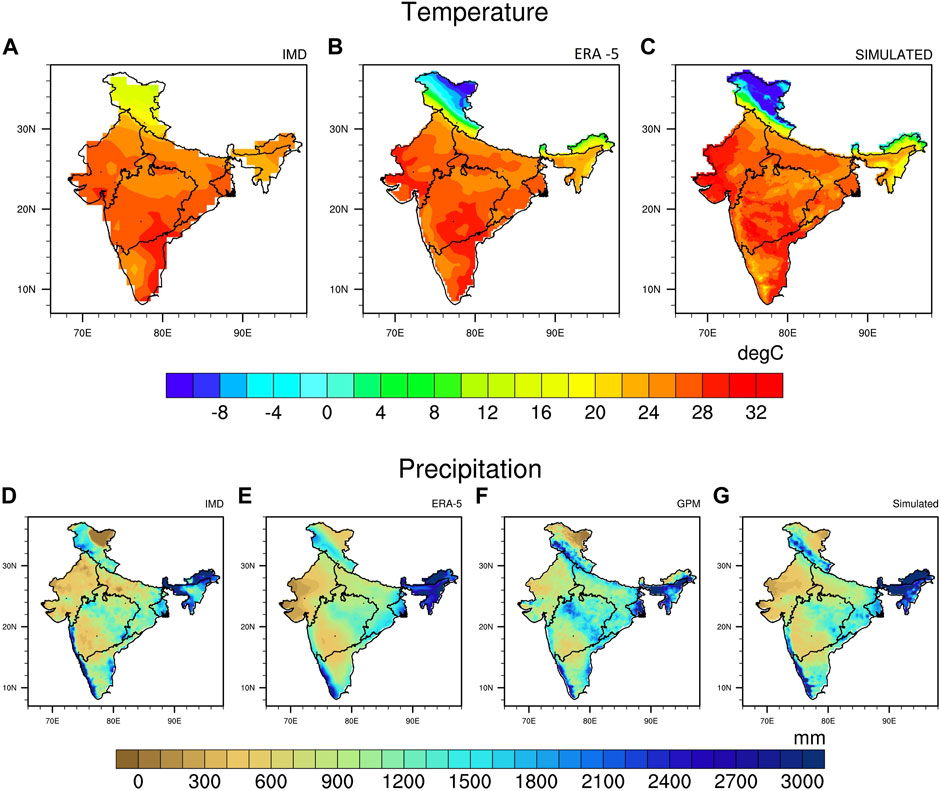
FIGURE 4. Comparison of temperature (A) observed from IMD, (B) reanalysis from ERA -5, and (C) simulated temperature datasets based on LULC-2015, and precipitation (D) from IMD, (E) ERA-5, (F) GPM, and (E) simulated precipitation at varying horizontal resolution during the year 2015.
3.2 Land Use/Land Cover Change Analysis
MODIS-based LULC datasets for the year 2002 and year 2015 were used separately in WRF modeling to simulate temperature and precipitation for the period 2009–2015 to deduce the changes. The study exhibited the maximum transition in the lower parts of central India, where grassland was converted into agriculture, and in western India, where barren land was converted into open shrubland (Figure 5A; Table 3). In the upper western ghats, the agricultural cover was replaced by forest cover. A recent study reported increasing greening over India despite a higher LULCC (Lal et al., 2019; Zhu et al., 2016) due to an increase in LAI (Figure 5B). The increased agricultural activity in the country led by use of fertilizers resulted in cropland LAI increase (Roy et al., 2007). The study also indicated major land transformation from shrubland to cropland (120,090 km2), followed by savannas to forest (34,832.78 km2), cropland to grassland (32,629.61 km2), and barren to grassland (30,978.41 km2) in India between 2002 and 2015 (Figure 5; Table 3). The large-scale land transformation with conclusive decrease was noticed in barren land, which was transformed to grassland (30,978.41 km2; primarily in the western India, as desert area transforming into grassland), followed by snow cover [5,451.79 km2; in Jammu and Kashmir (north India) snow cover increased], wetland (2,605.08 km2), and savannas (423.90 km2). Furthermore, the major increase in urban areas was evident at the cost of cropland (835.42 km2), following grassland (375.87 km2), and savannas (228.81 km2). The conversion of forest cover to savannas (18,247.11 km2) was noted during 2002–2015, while the large portions of savannas were converted to forest (∼34,832.78 km2) and cropland (23,595.59 km2) during the period. The detailed zone wise description of LULCC is discussed in the Supplementary Table.
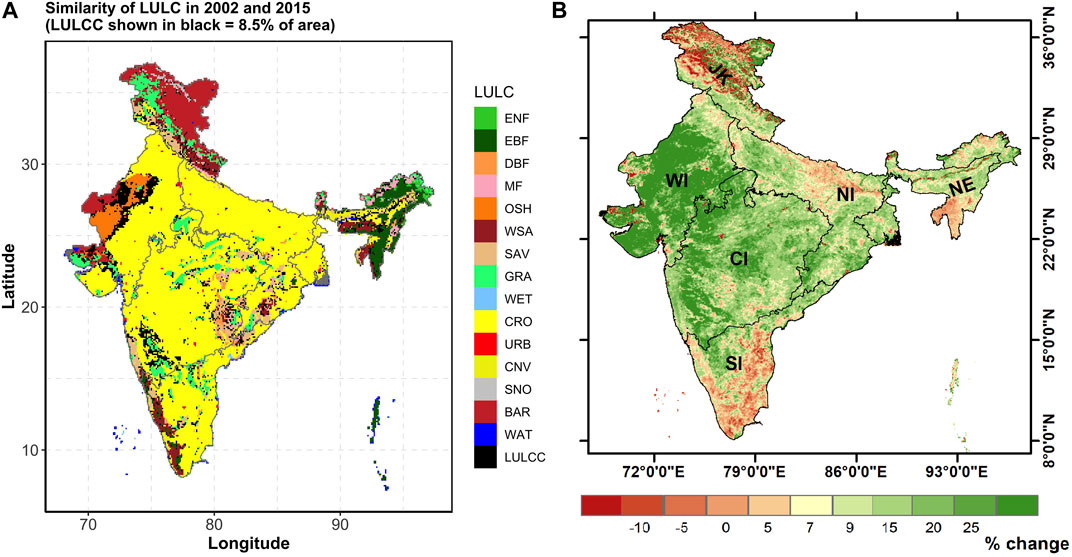
FIGURE 5. (A) MODIS MCD12Q1 land-use/land-cover change (LULCC) and (B) LAI change (relative to 2002) over India during 2002–2015. *Black color in (A) represents 8.5% area of India, which represent the dominant changes over India.
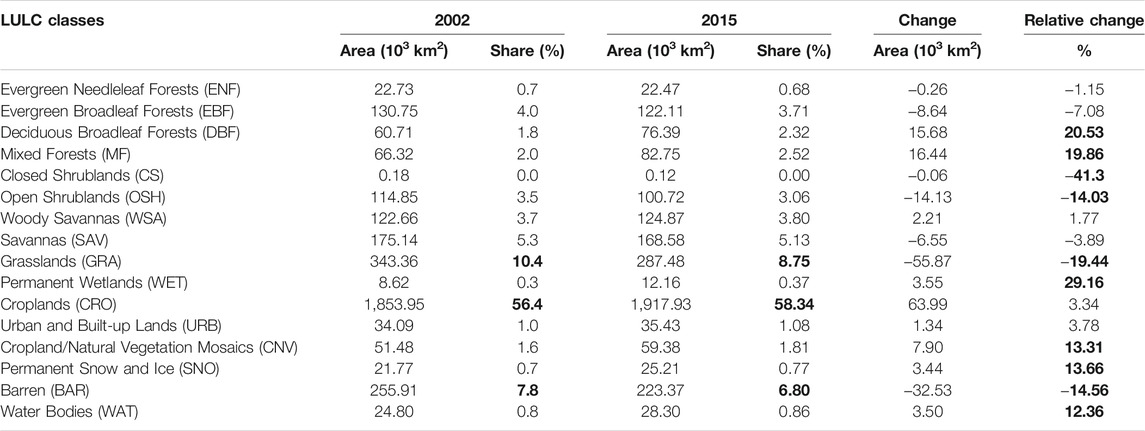
TABLE 3. Land use land cover change statistics between 2002 and 2015 for different land cover classes based on MODIS IGBP classification. “Change” refers to the difference between 2015 from 2002 (2015–2002), whereas “Relative Change” is change with respect to 2015.
The study observed a high reduction in LAI (<−5%) in south India, northern parts of north India, and lower parts of northeast India (Figure 5B). Despite browning in some regions, widespread greening was observed in major parts of India, attributed to intense agriculture practices and afforestation measures to support the recent policy, while the areas under browning conditions were largely deforested, and dominantly transformed from savannas to cropland due to agriculture intensification. Greening was observed in the regions having dominant transformation from savannas to forest (evergreen broadleaf forest), primarily tea plantations. Savannas have a higher LAI, which contains more water in their roots and leaves and thus supports high convective precipitation and transportation of moisture to the atmosphere.
3.3 LULCC Impact on Temperature
The LULCC modifies various parameters of the earth surface, among which temperature is one of the important parameters. Over the Indian subcontinent, we observe a divergent pattern of temperature change, with much of western and north India showing cooling whereas eastern and east-central part of India showing warming due to LULCC (Figure 6). The temperature difference between 2002 and 2015 due to LULCC was significant across all LULC types, except urban and water bodies (Figure 7), with grasslands, open shrublands and barren lands showing decrease in temperature whereas other LULC types showing increase in temperature. Changes in vegetation cover affect the flow of energy between the ground and the atmosphere, resulting in changes in temperature. Greening primarily promotes ET (and thereby increase in latent heat flux), but it does not necessarily lower the temperature as greener canopies have lower albedo than bare soil, and absorb incident sunlight, resulting in the more sensible heat flux. LULCC does not directly alter or regulate temperature, while it is caused and triggered through a series of concomitant changes. Other than greening and browning conditions, the entrapped long-wave radiation through the transpired water by plants rather reduces the amount of shortwave solar radiation through increased cloud formation. Previous studies reported a net cooling trend due to rising greening in the past 4 decades simulated from coupled ESMs (Bathiany et al., 2014; Zeng et al., 2016; Zeng et al., 2018a; Piao et al., 2020; Zhao et al., 2020). Also, in the tropical and subtropical regions, evaporative cooling is generally larger than albedo warming, a similar agreement found with the present study with the greenness augmentation. The temperature changes influenced by LULC change was analyzed using simulated (2015, 2002) and ECMWF reanalysis datasets. India lies under tropical and subtropical regions and has a maximum temperature in southeastern India and northern India (∼>25°C), in contrast to the eastern and western Himalayan region having the lowest temperature (∼4°C).
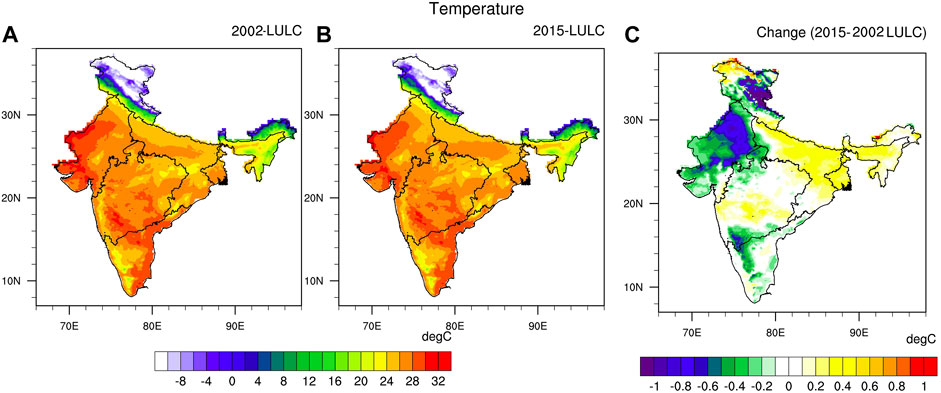
FIGURE 6. Mean temperature simulation (mean of 2010–2015) based on (A) LULC-2002, (B) LULC-2015, and (C) the change between two LULC simulations.
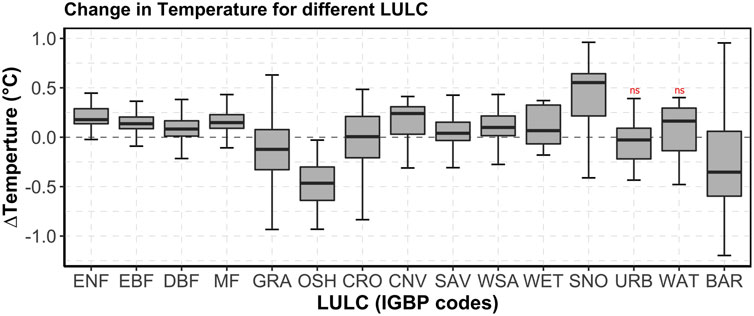
FIGURE 7. Mean changes in temperature (2015–2002) across different land-use/land-cover (LULC) types. The LULC is shown as International Geosphere-Biograph Program (IGBP) codes of land cover. The “ns” above the error-point denotes that the mean and median change was not significantly different from zero as per t-test and Wilcoxon rank sum test, respectively. The error bar shows the standard deviation of all the data points.
The LULCC influences temperatures through changes in albedo that can act toward warming when it decreases, but toward cooling when it increases. The differences between the simulated datasets provide the potential impact of different LULCC on temperature (Figures 4A–C). It is observed that the central to eastern parts of India were getting warmer, while the central to western parts were getting cooler. The major country-wide transformation occurred as grassland to cropland, followed by savannas to forest cover during 2002–2015. Overall, the trend of grassland to cropland transformation affects the seasonal phenomenon, while savannas-to-forest transformation tends to have a warming effect (as observed in northeast India). The study showed cooling effects, which were dominant in the western, northern, and south India and lower parts of central India as well. A decrease in temperature (∼0.5°C) is observed in the northeastern Himalayas region primarily due to the increase in snow cover replacing barren land, and parts of barren land converted into shrubland/grassland, which affects the climatic parameters. A significant decrease in temperature (∼0.8°C) was observed in the eastern Jammu and Kashmir (J&K) bordering Tibet, whereas an increase in temperature (∼0.2°C) was noted in the northern parts of J&K. Eastern parts of J&K have had large-scale change in LULC due to anthropogenic activities and natural disasters. In general, there was an increase in savannas and forest by replacing barren land and grassland, while new grasslands were transformed from barren land. A small portion of snow cover in the northern parts of J&K was transformed to barren land, enabling higher surface roughness to trap more heat compared to the snow cover.
Another important parameter is that anthropogenic influence, viz., construction of transportation networks in snow-covered regions, traps more sunlight and contributes significantly to temperature rise. Due to extensive urbanization and mostly agrarian activities throughout the decades and decrease in LAI, the temperature primarily in northern India and the western parts of northeast India rose by ∼0.4°C. Due to the intense irrigation, the vegetation vigor increased during 2015, while LAI decreased by ∼5% in the region. The reduced LAI, counteracting the water content, induces warming in the area, other than urbanization. The increase in urban area modifies surface roughness and thus traps more albedo, which increases the temperature in certain regions. The northern parts of south India and lower parts of central India observed cooling primarily due to the significant transformation of grasslands to croplands, with an increase in greening due to increased LAI (by ∼15%–20%). Comparatively lesser water content in grassland than cropland induce lesser greening in grassland, and thus, such land modification leads to a decrease in the temperature. The conversion of shrubland to croplands was observed in western India that experienced increased precipitation by ∼100 mm (Figure 8C), with an extreme increase in greening (LAI ∼>25%; Figure 6B), leading to a significant cooling. It is notable that the cropland acts cooler due to high availability of water content in the crop field and high leaf water content in contrast to the leaves of grassland and shrubland. The surface roughness in a grassland leads to higher trapped albedo, making the surface warmer. In contrast, the higher leaf water content and less surface roughness in cropland make the surface comparatively cooler during pre-harvesting period. In India, demand and supply for irrigation have tremendously increased (Rodell et al., 2004; Roy et al., 2007) due to the advancement of machinery and tools in recent decades, and with the increased support of local governments to farmers. The remaining parts of India observed anthropogenic induced LULC change with very minimum influence on temperature. The use of simulated precipitation and temperature-based land use/land cover change can be integrated with other factors including change in emission factor, micro-climate change assessment, and pollution using WRF for improved results.
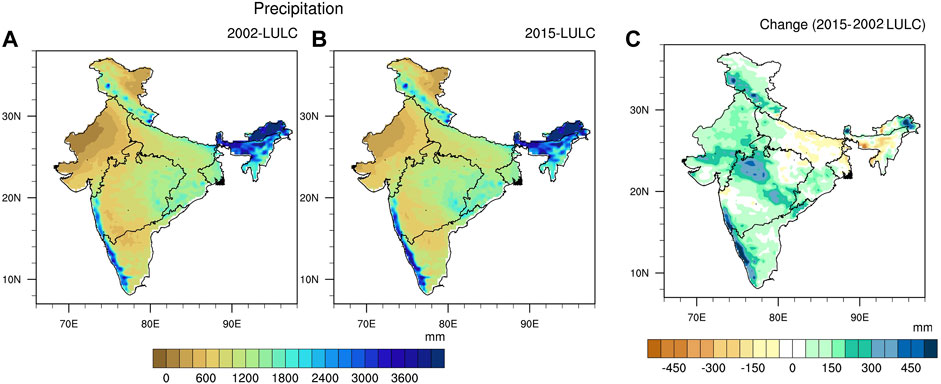
FIGURE 8. Simulated precipitation data of (A) 2002 LULC, (B) 2015 LULC, and (C) major changes in precipitation due to LULCC during 2002–2015.
3.4 Impact of LULCC on Precipitation
The simulated precipitation (based on the mean of 2010–2015) with reference to the LULC 2002 and LULC 2015 was used to understand the influence of LULC change on precipitation patterns by differencing the two simulated precipitation datasets (Figures 4D–G). The study exhibited an increase in precipitation amount (>300 mm) in the parts of eastern (easternmost region of northeastern Himalayas) and western Himalayas (lower part of J&K), western Ghats (coastal region of central India and south India), and northwestern parts of central India. The precipitation difference between 2002 and 2015 due to LULCC was significantly higher in 2015 (difference >0) across all LULC types, except wetlands and water bodies (Figure 9). In arid regions of western India, the shrubland to cropland, and barren land to shrubland/cropland, were the dominant land transformation with increased simulation precipitation (by 100–150 mm) during 2015. This region also observed the highest increase (>25%) in LAI and attributed to an increase in the cropland area due to intensified irrigation. It influences high leaf water content compared to barren land and shrubland, leading to high ET and more regional precipitation. The decrease in precipitation in northern India could be attributed to intensive farming, and minimum LULCC coupled with minor reduction in LAI (∼8%). Due to increasing urbanization and decreasing surface porosity, the low-level air circulations get reduced, causing instability in the boundary layer, and reduction in precipitation. The negligible changes in the precipitation (<50 mm) were observed in southern and northeastern parts of India, while very high precipitation (>300 mm) was noted in western ghats, attributed to increasing forest cover, despite decrease in the LAI. These regions have primarily been modified from dense forest cover to commercial plantation leading to less greening. Previously, major parts of western ghats were primarily covered with the evergreen needleleaf forest (ENF), which was converted into evergreen broadleaf forest (EBF) having more leaf water causing an increase in the precipitation despite a decrease in the greenness. Negligible changes in the precipitation patterns (>50 mm) were observed in the lower part of central India. This region observed a transition from grassland to cropland that does not much affect the hydrological cycle, while an increase in precipitation (∼300 mm) is evident in the western parts of central India due to the increase of forest cover coupled with increased LAI (by 20%). This may be attributed to the government forest conservation policies and its effective implementation that led to high ET.
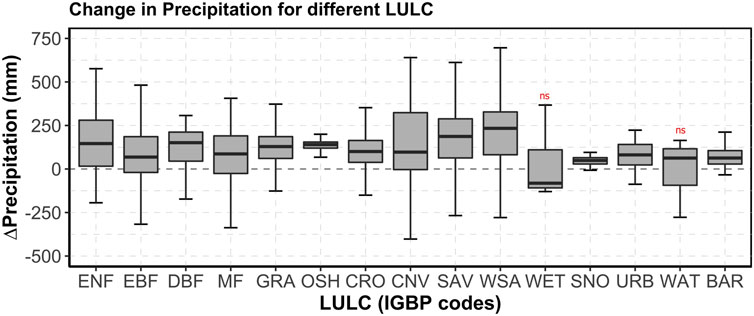
FIGURE 9. Mean changes in precipitation (2015–2002) across different land-use/land-cover (LULC) types. The LULC is shown as International Geosphere-Biograph Program (IGBP) codes of land cover. The “ns” above the error-point denotes that the mean and median change was not significantly different from zero as per t-test and Wilcoxon rank sum test, respectively. The error bar shows the standard deviation of all the data points.
The easternmost parts of northeast Himalayas have an exceptional increase in precipitation (∼100–150 mm), which shows similar agreement with the increase of LAI (by ∼15%), due to the transformation of snow cover and barren land to ENF cover, while the remaining parts of northeast Himalayas have no significant changes in precipitation influenced by LULC change. The major parts of northeast India observed a decrease in precipitation primarily attributed to shifting cultivation and decrease in greenness (decreased by ∼10%–15%). The reduced vegetation cover tends to reduce the latent heat flux and evaporation. The decrease in LAI coupled with reduction in albedo would reduce evaporation and transpiration, which induce a decrease in precipitation in NE India. The dense forest in lower parts of J&K observed an increase in precipitation (150–200 mm), with a slight increase in LAI (∼15%) during 2015 and reported an increasing greening pattern.
Precipitation, an important meteorological factor, is a key link to the global and regional hydrological cycle. Convective precipitation is the main source to the major parts of forest in India. The surface water losses to the atmosphere occur through ET, which include transpiration (50%–80%, varies with different plant type) and evaporation (Kemp et al., 1997; Hatfield and Dold, 2019; Wang et al., 2020; Gimeno et al., 2021). Greening expands the loss of water through an extended leaf area, and the study found similar observations in that regions with an increased LAI observed high precipitation barring a few exceptions. With the rise in LAI, a larger foliage of leaves lowers the radiation contact with bare ground surfaces and restricts soil evaporation, but increases the re-evaporation precipitation intercepted by leaves; thus, high greening can alter net evaporation. Due to intense greening, a significant increase in terrestrial evapotranspiration was observed, suggesting an intensified water exchange between land and atmosphere as feedback proportional to greening and browning as supported by various previous studies (Zhang et al., 2015; Zeng et al., 2017; Zeng et al., 2018b; Xu et al., 2020; Abbas et al., 2021; Kuhn and Butman, 2021). The overall phenomenon leads to a greening-induced ET enhancement that increases atmospheric water vapor content and promotes downwind precipitation.
The integration of WRF with the land model is widely used for accessing climate change due to anthropogenic effects; a few studies tried to address the effect of LULC on climate change. Paul et al. (2016) and Paul et al. (2018) have used the WRF model for simulating and downscaling summer monsoon precipitation in the Indian region and southern India for addressing the impact of LULCC on moisture supply especially during 1983–2011 and found that savannas and forest cover play an important role in moisture supply. Hua et al. (2015) reported the direct association of large regional responses to climate change with LULCC under RCP2.6 and RCP8.5 scenarios using the CanESM2 model and highlighted a cooling effect in the western United States and Eurasia due to the decrease in the needleleaf evergreen trees, while warming (by ∼0.1°C) in the tropics due to substantial LULC change. Cao et al. (2015) reported a widespread reduction of summer temperature (∼1°C) and extensive increase in winter temperature (∼0.8°) due to land use change during 2001–2010 in the agro-pastoral transitional zone of North China. Li X. et al. (2018) used the WRF model and reported a dramatic increase in temperature due to a decrease in the latent heat flux and an increase in sensible heat flux caused by urbanization, while an increase in precipitation primarily in the eastern part of Kolkata due to irrigation. Zhang et al. (2010) concluded that rapid conversion of croplands to urban leads to increased temperature and precipitation with decreased surface humidity, with a stronger influence in summer than in winter in China using WRF. Through incorporating Noah Urban Canopy with the WRF model, Grossman-Clarke et al. (2010) explored contributions of urban expansion to near-surface air temperature and concluded the rise in maximum temperature while the conversion of irrigated agricultural lands to developed areas. Patel et al. (2020) used the WRF model integrated with World Urban Data Analysis and Portal Tool (WUDAPT)-based Local Climate zones to simulate the heavy rain events and reported the influence of building height, building distribution, open surfaces, and other thermal parameters on precipitation at microscale in the city region. Similarly, the conversion of grassland to cropland and urban resulted in an increased air temperature (by ∼0.23°C) during summer, while afforestation leads to an increase in the air temperature (by ∼0.1°C) in the Lhasa River basin (Tibetan Plateau) during two runs of the model (1980 and 2015) because latent heat flux and sensible heat flux are highly sensitive to land cover changes, and other fluxes seem to be weaker (Li et al., 2020). A similar observation in Beijing as transformation from cropland to urban leads to increase in air temperature of ∼0.36°C during 1900–2010 as modeled using WRF (Li J. et al., 2018).
4 Conclusion
This study highlights the potential of the WRF-ARW modeling for sensitivity analysis of temperature and precipitation changes due to LULC changes in India. The simulated precipitation and temperature (mean of 2010–2015) with reference to the LULC 2002 and LULC 2015 provided a better understanding of the LULC change and its influence on precipitation and temperature patterns. The high correlation in precipitation was observed in the eastern, central, southeastern, and western parts of India, while very high correlation in temperature was evident in the remaining parts of India, attributed to high anthropogenic influence in the form of LULC alterations. The maximum transition occurred in the lower parts of central India, where grassland was converted into agriculture, and in western India, where barren land was converted into open shrubland, whereas, in the upper western ghats, the agricultural land was replaced by forest cover. The study exhibited an increase in precipitation patterns (>300 mm) in the parts of eastern and western Himalayas, western ghats, and northwestern parts of central India. The rise in the simulation precipitation (by 100–150 mm) during 2015 is related to large-scale transformation of shrubland to cropland, and barren land to shrubland/cropland in western arid regions of India. These arid regions also observed the highest increase in LAI (>25%) and attributed to an intensified irrigation induced high leaf water content. In north India, the decrease in precipitation could be attributed to intensive farming, and where minimum LULC change is coupled with minor reduction in LAI (∼8%). The study concluded a major decrease in grassland, and savanna, while an increase in deciduous broadleaf forest and cropland during 2002–2015. The decrease in precipitation was mainly evident in the regions that experienced transformation of savannas by agricultural or needle leaf forest. Major parts of India experienced cooling of temperature (western arid regions, central to western parts) while the central to eastern parts of India were getting warmer. The major country-wide transformation occurred as grassland to cropland followed by savannas to forest cover. In the eastern northeastern Himalayas, a decrease in temperature (∼0.5°C) was observed in the region primarily due to the extent of snow cover land increased on the cost of barren land and lower part barren land converted into shrubland/grassland that affects the climatic parameters. This study highlights the changes in temperature and precipitation in recent decades because of large LULC change and necessitates formulation of sustainable land use-based strategies to control meteorological variability and augment ecological sustainability.
Towards these ends, the study highlights the impact of anthropogenic activities (LULCC) on temperature and precipitation at temporal and spatial scales that efficiently support land use planners, policymakers, and agencies in strategy formulation for climate change mitigation and adaptation, and sustainable use of ecosystem services. Such services and policies can be balanced with other co-benefits related to conservation of primarily forest and agriculture. The high-resolution LULC (10–30 m) can be ingested to regional climate models to understand the interactions between LULCC and climatic parameters and to project the future climatic scenarios may be the future scope.
Data Availability Statement
The original contributions presented in the study are included in the article/Supplementary Material, further inquiries can be directed to the corresponding authors.
Author Contributions
PL, AS, and AK contributed to conception and design of the study. PL organized the database. PL performed the statistical analysis. PL wrote the first draft of the manuscript. PL, AS, and AK wrote sections of the manuscript. All authors contributed to manuscript revision, read, and approved the submitted version.
Conflict of Interest
The authors declare that the research was conducted in the absence of any commercial or financial relationships that could be construed as a potential conflict of interest.
Publisher’s Note
All claims expressed in this article are solely those of the authors and do not necessarily represent those of their affiliated organizations, or those of the publisher, the editors, and the reviewers. Any product that may be evaluated in this article, or claim that may be made by its manufacturer, is not guaranteed or endorsed by the publisher.
Acknowledgments
The authors sincerely thank the reviewers and the Editor of the Journal for reviewing the manuscript and providing critical comments to improve the quality of the paper. The authors acknowledge NASA and ECMWF for public availability of datasets used in this study. AS acknowledges funding by ETH Zürich project FEVER ETH-27 19-1. The authors also acknowledge the open access APC funding by the ETH Zürich Bibliothek.
Supplementary Material
The Supplementary Material for this article can be found online at: https://www.frontiersin.org/articles/10.3389/fenvs.2021.766328/full#supplementary-material
Abbreviations
BAR, barren; CNV, cropland/natural vegetation mosaics; CRO, Croplands; CS, closed shrublands; DBF, deciduous broadleaf forests; ENF, evergreen needleleaf forests; EBF, evergreen broadleaf forests; GCMs, global circulation models; GHGs, greenhouse gases; GRA, grasslands; LULC, land use/land cover; LULCC, land use/land cover changes; MF, mixed forests; OSH, open shrublands; WSA, woody savannas; SAV, savannas; WET, permanent wetlands; URB, urban and built-up lands; SNO, permanent snow and ice; WAT, water bodies; LAI, leaf area index; RCMs, regional circulation models; WRF, weather research forecast.
References
Abbas, S., Nichol, J. E., and Wong, M. S. (2021). Trends in Vegetation Productivity Related to Climate Change in China's Pearl River Delta. PLOS ONE 16, e0245467. doi:10.1371/journal.pone.0245467
Ahmad, T., Pandey, A. C., and Kumar, A. (2021). Long-Term Precipitation Monitoring and its Linkage with Flood Scenario in Changing Climate Conditions in Kashmir valley. Geocarto Int., 1–26. doi:10.1080/10106049.2021.1923829
Bathiany, S., Claussen, M., and Brovkin, V. (2014). CO2-Induced Sahel Greening in Three CMIP5 Earth System Models. J. Clim. 27, 7163–7184. doi:10.1175/JCLI-D-13-00528.1
Betts, A. K., Ball, J. H., Beljaars, A. C. M., Miller, M. J., and Viterbo, P. A. (1996). The Land Surface-Atmosphere Interaction: A Review Based on Observational and Global Modeling Perspectives. J. Geophys. Res. 101, 7209–7225. doi:10.1029/95JD02135
Bonan, G. B. (2008). Forests and Climate Change: Forcings, Feedbacks, and the Climate Benefits of Forests. Science 320, 1444–1449. doi:10.1126/science.1155121
Brovkin, V., Claussen, M., Driesschaert, E., Fichefet, T., Kicklighter, D., Loutre, M. F., et al. (2006). Biogeophysical Effects of Historical Land Cover Changes Simulated by Six Earth System Models of Intermediate Complexity. Clim. Dyn. 26, 587–600. doi:10.1007/s00382-005-0092-6
Cao, F., Dan, L., Ma, Z., and Gao, T. (2020). Assessing the Regional Climate Impact on Terrestrial Ecosystem Over East Asia Using Coupled Models With Land Use and Land Cover Forcing During 1980–2010. Sci. Rep. 10, 2572. doi:10.1038/s41598-020-59503-4
Cao, Q., Yu, D., Georgescu, M., Han, Z., and Wu, J. (2015). Impacts of Land Use and Land Cover Change on Regional Climate: a Case Study in the Agro-Pastoral Transitional Zone of China. Environ. Res. Lett. 10, 124025. doi:10.1088/1748-9326/10/12/124025
Chakraborty, D., Sehgal, V. K., Dhakar, R., Ray, M., and Das, D. K. (2019). Spatio-temporal Trend in Heat Waves over India and its Impact Assessment on Wheat Crop. Theor. Appl. Climatol. 138, 1925–1937. doi:10.1007/s00704-019-02939-0
Chawla, I., Osuri, K. K., Mujumdar, P. P., and Niyogi, D. (2018). Assessment of the Weather Research and Forecasting (WRF) Model for Simulation of Extreme Rainfall Events in the Upper Ganga Basin. Hydrol. Earth Syst. Sci. 22, 1095–1117. doi:10.5194/hess-22-1095-2018
Clavero, M. (2016). Species Substitutions Driven by Anthropogenic Positive Feedbacks: Spanish Crayfish Species as a Case Study. Biol. Conservation 193, 80–85. doi:10.1016/j.biocon.2015.11.017
Decker, M., Brunke, M. A., Wang, Z., Sakaguchi, K., Zeng, X., and Bosilovich, M. G. (2012). Evaluation of the Reanalysis Products from GSFC, NCEP, and ECMWF Using Flux tower Observations. J. Clim. 25, 1916–1944. doi:10.1175/jcli-d-11-00004.1
Dee, D. P., Uppala, S. M., Simmons, A. J., Berrisford, P., Poli, P., Kobayashi, S., et al. (2011). The ERA-Interim Reanalysis: Configuration and Performance of the Data Assimilation System. Q.J.R. Meteorol. Soc. 137, 553–597. doi:10.1002/qj.828
Dimri, A. P., Chevuturi, A., Niyogi, D., Thayyen, R. J., Ray, K., Tripathi, S. N., et al. (2017). Cloudbursts in Indian Himalayas: A Review. Earth-Science Rev. 168, 1–23. doi:10.1016/j.earscirev.2017.03.006
Dirmeyer, P. A., and Shukla, J. (1994). Albedo as a Modulator of Climate Response to Tropical Deforestation. J. Geophys. Res. 99, 20863–20877. doi:10.1029/94JD01311
Dubey, A. K., Lal, P., Kumar, P., Kumar, A., and Dvornikov, A. Y. (2021). Present and Future Projections of Heatwave Hazard-Risk over India: A Regional Earth System Model Assessment. Environ. Res. 201, 111573. doi:10.1016/j.envres.2021.111573
Dudhia, J. (1989). Numerical Study of Convection Observed during the Winter Monsoon Experiment Using a Mesoscale Two-Dimensional Model. J. Atmos. Sci. 46, 3077–3107. doi:10.1175/1520-0469(1989)046<3077:nsocod>2.0.co;2
Duveiller, G., Caporaso, L., Abad-Viñas, R., Perugini, L., Grassi, G., Arneth, A., et al. (2020). Local Biophysical Effects of Land Use and Land Cover Change: Towards an Assessment Tool for Policy Makers. Land Use Policy 91, 104382. doi:10.1016/j.landusepol.2019.104382
Fairall, C. W., Bradley, E. F., Hare, J. E., Grachev, A. A., and Edson, J. B. (2003). Bulk Parameterization of Air-Sea Fluxes: Updates and Verification for the COARE Algorithm. J. Clim. 16, 571–591. doi:10.1175/1520-0442(2003)016<0571:bpoasf>2.0.co;2
Field, C. B., Jackson, R. B., and Mooney, H. A. (1995). Stomatal Responses to Increased CO2: Implications from the Plant to the Global Scale. Plant Cel Environ 18, 1214–1225. doi:10.1111/j.1365-3040.1995.tb00630.x
Foley, J. A., DeFries, R., Asner, G. P., Barford, C., Bonan, G., Carpenter, S. R., et al. (2005). Global Consequences of Land Use. Science 309, 570–574. doi:10.1126/science.1111772
Forstmaier, A., Shekhar, A., and Chen, J. (2020). Mapping of Eucalyptus in Natura 2000 Areas Using Sentinel 2 Imagery and Artificial Neural Networks. Remote Sensing 12, 2176. doi:10.3390/rs12142176
Gimeno, L., Eiras-Barca, J., Durán-Quesada, A. M., Dominguez, F., van der Ent, R., Sodemann, H., et al. (2021). The Residence Time of Water Vapour in the Atmosphere. Nat. Rev. Earth Environ. 2, 558–569. doi:10.1038/s43017-021-00181-9
Goswami, B. N., Venugopal, V., Sengupta, D., Madhusoodanan, M. S., and Xavier, P. K. (2006). Increasing Trend of Extreme Rain Events Over India in a Warming Environment. Science 314, 1442–1445. doi:10.1126/science.1132027
Govorushko, S. (2016). Human Impact on the Environment: An Illustrated World Atlas. Springer International Publishing. doi:10.1007/978-3-319-24957-5
Grossman-Clarke, S., Zehnder, J. A., Loridan, T., and Grimmond, C. S. B. (2010). Contribution of Land Use Changes to Near-Surface Air Temperatures during Recent Summer Extreme Heat Events in the Phoenix Metropolitan Area. J. Appl. Meteorology Climatology 49, 1649–1664. doi:10.1175/2010JAMC2362.1
Halder, S., Saha, S. K., Dirmeyer, P. A., Chase, T. N., and Goswami, B. N. (2016). Investigating the Impact of Land-Use Land-Cover Change on Indian Summer Monsoon Daily Rainfall and Temperature during 1951-2005 Using a Regional Climate Model. Hydrol. Earth Syst. Sci. 20, 1765–1784. doi:10.5194/hess-20-1765-2016
Hales, K., Neelin, J. D., and Zeng, N. (2004). Sensitivity of Tropical Land Climate to Leaf Area Index: Role of Surface Conductance versus Albedo*. J. Clim. 17, 1459–1473. doi:10.1175/1520-0442(2004)017<1459:sotlct>2.0.co;2
Hatfield, J. L., and Dold, C. (2019). Water-Use Efficiency: Advances and Challenges in a Changing Climate. Front. Plant Sci. 10, 1459. doi:10.3389/fpls.2019.00103
Hibbard, K., Janetos, A., van Vuuren, D. P., Pongratz, J., Rose, S. K., Betts, R., et al. (2010). Research Priorities in Land Use and Land-Cover Change for the Earth System and Integrated Assessment Modelling. Int. J. Climatol. 30, 2118–2128. doi:10.1002/joc.2150
Hong, S.-Y., Dudhia, J., and Chen, S.-H. (2004). A Revised Approach to Ice Microphysical Processes for the Bulk Parameterization of Clouds and Precipitation. Mon. Wea. Rev. 132, 103–120. doi:10.1175/1520-0493(2004)132<0103:aratim>2.0.co;2
Hong, S.-Y., and Lim, J.-O. J. (2006). The WRF Single-Moment 6-Class Microphysics Scheme (WSM6). J. Korean Meteorol. Soc 42, 129–151.
Hua, W., Chen, H., Sun, S., and Zhou, L. (2015). Assessing Climatic Impacts of Future Land Use and Land Cover Change Projected with the CanESM2 Model. Int. J. Climatol 35, 3661–3675. doi:10.1002/joc.4240
Jacob, D., and Podzun, R. (1997). Sensitivity Studies with the Regional Climate Model REMO. Meteorl. Atmos. Phys. 63, 119–129. doi:10.1007/BF01025368
Jin, J., Miller, N. L., and Schlegel, N. (2010). Sensitivity Study of Four Land Surface Schemes in the WRF Model. Adv. Meteorology 2010, e167436. doi:10.1155/2010/167436
Kain, J. S. (2004). The Kain-Fritsch Convective Parameterization: An Update. J. Appl. Meteorol. 43, 170–181. doi:10.1175/1520-0450(2004)043<0170:tkcpau>2.0.co;2
Kang, I.-S., Jin, K., Wang, B., Lau, K.-M., Shukla, J., Krishnamurthy, V., et al. (2002). Intercomparison of the Climatological Variations of Asian Summer Monsoon Precipitation Simulated by 10 GCMs. Clim. Dyn. 19, 383–395. doi:10.1007/s00382-002-0245-9
Kemp, P. R., Reynolds, J. F., Pachepsky, Y., and Chen, J.-L. (1997). A Comparative Modeling Study of Soil Water Dynamics in a Desert Ecosystem. Water Resour. Res. 33, 73–90. doi:10.1029/96WR03015
Kishore, P., Jyothi, S., Basha, G., Rao, S. V. B., Rajeevan, M., Velicogna, I., et al. (2016). Precipitation Climatology over India: Validation with Observations and Reanalysis Datasets and Spatial Trends. Clim. Dyn. 46, 541–556. doi:10.1007/s00382-015-2597-y
Kothawale, D. R., and Rupa Kumar, K. (2005). On the Recent Changes in Surface Temperature Trends over India. Geophys. Res. Lett. 32, 18714. doi:10.1029/2005GL023528
K. Raghavan, S. Jayanarayanan, C. Gnanaseelan, M. Mujumdar, A. Kulkarni, and S. Chakraborty (Editors) (2020). Assessment of Climate Change over the Indian Region: A Report of the Ministry of Earth Sciences (MoES), Government of India (Springer Singapore). doi:10.1007/978-981-15-4327-2
Kueppers, L. M., Snyder, M. A., Sloan, L. C., Cayan, D., Jin, J., Kanamaru, H., et al. (2008). Seasonal Temperature Responses to Land-Use Change in the Western United States. Glob. Planet. Change 60, 250–264. doi:10.1016/j.gloplacha.2007.03.005
Kuhn, C., and Butman, D. (2021). Declining Greenness in Arctic-Boreal Lakes. Proc. Natl. Acad. Sci. USA 118, e2021219118. doi:10.1073/pnas.2021219118
Kulkarni, A., Sabin, T. P., Chowdary, J. S., Rao, K. K., Priya, P., Gandhi, N., et al. (2020). “Precipitation Changes in India,” in Assessment of Climate Change over the Indian Region: A Report of the Ministry of Earth Sciences (MoES), Government of India. Editors R. Krishnan, J. Sanjay, C. Gnanaseelan, M. Mujumdar, A. Kulkarni, and S. Chakraborty (Singapore: Springer), 47–72. doi:10.1007/978-981-15-4327-2_3
Kumar, A., Chen, F., Barlage, M., Ek, M. B., and Niyogi, D. (2014). Assessing Impacts of Integrating MODIS Vegetation Data in the Weather Research and Forecasting (WRF) Model Coupled to Two Different Canopy-Resistance Approaches. J. Appl. Meteorology Climatology 53, 1362–1380. doi:10.1175/JAMC-D-13-0247.1
Kumar, A., Pandey, A. C., Pandey, S., and Srivastava, P. K. (2021a). Evaluating Long-Term Variability in Precipitation and Temperature in Eastern Plateau Region, India, and its Impact on Urban Environment. Environ. Dev. Sustain. 23, 3731–3761. doi:10.1007/s10668-020-00742-w
Kumar, G., Kumari, R., Kishore, B. S. P. C., Saikia, P., Kumar, A., and Khan, M. L. (2020a). “Climate Change Impacts and Implications: An Indian Perspective,” in Socio-economic and Eco-Biological Dimensions in Resource Use and Conservation. Editors N. Roy, S. Roychoudhury, S. Nautiyal, S. K. Agarwal, and S. Baksi (Cham: Springer International Publishing), 11–30. doi:10.1007/978-3-030-32463-6_2
Kumar, S., Lal, P., and Kumar, A. (2021b). Influence of Super Cyclone "Amphan" in the Indian Subcontinent amid COVID-19 Pandemic. Remote Sens. Earth Syst. Sci. 4, 96–103. doi:10.1007/s41976-021-00048-z
Kumar, S., Lal, P., and Kumar, A. (2020b). Turbulence of Tropical Cyclone 'Fani' in the Bay of Bengal and Indian Subcontinent. Nat. Hazards 103, 1613–1622. doi:10.1007/s11069-020-04033-5
Lal, P., Dubey, A. K., Kumar, A., Kumar, P., and Dwivedi, C. S. (2019). Sar - Optical Remote Sensing Based Forest Cover and Greenness Esti-Mation over India. ISPRS Ann. Photogramm. Remote Sens. Spat. Inf. Sci. IV-5/W2, 49–56. doi:10.5194/isprs-annals-IV-5-W2-49-2019
Lal, P., Kumar, A., Bharti, S., Saikia, P., Adhikari, D., and Khan, M. L. (2021a). Lockdown to Contain the COVID-19 Pandemic: An Opportunity to Create a Less Polluted Environment in India. Aerosol Air Qual. Res. 21, 200229. doi:10.4209/aaqr.2020.05.0229
Lal, P., Kumar, A., Kumar, S., Kumari, S., Saikia, P., Dayanandan, A., et al. (2020a). The Dark Cloud with a Silver Lining: Assessing the Impact of the SARS COVID-19 Pandemic on the Global Environment. Sci. Total Environ. 732, 139297. doi:10.1016/j.scitotenv.2020.139297
Lal, P., Kumar, A., Saikia, P., Das, A., Patnaik, C., Kumar, G., et al. (2021b). Effect of Vegetation Structure on Above Ground Biomass in Tropical Deciduous Forests of Central India. Geocarto Int. 1, 1–17. doi:10.1080/10106049.2021.1936213
Lal, P., Prakash, A., and Kumar, A. (2020b). Google Earth Engine for Concurrent Flood Monitoring in the Lower basin of Indo-Gangetic-Brahmaputra plains. Nat. Hazards 104, 1947–1952. doi:10.1007/s11069-020-04233-z
Lal, P., Prakash, A., Kumar, A., Srivastava, P. K., Saikia, P., Pandey, A. C., et al. (2020c). Evaluating the 2018 Extreme Flood hazard Events in Kerala, India. Remote Sensing Lett. 11, 436–445. doi:10.1080/2150704X.2020.1730468
Lawrence, D. M., Thornton, P. E., Oleson, K. W., and Bonan, G. B. (2007). The Partitioning of Evapotranspiration into Transpiration, Soil Evaporation, and Canopy Evaporation in a GCM: Impacts on Land-Atmosphere Interaction. J. Hydrometeorol. 8, 862–880. doi:10.1175/JHM596.1
Lee, X., Goulden, M. L., Hollinger, D. Y., Barr, A., Black, T. A., Bohrer, G., et al. (2011). Observed Increase in Local Cooling Effect of Deforestation at Higher Latitudes. Nature 479, 384–387. doi:10.1038/nature10588
Li, A., Wu, J., and Huang, J. (2012). Distinguishing between Human-Induced and Climate-Driven Vegetation Changes: A Critical Application of RESTREND in Inner Mongolia. Landscape Ecol. 27, 969–982. doi:10.1007/s10980-012-9751-2
Li, D., Tian, P., Luo, H., Hu, T., Dong, B., Cui, Y., et al. (2020). Impacts of Land Use and Land Cover Changes on Regional Climate in the Lhasa River basin, Tibetan Plateau. Sci. Total Environ. 742, 140570. doi:10.1016/j.scitotenv.2020.140570
Li, H., Haugen, J. E., and Xu, C.-Y. (2018). Precipitation Pattern in the Western Himalayas Revealed by Four Datasets. Hydrol. Earth Syst. Sci.Earth Syst. Sci. 22, 5097–5110. doi:10.5194/hess-22-5097-2018
Li, J., Zheng, X., Zhang, C., and Chen, Y. (2018a). Impact of Land-Use and Land-Cover Change on Meteorology in the Beijing-Tianjin-Hebei Region from 1990 to 2010. Sustainability 10, 176. doi:10.3390/su10010176
Li, X., Mitra, C., Dong, L., and Yang, Q. (2018b). Understanding Land Use Change Impacts on Microclimate Using Weather Research and Forecasting (WRF) Model. Phys. Chem. Earth, Parts A/B/C 103, 115–126. doi:10.1016/j.pce.2017.01.017
Lu, J., Carbone, G. J., and Gao, P. (2019). Mapping the Agricultural Drought Based on the Long-Term AVHRR NDVI and North American Regional Reanalysis (NARR) in the United States, 1981-2013. Appl. Geogr. 104, 10–20. doi:10.1016/j.apgeog.2019.01.005
Maharana, P., Kumar, D., and Dimri, A. P. (2019). Assessment of Coupled Regional Climate Model (RegCM4.6-CLM4.5) for Indian Summer Monsoon. Clim. Dyn. 53, 6543–6558. doi:10.1007/s00382-019-04947-2
Mahowald, N. M., Randerson, J. T., Lindsay, K., Munoz, E., Doney, S. C., Lawrence, P., et al. (2017). Interactions between Land Use Change and Carbon Cycle Feedbacks. Glob. Biogeochem. Cycles 31, 96–113. doi:10.1002/2016GB005374
Mlawer, E. J., Taubman, S. J., Brown, P. D., Iacono, M. J., and Clough, S. A. (1997). Radiative Transfer for Inhomogeneous Atmospheres: RRTM, a Validated Correlated-K Model for the Longwave. J. Geophys. Res. 102, 16663–16682. doi:10.1029/97jd00237
Navon, I. M. (1987). The Bayliss-Isaacson Algorithm and the Constraint Restoration Method Are Equivalent. Meteorl. Atmos. Phys. 37, 143–152. doi:10.1007/BF01042436
Niu, G.-Y., Yang, Z.-L., Mitchell, K. E., Chen, F., Ek, M. B., Barlage, M., et al. (2011). The Community Noah Land Surface Model with Multiparameterization Options (Noah-MP): 1. Model Description and Evaluation with Local-Scale Measurements. J. Geophys. Res. 116, D12109. doi:10.1029/2010JD015139
Parida, B. R., Pandey, A. C., and Patel, N. R. (2020). Greening and Browning Trends of Vegetation in India and Their Responses to Climatic and Non-Climatic Drivers. Climate 8, 92. doi:10.3390/cli8080092
Patel, P., Karmakar, S., Ghosh, S., and Niyogi, D. (2020). Improved Simulation of Very Heavy Rainfall Events by Incorporating WUDAPT Urban Land Use/land Cover in WRF. Urban Clim. 32, 100616. doi:10.1016/j.uclim.2020.100616
Paul, S., Ghosh, S., Oglesby, R., Pathak, A., Chandrasekharan, A., and Ramsankaran, R. (2016). Weakening of Indian Summer Monsoon Rainfall Due to Changes in Land Use Land Cover. Sci. Rep. 6, 32177. doi:10.1038/srep32177
Paul, S., Ghosh, S., Rajendran, K., and Murtugudde, R. (2018). Moisture Supply from the Western Ghats Forests to Water Deficit East Coast of India. Geophys. Res. Lett. 45, 4337–4344. doi:10.1029/2018GL078198
Phillips, O. L., Aragão, L. E., Lewis, S. L., Fisher, J. B., Lloyd, J., López-González, G., et al. (2009). Drought Sensitivity of the Amazon Rainforest. Science 323, 1344–1347. doi:10.1126/science.1164033
Piao, S., Wang, X., Park, T., Chen, C., Lian, X., He, Y., et al. (2020). Characteristics, Drivers and Feedbacks of Global Greening. Nat. Rev. Earth Environ. 1, 14–27. doi:10.1038/s43017-019-0001-x
Pielke, R. A., AvissarAvissar, R., Raupach, M., Dolman, J. A., Zeng, X., and Denning, S. A. (1998). Interactions between the Atmosphere and Terrestrial Ecosystems: Influence on Weather and Climate. Glob. Change Biol 4, 461–475. doi:10.1046/j.1365-2486.1998.00176.x
Pielke, R. A., Marland, G., Betts, R. A., Chase, T. N., Eastman, J. L., Niles, J. O., et al. (2002). The Influence of Land-Use Change and Landscape Dynamics on the Climate System: Relevance to Climate-Change Policy beyond the Radiative Effect of Greenhouse Gases. Philos. Trans. R. Soc. Lond. Ser. A: Math. Phys. Eng. Sci. 360, 1705–1719. doi:10.1098/rsta.2002.1027
Pielke, R. A., Pitman, A., Niyogi, D., Mahmood, R., McAlpine, C., Hossain, F., et al. (2011). Land Use/land Cover Changes and Climate: Modeling Analysis and Observational Evidence. Wires Clim. Change 2, 828–850. doi:10.1002/wcc.144
P. Kabat, M. Claussen, S. Whitlock, J. H. C. Gash, L. B. D Guenni, M. Meybecket al. (Editors) (2004). Vegetation, Water, Humans and the Climate: A New Perspective on an Interactive System (Berlin Heidelberg: Springer-Verlag). doi:10.1007/978-3-642-18948-7
Pongratz, J., Reick, C. H., Raddatz, T., and Claussen, M. (2010). Biogeophysical versus Biogeochemical Climate Response to Historical Anthropogenic Land Cover Change. Geophys. Res. Lett. 37. doi:10.1029/2010GL043010
Rajeevan, M., and Bhate, J. (2009). A High Resolution Daily Gridded Rainfall Dataset (1971–2005) for Mesoscale Meteorological Studies. Curr. Sci. 96, 558–562.
Rinke, A., and Dethloff, K. (2000). On the Sensitivity of a Regional Arctic Climate Model to Initial and Boundary Conditions. Clim. Res. 14, 101–113. doi:10.3354/cr014101
Rodell, M., Houser, P. R., Jambor, U., Gottschalck, J., Mitchell, K., Meng, C.-J., et al. (2004). The Global Land Data Assimilation System. Bull. Amer. Meteorol. Soc. 85, 381–394. doi:10.1175/bams-85-3-381
Roy, S. S., Mahmood, R., Niyogi, D., Lei, M., Foster, S. A., Hubbard, K. G., et al. (2007). Impacts of the Agricultural Green Revolution-Induced Land Use Changes on Air Temperatures in India. J. Geophys. Res. 112. doi:10.1029/2007JD008834
Saha, S., Moorthi, S., Pan, H.-L., Wu, X., Wang, J., Nadiga, S., et al. (2010a). NCEP Climate Forecast System Reanalysis (CFSR) 6-hourly Products. Res. Data Arch. Natl. Cent. Atmospheric Res. Comput. Inf. Syst. Lab. Boulder CO. January 1979 to December 2010
Saha, S., Moorthi, S., Pan, H.-L., Wu, X., Wang, J., Nadiga, S., et al. (2010b). The NCEP Climate Forecast System Reanalysis. Bull. Amer. Meteorol. Soc. 91, 1015–1058. doi:10.1175/2010bams3001.1
Saikia, P., Kumar, A., Diksha, Lal, P., Lal, P., Nikita, M. L., and Khan, M. L. (2020). “Ecosystem-Based Adaptation to Climate Change and Disaster Risk Reduction in Eastern Himalayan Forests of Arunachal Pradesh, Northeast India,” in Nature-Based Solutions for Resilient Ecosystems and Societies Disaster Resilience and Green Growth. Editors S. Dhyani, A. K. Gupta, and M. Karki (Singapore: Springer), 391–408. doi:10.1007/978-981-15-4712-6_22
Salmun, H., and Molod, A. (2016). Progress in Modeling the Impact of Land Cover Change on the Global Climate. Prog. Phys. Geogr. Earth Environ. 30, 737–749. doi:10.1177/0309133306071956
Samie, A., Abbas, A., Azeem, M. M., Hamid, S., Iqbal, M. A., Hasan, S. S., et al. (2020). Examining the Impacts of Future Land Use/land Cover Changes on Climate in Punjab Province, Pakistan: Implications for Environmental Sustainability and Economic Growth. Environ. Sci. Pollut. Res. 27, 25415–25433. doi:10.1007/s11356-020-08984-x
Sanjay, J., Revadekar, J. V., Ramarao, M. V. S., Borgaonkar, H., Sengupta, S., Kothawale, D. R., et al. (2020). “Temperature Changes in India,” in Assessment of Climate Change over the Indian Region: A Report of the Ministry of Earth Sciences (MoES), Government of India. Editors R. Krishnan, J. Sanjay, C. Gnanaseelan, M. Mujumdar, A. Kulkarni, and S. Chakraborty (Singapore: Springer), 21–45. doi:10.1007/978-981-15-4327-2_2
Shekhar, A., Chen, J., Paetzold, J. C., Dietrich, F., Zhao, X., Bhattacharjee, S., et al. (2020). Anthropogenic CO2 Emissions Assessment of Nile Delta Using XCO2 and SIF Data from OCO-2 Satellite. Environ. Res. Lett. 15 (9), 095010. doi:10.1088/1748-9326/ab9cfe
Skamarock, W. C., Klemp, J. B., Dudhia, J., Gill, D. O., Barker, D. M., Wang, W., et al. (2005). A Description of the Advanced Research WRF Version 2Boulder, CO: University Corporation for Atmospheric Research. NCAR/TN-468+STR. doi:10.5065/D6DZ069T
Sud, Y. C., Shukla, J., and Mintz, Y. (1988). Influence of Land Surface Roughness on Atmospheric Circulation and Precipitation: A Sensitivity Study with a General Circulation Model. J. Appl. Meteorol. 27, 1036–1054. doi:10.1175/1520-0450(1988)027<1036:iolsro>2.0.co;2
von Storch, H., Zorita, E., and Cubasch, U. (1993). Downscaling of Global Climate Change Estimates to Regional Scales: An Application to Iberian Rainfall in Wintertime. J. Clim. 6, 1161–1171. doi:10.1175/1520-0442(1993)006<1161:dogcce>2.0.co;2
Wang, X., Piao, S., Ciais, P., Friedlingstein, P., Myneni, R. B., Cox, P., et al. (2014). A Two-fold Increase of Carbon Cycle Sensitivity to Tropical Temperature Variations. Nature 506, 212–215. doi:10.1038/nature12915
Wang, X., Zhang, B., Xu, X., Tian, J., and He, C. (2020). Regional Water-Energy Cycle Response to Land Use/cover Change in the Agro-Pastoral Ecotone, Northwest China. J. Hydrol. 580, 124246. doi:10.1016/j.jhydrol.2019.124246
Xu, S., Yu, Z., Lettenmaier, D. P., McVicar, T. R., and Ji, X. (2020). Elevation-dependent Response of Vegetation Dynamics to Climate Change in a Cold Mountainous Region. Environ. Res. Lett. 15, 094005. doi:10.1088/1748-9326/ab9466
Zeng, Z., Piao, S., Li, L. Z. X., Ciais, P., Li, Y., Cai, X., et al. (2018a). Global Terrestrial Stilling: Does Earth's Greening Play a Role? Environ. Res. Lett. 13, 124013. doi:10.1088/1748-9326/aaea84
Zeng, Z., Piao, S., Li, L. Z. X., Wang, T., Ciais, P., Lian, X., et al. (2018b). Impact of Earth Greening on the Terrestrial Water Cycle. J. Clim. 31, 2633–2650. doi:10.1175/JCLI-D-17-0236.1
Zeng, Z., Piao, S., Li, L. Z. X., Zhou, L., Ciais, P., Wang, T., et al. (2017). Climate Mitigation from Vegetation Biophysical Feedbacks during the Past Three Decades. Nat. Clim Change 7, 432–436. doi:10.1038/nclimate3299
Zeng, Z., Zhu, Z., Lian, X., Li, L. Z. X., Chen, A., He, X., et al. (2016). Responses of Land Evapotranspiration to Earth's Greening in CMIP5 Earth System Models. Environ. Res. Lett. 11, 104006. doi:10.1088/1748-9326/11/10/104006
Zhang, K., Kimball, J. S., Nemani, R. R., Running, S. W., Hong, Y., Gourley, J. J., et al. (2015). Vegetation Greening and Climate Change Promote Multidecadal Rises of Global Land Evapotranspiration. Sci. Rep. 5, 15956. doi:10.1038/srep15956
Zhang, N., Gao, Z., Wang, X., and Chen, Y. (2010). Modeling the Impact of Urbanization on the Local and Regional Climate in Yangtze River Delta, China. Theor. Appl. Climatol 102, 331–342. doi:10.1007/s00704-010-0263-1
Zhang, Y., and Ye, A. (2021). Quantitatively Distinguishing the Impact of Climate Change and Human Activities on Vegetation in mainland China with the Improved Residual Method. GIScience & Remote Sensing 58, 235–260. doi:10.1080/15481603.2021.1872244
Zhao, Q., Zhu, Z., Zeng, H., Zhao, W., and Myneni, R. B. (2020). Future Greening of the Earth May Not Be as Large as Previously Predicted. Agric. For. Meteorology 292-293, 108111. doi:10.1016/j.agrformet.2020.108111
Keywords: LULCC, precipitation, temperature, weather and research forecasting model, leaf area index (LAI)
Citation: Lal P, Shekhar A and Kumar A (2021) Quantifying Temperature and Precipitation Change Caused by Land Cover Change: A Case Study of India Using the WRF Model. Front. Environ. Sci. 9:766328. doi: 10.3389/fenvs.2021.766328
Received: 28 August 2021; Accepted: 15 November 2021;
Published: 10 December 2021.
Edited by:
Ioan Cristian Ioja, University of Bucharest, RomaniaReviewed by:
Lucian Sfica, Alexandru Ioan Cuza University, RomaniaAndreea Nita, University of Bucharest, Romania
Copyright © 2021 Lal, Shekhar and Kumar. This is an open-access article distributed under the terms of the Creative Commons Attribution License (CC BY). The use, distribution or reproduction in other forums is permitted, provided the original author(s) and the copyright owner(s) are credited and that the original publication in this journal is cited, in accordance with accepted academic practice. No use, distribution or reproduction is permitted which does not comply with these terms.
*Correspondence: Ankit Shekhar, YW5raXQuc2hla2hhckB1c3lzLmV0aHouY2g=; Amit Kumar, YW1pdC5rdW1hckBjdWouYWMuaW4=