 Le Yang
 Hao Lu1
 Hepeng Li
- 1Key Laboratory for Technology in Rural Water Management of Zhejiang Province, Zhejiang University of Water Resources and Electric Power, Hangzhou, China
- 2Zhejiang Academy of Forestry, Hangzhou, China
A huge amount of CO2 emissions from the drained drawdown areas of reservoirs overturns the previous results in carbon budget. Three Gorges Reservoir (TGR) has a large drawdown area, which accounts for nearly one third of the total area of the TGR. However, the total CO2 emissions from the TGR drawdown area have seldom been estimated by far. To demonstrate the contribution of CO2 emissions from the TGR drawdown areas, the study measured CO2 emissions from the downstream part of the TGR drawdown areas by the chamber method, and synthesized CO2 emissions from the other parts of TGR drawdown areas. Both the diel and seasonal variation indicated that CO2 emission fluxes were significantly higher in the drained season than in the flooded season. The average CO2 emission flux in the drained season was about 1.7 times higher than that in the inundated season in our experiments, and the ratio increased to 4.8 times when other available data was added. CO2 emission flux in the drained season was positively correlated with air temperature, soil temperature at 5 cm depth, soil water content, organic carbon, and soil nitrate nitrogen, but negatively correlated with elevations. CO2 emission from the TGR drawdown area was estimated to be 342.67–495.96 Gg yr−1 in the drained season, and offset about 80% of carbon fixation by vegetation in the TGR drawdown area. Therefore, CO2 emission from the drained soils should be included in the carbon budget of reservoir systems, especially for these reservoirs with a large drawdown area.
Introduction
What is the carbon footprint of hydroelectric reservoirs, carbon-neutral energy, carbon sinks, or carbon sources (Prairie et al., 2018)? It is vital for policy makers to choose suitable national strategies to develop hydropower at the background of reducing carbon emission nowadays. Hydropower is encouraged to develop in China to realize their goal of “carbon peak in 2030, carbon neutrality in 2060.” Several giant hydroelectric plant stations, such as Xiluodu, Baihetan, Xiangjiaba, Wudongde, have been finished in the Mekong River in the southwest of China recently, promoting the proportion of hydropower in Chinese energy structure (Li Z. et al., 2019a).
The recognition in carbon sinks/sources of reservoirs has experienced 4 phases by far. When hydropower rose, hydroelectricity was portrayed as a renewable energy without any carbon emission. Many developing countries with rich water resources, e.g., China, Brazil, Mozambique, Nepal, Turkey, etc., built a large number of dams to meet the demand of rapid growth of human population and economic development (Zarfl et al., 2015; Moran et al., 2018). Since a large amount of GHG emissions, especially methane (CH4), was found in Amazon’s reservoirs in 1990s, hydropower was no longer considered as clean energy (Fearnside, 2006; Rosa et al., 2006); however, dam construction and subsequently proper management can reduce the river floods and the floodplain areas, e.g., natural wetlands, which would reduce CH4 emission from the flooded wetlands (Muller, 2019). More importantly, hydroelectric plants emit less GHG than natural gas and coal-fired thermoelectric plants during their life-cycles (Li and Zhang, 2014; dos Santos et al., 2017; Muller, 2019; Yang and Li, 2013). In 2010s, a large amount of organic carbon was realized to be sequestered in the sediments of hydroelectric reservoirs, and carbon burial should be accounted in the carbon budget (Mendonça et al., 2012). Scientists began to reevaluate the carbon role of reservoirs, and hydropower was regarded as almost a carbon-neutral energy if the carbon burial was considered (Mendonça et al., 2017). Recently, the drained soils significantly enhanced CO2 emission from the drawdown areas, and the key point was that 15% of the global reservoir area was dry (Keller et al., 2021). The latest research assigned 26.2 (15–40) Tg CO2-C·yr−1 to drawdown areas, and if taking into account drawdown areas, the ratio between carbon emissions and carbon burial in sediments increased from 1.2 to 2.02, which altered the standpoint for the hydroelectric reservoirs from an approximate carbon-neutral energy to a carbon source (Keller et al., 2021).
The latest overturn over the global carbon budget of reservoirs derived from the occasional discovery that an unforeseeing high CO2 emitted from the drying-rewetting zones of inland waters (Catalán et al., 2014), which was a blind spot before (Marcé et al., 2019). Respiration processes of microorganisms were the main contributor of CO2 emission from the drawdown areas, which was controlled by moisture, organic carbon, temperature, vegetation conditions, etc. (Marcé et al., 2019). Among the biotic factors, changes in sediment moisture were considered to modulate microbial viability and activity in the drained soils, and CO2 emission decreased with the increased grades of desiccation (Keller et al., 2020). Temperature, including air and soil temperatures, had an effect on microbial activities like moisture, while organic carbon provided the decomposition substrates for microbes (Keller et al., 2020). Besides the abiotic factors, the vegetated dryzone increased CO2 effluxes per unit area because of the extra contribution from vegetation respiration (Catalán et al., 2014), but regulated net CO2 emission via photosynthesis (Saunders et al., 2007). Biomass enhanced from the bare zone to the vegetation-covered zone along the exposed sediment transect (from the waterfront to the drained soils with vegetation), thus CO2 emission increased but the net CO2 exchange decreased along the gradient, which was confirmed elsewhere (Jin et al., 2016; Yang et al., 2017).
Temporary, recurrent, and even permanent drying were common phenomenon in lakes, reservoirs, streams, rivers, and ponds. Drying and rewetting of freshwater sediments creates hot spots of carbon mineralization and thus CO2 emissions (Ding, 2016; Marcé et al., 2019). CO2 emissions were relatively consistent across ecosystem types and climate zones, with the average CO2 emissions of 341 mg m−2 hr−1, which was an order of magnitude higher than the average water surface emissions in the lentic waters (e.g., ponds, lake, and reservoirs; 49.5 mg m−2 hr−1), but lower than that from lotic waters (streams, rivers; 1,215.5 mg m−2 hr−1) and close to the adjacent uphill soils (407 mg m−2 hr−1; Keller et al., 2020). Among the different kinds of dry inland freshwater systems, CO2 emissions from the drained soils of hydroelectric reservoirs with a large drawdown area had drew much attention by scientists due to the hot debates in cleanness for hydropower (Keller et al., 2021).
China had more than 98,000 reservoirs in 2012, but the drawdown zones mainly distribute in the large reservoirs with strong water storage capacities (Chen, 2015). Three Gorges Reservoir (TGR) has the largest drawdown area (348.93 km2) in Chinese reservoirs, and its GHG emission drew much attention (Chen et al., 2009; Hao et al., 2019). CO2 emissions were different from other GHG emissions, because CO2 can be absorbed by the restored vegetation in the TGR drawdown zones. Periodic fluctuation of water level causes the TGR drawdown areas inundated and drained alternation. When the drawdown areas were flooded, CO2 emitted from the air-water interface, which was similar to that from the open water surface (Yang et al., 2013). When the drawdown areas were drained, CO2 emission derived from the bare soils. CO2 emissions were higher in the drained season than in the inundated season (Cheng, 2012), and the more duration of drainage, the more accumulated CO2 emission from the drained soils (Xu, 2013), thus CO2 emission from the drawdown area was partly influenced by the elevation (Keller et al., 2020). The water level begins to decrease in spring and reaches the minimum before the floods come in summer, and vegetation can gradually recover in the high elevations, which is consistent to the growing season. The establishment of vegetation in the drawdown area can offset the CO2 losses by soil CO2 emissions according to the photosynthesis. Besides the natural invasion by propagules, planting the water-tolerant trees (e.g., Morus alba, Taxodium distichum, Salix rosthornii, S. veriegata, Distylium chinense) or grasses (e.g., Cynodon dactylon, Hemarthria altissima, Arundinella anomala, Rhizoma Cyperi, Phragmites communis) in the drawdown area were common ecological restoration measures in the TGR drawdown areas (Yuan et al., 2013), which was used to prevent soil erosion and enhanced the carbon fixation capacity in the drawdown area.
Based on the experimental data and the available data from literature, the study was 1) to show the diel and seasonal variation of CO2 emissions from the TGR drawdown area, 2) to compare CO2 emissions from the TGR drawdown area between the inundated and drained seasons, 3) to reveal the influencing factors on CO2 emissions from the TGR drawdown area, and 4) to estimate the total CO2 emissions from the drawdown area of TGR.
Materials and methods
Study area
TGR is the largest reservoir in installed capacity (225 million kW) in the world, which produces about 100 billion kWh per year. Three Gorges Dam (TGD) controls the watershed area of about 1 million km2 and all kinds of water resource of 4624.42 m3. The TGR is a valley-type and linear-shape reservoir, which has a length of about 660 km from the east (Maoping Town in Yichang City) to the west (Jiangjin District in Chongqing City), and an average width of about 1.1 km (Figure 1). Short residence time, and lateral uniformity and longitudinal heterogeneity are the basic characteristics of such reservoirs (Goldenfum, 2011).

FIGURE 1. Schematic diagram of sampling sites and synthesized sites in the TGR drawdown area.
The total area of flooded terrestrial lands is 632 km2 because of the TGR construction, including the arable lands of 245 km2. After TGD construction, the annual periodic water level fluctuates between 145 and 175 m, causing a huge drawdown area of TGR (348.93 km2), which accounts for one-third of the surface area of TGR (1,084 km2). The distribution is uneven in the 26 counties or districts within the TGR drawdown area, and the largest 4 counties or districts are Kaizhou District (43.5 km2), Fulin District (39.2 km2), Yunyang County (33.1 km2), and Zhongxian County (29.3 km2) (Zhou and Wang, 2010).
The alternation between emergence and inundation in the TGR drawdown area were controlled by the artificial modulation and water inflow. TGR takes the out-of-season water storage regulation in order to store the clean water and discharge the sandy water (Lu et al., 2011). The water level gradually decreased in March, and reached the lowest water level (below 147 m) before the flooded peak reached in July, and increased again in October (Liu et al., 2022). When the drawdown area was drained initially, no vegetation was distributed in the drawdown area, but the left and invaded propagules came into the drawdown area, and many plants grew in the growing season (Wang et al., 2014).
The TGR is located in a subtropical monsoon climate zone with an annual mean temperature of 16.3°C–18.2°C and annual precipitation of 987–1,326 mm. Nearly 80% of the precipitation falls in the hot-wet season (April-September); only 20% falls in the cool-dry season (October-March). The study was carried out at 3 sites near the downstream part of the TGR drawdown area, e.g., Zigui (ZG; 30o51′N, 110o58′E), Wushan (WS; 31o03′N, 109o51′E), and Yunyang (YY; 30o56′N, 108o39′E), which are 2 km, 120 km, and 240 km upstream from the TGD (Figure 1). Each 3 plots were selected under the elevation of 161 m in YY, WS, and ZG, which had different drainage duration. The elevations of 3 plots in ZG (148, 149, 160 m) were similar with those in YY (149, 150, 160 m), which were slightly lower than those in WS (151, 157, 161 m), respectively. In each sampling plot, all measurements were conducted at the same places, regardless of inundation or drainage.
Besides the above 3 sites, CO2 emission from 5 sites in the mainstream and 9 sites in the tributaries were synthesized based on the available literature (Supplementary Appendix B; Figure 1). Five sites were Zhutuo (ZT, 29°01′N, 105°51′E), Cuntan (CT, 29°37′N, 106°36′E), Qingxichang (QXC, 29°48′N, 107°27′E), Wangjiagou (WJG, 29°53′N, 107°27′E), and Xiangxi (XX, 30°57′N, 110°45′E). In addition, the available data were in the 5 main tributaries (i.e., Pengxi, Daning, Shennongxi, Modaoxi, and Xiangxi tributary). Among the 9 sites in the tributaries, 5 sites locate in the Pengxi River, i.e., Yanglu(YL, 31°5′N, 108°33′E), Baijiaxi(BJX, 31°7′N, 108°33′E), Gaoyang(GY, 31°6′N, 108°40′E), Wuyang Bay (WY, 31°11′N, 108°27′E), Pengxi River Wetland Reserve (PRWR, 31°7′N, 108°31′E). Pengxi River has the largest drawdown area (55.47 km2) among the TGR tributaries, which account for 16.17% of the total area (Li et al., 2013). The other 4 sites are Xinjin (XJ, 30°55′N, 108°57′E) in Modaoxi River, Shuanlong (SL, 31°5′N, 109°53′E) in Daning River, Pingyangba (PYB, 31°9′N,110°19′E) in Shengnongxi River, Xingshan (XS, 30°57′N, 110°45′E) in Xiangxi River. The database involves CO2 emission from 17 sites (include 137 plots totally) in the TGR drawdown area, including 8 sites (include 30 plots) in the mainstream drawdown area and 9 sites (include 107 plots) in the drawdown area of tributaries (Supplementary Appendix B).
CO2 emission measurements
CO2 emissions from the drawdown area were measured using a static chamber. The floating static chamber (65 cm in length × 45 cm in width × 40 cm in height) consisted of a plastic box without a cover that was wrapped in light-reflecting and heatproof films to prevent temperature variation inside the chambers. Plastic foam collars were fixes onto opposite sides of the chamber to keep the chambers float in the water surface, and the headspace height inside the chamber was about 30 cm. When the drawdown areas were drained, the above-described chambers were placed on permanently positioned aluminum bases (65 cm in length × 45 cm in width × 10 cm in height) with water grooves on top and inserted into the soil in order to ensure a tight fit at the air-soil interface. A silicone tube (0.6 and 0.4 cm outer and inner diameters, respectively) was inserted into the upper side of the chamber to collect gas samples and another silicone tube was inserted into the chamber to keep air pressure balanced between the inside and outside of the chamber. All measurements were performed in triplicate.
In either flooded or drained seasons, the 4 gases samples in the headspace of the chamber were collected every 10 min and analyzed by a CO2 analyzer (LI-840 CO2/H2O Analyzer; Li-COR Co., Lincoln, United States) to determine the CO2 concentration. CO2 flux (F, mg CO2 m−2 h−1) was determined using Eq. 1. Only samples with r2 values large than 0.95 were considered.
where, ρ (kg m−3) is the density of CO2 under standard temperature and pressure (1.96 kg m−3); dc/dt is the rate of concentration change in the chamber; H (m) is the height from the top of the inversed chamber to the water surface or soil surface (0.3 m in the inundated seasons, and 0.4 m in the drained seasons); 275.15 is the absolute temperature at 0°C and; T (°C) is the air temperature inside the chamber.
The diurnal variation in CO2 emission fluxes were measured at each plot at ZG from 8:00 (or 6:00)-18:00 (or 20:00) at 2 h intervals about once every 2 months (five to six times total), but CO2 emission fluxes were not measured at night for the safety reasons. All of the diel variations in CO2 emission fluxes were measured at the 148 and 149 m elevation in the inundated season because of the short drainage duration. However, CO2 emission from the drained soils was measured 3 times at the 160 m elevation, which was in the initial stage (March 16), middle stage (May 29), and later stage (August 30). The other 2 times were in the inundated season. In terms of seasonal variation, CO2 emissions were measured once or twice per month in the morning, weather depending, from January 2010 to January 2011. 18 or 19 times measurement was carried out at each plot at ZG, WS, and YY.
Environment variables
Air and water temperatures were measured using an alcohol thermometer. The elevations of each plot were referred by the hydrological scale line nearby. The soil samples were measured monthly from June to September. The surface drained soils were collected at the depth of 0–20 cm, and soil water contents were determined by the weight differences between the collected soil samples in the fields and the soils samples stoved in 105°C for 24 h. The organic carbon was determined by an elemental analyzer (Vario EL Ⅲ; Elementar Co.).
Total estimation of CO2 emission from the Three Gorges Reservoir drawdown area
According to the different classification standards in the TGR drawdown area (i.e., mainstream and tributaries, elevations, land-use characteristics), 3 different methods were used to estimate CO2 emission from the TGR drawdown area. The methods were given in details in the Supplementary Material.
Results
Variations in CO2 emission at ZG during the daytime
All the CO2 flux measurements were conducted in the plots of 148 and 149 m in the flooded season, and the dryflux was failed to capture because of the relatively low elevations and their short-term drained periods. Only three dryflux measurements were carried out in the plot of 160 m on March 16, May 29 and August 30, which had significantly higher in CO2 emissions than the other 2 submerged measurements (Figure 2A). Compared with the weak dynamic patterns in CO2 emission in the inundated season, significant variations in CO2 emission were observed in the drained season in the plot of 160 m on May 29 and August 30 (Supplementary Figure S1; Figure 2A). CO2 emission reached the peak at the drained soils at 12:00 on August 30; however, CO2 emission kept a relatively steady high level from 10:00 to 14:00 on May 29 (Figure 2B). The average CO2 emission increased with time in the drained season with the maximum CO2 emission on August 30, a week before being flooded (Figure 2B).

FIGURE 2. Dynamic variation of CO2 flux at the 160 m plot of Zigui during the daytime (A) and the average CO2 flux at 148 m, 149 and 160 m elevations of Zigui during the daytime (B). Note: The plot at 160 m was drained on March 16, May 29, and August 30. Different letters within the same plot indicate the significant difference at the level of p = 0.01.
CO2 emission comparison between the drained season and flooded season
The annual average CO2 emission was 108.37 ± 98.80 mg m−2 hr−1 in the drawdown areas at ZG, WS, and YY, with a mean CO2 emission of 159.25 ± 142.37 mg m−2 hr−1 in the drained season and 89.08 ± 66.84 mg m−2 hr−1 in the inundated season (Table 1). In each plot, the average CO2 fluxes in the drained seasons were higher than those in the flooded seasons expect the plot of 160 m at YY, and the corresponding differences in the 5 plots reached a significant level (Table 1).
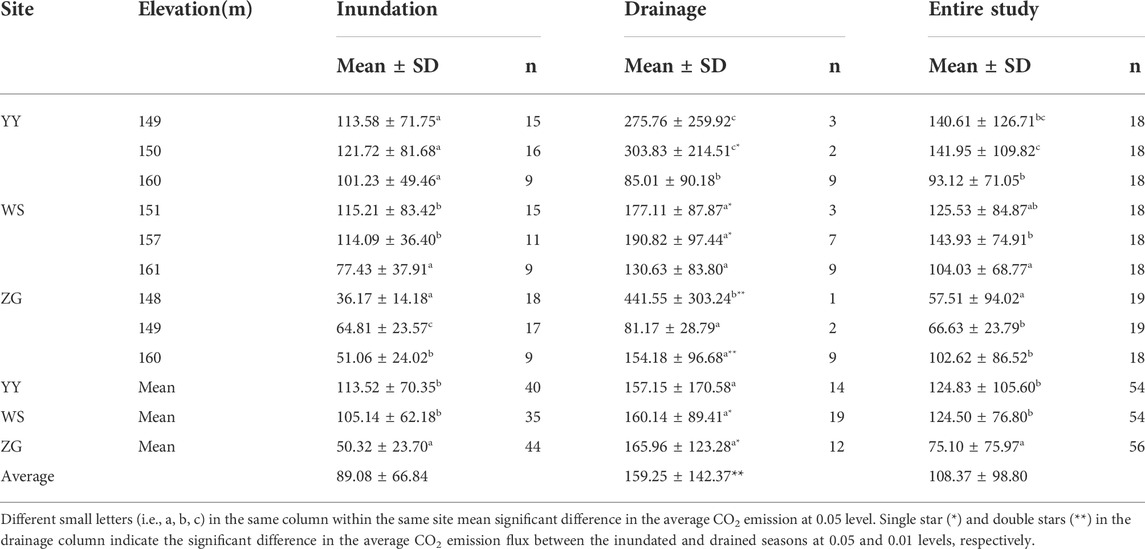
TABLE 1. Average CO2 emission at different elevation plots in the drained and inundated seasons and the entire field study (mg m−2 h−1).
Based on the synthetic data of available literature, the average CO2 emission from the TGR drawdown area was 344.83 ± 264.97 mg m−2 hr−1 in the drained season, which was 3.8 times higher than that in the inundated season (74.49 ± 48.82 mg m−2 hr−1; Table 2). The average CO2 emission from the mainstream drawdown area (324.10 ± 321.69 mg m−2 hr−1) was slightly lower than that from the tributaries (363.97 ± 204.00 mg m−2 hr−1) in the drained season, but CO2 emissions from the drawdown area of the mainstream (101.13 ± 36.22 mg m−2 hr−1) was 4.5 times higher than tributaries in the inundated season (21.20 ± 11.58 mg m−2 hr−1; Table 2).
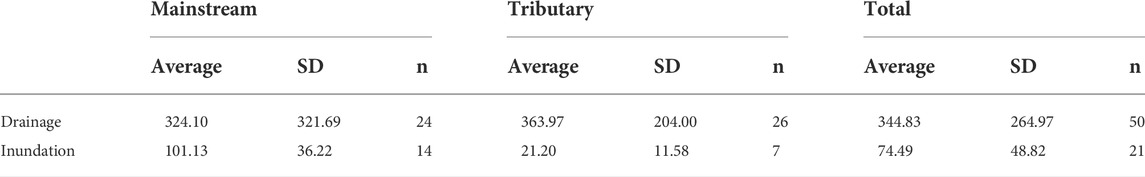
TABLE 2. The statistic data in CO2 emission from the drawdown areas in the mainstream and tributaries of TGR in the drained and inundated seasons (mg m−2 h−1).
Environmental variables influencing CO2 emission
CO2 emission flux was positively correlated with air temperature, soil temperature at 5 cm depth, soil water content, organic carbon, and soil nitrate nitrogen (Figures 3A–E). A negative correlated linear relationship between CO2 emission fluxes at ZG, WS, and YY and their elevations were found in the drained season (r2 = 0.26; Figure 3F). However, no significant relationship was found between the CO2 emission fluxes and their corresponding elevations in the available literature (Supplementary Appendix B).
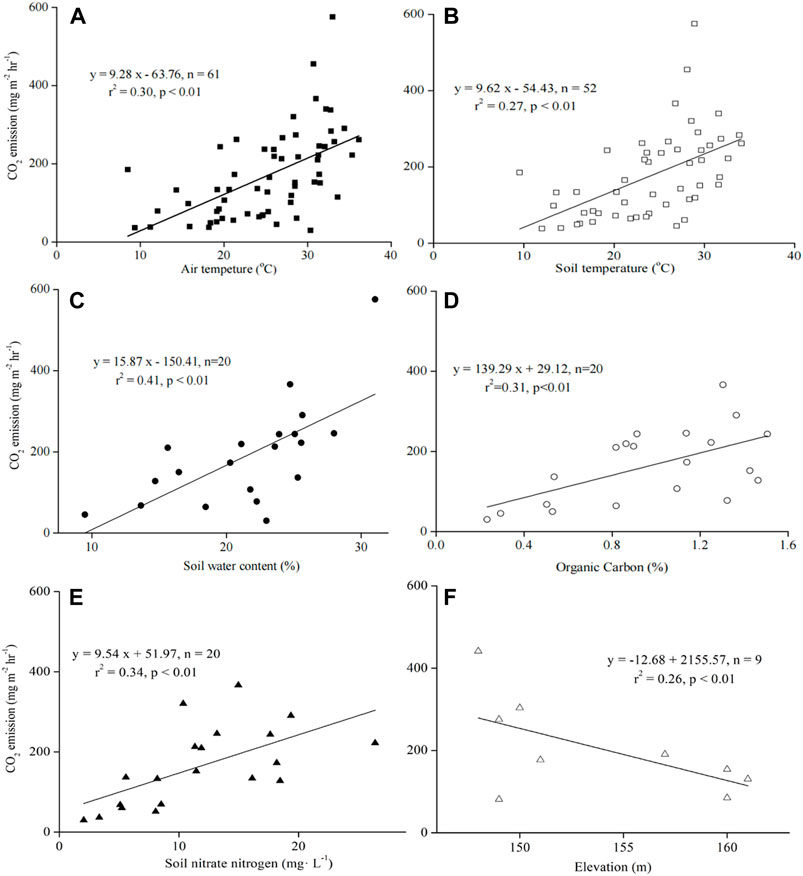
FIGURE 3. Correlated relationships between CO2 flux and (A) air temperature, (B) soil temperature, (C) soil water content, (D) organic carbon, (E) soil nitrate nitrogen, and (F) elevation.
Total CO2 emission from the drawdown areas of Three Gorges Reservoir
The total CO2 emission was estimated to be 462.73–605.35 Gg yr−1 by the 3 different methods (Supplementary Tables S1–S3). CO2 emissions were estimated about 342.67–495.96 Gg yr−1 in the drained season, which accounted for 74.1%–81.5% of total CO2 emission from the TGR drawdown area.
Discussion
CO2 emissions from the drained soils, mechanisms, and uncertainty
Although China has a large reservoir drawdown area with approximate 4,000 km2 in 2020, most of monitored campaigns in CO2 emissions were conducted in the TGR drawdown area (e.g., Xu, 2013; Li Z. et al., 2019; Zhao et al., 2019). Drying-rewetting alternation has been reported to be a key factor to promote the organic carbon mineralization of purple soils in the hydro-fluctuation belt of the TGR (Ding, 2016). Based on the available data at 17 sites of the TGR drawdown area (Supplementary Table S1), the average CO2 emissions was 346.22 ± 267.54 mg m−2 hr−1) in the drained season, which was close to CO2 effluxes in the littoral zones of two reservoirs in Beijing (Yushandu: 246.33 mg m−2 hr−1; Miyun: 346.00 mg m−2 hr−1), but significantly lower than the CO2 dryfluxes from the soils of the drawdown area of the Nam Theun 2 Reservoir (511.50 mg m−2 hr−1) in Lao PDR (Table 3). CO2 emission from the TGR drawdown area was comparable to those in the shores of the saline lakes in Xinjiang arid region except Ebinur lake (41.66 mg m−2 hr−1), higher than the drained aquaculture ponds in coastal regions (33–80.29 mg m−2 hr−1), but lower than the exposed, dry sediments in Mediterranean rivers (383.16–763.58 mg m−2 hr−1, Table 3). Keller and his colleagues (2020) synthesized global CO2 dryfluxes in the drained soils of inland waters (i.e., rivers, ponds, reservoirs, lakes), and the median CO2 emission was 354.14 mg m−2 hr−1, ranging from 25.51 to 944.93 mg m−2 hr−1. CO2 emission level in the TGR drawdown area was within the range of the previous synthesis. However, the review focused on the bare dryzone of different inland waters, but the vegetation was referred in our study. The establishment of vegetation enhanced the respiration of the ecosystem, and its carbon-fixed function offset CO2 losses caused by dryfluxes.

TABLE 3. Comparison of CO2 flux among the different types of inland waters in the drained season.
After the water level receded in February, the exposed soils experienced the initial bare dryzone and subsequently vegetated dryzone in the TGR drawdown areas (Wang et al., 2014). Respiration processes of microorganisms were the main contributor of CO2 emission from the drawdown areas without vegetation, which was controlled by moisture, organic carbon, and temperature (Keller et al., 2020). Air and soil temperatures, soil water content, and organic carbon were found to have an impact on CO2 emission in the drained season (Figure 3). Temperature had an effect on microbial activities and the similar positive relationships were reported elsewhere (Ding et al., 2016; Yang et al., 2017; Zhu et al., 2020). In terms of moisture, CO2 emission decreased with the increased grades of desiccation because the changes in sediment moisture were considered to modulate microbial viability and activity in the drained soils. An incubation experiment of purple soils in Kaizhou, a TGR drawdown area, indicated that both of the cumulative and instant mineralization of organic carbon was highest in the treatment of 100% water holding capacity (Ding et al., 2016). Turning to the organic carbon, the available substrates were necessary for microbes to produce CO2 (Keller et al., 2020). In the drawdown area of Nam Theun 2 Reservoir, average CO2 dryfluxes were significantly correlated with the average C content rather than temperature and moisture (Deshmukh et al., 2018), which implied that the organic carbon was the dominant variable for CO2 dryflux. Furthermore, elevation was also reported to be a potential variable in the study (Figure 3F) and global synthesis data (Keller et al., 2020), because emerged soils in the different elevations had distinct characteristics in land-use types, which was considered as a key variable in control soil respiration (Zhu et al., 2020). The TGR riparian lands with a high elevation were used to cultivate crops, and the lands with a low elevation were covered by natural vegetation, which influenced the vegetation restoration, biomass, and sedimentation in the riparian zone. Both of natural vegetation (e.g., Cynodon dactylon) and the cultivated crops (e.g., maize, rice) can easily grow above 167.5 m because of the long drained duration (Wen, 2017). Different species had distinct carbon sequestration abilities. The adaptable species with strong carbon-fixed ability should be chose to be planted in the TGR drawdown area, such as phragmites australis, polygonum hydropiper, Cynodon dactylon (Feng et al., 2020). Besides, soil nitrate nitrogen contents were mainly influenced by the urea additions by farming practices (Li et al., 2016b), and the plots with the elevation above 160 m were used to cultivate peanuts, corns, even rice paddies (Li et al., 2013; Yang et al., 2013). Soil nitrification and nitrate nitrogen accumulation probably regulated soil CO2 emission, which was reported in the temperate needle-broadleaved mixed forest (Geng et al., 2017).
Many studies focus on the bare dryzone, indicating that a new exposed land was an important CO2 source (e.g., Von Schiller et al., 2014; Jin et al., 2016; Kosten et al., 2018). Compared with a bare dryzone in the drawdown area, a vegetated dryzone in the TGR drawdown areas provided extra CO2 emission from vegetation respiration, but the vegetation influenced CO2 net exchange and turned a carbon source into a carbon sink in the TGR vegetated drawdown areas (Feng et al., 2020). The opaque chambers were widely used in the compiled literature, and the method excluded photosynthesis in the vegetated dryzone, thus the fixed carbon via photosynthesis was ignored during the daytime. Due to the limitation, the study focused on the respiration in the TGR drawdown areas. The total CO2 emission was estimated to be 342.67–495.96 Gg C yr−1 in the drained season in the study, which offset about 80% of the carbon storage (439.78–514.86 Gg C yr−1) in the vegetation of TGR drawdown area (Sun and Yuan, 2012). Therefore, the TGR drawdown area was considered as a carbon sink in the drained season. However, the vegetation would be flooded after the growing season, and the new fixed carbon would decompose to CH4, a more global warming potential (GWP) gas, when the water level rose in October. The drawdown area served as a role of “CH4 factory” (Fearnside, 2008), and there were indeed uncertainties because of the different GWP between CO2 and CH4. Therefore, it was strongly recommended to clear the vegetation in the TGR drawdown areas to reduce the available carbon before the water level increased again, just like the biomass clearing before flooding (Lu et al., 2011). The measurement would reduce carbon, nitrogen, phosphorous release by plant soaking decomposition, and reduce GHG emission during the flooded season as well (Xiao et al., 2017; Wang et al., 2020). Several million tones of vegetation would be accumulated on the drawdown area of TGR in every summer and some adverse environmental problems may be introduced when it was submerged in winter (Wang et al., 2014).
CO2 emission in the drained and inundated seasons
Dry inland waters are defined as the areas of lotic and lentic aquatic ecosystems where surface water is absent, and sediments are exposed to the atmosphere (Keller et al., 2020). Drawdown area in a reservoir system is one of the dry inland waters types, and CO2 emission from the exposed soils in the drawdown area is significant higher than CO2 emission from the water surface (Li et al., 2012; Yang et al., 2017; Deshmukh et al., 2018). The study confirmed the important role of TGR drawdown area in CO2 emission in the drained season, which was a dominant component in carbon cycle of inland waters. Higher CO2 emissions to the atmosphere from exposed sediments relative to water surface emissions are probably because of the high CO2 production and easy gas flux in dry sediments (Keller et al., 2020). At anoxic conditions, the degradation of terrestrial organic carbon was reduced by about 50% compared to oxic conditions (Isidorova et al., 2019). Thus, CO2 production in the flooded season was likely lower than that in the drained season in the TGR drawdown area. Moreover, CO2 emitted more easier in the sediment-atmosphere interface than in the air-water interface due to the lack of an intervening layer of water (Keller et al., 2020).
According to the official data, the average sediments of 106.83 ± 55.69 Tg were deposited in the TGR bottom from 2004 to 2021(Li et al., 2021), and majority of sediments occurred in August during the flooded pulse events, when large amounts of sediments deposited in the drawdown area after the natural floods. The sedimentation mainly took place within the portions between 145 and 168 m with a cumulative sediment depth of 1.1–39.9 cm, decreasing with the increase of the elevation (Tang et al., 2014a). The TGR drawdown area can be divided into two parts by 167.5 m elevation. The lower part of drawdown area was mainly affected by the natural fluctuation in water level, and the upper one was largely affected by anthropogenic disturbance (Ye et al., 2019). The original purple soils and paddy soils were covered by a large amount of sediments in the low elevations (below 168 m) after the recession of the natural floods (Tang et al., 2014b; Wen, 2017), and the new deposited sediments caused CO2 pulse due to higher moisture and organic carbon content. The phenomenon was observed on August 19 in the study (Supplementary Appendix A) as well as other observations (Xu, 2013).
The water levels in the TGR decreased and kept a low level in the flooded season (June to August), which was consistent to the growing season (Zhou et al., 2017). Most of the vegetation can complete their life cycle in the drawdown areas before the water level rose again in October (Ma et al., 2009; Wen, 2017). However, most Chinese reservoirs took a different operation strategy in water storage with the TGR. Water levels of those reservoirs varied with inflow, and the drawdown area was exposed in the dry season, which is often coupled with the non-growing season. Although CO2 emission was enhanced at the sediment-atmosphere interface, the low temperature and bare soils would probably inhibit CO2 efflux under the normal operation of water storage. Anti-season impounding, like the TGR, lead to a vegetated dryzone in the drought season. Therefore, the coupling of high temperature and drained season could promote vegetation restoration and increase CO2 exchange between the drawdown area and the atmosphere.
Conclusion
In summary, the TGR adopts the operational mode of “storing the clear water and discharging the muddy water,” causing the drained drawdown area in the growing season. Cultivated crops and natural restored vegetation at high elevations would fix CO2 efficiently, serving as a carbon sink. The bare dryzone in the low elevations, especially the accumulated sediments after floods, enhanced CO2 efficiently. The TGR drawdown areas played a role of carbon sink in the drained season, because the vegetated dryzone was dominant. However, the vegetation will be decomposed and become a huge potential pollution source after being flooded in October. Therefore, it was necessary to clear the vegetation biomass before being flooded.
Data availability statement
The original contributions presented in the study are included in the article/Supplementary Material, further inquiries can be directed to the corresponding author.
Author contributions
YL designed and conducted the experiment, and wrote the manuscript as well, HLi paid the bill of the manuscript, HLu drew the figures, and YX did the statistic work.
Funding
This work was supported by Zhejiang Special Project for Provincial Research Institutes (2021F1065-6), Zhejiang Provincial Basic and Public Benefit Research Plan (Nos. LGF21B070003, LGF22C030001).
Conflict of interest
The authors declare that the research was conducted in the absence of any commercial or financial relationships that could be construed as a potential conflict of interest.
Publisher’s note
All claims expressed in this article are solely those of the authors and do not necessarily represent those of their affiliated organizations, or those of the publisher, the editors and the reviewers. Any product that may be evaluated in this article, or claim that may be made by its manufacturer, is not guaranteed or endorsed by the publisher.
Supplementary material
The Supplementary Material for this article can be found online at: https://www.frontiersin.org/articles/10.3389/fenvs.2022.1015888/full#supplementary-material
SUPPLEMENTARY FIGURE S1 | Dynamic variation of CO2 flux at the 148 m plot (A) and 149 m plot (B) of Zigui during the daytime in the flooded season.
References
Catalán, N., von Schiller, D., Marcé, R., Koschorreck, M., Gomez-Gener, L., and Obrador, B. (2014). Carbon dioxide efflux during the flooding phase of temporary ponds. Limnetica 33 (2), 349–360. doi:10.23818/limn.33.27
Chen, H., Wu, Y. Y., Yuan, X. Z., Gao, Y. H., Wu, N., and Zhu, D. (2009). Methane emissions from newly created marshes in the drawdown area of the Three Gorges Reservoir. J. Geophys. Res. 114, D18301. doi:10.1029/2009jd012410
Chen, K. (2015). Status analysis and management research of the drawdown area of large and medium-sized reservoirs in Zhejiang Province. Hangzhou, China: College of Civil Engineering and Architecture, College of Resources and Environment, Zhejiang University. MS Thesis.
Cheng, B. H. (2012). Study of carbon dioxide emission from a typical water level fluctuating zone under water level change in Three Gorges Reservoir. Chongqing: College of Resources and Environment, Southwest University. MS Thesis.
Deshmukh, C., Guérin, F., Vongkhamsao, A., Pighini, S., Oudone, P., Sopraseuth, S., et al. (2018). Carbon dioxide emissions from the flat bottom and shallow Nam Theun 2 reservoir: Drawdown area as a neglected pathway to the atmosphere. Biogeosciences 15, 1775–1794. doi:10.5194/bg-15-1775-2018
Ding, C. H. (2016). Effects of soil moisture and temperature on organic carbon mineralization of typical soils in the hydro-fluctuation belt of the Three Gorges Reservoir. Chongqing, China: Southwest University. MS thesis.
Ding, C. H., Wang, L. G., Tang, J., Ci, E., and Xie, D. T. (2016). [Effects of soil moisture and temperature variations on organic carbon mineralization of purple soil in the hydro-fluctuation belt of the three Gorges reservoir]. Environ. Sci. 37 (7), 2763–2769. doi:10.13227/j.hjkx.2016.07.045
dos Santos, M. A., Damázio, J. M., Rogério, J. P., Amorim, M. A., Medeios, A. M., Abreu, J. L. S., et al. (2017). Estimates of GHG emissions by hydroelectric reservoirs: The Brazilian case. Energy 133, 99–107. doi:10.1016/j.energy.2017.05.082
Fearnside, P. M. (2008). A Framework for estimating greenhouse gas emissions from Brazil’s Amazonian hydroelectric dams. Oecologia Brasiliensis 12 (1), 100–115. doi:10.4257/oeco.2008.1201.11
Fearnside, P. M. (2006). Greenhouse gas emissions from hydroelectric dams: Reply tO Rosa et al. Clim. Change 75, 103–109. doi:10.1007/s10584-005-9016-z
Feng, J. H., Liu, D. F., Wu, G. H., Liu, Y., Qin, D. X., Wang, K. J., et al. (2020). Carbon fixation and oxygen release capabilities of common plants in the water-level-fluctuation zone of Three Gorges Reservoir. J. Hydroecol. 41 (1), 1–8. doi:10.15928/j.1674-3075.2020.01.001
Geng, J., Cheng, S. L., Fang, H. J., Yu, G., Li, X., Si, X., et al. (2017). Soil nitrate accumulation explains the nonlinear responses of soil CO2 and CH4 fluxes to nitrogen addition in a temperate needle-broadleaved mixes forest. Ecol. Indic. 79, 28–36. doi:10.1016/j.ecolind.2017.03.054
Goldenfum, J. A. (2011). GHG measurement guidelines for freshwater reservoirs. London: The international Hydropower Association.
Gómez-Gener, L., Obrador, B., von Schiller, D., Marcé, R., Casas-Ruiz, J. P., Proia, L., et al. (2015). Hot spots for carbon emissions from Mediterranean fluvial networks during summer drought. Biogeochemistry 125, 409–426. doi:10.1007/s10533-015-0139-7
Hao, Q. J., Chen, S. J., Ni, X., Li, X. X., He, X. H., and Jiang, C. S. (2019). Methane and nitrous oxide emissions from the drawdown areas of the Three Gorges Reservoir. Sci. Total Environ. 660, 567–576. doi:10.1016/j.scitotenv.2019.01.050
Isidorova, A., Mendonça, R., and Sobek, S. (2019). Reduced mineralization of terrestrial OC in anoxic sediment suggests enhanced burial efficiency in reservoirs compared to other depositional environments. J. Geophys. Res. Biogeosci. 124, 678–688. doi:10.1029/2018jg004823
Jin, H., Yoon, T. K., Lee, S., Kang, H., and Park, J. (2016). Enhanced greenhouse gas emission from exposed sediments along a hydroelectric reservoir during an extreme drought event. Environ. Res. Lett. 11, 124003. doi:10.1088/1748-9326/11/12/124003
Keller, P. S., Catalán, N., von Schiller, D., Grossart, H. P., Koschorreck, M., Obrador, B., et al. (2020). Global CO2 emissions from dry inland waters share common drivers across ecosystems. Nat. Commun. 11, 2126. doi:10.1038/s41467-020-15929-y
Keller, P. S., Marcé, R., Obrador, B., and Koschorreck, M. (2021). Global carbon budget of reservoirs is overturned by the quantification of drawdown areas. Nat. Geosci. 14, 402–408. doi:10.1038/s41561-021-00734-z
Kosten, S., van den Berg, S., Mendonça, R., Paranaíba, J. R., Roland, F., Sobek, S., et al. (2018). Extreme drought boosts CO2 and CH4 emissions from reservoir drawdown areas. Inland Waters 8, 329–340.
Li, D. P., Sun, T., Yao, M. S., Liu, S. Y. H., and Jia, H. T. (2019b). Characteristic of soil CO2 emission under different plant communities in the shores of saline lake in arid region. China Environ. Sci. 39 (5), 1879–1889. doi:10.19674/j.cnki.issn1000-6923.2019.0223
Li, D. P., Yao, M. S., Sun, T., Liu, S. Y. H., and Jia, H. T. (2020). Characteristic of soil respiration and its influencing factors on the coastal of saline lake in arid region. Arid. Land Geogr. 43 (3), 761–769. doi:10.12118/j.issn.1000-6060.2020.03.22
Li, H. L., Yang, M., Zhang, M. X., Lei, T., and Lei, G. C. (2012). Characteristics and environmental determinants of greenhouse gas emissions from Yudushan Reservoir during growth season. Chin. J. Ecol. 31 (2), 406–412.
Li, S. Y., and Zhang, Q. F. (2014). Carbon emission from global hydroelectric reservoirs revisited. Environ. Sci. Pollut. Res. 21, 13636–13641. doi:10.1007/s11356-014-3165-4
Li, W., Zu, B., and Li, J. W. (2021). Research on the sedimentation characteristics in the three Gorges reservoir area. China Rural. Water Hydropower 8, 18–22.
Li, Z., Du, H. L., Xu, H., Xiao, Y., Lu, L. H., Guo, J. S., et al. (2019). The carbon footprint of large- and mid-scale hydropower in China: Synthesis from five China’s largest hydro-project. J. Environ. Manage. 250, 109363. doi:10.1016/j.jenvman.2019.109363
Li, Z., Zhang, L. P., Wang, L., Guo, J. S., Gao, X., Fang, F., et al. (2013). Preliminary study of CO2 and CH4 fluxes at soil-air interface in drawdown area of the Pengxi River of the Three Gorges Reservoir. J. Lake Sci. 25 (5), 674–680. doi:10.18307/2013.0508
Liu, D., Nie, Q. Y., Xiong, C. M., Yu, Z. L., Lv, Y. N., Zhang, S., et al. (2022). Sediment particle size composition in the riparian zone of the Three Gorges Reservoir. Front. Environ. Sci. 10, 820700. doi:10.3389/fenvs.2022.820700
Lu, F., Yang, L., Wang, X. K., Duan, X. N., Mu, Y. J., Song, W. Z., et al. (2011). Preliminary report on methane emissions from the Three Gorges Reservoir in the summer drainage period. J. Environ. Sci. 23 (12), 2029–2033. doi:10.1016/s1001-0742(10)60668-7
Ma, L. M., Tang, Y. P., Zhang, M., Teng, Y. H., Liu, D. Y., and Zhao, J. F. (2009). Evaluation of adaptability of plants in water-fluctuation-zone of the three Gorges reservoir. Acta Ecol. Sin. 29 (4), 1885–1892.
Marcé, R., Obrador, B., Gómez-Gener, L., Catalán, N., Koschorreck, M., Arce, M. I., et al. (2019). Emissions from dry inland waters are a blind spot in the global carbon cycle. Earth. Sci. Rev. 188, 240–248. doi:10.1016/j.earscirev.2018.11.012
Mendonça, R., Kosten, S., Sobek, S., Barros, N., Cole, J. J., Tranvik, L., et al. (2012). Hydroelectric carbon sequestration. Nat. Geosci. 5, 838–840. doi:10.1038/ngeo1653
Mendonça, R., Müller, R. A., Clow, D., Verpoorter, C., Raymond, P., Tranvik, L. J., et al. (2017). Organic carbon burial in global lakes and reservoirs. Nat. Commun. 8, 1694. doi:10.1038/s41467-017-01789-6
Moran, E. F., Lopez, M. C., Moore, N., Müller, N., and Hyndman, D. W. (2018). Sustainable hydropower in the 21st century. Proc. Natl. Acad. Sci. U. S. A. 115 (47), 11891–11898. doi:10.1073/pnas.1809426115
Muller, M. (2019). Hydropower dams can help mitigate the global warming impact of wetlands. Nature 566, 315–317. doi:10.1038/d41586-019-00616-w
Palma, B., Leonardi, S., Viaroli, P., and Bartoli, M. (2021). Regulation of CO2 fluxes along gradient of water saturation in irrigation canal sediments. Aquat. Sci. 83, 18. doi:10.1007/s00027-020-00773-5
Prairie, Y. T., Alm, J., Beaulieu, J., Barros, N., Battin, T., Cole, J., et al. (2018). Greenhouse gas emissions from freshwater reservoirs: What does the atmosphere see? Ecosystems 21 (5), 1058–1071. doi:10.1007/s10021-017-0198-9
Rosa, L. P., dos Santos, M. A., Matvienko, B., Sikar, E., and Santos, E. O. D. (2006). Scientific errors in the fearnside comments on greenhouse gas emissions (GHG) from hydroelectric dams and response to his political claiming. Clim. Change 75, 91–102. doi:10.1007/s10584-005-9046-6
Saunders, M. J., Jones, M. B., and Kansiime, F. (2007). Carbon and water cycles in tropical papyrus wetlands. Wetl. Ecol. Manag. 15, 489–498. doi:10.1007/s11273-007-9051-9
Sun, R., and Yuan, X. Z. (2012). Carbon storage and spatial pattern characteristics in the drawdown area wetland of the Three Gorges Reservoir. J. Chongqing Norm. Univ. Nat. Sci.) 29 (3), 75–78.
Tang, Q., Bao, Y. H., He, X. B., Zhou, H. D., Cao, Z. J., Gao, P., et al. (2014b). Sedimentation and associated trace metal enrichment in the riparian zone of the Three Gorges Reservoir, China. Sci. Total Environ. 479–480, 258–266. doi:10.1016/j.scitotenv.2014.01.122
Tang, Q., He, X. B., Bao, Y. H., Zhong, R. H., Yan, D. D., and Gao, J. Z. (2014a). Sedimentation processes in a typical riparian zone along the yangtze mainstream of the three Gorges reservoir. Sci. Technol. Rev. 32 (24), 73–77. doi:10.3981/j.issn.1000-7857.2014.24.012
Von Schiller, D., Marcé, R., Obrador, B., Gómez-Gener, L., Casas-Ruiz, J. P., Acuña, V., et al. (2014). Carbon dioxide emissions from dry watercourses. Inland Waters 4, 377–382.
Wang, J. L., Li, Y. H., and Li, D. F. (2017). Dynamics of soil respiration and its influential factors on artificial and natural reed wetlands in Boston Lake. J. Agro-Environ. Sci. 36 (1), 167–175. doi:10.11654/jaes.2016-0744
Wang, Q., Yuan, X. Z., Willison, J. H. M., Zhang, Y. W., and Liu, H. (2014). Diversity and above-ground biomass patterns of vascular flora induced by flooding in the drawdown area of China’s Three Gorges Reservoir. Plos One 9 (6), e100889. doi:10.1371/journal.pone.0100889
Wang, Z., Hu, L., and Zhu, B. (2020). Characteristics of greenhouse gases emission under inundation from dominant herbaceous plants in the water-level fluctuation zone of the Three Gorges Reservoir. Resour. Environ. Yangtze Basin 29 (9), 1965–1974. doi:10.11870/cjlyzyyhj202009007
Wen, Z. F. (2017). Spatial and seasonal patterns of aboveground net primary productivity and their responses to environmental factors in the drawdown zone of the three Gorges reservoir, China: A case study of Baijiaxi drawdown zone. Chongqing: Chongqing Institute of Green and intelligent Technology, The University of Chinese Academy of Sciences. PhD Thesis.
Wu, Y. Y. (2012). Study on greenhouse gas flux from newly created marshes and carbon sink in the Three Gorges Reservoir. Chongqing: College of Resources and Environmental Science, Chongqing University. MS Thesis.
Xiao, L. W., Zhu, B., Kumwimba, M. N., and Jiang, S. W. (2017). Plant soaking decomposition as well as nitrogen and phosphorous release in the water-level fluctuation zone of the Three Gorges Reservoir. Sci. Total Environ. 592, 527–534. doi:10.1016/j.scitotenv.2017.03.104
Xu, Z. B. (2013). Study of carbon dioxide and nitrous oxide emissions from ecosystems of different elevations in a typical water level fluctuating zone in Three Gorges Reservoir. Chongqing: College of Resources and Environment, Southwest University. MS Thesis.
Yang, L., Lu, F., Wang, X. K., Duan, X. N., Tong, L., Ouyang, Z. Y., et al. (2013). Spatial and seasonal variability of CO2 flux at the air-water interface of the Three Gorges Reservoir. J. Environ. Sci. 25 (11), 2229–2238. doi:10.1016/s1001-0742(12)60291-5
Yang, M. F., and Li, L. (2013). Life cycle greenhouse gas emission analysis of hydropower systems. Eng. J. Wuhan. Univer. 46 (1), 41–45.
Yang, M., Grace, J., Geng, X. M., Guan, L., Zhang, Y. M., Lei, J. L., et al. (2017). Carbon dioxide emissions from the littoral zone of a Chinese reservoir. Water 9, 539. doi:10.3390/w9070539
Ye, F., Ma, M. H., Wu, S. J., Jiang, Y., Zhu, G. B., Zhang, H., et al. (2019). Soil properties and distribution in the riparian zone: The effects of fluctuations in water and anthropogenic disturbances. Eur. J. Soil Sci. 70 (3), 664–673. doi:10.1111/ejss.12756
Yuan, X. Z., Zhang, Y. W., Liu, H., Xiong, S., Li, B., and Deng, W. (2013). The littoral zone in the three Gorges reservoir, China: Challenges and opportunities. Environ. Sci. Pollut. Res. 20 (10), 7092–7102. doi:10.1007/s11356-012-1404-0
Zarfl, C., Lumsdon, A. E., Berlekamp, J., Tydecks, L., and Tockner, K. (2015). A global boom in hydropower dam construction. Aquat. Sci. 77, 161–170. doi:10.1007/s00027-014-0377-0
Zhao, D. Z., Wang, Z. H., Tan, D. B., Chen, Y. B., and Li, C. (2019). Comparison of carbon emissions from the southern and northern tributaries of the three gorge reservoir over the changjiang river basin, China. Ecohydrol. Hydrobiology 19 (4), 515–528. doi:10.1016/j.ecohyd.2019.01.008
Zhao, G. H., Yang, P., Tang, L. S., Zhang, Y. F., Wu, Y., and Tong, C. (2020). Temporal variation of carbon dioxide flux between farming and non-farming stages in the land-based shrimp pond in the Min River Estuary. Res. Environ. Sci. 33 (4), 949–957. doi:10.13198/j.issn.1001-6929.2019.09.24
Zhao, M. L., Li, Y. H., and Li, D. F. (2015). Diurnal variation of soil respiration in a typical plant community in the Ebinur lake wetland during beginning winter. J. Agro-Environ. Sci. 34 (12), 2432–2438. doi:10.11654/jaes.2015.12.025
Zhou, J. Y., and Wang, X. K. (2010). Ecosystem vulnerability and ecological protection models in water-level-fluctuation zones of the Three Gorges Reservoir. Beijing: China Environment Press.
Zhou, S. B., He, Y. X., Yuan, X. Z., Peng, S. C., and Yue, J. S. (2017). Greenhouse gas emissions from different land-use areas in the littoral zone of the three Gorges reservoir, China. Ecol. Eng. 100, 316–324. doi:10.1016/j.ecoleng.2017.01.003
Zhu, K., Ma, M., Ran, Y., Wu, S., and Huang, P. (2020). In mitigating CO2 emission in the reservoir riparian: The influences of land use and the dam-triggered flooding on soil respiration. Soil Tillage Res. 197, 104522. doi:10.1016/j.still.2019.104522
Keywords: drawdown area, drained season, CO2 emission, Three Gorges Reservoir, vegetation, elevation, temperature
Citation: Yang L, Lu H, Yu X and Li H (2022) Carbon dioxide flux in the drained drawdown areas of Three Gorges Reservoir. Front. Environ. Sci. 10:1015888. doi: 10.3389/fenvs.2022.1015888
Received: 10 August 2022; Accepted: 05 September 2022;
Published: 03 October 2022.
Edited by:
Zhi-Guo Yu, Nanjing University of Information Science and Technology, ChinaReviewed by:
Junjie Lin, Chongqing Three Gorges University, ChinaJunfeng Xu, Hangzhou Normal University, China
Copyright © 2022 Yang, Lu, Yu and Li. This is an open-access article distributed under the terms of the Creative Commons Attribution License (CC BY). The use, distribution or reproduction in other forums is permitted, provided the original author(s) and the copyright owner(s) are credited and that the original publication in this journal is cited, in accordance with accepted academic practice. No use, distribution or reproduction is permitted which does not comply with these terms.
*Correspondence: Hepeng Li, ODY1NjE0MUBxcS5jb20=