 Danielle Green1*
 Fereidoun Rezanezhad1
 Sean Jordan2
 Claudia Wagner-Riddle2
 Hugh A. L. Henry3Stephanie Slowinski1
 Philippe Van Cappellen1
- 1Ecohydrology Research Group, Department of Earth and Environmental Sciences and Water Institute, University of Waterloo, Waterloo, ON, Canada
- 2School of Environmental Sciences, University of Guelph, Guelph, ON, Canada
- 3Department of Biology, University of Western Ontario, London, ON, Canada
In cold regions, climate change is expected to result in warmer winter temperatures and increased temperature variability. Coupled with changing precipitation regimes, these changes can decrease soil insulation by reducing snow cover, exposing soils to colder temperatures and more frequent and extensive soil freezing and thawing. Freeze-thaw events can exert an important control over winter soil processes and the cycling of nitrogen (N), with consequences for soil health, nitrous oxide (N2O) emissions, and nearby water quality. These impacts are especially important for agricultural soils and practices in cold regions. We conducted a lysimeter experiment to assess the effects of winter pulsed warming, soil texture, and snow cover on N cycling in agricultural soils. We monitored the subsurface soil temperature, moisture, and porewater geochemistry together with air temperature, precipitation, and N2O fluxes in four agricultural field-controlled lysimeter systems (surface area of 1 m2 and depth of 1.5 m) at the University of Guelph’s Elora Research Station over one winter (December 2020 to April 2021). The lysimeters featured two soil types (loamy sand and silt loam) which were managed under a corn-soybean-wheat rotation with cover crops. Additionally, ceramic infrared heaters located above two of the lysimeters were turned on after each snowfall event to melt the snow and then turned off to mimic snow-free winter conditions with increased soil freezing. Porewater samples collected from five depths in the lysimeters were analyzed for total dissolved nitrogen (TDN), nitrate (NO3−), nitrite (NO2−), and ammonium (NH4+). N2O fluxes were measured using automated soil gas chambers installed on each lysimeter. The results from the snow removed lysimeters were compared to those of lysimeters without heaters (with snow). As expected, the removal of the insulating snow cover resulted in more intense soil freeze-thaw events, causing increased dissolved N loss from the lysimeter systems as N2O (from the silt loam system) and via NO3− leaching (from the loamy sand system). In the silt loam lysimeter, we attribute the freeze thaw-enhanced N2O fluxes to de novo processes rather than gas build up and release. In the loamy sand lysimeter, we attribute the increased NO3− leaching to the larger pore size and therefore lower water retention capacity of this soil type. Overall, our study illustrates the important role of winter snow cover dynamics and soil freezing in modulating the coupled responses of soil moisture, temperature, and N cycling.
1 Introduction
Historical data and projected climate trends for cold regions indicate that climate change has and will continue to contribute to warmer winters and fewer days with insulating snow cover, potentially causing increased soil freezing during the fall, winter, and spring (i.e., the non-growing season) (Zhang et al., 2000; Henry, 2008; Natali et al., 2019; Rafat et al., 2022). Winter climate warming may expose soils to: 1) colder temperatures due to the loss of the insulating snowpack, 2) increased soil moisture content arising from increased precipitation and an increased frequency of intermittent snow melt events during winter, and 3) more frequent freeze-thaw cycles (FTC) (Zhang, 2005; Henry, 2008; Campbell et al., 2014). Previous studies conducted in natural and managed ecosystems have reported that microbial activity can be substantial in cold soils (Brooks et al., 1996; Yanai and Toyota, 2006; Wagner-Riddle et al., 2007; Nikrad et al., 2016). The repeated freezing and thawing of porewater in soil can impact soil structure and cause aggregate destruction, water redistribution, gas diffusivity alteration, and changes in soil microbial activity (Kay et al., 1981; Henry, 2007; Tatti et al., 2014; Gao et al., 2017; King et al., 2021). These changes also affect the chemical composition and biotic processes in seasonally snow-covered soils, which, in turn, cause changes in the turnover, retention, and export of nutrients as well as their associated water quality and ecological impacts (Henry, 2007 and, Henry, 2008; Hayashi, 2013; Kurylyk and Watanabe, 2013).
In agroecosystems, freezing and thawing cycles during the winter and spring seasons impact nitrogen (N) cycling in soils, leading to N losses in the form of nitrous oxide (N2O) and nitrate (NO3−), and ultimately decreasing crop yield and contributing to increased greenhouse gas emissions and decreased water quality after runoff (Gao et al., 2017; Wagner-Riddle et al., 2017; King et al., 2021). During the winter, substantial amounts of inorganic N can be generated by soil microbes and then lost in late winter and early spring to leaching and denitrification (Ryan et al., 2000; Schimel et al., 2004). The net N mineralization observed over winter and early spring has been explained by various mechanisms, including carbon (C) limitation in the soil (as finite stocks of labile C are metabolized by the microbial community), reduced overall C:N ratios in the absence of actively growing plants (Lipson et al., 1999), the presence of a physical ice barrier limiting microbial access to new C sources (Schimel et al., 2004), and physical damage to plant roots by heavy soil freezing and subsequent reduced N uptake (Groffman et al., 2001; Tierney et al., 2001).
Limited oxygen (O2) availability in snow-covered soils favours denitrification (i.e., NO3− is used as an alternative electron acceptor for microbial metabolism and reduced to nitrite (NO2−), dinitrogen gas (N2), nitric oxide (NO) or N2O) (King et al., 2021). In contrast, soils that are not insulated by snow cover and are exposed to FTCs experience aggregate disruption that releases dissolved N that was previously inaccessible, which stimulates N2O production (Matzner and Borken, 2008; King et al., 2021). In temperate agroecosystems, soil freezing and thawing during the winter and shoulder seasons (late fall and early spring) is an important control on N2O emissions, and it is estimated 35–65% of annual N2O emissions (Wagner-Riddle et al., 1997; Wagner-Riddle et al., 2007; Risk et al., 2013; Wagner-Riddle et al., 2017) and around 80% of N leaching losses (Jayasundara et al., 2007) can occur at these times. The projected and observed increasing frequency and intensity of FTCs could therefore result in increased N2O production and release, contributing to climate change and ozone layer depletion (IPCC - Intergovernmental Panel on Climate Change, 2021). This hypothesis is supported by studies that have found that following extreme soil freezing during the non-growing season there are decreased concentrations of ammonium (NH4+) and NO3− in the soil coupled with decreased plant N uptake, which suggests that N is being lost due to NO3− leaching and N2O release (Campbell et al., 2014). The environmental controls on these freeze-thaw-induced N2O emissions, the relative contributions of nitrification versus denitrification, and the contributions by N2O accumulated in the frozen soil versus N2O produced in situ upon thaw, have still not been fully resolved (Risk et al., 2014; Brin et al., 2018; Congreves et al., 2018; Ghimire et al., 2020).
In this study, four lysimeter systems were used to determine the impact of winter warming and FTCs on N cycling in agricultural soils, comparing the impact on two soil textures, loamy sand and silt loam. This was achieved by imposing winter pulsed warming using infrared ceramic heaters to remove the snow cover from the surfaces of half the lysimeters for each soil type over the winter and comparing the concentrations of N species and gas fluxes to the lysimeters with ambient snow cover. Specifically, we investigated the effects of pulsed snow removal and soil texture on soil moisture and temperature and the subsequent impacts on soil N cycling responses, with a focus on NO3− leaching to groundwater and N2O emissions. We hypothesized that winter pulsed warming and the resulting increase in freeze-thaw cycles would increase NO3− leaching and N2O emission. We further hypothesized that the larger pore size and lower water retention capacity of the loamy sand would result in increased NO3− leaching compared to in the silt loam.
2 Materials and methods
2.1 Study site
This study was performed at an agricultural site within the University of Guelph’s Elora Research Station (43°38′14.9″N, 80°22′55.0″W) located in Elora, Ontario, Canada. The environmental parameters, including air temperature, precipitation, and snowfall, were recorded hourly at the Environment and Climate Change Canada Elora Weather Station. Our experiment occurred between 1 December 2020 and 30 April 2021. During this phase, air temperatures ranged from -19.7°C (21 February 2021) to 22.1°C (8 April 2021). The average air temperatures during February and April were -7.7°C and 6.4°C, respectively.
2.2 Lysimeter system
The Elora Research Station contains 18 cylindrical weighing lysimeters (Meter Scientific, Meter GmbH, Munich, Germany) installed within a 0.1 ha agricultural field. Each lysimeter is positioned in a 3 m × 10 m plot, arranged in nests of six lysimeters. The lysimeters are 1 m2 in diameter and 1.5 m in depth and are suspended onto load cells in concrete wells, with their weights monitored every minute with ±10 g resolution. The lysimeters vary in soil type, crop rotation, and application of winter warming. For a more detailed explanation of the lysimeter systems at Elora Research Station, the reader is referred to Brown et al. (2021).
Four of the 18 lysimeters were used for the experiment to study the impact of winter warming on two soil textures: Silt Loam—With Snow (SL-WS), Silt Loam—Snow Removed (SL-SR), Loamy Sand—With Snow (LS-WS), Loamy Sand—Snow Removed (LS-SR). Two (SL-WS and SL-SR) contained silt loam (Gleyed Gray-Brown Luvisol, with 42.5 ± 5.1% sand, 46.9 ± 8.2% silt, and 10.6 ± 3.4% clay) extracted from the Elora Research Station (43°38′20″N, 80°24′37″W) which had bulk densities of 1.53 ± 0.12 to 1.78 ± 0.11 g cm−3 and total porosities of 35.6 ± 2.90 to 42.3 ± 4.4% (Table 1). The other two (LS-WS and LS-SR) contained loamy sand soil (Eluviated Melanic Brunisol, with 82.3 ± 4.2% sand, 14.2 ± 3.9% silt, and 3.5 ± 0.9% clay) extracted from a farm in Cambridge, Ontario, Canada (43°27′28″N, 80°20′48″W) which had bulk densities of 1.64 ± 0.07 to 1.71 ± 0.11 g cm−3 and total porosities of 35.5 ± 4.1 to 38.3 ± 2.6% (Table 1). Total C, inorganic C, organic C, and N of the soils in the four lysimeters are presented in Table 1, with higher C and N contents in the silt loam lysimeters (SL-WS and SL-SR) compared to in the loamy sand lysimeters (LS-WS and LS-SR).
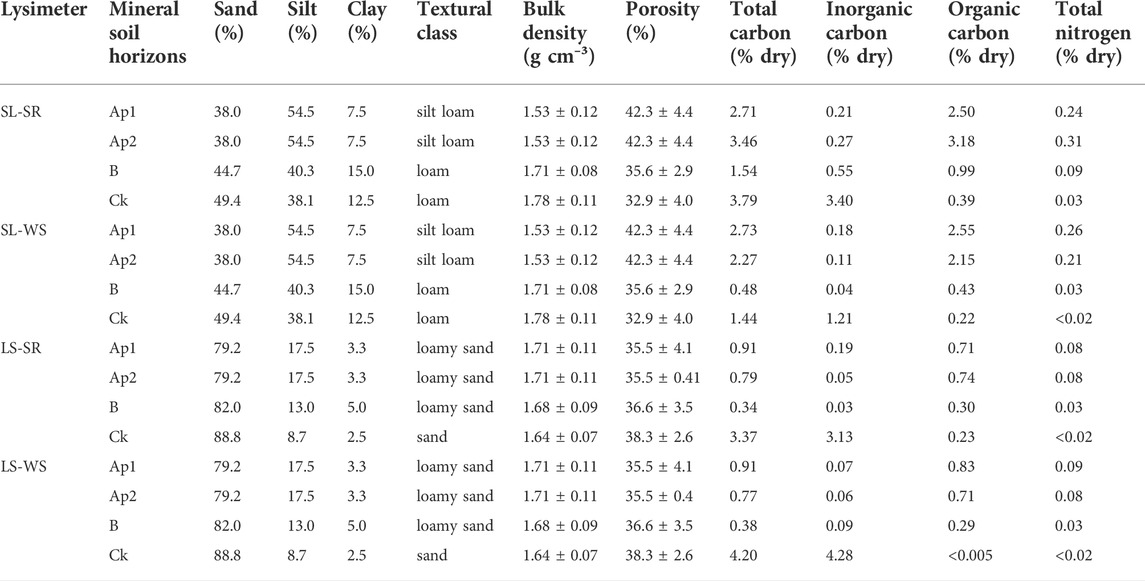
TABLE 1. Physical and chemical properties of the soil in the four lysimeters (Brown, 2021).
Pulsed warming was applied during the winter frozen period to two of the lysimeters (SL-SR and LS-SR) (one loamy sand and one silt loam) using an infrared heater containing 1000 W 120v ceramic heating elements (Mor Electric ALEX Radiant Fixtures, Comstock, Michigan, United States) positioned 1 m above each lysimeter. Heaters were turned on to melt fallen snow then turned off to allow soil to freeze between 27 January 2021 and 3 March 2021. Tensiometers (Meter T8), soil moisture probes (Decagon MPS-6), and TDR sensors (Time-Pico 32) were installed in the lysimeters at -5, -10, -30, -60, and -90 cm below the soil surface to monitor soil moisture content, matric potential, and water potential, respectively, with measurements taken every 10 min. Automatic chambers (Biomet CH-V5) were installed on each lysimeter to measure surface N2O fluxes for 20 min every 2 hours, with a trace gas analyzer (Campbell Scientific TGA200A) measuring N2O concentrations in sampled air. The N2O concentrations were measured using a sampling and return air system that brings air to the trace gas analyzer from the chamber while replacing it with ambient air of known concentration. Addition of ambient air to the chamber headspace causes a dilution of N2O, which is considered when calculating the N2O flux of the system using the ambient air concentration and flow rate. Porewater samples were collected from the depths of -5, -10, -30, -60, and -90 cm from each lysimeter every week (or less often depending on drainage events) using a suction cup (Meter Legacy SIC20) with a Meter Legacy VS. Pro applying negative pressure. The collected porewater samples ranged in volume from 0 to 25 ml, depending on the soil moisture content. The samples were frozen immediately after collection and transported in a cooler to the laboratory, where they were stored at −20°C prior to chemical analyses (Section 2.3).
A diversified crop rotation (Glycine max (soybean), Triticum aestivum (winter and spring wheat), then Zea mays (corn)) with cover crops was applied to each lysimeter plot starting in 2017, with the rotation of crops planted annually in the spring/summer. The diverse crop rotation began with spring wheat planted and 67 kg Nha−1 urea applied on 26 April 2017. After the spring wheat harvest in August 2017, cover crops were planted and 50 kg Nha−1 urea was applied. The cover crops consisted of a four-species mixture after winter wheat (Secale cereale (cereal rye), Avena sativa (oats), Raphanus sativus (radish), and Trifolium incarnatum (crimson clover)). On 18 May 2018, corn was planted and urea applied at 130 kg Nha−1 and in June 2018, corn was interseeded with cover crop (a two-way mixture of rye grass and crimson clover) followed by application of 77 kg Nha−1 urea. In 2019, soybean was planted and 15 kg Nha−1 fertilizer was applied on 7 June and wheat was planted on 8 October, followed by 89 kg Nha−1 urea application on 2 April 2020.
2.3 Porewater geochemistry and analytical techniques
The porewater samples collected from each depth of the four lysimeters were thawed at 4°C for approximately 24 h prior to subsampling for analysis. The samples were filtered through a 0.45 µm pore size membrane filter (polypropylene syringe filters, VWR) into 50 ml centrifuge tubes. Two milliliters of filtered porewater were transferred into 5 ml centrifuge tubes for NH4+ analysis, which was performed using a Gallery Discrete Analyzer (±10% error and ±3% precision). Seven milliliters of filtered porewater were acidified with 20 μl 1M hydrochloric acid (HCl) and analyzed for total dissolved nitrogen (TDN) using a total organic carbon (TOC) analyzer (Shimadzu TOC-LCPH/CPN; method detection limit: 6 μM). One milliliter of porewater was further filtered through a 0.2 μm pore size polysulfone membrane filter (Thermo Fischer Scientific) and was analyzed for NO3− and NO2− using ion chromatography (IC, Dionex ICS-5000 with a capillary IonPac® AS18 column; ± 3.0% error and ±1.6% precision) and all standards were prepared from certified multi-anion standards (Sigma-Aldrich).
2.4 NO3− leaching rates
Instantaneous daily NO3− leaching rates were calculated for each lysimeter for the days when porewater NO3− concentrations at the -90 cm depth were measured. The NO3− leaching rate was calculated by taking the daily sum of discharges measured by the drainage tank method and multiplying this daily discharge rate by the NO3− concentration at 90 cm measured on that date. Following the formula reported by LaPierre et al. (2022), we calculated NO3− leaching rates using:
where
2.5 Statistical analysis
A t-test was used to compare the mean N2O flux and mean daily discharge between the snow removed treatments (WS and SR) within the soil types (SL and LS) and the three phases (pre-snow, winter with/without snow cover, and spring-thaw). We were unable to use a statistical test to compare the mean NO3− leaching rates because of the low number of data points, which was less than 10 within each soil type and period group. The results of the t-test are summarized in Table 2. The t-test results were considered significant when p ≤ 0.05. The t-test calculations were performed using R 4.1.2 (R Core Team, 2021).
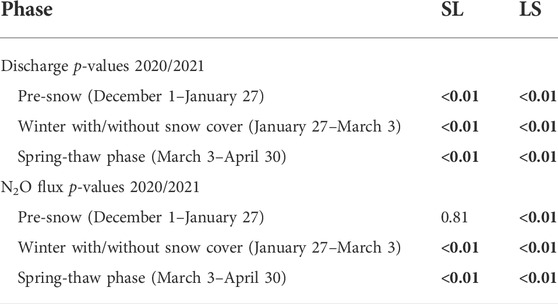
TABLE 2. p-values of one-way t-test comparing the mean N2O flux and mean daily discharge between the snow removal treatments (WS and SR) within the soil types (SL and LS) and the three phases (Pre-Snow, Winter with/without snow cover, and Spring-thaw). Bold values indicated p ≤ 0.05.
3 Results
We categorized the experimental period into three phases based on the winter snow cover: the pre-snow phase (1 December 2020 to 27 January 2021), the winter with/without snow cover phase (27 January 2021 to 3 March 2021), and the spring-thaw phase (3 March 2021 to 30 April 2021). These three phases are distinguished by shading in all of the time series figures to visualize and highlight the snow cover controls on temperature, moisture, and N species concentrations.
3.1 Soil temperature and moisture dynamics
Changes in soil temperature at different depths within each lysimeter were directly influenced by air temperature and snow removal from the surface of SL-SR and LS-SR (Figure 1). The soil temperature trends and magnitude during the pre-snow and spring-thaw phases were almost identical in each set of two lysimeters. Throughout the pre-snow phase, soil temperatures increased with increasing depth below the surface for each of the four lysimeters. During the spring-thaw phase, as air temperatures began to increase, the trend was reversed, and soil temperatures decreased with increasing depth. During the winter with/without snow cover phase, SL-SR and LS-SR experienced lower soil temperatures at all soil depths in comparison to SL-WS and LS-WS. SL-SR and LS-SR also had soil temperatures drop to below 0°C at depths of −5, −10, and −30 cm at multiple times over the winter months when air temperatures dropped significantly (−14°C), reaching temperatures of less than −5°C at −5 cm depth (Figure 1). SL-WS and LS-WS also experienced temperatures below 0°C at the −5 and −10 cm depths, however these temperature drops were less pronounced and occurred less frequently. Thus, the pulsed warming applied to SL-SR and LS-SR induced more freeze-thaw cycles than what was experienced by SL-WS and LS-WS.
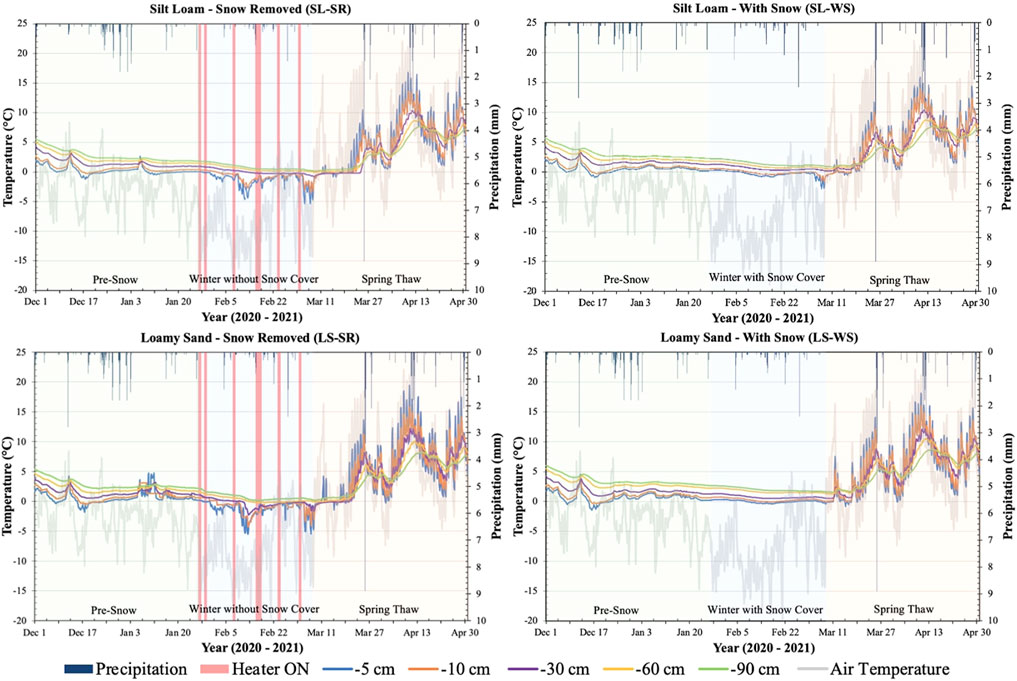
FIGURE 1. Soil temperature (primary y-axis) measured at -5, -10, -30, -60, and -90 cm depths in four lysimeters between 1 December 2020, and 30 April 2021. Soil temperature is plotted with air temperature (primary y-axis) and precipitation (secondary y-axis) recorded from the Environment Canada Elora Weather Station. The graphs for SL-SR and LS-SR also show when the heaters were turned on and off during the winter to melt snow on the lysimeter surface (red bars on winter without snow cover phase). The graphs are divided into three phases, pre-snow, winter with/without snow, and spring-thaw, to determine the patterns of change during each of the experimental phases.
Soil moisture varied between each of the four lysimeters and was directly influenced by precipitation and snowmelt (see Supplementary Figure S1). TDR sensors only measure liquid water, so a decrease in water content is a sign that water is moving from the liquid to solid phase. Soil moisture generally increased with an increase in depth for all lysimeters due to the drainage of water through the soil column. SL-SR had a constant soil moisture of ∼35–38% (fully saturated; total porosity of 35.6 ± 2.90 to 42.3 ± 4.4%) at the -90 cm depth. The 5 and 10 cm depths followed the same patterns in soil moisture during the experiment period, beginning with decreases from ∼35% to 18% at 5 cm and 22% at 10 cm depths on 17 December then increase back to ∼35%. This was followed by a decrease to 10% at 5 cm and 32% at -10 cm depths on 12 January, an increase to 53% at the beginning of the winter without snow cover phase, and a decrease to 10–18% at -5 cm and 14–21% at -10 cm depths during the winter without snow cover phase, followed by an increase in soil moisture during the spring-thaw phase. SL-WS had a constant soil moisture of ∼35% (fully saturated) at the depths of -30, -60, and -90 cm and stayed constant over the experimental period. At -10 cm, soil moisture had fluctuations similar to SL-SR. LS-SR had lower soil moisture compared to SL-WS and SL-SR (total porosity of 35.5 ± 4.1 to 38.3 ± 2.61%). At the -10 and -30 cm depths, the moisture began at 27% and stayed relatively constant during the pre-snow phase (there was a decrease to 10%) then increased around mid-December. Both the -10 and -30 cm depths had a decrease in soil moisture to ∼9% during the winter without snow cover phase and then an increase to 29% (with small fluctuations) during the spring-thaw phase. The -60 cm depth remained between 15–26% soil moisture during the pre-snow phase, with a decrease in moisture during the winter without snow cover phase to a minimum value of 12%. At -90 cm, the soil moisture remained between 19–27%, decreased to 20%, and increased to 35% during the pre-snow, winter without snow cover, and spring-thaw phases, respectively. In LS-SR, the moisture content at -60 cm was notably lower than the moisture at -10 and -30 cm. Increased silt and clay content at -10 and -30 cm could have promoted water retention at those depths, thereby reducing the soil moisture measured at -60 cm. The moisture levels at -60 cm increased to levels above the values observed at -10 and -30 cm in LS-SR after the spring-thaw due to the drainage of porewater as it melted. LS-WS had relatively constant soil moistures at -5 and -10 cm depths, remaining between 6–28% with fluctuations during the experiment period. The soil moisture at -90 cm remained between 16–20% before increasing during the spring-thaw to a maximum value of 32%.
3.2 Trends in dissolved nitrogen species
Porewater NO3− concentrations in all four lysimeters remained relatively low and constant during the pre-snow and winter with/without snow cover phases and increased with the spring-thaw (Figure 2). For the lysimeters containing silt loam (SL-SR and SL-WS), NO3− concentrations at the depths of -5 and -10 cm were relatively low (0–0.2 mmol L−1) and increased during the spring-thaw phase to concentrations of ∼1.0 and 0.6 mmol L−1 at -5 cm and -10 cm depths, respectively, in SL-SR, and to a concentration of ∼0.7 mmol L−1 at both the -5 cm and -10 cm depths in SL-WS. SL-WS also had an increase in NO3− concentration at the -30 cm depth at the beginning of the spring-thaw phase and the concentrations at -5, -10, and -30 cm depths decreased in the mid spring-thaw phase. The remaining depths (-60 and -90 cm) contained low and constant NO3− concentrations throughout the experimental period, with only small fluctuations. LS-SR and LS-WS had much lower NO3− concentrations and remained relatively low and close to zero during the pre-snow and winter with/without snow cover at all depths, with a small increase to a maximum value of 0.1–0.25 mmol L−1 at -30, -60, and -90 cm depths in LS-SR during the spring-thaw phase.
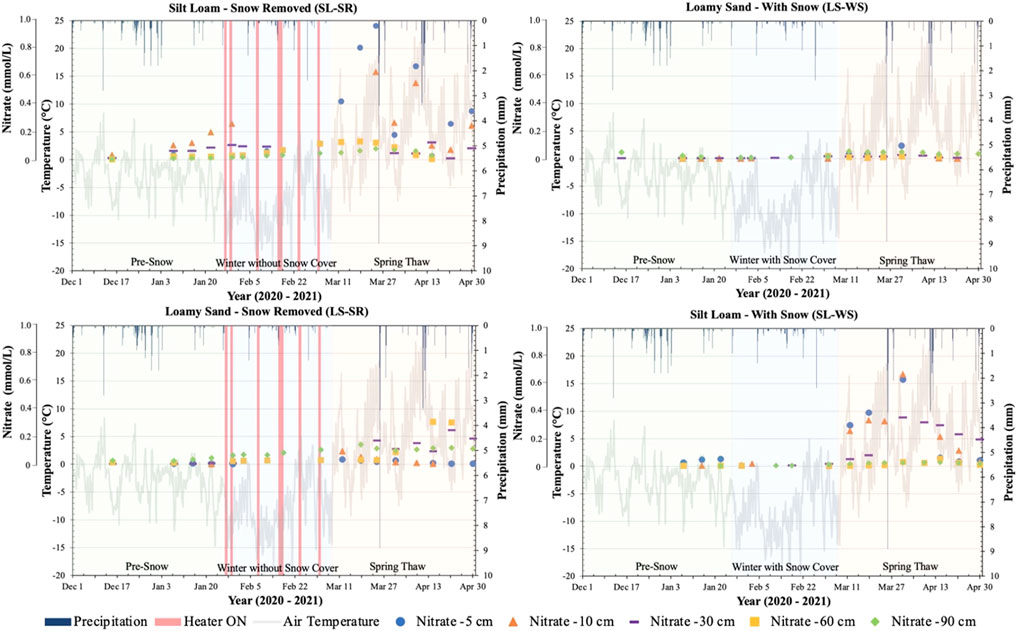
FIGURE 2. Porewater nitrate (NO3−) concentration (tertiary y-axis) measured at -5, -10, -30, -60, and -90 cm depths in four lysimeters between 1 December 2020, and 30 April 2021. NO3− concentration is plotted with air temperature (primary y-axis) and precipitation (secondary y-axis) recorded from the Environment Canada Elora Weather Station. The graphs for SL-SR and LS-SR also show when the heaters were turned on and off during the winter to melt snow on the lysimeter surface (red bars on winter without snow cover phase). The graphs are divided into three phases, pre-snow, winter with/without snow, and spring-thaw, to determine the patterns of change during each of the experimental phases.
Porewater TDN trends during the three phases in the lysimeters and the response to with/without snow cover conditions showed similar patterns as NO3− (Supplementary Figure S2). The NH4+ concentrations at all depths in the four lysimeters remained relatively constant with concentrations ranging between ∼0.5–16 μmol L−1, except the -30 cm depth in LS-SR experienced an increase in concentration during the spring-thaw phase to a maximum value of 54 μmol L−1 and then decreased to the low concentration range observed at other depths (Figure 3). The NO2− concentration in all lysimeters remained relatively low and below the detection limit throughout each phase. An increase in NO2− concentration was also observed at -30 cm in LS-SR during the spring-thaw (Supplementary Figure S3).
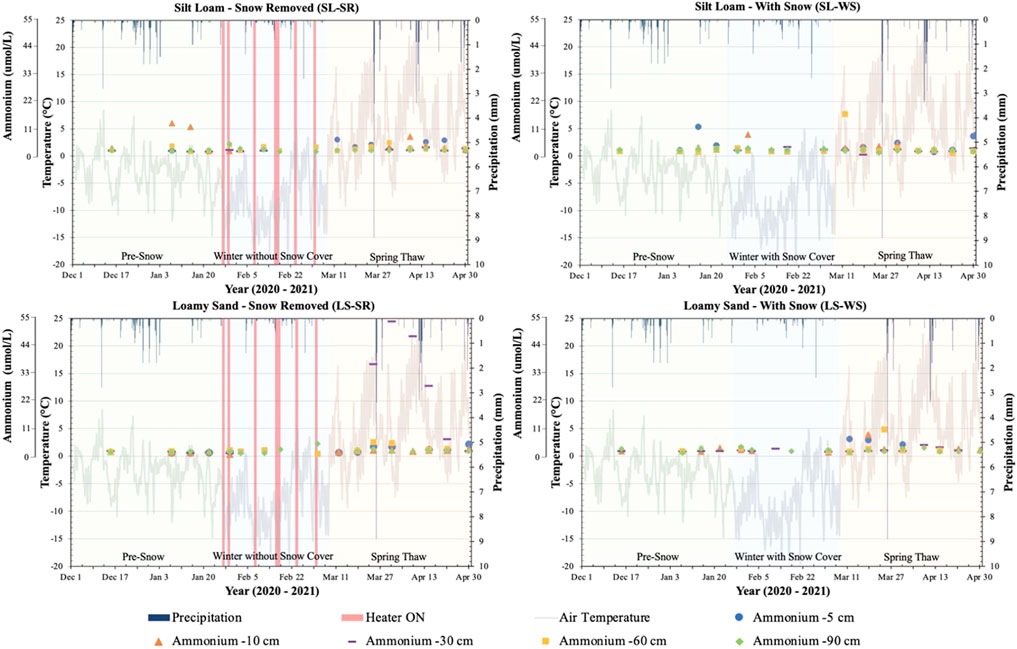
FIGURE 3. Porewater ammonium (NH4+) concentration (tertiary y-axis) measured at -5, -10, -30, -60, and -90 cm depths in four lysimeters between 1 December 2020 and 30 April 2021. NH4+ concentration is plotted with air temperature (primary y-axis) and precipitation (secondary y-axis) recorded from the Environment Canada Elora Weather Station. The graphs for SL-SR and LS-SR also show when the heaters were turned on and off during the winter to melt snow on the lysimeter surface (red bars on winter without snow cover phase). The graphs are divided into three phases, pre-snow, winter with/without snow, and spring-thaw, to determine the patterns of change during each of the experimental phases.
3.3 N2O fluxes
N2O fluxes were measured throughout the experiment period with a baseline of approximately 0 mmol m−2 day−1. SL-SR and SL-WS had low N2O fluxes of 0.09 and 0.13 mmol m−2 day−1, respectively, in the pre-snow phase after the first freeze and thaw cycle at the depths of -5 and -10 cm (Figure 4). There were also low N2O fluxes (∼0.21 and 0.1 mmol m−2 day−1, respectively) in mid-February when the -5 and -10 cm soil depths froze. When the soil thawed in mid-March (spring-thaw phase), there was a large flux of N2O up to maximum of 1.6 and 0.5 mmol m−2 day−1 in SL-SR and SL-WS, respectively. LS-SR had N2O fluxes throughout the pre-snow and winter without snow cover phases, with a maximum value of ∼0.2 mmol m−2 day−1 followed by lower fluxes of ∼0.1 mmol m−2 day−1 after the soil thawed in the spring. LS-WS experienced the same pattern of N2O fluxes throughout the experimental period; however, the pre-snow and winter with snow phase fluxes reached a maximum value of 0.1 mmol m−2 day−1 and the spring-thaw fluxes were ∼0.4 mmol m−2 day−1.
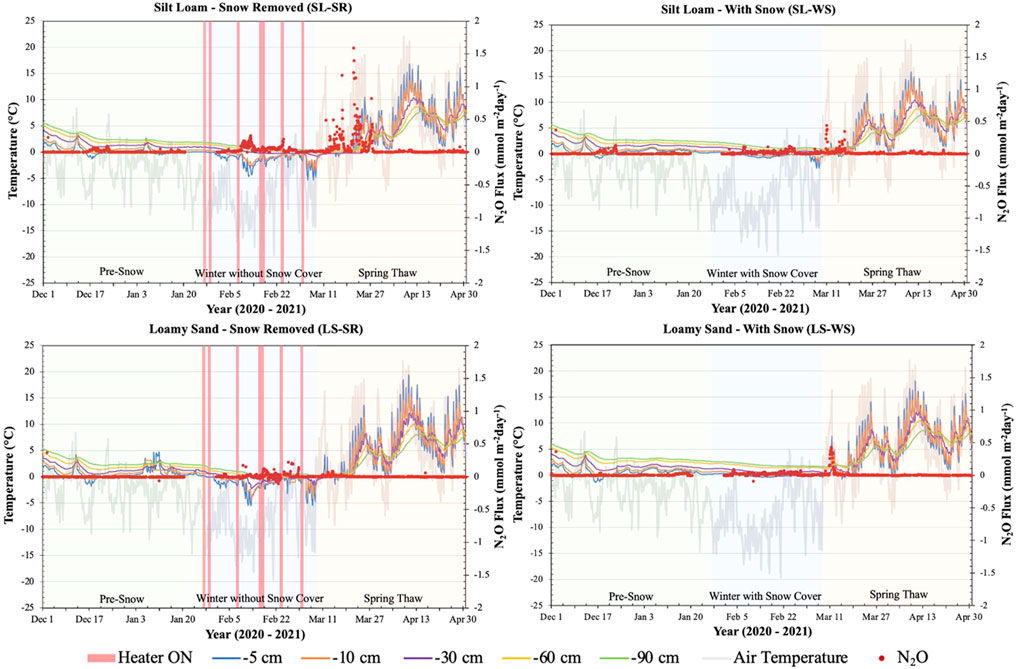
FIGURE 4. Nitrous oxide (N2O) fluxes (secondary y-axis) measured at the soil surface in four lysimeters between 1 December 2020, and 30 April 2021. N2O fluxes are plotted with soil temperature at -5, -10, -30, -60–90 cm depths and air temperature recorded from the Environment Canada Elora Weather Station. The graphs SL-SR and LS-SR also show when the heaters were turned on and off during the winter to melt snow on the lysimeter surface (red bars on winter without snow cover phase). The graphs are divided into three phases, pre-snow, winter with/without snow, and spring-thaw, to determine the patterns of change during each of the experimental phases.
3.4 Discharge rates, NO3− leaching rates, and N2O fluxes
We visualized the distributions of the discharge rates, NO3− leaching rates, and N2O fluxes in all four lysimeters for each of the three seasonal periods using boxplots (Figures 5, 6). In lysimeters containing silt loam (SL-SR and SL-WS), snow removal resulted in high N2O fluxes in the winter and spring-thaw phases, low NO3− leaching rates and discharge rates in the winter phase, and high NO3− leaching rates and discharge rates in the spring-thaw phase (Figure 5). In lysimeters containing loamy sand (LS-SR and LS-WS), snow removal resulted in low N2O fluxes and high NO3− leaching rates in the winter and spring-thaw phases, high discharge rates in the winter phase, and low discharge rates in the spring-thaw phase. The results of the t-tests indicate that all differences in the discharge rates and N2O fluxes between the SR and WS lysimeters were significant (p ≤ 0.05) in the winter with/without snow cover and spring-thaw phases (Table 2).
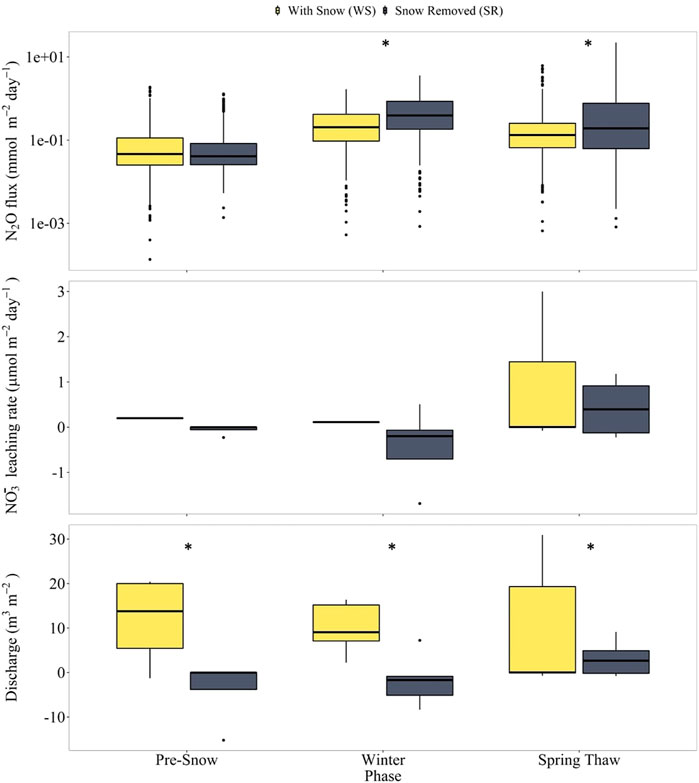
FIGURE 5. Box plots of N2O fluxes (top panels), NO3− leaching rates (middle panels), and discharge rates (bottom panels) in silt loam lysimeters SL-SR and SL-WS during the pre-snow, winter with/without snow, and spring-thaw phases. The y-axis for the N2O fluxes is a log-axis (top panel only). An * above the boxplots signifies median values that are statistically significant between the SR and WS lysimeters. Values are statistically significant when p ≤ 0.05.
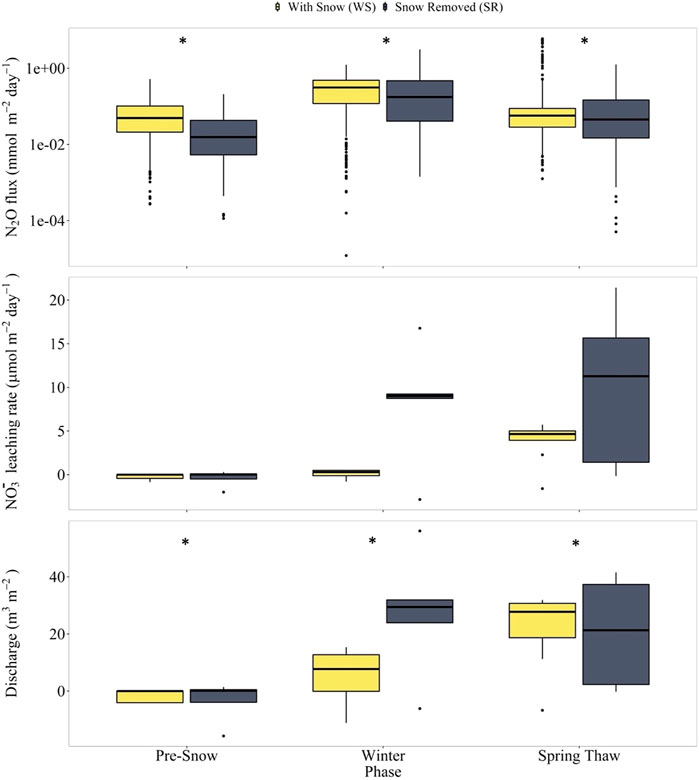
FIGURE 6. Box plots of N2O fluxes (top panels), NO3− leaching rates (middle panels), and discharge rates (bottom panels) in loamy sand lysimeters LS-SR and LS-WS during the pre-snow, winter with/without snow, and spring-thaw phases. The y-axis for the N2O fluxes is a log-axis (top panel only). An * above the boxplots signifies median values that are statistically significant between the SR and WS lysimeters. Values are statistically significant when p ≤ 0.05.
4 Discussion
4.1 Soil texture controls on temperature, moisture, and N dynamics
Our results showed that soil type (i.e., the differences in texture and mineral particle size) influenced soil temperature and moisture, dissolved N species concentrations, discharge, NO3− leaching rates, and N2O fluxes in the lysimeters. Soil moisture and temperature in SL-SR and SL-WS (silt loam) showed greater variability in comparison to the moisture and temperature levels of LS-SR and LS-WS (loamy sand) (see Figure 1 and Supplementary Figure S1), which can be attributed to differences in the physical and hydraulic properties of the soil in each lysimeter. SL-SR and SL-WS contain silt loam that consists of 42.5 ± 5.1% sand, 46.9 ± 8.2% silt, and 10.6 ± 3.4% clay (Table 1). LS-SR and LS-WS contain loamy sand which consists of 82.3 ± 4.2% sand, 14.2 ± 3.9% silt, and 3.5 ± 0.9% clay (Table 1). The loamy sand lysimeters had coarser texture and larger pores, lower water retention capacity, higher hydraulic conductivity, and higher levels of leaching in comparison to the silt loam lysimeters. During the winter with/without snow cover phase, the porewater froze as the soil temperatures fell below 0°C, which resulted in stable soil moisture levels until the thaw occurred and precipitation events led to an increase in soil moisture.
The silt loam has a higher ability to hold water and therefore also the nutrients dissolved in the water, which explains in part the higher NO3− concentrations in the lysimeters containing silt loam compared to the more permeable loamy sand lysimeters (Figure 2). The silt loam soil likely has a higher sorption capacity for NH4+ due to its higher clay content (10.6% vs. 3.5% in the loamy sand; Table 1) (Jarecki et al., 2008; Cambouris et al., 2016). Although we did not measure the NH4+ sorption capacity of the two soils, this higher clay content and presumed higher NH4+ sorption capacity likely drove the higher N2O fluxes observed in the silt loam compared to the loamy sand for the lysimeters with the same snow cover treatments and within the same seasonal periods. The higher total organic C content, which likely also resulted in higher dissolved organic C concentrations in the soil porewater, in the SL versus LS soils may have also contributed to the higher N2O fluxes observed, given that dissolved organic C is the main electron donor used for N2O production via denitrification (i.e., the reduction of NO3− and NO2−) (Li Y. et al., 2021). Another explanation for the lower N2O fluxes observed in the loamy sand could be the larger pore spaces, higher aeration rates, and thus higher O2 concentrations in the soil pore spaces compared to the silt loam (Osman, 2013), which would in turn decrease denitrification, contributing to less N2O production (Kasimir-Klemedtsson et al., 1997; Song et al., 2019).
4.2 Snow cover controls on soil temperature, moisture, and N dynamics
Snow cover influences the soil temperature and moisture content which, in turn, affects microbial activity and the production, speciation, and transport of key bioactive elements, including N, in agricultural soils. The pulsed warming events imposed during the winter phase in both snow removed lysimeters (SL-SR and LS-SR) exposed the upper soil layer to relatively warmer temperatures (remaining below 0°C) during the pulsed warming events and lower freezing temperatures (below 0°C) after the warming pulses (Figure 1). In contrast, the observed soil temperatures at 5 and 10 cm in the lysimeters with snow (SL-WS and LS-WS) indicated that, as expected, the snow cover had an insulating effect which prevented temperature fluctuations and FTCs (Ruan and Robertson, 2017).
The formation of ice cover on the soil surface and the freezing and thawing of porewater also resulted in a gradual decrease of soil moisture at the -5 and -10 cm depths during the winter in the snow removed lysimeters (SL-SR and LS-SR) (Supplementary Figure S1). In the lysimeters with snow cover (SL-WS and LS-WS), the soil moisture was relatively constant during the winter phase (Supplementary Figure S1). The decrease in soil moisture in the loamy sand snow removed lysimeter (LS-SR) over the winter was matched by higher discharge compared to its counterpart loamy sand with snow cover lysimeter (LS-WS) (Figures 5, 6).
Snow cover and its effect on the number of over-winter FTCs had a clear impact on dissolved NO3− concentrations in the lysimeters. In the two snow removed lysimeters (SL-SR and LS-SR), the FTCs at the soil surface were accompanied by higher increases in NO3− concentrations with the start of the spring-thaw compared to the lysimeters with snow cover (SL-WS and LS-WS), likely explaining the higher N2O fluxes in snow removed lysimeters (Figure 2). A likely explanation for the higher NO3− concentrations is that the FTCs caused the physical disruption of soil aggregates, microbial cells, and/or fine roots, which increases the availability of labile dissolved organic N, including osmolytes, and NH4+ to the soil microbial community, which are then transformed to NO3− (Risk et al., 2013; King et al., 2021). In contrast, the insulating effect of the snow cover and lack of pulsed warming events in SL-WS and LS-WS reduced the FTCs that the upper soil layer experienced, and therefore lower dissolved N concentrations were observed over-winter.
In the silt loam (SL-SR and SL-WS) lysimeters, the increase in porewater NO3− concentrations and N2O fluxes in the snow removed (SL-SR and LS-SR) versus with snow (SL-WS and LS-WS) treatments, likely driven by the increased number of FTCs, was not only restricted to the winter season, as the effect was also seen throughout the spring thaw period (Figures 2, 4). This indicates that the physical, and by extension chemical, modification of the stability of soil aggregates by FTCs in the winter impacts soil C and N availability in the spring thaw period, which has also been observed by others (Dietzel et al., 2011; Risk et al., 2013). In contrast, in the loamy sand (LS-WS and LS-SR) lysimeters, the effect of the increased number of FTCs was not observed during the spring thaw period. The continued effect of the snow removal into the spring thaw in the silt loam but not the loamy sand lysimeters is likely due to the higher soil organic C, and therefore also soil organic matter-containing aggregate, content of the silt loam soil (Table 1). Thus, in more clay and silt-rich soils like the silt loam soil studied here, the prior winter conditions need to be considered when looking to predict soil C and N availability and N2O fluxes during the spring and summer growing season.
4.3 Snow removal had contrasting impact on N loss route in silt loam versus loamy sand
In the silt loam lysimeters, the higher median winter N2O fluxes observed in the snow removed (SL-SR) compared to the with snow (SL-WS) lysimeters can be largely attributed to the higher number of FTC events and de novo N2O production during the thawing period of the FTC events (Congreves et al., 2018; Risk et al., 2014; Brin et al., 2018). This interpretation is supported by the higher observed NO3− concentrations in the snow removed treatment, given that microbial NO3− reduction can produce N2O via incomplete denitrification.
In the loamy sand lysimeters, the effect of snow removal on winter N2O fluxes was opposite to that of the silt loam lysimeters; the snow removed lysimeter had lower median winter N2O fluxes. However, the over-winter water discharge and NO3− leaching rates were higher in the snow removed lysimeter (SL-SR) than in the with snow lysimeter (SL-WS) for the loamy sand. Thus, in the loamy sand lysimeter, FTCs suppressed winter N2O emissions but enhanced winter NO3− leaching. For both the loamy sand and silt loam lysimeters, the effect of snow removal and increased FTCs was more N lost from the lysimeters over the winter. In the loamy sand, the N was lost to leaching, while in the silt loam, the N was lost as gaseous N2O emissions. This different effect of the FTCs on the N loss route in the loamy sand versus the silt loam was consistent with the lower water retention capacity and higher hydraulic conductivity of the loamy sand. In the loamy sand, warming pulses increased soil temperatures, which led to higher water and solute transport rates relative to the with snow cover scenario, where soil was insulated from air temperature, which is consistent with the results of Kieta and Owens (2019). NO3− is particularly prone to leaching due to charge repulsion between its intrinsic negative charge and the prevalence of negatively charged soil particles (Di and Cameron, 2002). The dissolved N produced by FTC-induced processes was thus carried with the water and lost via leaching. In the silt loam system, the higher water retention capacity meant that dissolved N produced by FTC-induced processes had a longer residence time in the soil porewater spaces, where it could be used by the microbial community in denitrification and/or nitrification reactions, which produce N2O. Furthermore, high water retention capacity also leads to less O2 diffusion into the soil and a high abundance of anoxic pore spaces and microsites in silt loam soil due to its high clay content, which favours denitrification, and potentially N2O production by incomplete denitrification (Groffman and Tiedje, 1988; Harrison-Kirk et al., 2013).
Overall, the winter pulsed warming and increase in FTCs enhanced N loss from the soil by releasing more dissolved N via freezing-induced processes from the soil N compartments that would have otherwise retained N (e.g., plant roots, microbial biomass and/or soil aggregates). As a result of enhanced dissolved N release, there was enhanced N loss from the soil via two potential routes: leaching to groundwater and/or loss as gaseous N2 and N2O. Here, we focused our analysis on N loss via N2O fluxes, given that N2O is a significant greenhouse gas. The dominant N loss route in the silt loam in the snow removed scenario was as N2O, while the dominant N loss route in the loamy sand was NO3− leaching. The contrasting effect of winter pulsed warming-induced FTCs on N2O fluxes and NO3− leaching rates in the two different soil types is interesting and will need to be considered in field-scale N cycling models which aim to predict N loss routes and rates from cropped fields (e.g., Ingraham and Salas, 2019). Both loss routes have important implications for society and the environment; N loss to groundwater can have negative impacts on downstream streams and lakes that receive groundwater discharge, and/or the NO3− can accumulate in groundwater as legacy N (Van Meter et al., 2016), while N loss as N2O increases the burden of N2O in the atmosphere, which enhances the greenhouse effect.
5 Summary and conclusion
In this study, we simulated the impact of climate change warming-induced snow cover reduction on soil N cycling in cold region agroecosystems using experimental lysimeter systems. We compared the effect of snow removal versus snow cover and the effect of soil type, as well as their interactions, on soil surface N2O fluxes, soil porewater N species concentrations with depth in the soil profile, soil temperature, soil moisture, water discharge, and NO3− leaching rates to assess the interactive impacts of snow cover and soil type on soil N cycling. Our results show that N losses from the lysimeter systems were higher in the treatments where snow was removed because there were more freeze-thaw cycles, which caused dissolved N release from soil N pools and subsequent loss of dissolved (NO3−) or gaseous (N2O) N species from the systems. In the silt loam system, this released dissolved N was subsequently lost from the system as N2O, while in the loamy sand system, the dissolved N was lost via NO3− leaching. In the silt loam, we attribute the freeze thaw-enhanced N2O fluxes to de novo processes rather than gas build up and release based on the experimental design and the frequency of freeze-thaw events induced. These contrasting N loss routes by the different soil types highlight the importance of considering soil type in field-scale models of N cycling. Overall, our results show that the increased number of freeze-thaw cycles expected in cold temperature agricultural soils because of climate change and reduced snow cover will enhance N loss from soils by some combination of enhanced NO3− leaching to groundwater and enhanced N2O emissions.
Data availability statement
The datasets presented in this study can be found in online repositories. The names of the repository/repositories and accession number(s) can be found below: https://doi.org/10.20383/103.0637 Federated Research Data Repository.
Author contributions
CW, HH, and FR designed the lysimeter winter pulsed warming experiment. SJ carried out the field monitoring and porewater and gas sampling. DG performed the sample and data analyses and prepared the manuscript. SS helped with leaching rate calculations and figures preparation. PVC and FR supervised the data analyses and helped DG to interpret the data. All authors contributed to the preparation of the manuscript and have approved it for publication.
Funding
The Funding was provided by the Ontario Agri-Food Innovation Alliance Grant to Claudia Wagner-Riddle (Evaluating the resilience of diversified crop rotations to extreme weather events; Grant No. UG-T1-2020-100143).
Acknowledgments
We would like to acknowledge the lab supplies and supports provided by the Canada Excellence Research Chair (CERC) program in Ecohydrology, the Global Water Futures (GWF) program funded by the Canada First Research Excellence Fund (CFREF), and Natural Sciences and Engineering Research Council Discovery Grants to Rezanezhad (Grants: RGPIN-2015-03801 and RGPIN-2022-03334). We thank Marianne Vandergriendt and Dr. Shuhuan Li (Ecohydrology Research Group, University of Waterloo) for assistance with laboratory analyses, SJ (University of Guelph) for assisting with the porewater sampling, and Zachary Debruyn (University of Guelph) for providing the drainage data.
Conflict of interest
The authors declare that the research was conducted in the absence of any commercial or financial relationships that could be construed as a potential conflict of interest.
Publisher’s note
All claims expressed in this article are solely those of the authors and do not necessarily represent those of their affiliated organizations, or those of the publisher, the editors and the reviewers. Any product that may be evaluated in this article, or claim that may be made by its manufacturer, is not guaranteed or endorsed by the publisher.
Supplementary material
The Supplementary Material for this article can be found online at: https://www.frontiersin.org/articles/10.3389/fenvs.2022.1020099/full#supplementary-material
References
Blum, W. (2005). Soils and climate change. Curr. Opin. Environ. Sustain. 5 (2), 539–544. doi:10.1016/j.cosust.2012.06.005
Bremner, J. M. (1997). Sources of nitrous oxide in soils. Nutr. Cycl. Agroecosyst. 49, 7–16. doi:10.1023/A:1009798022569
Brin, L. D., Goyer, C., Zebarth, B. J., Burton, D. L., and Chantigny, M. H. (2018). Changes in snow cover alter nitrogen cycling and gaseous emissions in agricultural soils. Agric. Ecosyst. Environ. 258, 91–103. doi:10.1016/j.agee.2018.01.033
Brooks, P. D., Schmidt, S. K., and Williams, M. W. (1997). Winter production of CO2 and N2O from alpinetundra: Environmental controls and relationship tointer-system C and N fluxes. Oecologia 110, 403–413. doi:10.1007/PL00008814
Brooks, P. D., Williams, M. W., and Schmidt, S. K. (1998). Inorganic nitrogen and microbial biomass dynamics before and during spring snowmelt. Biogeochemistry 43, 1–15. doi:10.1023/A:1005947511910
Brooks, P. D., Williams, M. W., and Schmidt, S. K. (1996). Microbial activity under alpine snowpacks, Niwot Ridge, Colorado. Biogeochemistry 32, 93–113. doi:10.1007/BF00000354
Brown, S., Wagner-Riddle, C., Debruyn, Z., Jordan, S., Berg, A., Ambadan, J. T., et al. (2021). Assessing variability of soil water balance components measured at a new lysimeter facility dedicated to the study of soil ecosystem services. J. Hydrology 603. doi:10.1016/j.jhydrol.2021.127037
Burton, D. L., and Beauchamp, E. G. (1994). Profile nitrous oxide and carbon dioxide concentrations in a soil subject to freezing. Soil Sci. Soc. Am. J. 58 (1), 115. doi:10.2136/sssaj1994.03615995005800010016x
Cambouris, A. N., Ziadi, N., Perron, I., Alotaibi, K. D., Luce, St.M., and Tremblay, N. (2016). Corn yield components response to nitrogen fertilizer as a function of soil texture. Can. J. Soil Sci. 96 (4), 386–399. doi:10.1139/cjss-2015-0134
Campbell, J. L., Socci, A. M., and Templer, P. H. (2014). Increased nitrogen leaching following soil freezing is due to decreased root uptake in a northern hardwood forest. Glob. Chang. Biol. 20, 2663–2673. doi:10.1111/gcb.12532
Congreves, K. A., Wagner-Riddle, C., Si, B. C., and Clough, T. J. (2018). Nitrousoxide emissions and biogeochemical responses to soil freezing- thawing and drying-wetting. Soil Biol. Biochem. 117, 5–15. doi:10.1016/j.soilbio.2017.10.040
Delwiche, C. C. (1970). The nitrogen cycle. Sci. Am. 223 (3), 136–146. doi:10.1038/scientificamerican0970-136
Di, H. J., and Cameron, K. C. (2002). Nitrate leaching in temperate agroecosystems: Sources, factors and mitigating strategies. Nutr. Cycl. Agroecosyst. 46, 237–256. doi:10.1023/A:1021471531188
Dietzel, R., Wolfe, D., and Thies, J. E. (2011). The influence of winter soil cover on spring nitrous oxide emissions from an agricultural soil. Soil Biol. Biochem. 43 (9), 1989–1991. doi:10.1016/j.soilbio.2011.05.017
Environmental Commissioner of Canada (2018). Climate action in Ontario: What’s next? 2018 greenhouse gas progress report.
Fitzhugh, R. D., Driscoll, C. T., Groffman, P. M., Tierney, G., Fahey, T. J., and Hardy, J. (2001). Effects of soil freezing disturbance on soil solution nitrogen, phosphorus, and carbon chemistry in a northern hardwood ecosystem. Biogeochemistry 56, 215–238. doi:10.1023/A:1013076609950
Freppaz, M., Celi, L., Marchelli, M., and Zanini, E. (2008). Snow removal and its influence on temperature and N dynamics in alpine soils (Vallée d'Aoste, northwest Italy). Z. Pflanzenernähr. Bodenk. 171, 672–680. doi:10.1002/jpln.200700278
Gao, D., Zhang, L., Lui, J., Peng, B., Fan, Z., Dai, W., et al. (2017). Responses of terrestrial nitrogen pools and dynamics to different patterns of freeze-thaw cycle: A meta-analysis. Glob. Chang. Biol. 24 (6), 2377–2389. doi:10.1111/gcb.14010
Ghimire, U., Shrestha, N. K., Biswas, A., Wagner-Riddle, C., Yang, W., Prasher, S., et al. (2020). A review of ongoing advancements in soil and water assessment tool (SWAT) for nitrous oxide (N2O) modeling. Atmosphere 11 (5), 450. doi:10.3390/atmos11050450
Groffman, P. M., Driscoll, C. T., Fahey, T. J., Hardy, J. P., Fitzhugh, R. D., and Tierney, G. L. (2001). Effects of mild winter freezing on soil nitrogen and carbon dynamics in a northern hardwood forest. Biogeochemistry 56, 191–213. doi:10.1023/A:1013024603959
Groffman, P. M., and Tiedje, J. M. (1988). Denitrification hysteresis during wetting and drying cycles in soil. Soil Sci. Soc. Am. J. 52, 1626–1629. doi:10.2136/sssaj1988.03615995005200060022x
Harrison-Kirk, T., Beare, M. H., Meenken, E. D., and Condron, L. M. (2013). Soil organic matter and texture affect responses to dry/wet cycles: Effects on carbon dioxide and nitrous oxide emissions. Soil Biol. Biochem. 57, 43–55. doi:10.1016/j.soilbio.2012.10.008
Hayashi, M. (2013). The cold vadose zone: Hydrological and ecological significance of frozen-soil processes. Vadose Zone J. 12 (4), vzj2013. doi:10.2136/vzj2013.03.0064
Henry, H. A. L. (2008). Climate change and soil freezing dynamics: Historical trends and projected changes. Clim. Change 87, 421–434. doi:10.1007/s10584-007-9322-8
Henry, H. A. L. (2007). Soil freeze-thaw cycle experiments: Trends, methodological weaknesses and suggested improvements. Soil Biol. Biochem. 39 (5), 977–986. doi:10.1016/j.soilbio.2006.11.017
Ingraham, P. A., and Salas, W. A. (2019). Assessing nitrous oxide and nitrate leaching mitigation potential in US corn crop systems using the DNDC model. Agric. Syst. 175, 79–87. doi:10.1016/j.agsy.2019.05.005
IPCC - Intergovernmental Panel on Climate Change (2021). Intergovernmental Panel on Climate Change. Cambridge: Cambridge University Press.
Ivarson, K. C., and Sowden, F. J. (1970). Effect of frost action and storage of soil at freezing temperatures on the free amino acids, free sugars, and respiratory activity of soil. Can. J. Soil Sci. 50, 191–198. doi:10.4141/cjss70-027
Jarecki, M. K., Parkin, T. B., Chan, A. S. K., Hatfield, J. L., and Jones, R. (2008). Greenhouse gas emissions from two soils receiving nitrogen fertilizer and swine manure slurry. J. Environ. Qual. 37, 1432–1438. doi:10.2134/jeq2007.0427
Jayasundara, S., Wagner-Riddle, C., Parkin, G., von Bertoldi, P., Warland, J., Kay, B. D., et al. (2007). Minimizing nitrogen losses from a corn-soybean-winter wheat rotation with best management practices. Nutr. Cycl. Agroecosyst. 79, 141–159. doi:10.1007/s10705-007-9103-9
Kasimir-Klemedtsson, Å., Klemedtsson, L., Berglund, K., Martikainen, P., Silvola, J., and Oenema, O. (1997). Greenhouse gas emissions from farmed organic soils: A review. Soil Use Manag. 13, 245–250. doi:10.1111/j.1475-2743.1997.tb00595.x
Kay, B. D., Fukuda, M., Izuta, H., and Sheppard, M. I. (1981). The importance of water migration in the measurement of the thermal conductivity of unsaturated frozen soils. Cold Regions Sci. Technol. 5 (2), 95–106. doi:10.1016/0165-232X(81)90044-6
Kieta, K. A., and Owens, P. N. (2019). Phosphorus release from shoots of Phleum pretense L. after repeated freeze-thaw cycles and harvests. Ecol. Eng. 127, 204–211. doi:10.1016/j.ecoleng.2018.11.024
King, E., Rezanezhad, F., and Wagner-Riddle, C. (2021). Evidence for microbial rather than aggregate origin of substrates fueling freeze-thaw induced N2O emissions. Soil Biol. Biochem. 160, 108352. doi:10.1016/j.soilbio.2021.108352
Kurylyk, B. L., and Watanabe, K. (2013). The mathematical representation of freezing and thawing processes in variably-saturated, non-deformable soils. Adv. Water Resour. 60, 160–177. doi:10.1016/j.advwatres.2013.07.016
Lapierre, J., Machado, P. V. F., Debruyn, Z., Brown, S. E., Jordan, S., Berg, A., et al. (2022). Cover crop mixtures: A powerful strategy to reduce post-harvest surplus of soil nitrate and leaching. Agric. Ecosyst. Environ. 325, 107750. doi:10.1016/j.agee.2021.107750
Li, Y., Clough, T. J., Moinet, G. Y. K., and Whitehead, D. (2021a). Emissions of nitrous oxide, dinitrogen and carbon dioxide from three soils amended with carbon substrates under varying soil matric potentials. Eur. J. Soil Sci. 72 (5), 2261–2275. doi:10.1111/ejss.13124
Li, Z., Tang, Z., Song, Z., Chen, W., Tian, D., Tang, S., et al. (2021b). Variations and controlling factors of soil denitrification rate. Glob. Change Biol. 28 (6), 2133–2145. doi:10.1111/gcb.16066
Lipson, D. A., Schmidt, S. K., and Monson, R. K. (1999). Links between microbial population dynamics and N availability in an alpine ecosystem. Ecology 80, 1623–1631. doi:10.1890/0012-9658(1999)080[1623:LBMPDA]2.0.CO;2
Matzner, E., and Borken, W. (2008). Do freeze-thaw events enhance C and N losses from soils of different ecosystems? Eur. J. Soil Sci. 59, 274–284. doi:10.1111/j.1365-2389.2007.00992.x
Natali, S. M., Watts, J. D., Rogers, B. M., Potter, S., Ludwig, S. M., Selbmann, A. K., et al. (2019). Large loss of CO2 in winter observed across the northern permafrost region. Nat. Clim. Chang. 9 (11), 852–857. doi:10.1038/s41558-019-0592-8
Nikrad, M. P., Kerkhof, L. J., and Häggblom, M. M. (2016). The subzero microbiome: Microbial activity in frozen and thawing soils. FEMS Microbiol. Ecol. 92 (6), fiw081. doi:10.1093/femsec/fiw081
Ontario Ministry of Agriculture, Food and Rural Affairs (2018). Northern Ontario agri-food strategy.
Osman, K. T. (2013). “Soils are composed of variously sized mineral particles,” in Soils: Principles, properties, and management (Springer), 50–52.
Rafat, A., Byun, E., Rezanezhad, F., Quinton, W. L., Humphreys, E. R., Webster, K., et al. (2022). The definition of the non-growing season matters: A case study of net ecosystem carbon exchange from a Canadian peatland. Environ. Res. Commun. 4, 021003. doi:10.1088/2515-7620/ac53c2
Risk, N., Snider, D., and Wagner-Riddle, C. (2013). Mechanisms leading to enhanced soil nitrous oxide fluxes induced by freeze-thaw cycles. Can. J. Soil Sci. 93, 401–414. doi:10.4141/cjss2012-071
Risk, N., Wagner-Riddle, C., Furon, A., Warland, J., and Blodau, C. (2014). Comparison of simultaneous soil profile N2O concentration and surface N2O flux measurements overwinter and at spring thaw in agricultural soil. Soil Biol. Biochem., 180–193. doi:10.2136/sssaj2013.06.0221
Ruan, L., and Robertson, G. P. (2017). Reduced snow cover increases wintertime nitrous oxide (N2O) emissions from an agricultural soil in the upper US Midwest. Ecosystems 20 (5), 917–927. doi:10.1007/s10021-016-0077-9
Ryan, M. C., Kachanoski, R. G., and Gillham, R. W. (2000). Overwinter soil nitrogen dynamics in seasonally frozen soils. Can. J. Soil Sci. 80, 541–550. doi:10.4141/S99-017
Schimel, J. P., Bilbrough, C., and Welker, J. A. (2004). Increased snow depth affects microbial activity and nitrogen mineralization in two Arctic tundra communities. Soil Biol. Biochem. 36, 217–227. doi:10.1016/j.soilbio.2003.09.008
Smith, K. A. (2017). Changing views of nitrous oxide emissions from agricultural soil: Key controlling processes and assessment at different spatial scales. Eur. J. Soil Sci. 68, 137–155. doi:10.1111/ejss.12409
Song, X., Ju, X., Topp, C. F. E., and Rees, R. M. (2019). Oxygen regulates nitrous oxide production directly in agricultural soils. Environ. Sci. Technol. 53, 12539–12547. doi:10.1021/acs.est.9b03089
Tatti, E., Goyer, C., Chantigny, M., Wertz, S., Zebarth, B. J., Burton, D. L., et al. (2014). Influences of over winter conditions on denitrification and nitrous oxide-producing microorganism abundance and structure in an agricultural soil amended with different nitrogen sources. Agric. Ecosyst. Environ. 183, 47–59. doi:10.1016/j.agee.2013.10.021
Tierney, G. L., Fahey, T. J., Groffman, P., Hardy, J. P., Fitzhugh, R. D., and Driscoll, C. T. (2001). Soil freezing alters fine root dynamics in a northern hardwood forest. Biogeochemistry 56, 175–190. doi:10.1023/A:1013072519889
Van Meter, K. J., Basu, N. B., Veenstra, J. J., and Burras, C. L. (2016). The nitrogen legacy: Emerging evidence of nitrogen accumulation in anthropogenic landscapes. Environ. Res. Lett. 11 (3), 035014. doi:10.1088/1748-9326/11/3/035014
Venterea, R. T., Clough, T. J., Coulter, J. A., Breuillin-Sessoms, F., Wang, P., and Sadowsky, M. J. (2015). Ammonium sorption and ammonia inhibition of nitrite-oxidizing bacteria explain contrasting soil N2O production. Sci. Rep. 5, 12153. doi:10.1038/srep12153
Wagner-Riddle, C., Congreves, K., Abalos, D., Berg, A. A., Brown, S. E., Ambadan, J. T., et al. (2017). Globally important nitrous oxide emissions from croplands induced by freeze-thaw cycles. Nat. Geosci. 10, 279–283. doi:10.1038/ngeo2907
Wagner-Riddle, C., Furon, A., Mclaughlin, N. L., Lee, I., Barbeau, J., Jayasundara, S., et al. (2007). Intensive measurement of nitrous oxide emissions from a corn-soybean-wheat rotation under two contrasting management systems over 5 years. Glob. Chang. Biol. 13 (8), 1722–1736. doi:10.1111/j.1365-2486.2007.01388.x
Wagner-Riddle, C., Thurtell, G. W., Kidd, G. E., Beauchamp, E. G., and Sweetman, R. (1997). Estimates of nitrous oxide emissions from agricultural fields over 28 months. Can. J. Soil Sci. 77, 135–144. doi:10.4141/S96-103
Yanai, Y., and Toyota, K. (2006). Effects of soil freeze-thaw cycles on microbial biomass and organic matter decomposition, nitrification and denitrification potential of soils. Sapporo: Hokkaido University Press, 177–192.
Zhang, T. (2005). Influence of the seasonal snow cover on the ground thermal regime: An overview. Rev. Geophys. 43, 1–23. doi:10.1029/2004RG000157
Keywords: winter soil processes, cold regions, freeze-thaw cycles, agricultural soils, nitrogen cycling
Citation: Green D, Rezanezhad F, Jordan S, Wagner-Riddle C, Henry HAL, Slowinski S and Van Cappellen P (2022) Effects of winter pulsed warming and snowmelt on soil nitrogen cycling in agricultural soils: A lysimeter study. Front. Environ. Sci. 10:1020099. doi: 10.3389/fenvs.2022.1020099
Received: 15 August 2022; Accepted: 27 September 2022;
Published: 12 October 2022.
Edited by:
Paul V. Doskey, Michigan Technological University, United StatesReviewed by:
Yuan Li, Lanzhou University, ChinaYang Li, Anhui University of Science and Technology, China
Copyright © 2022 Green, Rezanezhad, Jordan, Wagner-Riddle, Henry, Slowinski and Van Cappellen. This is an open-access article distributed under the terms of the Creative Commons Attribution License (CC BY). The use, distribution or reproduction in other forums is permitted, provided the original author(s) and the copyright owner(s) are credited and that the original publication in this journal is cited, in accordance with accepted academic practice. No use, distribution or reproduction is permitted which does not comply with these terms.
*Correspondence: Danielle Green, ZGNncmVlbkB1d2F0ZXJsb28uY2E=