 Jiangxun Huang1
 Qingguang Li
 Shilu Wang
 Yong Fu
- 1Key Laboratory of Karst Georesources and Environment, Ministry of Education, College of Resources and Environmental Engineering, Guizhou University, Guiyang, China
- 2State Key Laboratory of Environmental Geochemistry, Institute of Geochemistry, Chinese Academy of Sciences, Guiyang, China
In a karstic area affected by acid mine drainage (AMD), hydrochemical conditions, such as temperature, salinity, alkalinity, DIC, dissolved oxygen, and nutrients, may affect the buffering capacity of carbonate systems in freshwater systems. The resulting pH fluctuation is larger than that of a marine system. Therefore, this study focuses on the buffering of a riverine carbonate system under the input of AMD and discusses the variations in a series of buffering factors, including the Revelle factor, γDIC, γAlk βDIC, βAlk, ωDIC, and ωAlk. The results revealed that the Revelle factor could reflect the buffering process effectively; in addition, the maximum value of the Revelle factor appeared at pH = 8.5. The data points for pH greater than this value indicated that the Huatan River had the ability to absorb atmospheric CO2 in spring. Conversely, the data for pH less than this value reflected the buffering of H+ during CO2 degassing in summer and autumn. In winter, the data were around the maximum value, indicating the weakest buffering capacity. As a result, the dynamics of the carbonate system caused the most sensitive response to pH. In addition, the maximum Revelle factor value did not always indicate the carbonate system had reached equilibrium; the presence of strong CO2 degassing was still a possibility. Under acidic conditions, as CO2(aq) increased, the absolute values of γDIC, βDIC, ωDIC, and γAlk increased correspondingly, indicating the enhanced buffering capacity of H+ during CO2 degassing. Under the four Representative Concentration Pathways scenarios (RCPs) included in the IPCC’s fifth assessment report, the degassing rate of the Huatan River would decrease by 5%, 15%, 26%, or 48%, depending on the scenario. Even though the Huatan River revealed CO2 degassing characteristics in winter and spring under current conditions, it will eventually become a sink for atmospheric CO2 as atmospheric CO2 concentration increases. In this light, the carbon sink effect in karst areas will become increasingly important.
Introduction
Since the time of the Industrial Revolution, atmospheric CO2 concentration has increased significantly. The annual CO2 released by human activities has been estimated at ∼8.9 PgC (Regnier et al., 2013; Bianucci et al., 2018), and the marine system has absorbed ∼50% of the CO2 from anthropogenic sources, such as the combustion of fossil fuels, since the Industrial Revolution (Sabine et al., 2004; Thomas et al., 2007; Shaw et al., 2013). Due to the dynamic equilibrium of carbonate components in surface water, CO32− can offset the H+ produced during CO2 absorption and maintain the relative stability of water pH. While this process slows down the process of global warming, it also yields a series of chemical changes, such as increasing concentrations of CO2(aq), DIC, and H+ as well as decreasing calcite saturation and CO32− concentration in the marine system (Caldeira and Wickett, 2003; Omta et al., 2010). In the long run, as marine pH gradually decreases and DIC concentration increases, the pH of seawater will become more sensitive to biogeochemical processes.
This buffer process was first quantified by Revelle and Suess (1957), who defined the Revelle factor as (Eq. 1):
where TCO2 represents the total dissolved inorganic carbon (CO2+HCO3− + CO32-), pCO2 refers to the partial pressure of CO2 in the water, and ΔpCO2 and ΔTCO2 represent the change in the partial pressure of CO2 and DIC concentration, respectively, after CO2 absorption. Since the change in pCO2 is more sensitive than that of TCO2, the Revelle factor, which indicates the buffering capacity of water to the variation in CO2, is better able to reflect the dynamic transformation relationship of carbonate components in water. The Revelle factor reflects both the buffering capacity of weakly alkaline water fixing atmospheric CO2 and the buffering of H+ by CO2 outgassing during water acidification.
Sundquist et al. (1979) proposed a more accurate formula for calculating the buffering process (Eq. 2):
where aH+ is the hydrogen ion activity, TB is the total concentration of dissolved borate, and KB’ is the first apparent dissociation constant of boric acid.
In freshwater systems, the buffer factor can be further simplified if the effect of boric acid is omitted (Eq. 4):
As the Revelle factor increases, the buffering capacity of freshwater carbonate system weakens. It is generally believed that the Revelle factor in the ocean is about 10 on average, while the factor can vary between 8 and 50 in a karst freshwater system (Zhang et al., 2019; Wang and Li, 2021). In addition, scholars have also defined buffer factors, such as γDIC, βDIC, ωDIC, γAlk, βAlk, and ωAlk, which have mainly featured in discussions of the absorption of atmospheric CO2 by weakly alkaline water (Egleston et al., 2010; Hagens and Middelburg, 2016a). γDIC, βDIC, ωDIC, γAlk, βAlk, and ωAlk indicate the buffering of the water carbonate system against changes in H+, CO2, and CO32- concentrations when DIC or alkalinity is added. For example, βAlk indicates the resistance capacity to changes in hydrogen ion concentration (or activity) when alkalinity changes. Table 1 displays detailed formulas for calculating these parameters.
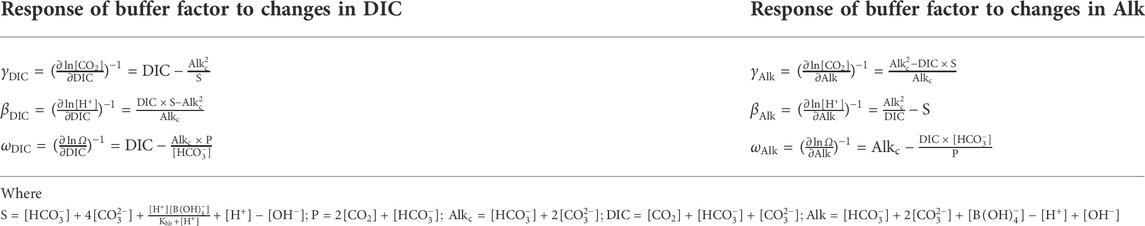
TABLE 1. Buffer factor calculation method (Egleston et al., 2010; Zhang et al., 2019).
In fact, surface freshwater is essential in DIC transport systems. Approximately 0.40–0.90 Pg of DIC is transmitted to the ocean through surface rivers every year (Probst et al., 1994; Battin et al., 2009; Cai, 2011; Shin et al., 2011; Quéré et al., 2018). CO2 emission at the water-gas interface in freshwater systems is about 1.8 Pg per year (Cole et al., 2007; Raymond et al., 2013; Wehrli, 2013; Borges et al., 2015). In areas where karst is widely developed, the absorption of CO2 by the weathering of carbonate rocks has become an intensely debated topic of concern. The global annual karst carbon sequestration is about 0.11–0.80 Pg C per year (Gombert, 2002; Liu et al., 2010; Liu et al., 2018). Thus, the fact that coal-bearing rock systems are generally well developed in the karst areas of Southwest China is a problem (Li S. L. et al., 2020; Xu et al., 2021). The mining of medium-to high-sulfur coal has caused serious surface water acidification issues, which in turn has complicated the evolution of DIC in surface freshwater systems in karst areas (Han and Liu, 2004; Li et al., 2008; Huang et al., 2017; Li et al., 2018; Jin et al., 2020). Compared to the marine system, more complex influencing factors may affect the buffer capacity of carbonate systems in freshwater systems in karst areas, and the pH fluctuation is much wider than that found in marine systems (Lueker et al., 2000; Sunda and Cai, 2012; Hagens and Middelburg, 2016b; Lan et al., 2017; Lauvset et al., 2020).
Therefore, this study explored the buffer effect of a carbonate system in surface freshwater on acid mine drainage (AMD) in karst medium- and high-sulfur coal mining areas. The study procedures entailed analyzing the Revelle factor and six other buffer factors, including γDIC, βDIC, ωDIC, γAlk, βAlk, and ωAlk, to further the understanding of DIC cycling and CO2 source-sink relationships in surface freshwater in karst watersheds.
Materials and methods
Overview of the study area
The Huatan River watershed is located in the eastern part of Jinsha County, Guizhou Province (Figure 1). The watershed covers an area of 321 km2, with a total river length of 59 km, a natural drop of 220 m, and an average runoff of 4 m3/s. The topography of the watershed, which is high in the southwest and low in the northeast, is dominated by hilly landforms. The Huatan River watershed belongs to a subtropical monsoon humid climate zone, with an annual average rainfall of 1,057 mm. Precipitation begins to increase in May every year, and the river flow subsequently increases. The rainy season is from June to September, leading to the highest river flow. The normal water period begins from October to December, and the dry season begins in March of the next year, which sees the lowest flow. The karst landforms are well developed in this area, and funnels, peak clusters, depressions, sinkholes, undercurrent, and natural bridges are common features.
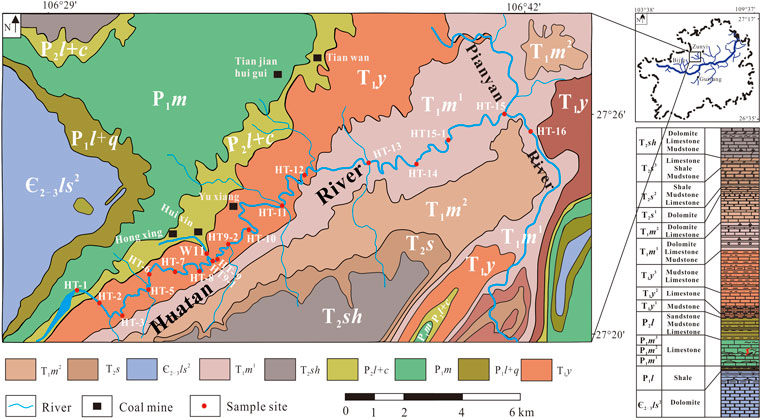
FIGURE 1. Distribution of stratigraphic outcrops and sampling points in the Huatan River watershed (after Huang et al. (2022)).
The strata exposed in the study area include Cambrian (Є), Permian (P), Triassic (T), and Quaternary (Q). The lithology is mainly carbonate rocks and clastic rocks, and the carbonate rocks primarily include the Permian Qixia Formation (P1q), Maokou Formation (P1m), Changxing Formation (P2c), Triassic Yelang Formation (T1y1), and YongningZhen Formation (T1yn). The Longtan Formation (P2l), a coal-bearing rock system, is about 95–110 m thick and contains 4–8 layers of coal. There are many coal mines in the watershed, such as the Huixin Coal Mine and Hongxing Coal Mine. Coal mining produces a large amount of AMD, with a pH as low as 2.3, which has a significant impact on the Huatan River (Li et al., 2018; Huang et al., 2022; Du et al., 2022).
Sample collection and analysis
In this study, 18 sampling sites were set up in the Huatan River, and samples were collected every month from November 2020 to November 2021. The variable parameters, such as temperature, pH, and dissolved oxygen (DO), were measured on-site with a YSI ProPlus multi-parameter water quality analyzer. Electrodes, such as pH, EC, and DO, were calibrated the night before sampling according to the manufacturer’s specifications. The alkalinity was titrated on-site using a Merck titration box (Item NO. 1.11109.0001). This parameter requires three parallel samples to be titrated continuously to ensure that the error rate of three titrations is within 0.05 mmol. The water samples were filtered on-site with a 0.45 μm filter membrane under positive pressure. For cation analysis, nitric acid was added to the aliquot to adjust the pH < 2.0. Meanwhile, for anion analysis, no reagent was added into the aliquots; all samples were sealed bubble-free and stored under refrigeration at 4°C. The supplementary materials offer more detail about the basic hydrochemical parameters.
The Revelle factor was calculated according to Eq. 4, and the results appear in Supplementary Table S1. The six buffer factors, γDIC, βDIC, ωDIC, γAlk, βAlk, and ωAlk, were calculated according to the equations listed in Table 1; in addition, the PHREEQC program was used to calculate the pCO2 and HCO3− concentrations and SIc values in the water.
Variation characteristics of the buffer factors
Revelle factor
Huang et al. (2022) and Li et al. (2022) reported that the pH in the Huatan River was lower in summer and autumn (8.1 on average) and higher in winter and spring (8.4 on average). We believed that the oxidation of pyrite on a watershed scale would promote the acidification of water in the rainy season and enhance the carbon cycle through carbonate weathering. In the study area, AMD flows into the Huatan River at sampling point W11. The annual pH at sampling point W11 ranged from 5.0 to 6.9. It was observed that the pH of sampling point HT9 was lower than that of HT9-1 during the whole sampling period. In our consideration, the decrease of pH was due to the supply of AMD.
The Revelle factor in the Huatan River ranged from 12.5 to 53.6 throughout the year, with an averaging 42.2. In general, the Revelle factor demonstrated significant seasonal variation, varying in an “M” pattern along the flow direction. At sampling point HT9, the value of this factor decreased significantly, which may be attributed to the inputs of AMD-influenced tributaries at this point. At the Huatan reservoir (HT1) and downstream sampling sites (HT15, HT16), the water was relatively deep. Consequently, the influence of aquatic ecological processes on the factor increased. At the remaining sampling points, the Revelle factor yielded higher values, reflecting the carbonate weathering background.
In fact, the Revelle factor can be translated into a function of pH (Eq. 5). For the carbonate system in pure water, the maximum Revelle value occurs at pH = 8.4; by comparison, for the marine system, due to the influence of boric acid and other factors, the DIC concentration is close to alkalinity (2.3 mM) at pH = 7.5 and shows the characteristics of co-evolution with alkalinity (Omta et al., 2010; Cai et al., 2011; Hagens and Middelburg, 2016a; Wang and Li, 2021) (Figure 2A). At this pH condition, the carbonate component in marine system is mainly HCO3−, with a small proportion of CO2(aq) and CO32-. Therefore, the Revelle factor reaches the maximum value, and the water exhibits the weakest ability to buffer H+ and absorb atmospheric CO2 (Hofmann et al., 2010). Since the pH of surface seawater is usually maintained within a narrow variation (8.33 ± 0.10), the marine system usually displays the ability to absorb atmospheric CO2, and the variation range of the Revelle factor is maintained in the range of 8.0–15.0 (Cai et al., 2011; Jiang et al., 2019; Lauvset et al., 2020).
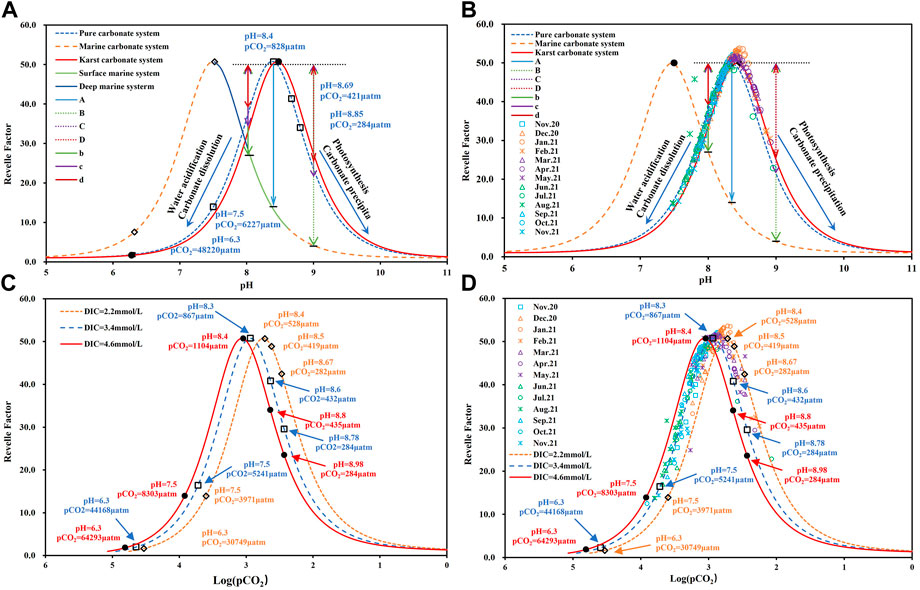
FIGURE 2. (A) Correlation between the Revelle factor and pH under different aqueous media conditions; (B) Relationship between the Revelle factor and pH in the Huatan River watershed; (C) Correlation between the Revelle factor and Log(pCO2) under different DIC concentration conditions; (D) Relationship between the Revelle factor and Log (pCO2) in the Huatan River watershed.
In terrestrial freshwater systems, especially in karst areas, factors affecting the buffer capacity of carbonate systems are more complex, and the variation in pH is much larger than that found in marine systems (Lauvset et al., 2015; Zhang et al., 2019). Moreover, the DIC concentration and alkalinity are also higher than those found in the ocean, and they often demonstrate non-linear evolution, resulting in a greater variation in the Revelle factor (Huang et al., 2022). Moreover, the process revealed by the data on both sides of the maximum Revelle value is inconsistent. The right side shows the ability to absorb atmospheric CO2, while the left side shows the buffer of CO2 degassing to H+. Near the maximum value, the dynamic transformation of the carbonate system causes a more sensitive response in pH (Hofmann et al., 2010).
In order to forecast the future climate, Intergovernmental Panel on Climate Change (2014) identified four greenhouse gas concentration scenarios. The different Representative Concentration Pathways (RCPs), from low to high, are RCP2.6, RCP4.5, RCP6.0, and RCP8.5. The figures following the RCP show that by 2,100, the radiation forcing level will be 2.6 W·m−2, 4.5 W·m−2, 6 W·m−2, and 8.5 W·m−2. An RCP represents an expectation that describes future greenhouse gas emissions in terms of pollution scenarios (Moss et al., 2010; Han et al., 2019). Under different scenarios, there are significant differences in the source sink relationship of greenhouse gases at the water-air interface.
Figure 2C reveals the relative changes in the Revelle factor versus Log (pCO2) at DIC of 2.2 and 4.6 mM, representing the average concentrations of DIC in the ocean and the freshwater in the study area, respectively. Under the IPCC RCP2.6, RCP4.5, RCP6.0, and RCP8.5 scenarios, the global atmospheric concentrations will reach 420 ppm, 538 ppm, 670 ppm, and 936 ppm, respectively, by 2,100 (Gattuso et al., 2015; Țăranu, 2016; Wei et al., 2018; Li et al., 2020). Obviously, the dynamics of CO2 at the water-gas interface vary significantly in the different RCP scenarios. Even a constant, maximum Revelle factor value does not always indicate equilibrium of the water carbonate system, and CO2 degassing may still be significant.
According to Eq. 4, the Revelle factor reflects the variation in the relative proportion of DIC and CO2+CO32- and cannot be indicative of the CO2 transport at the water-air interface under different DIC concentrations. In Figure 3, the synergistic evolution relationship of the Revelle factor, pH, and Log (pCO2) can clearly reveal the dynamic buffer process of the water carbonate system, thus effectively avoiding the limitation caused by only analyzing the Revelle factor. According to the data in Figure 3, the maximum Revelle factor values are not fixed and fluctuate significantly along with the rise and fall of pCO2 in the water. In the marine system, the variation in pH is narrower, and the value of the Revelle factor appear only on the right side of the peak. By comparison, within the freshwater system, the data related to the Revelle factor are distributed on both sides of the peak, and the variation is larger. Therefore, the interpretation of the Revelle factor data within the terrestrial freshwater system must be carefully combined with the variation in pH and pCO2 for a comprehensive analysis.
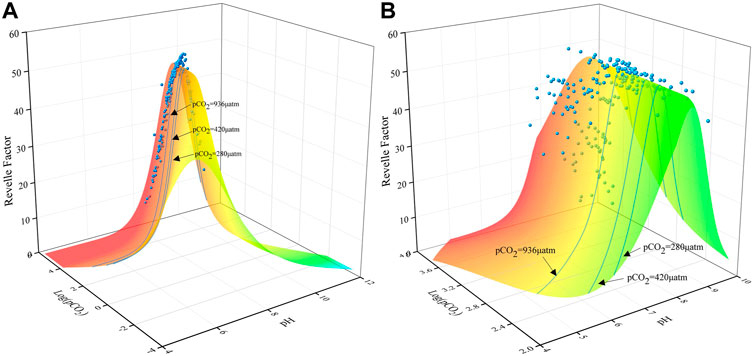
FIGURE 3. Three-dimensional relationship among the Revelle factor, pH, and Log (pCO2) for given ranges of pH (4–12) and Log (pCO2) (−4 ∼ 6). The three light-blue lines represent atmospheric CO2 concentrations (280 μatm, 420 μatm, and 936 μatm) under different RCP scenarios. The blue dots represent the distribution of sampling sites in the Huatan River over 13 months. Most of the data points are located in the interval of pH < 8.4 and Log (pCO2)>3.04, indicating the buffering of H+ by CO2 degassing, while the data points in the range of pH > 8.4 and Log (pCO2)<3.04 reflect the uptake of atmospheric CO2. The distribution of the data points in the Huatan River is mainly in the range of Log (pCO2) between 2 and 4. As a result, (B) is an enlarged version of part of the area in (A).
γDIC, βDIC, ωDIC, γAlk, βAlk, and ωAlk
Table 1 shows that γDIC, βDIC, ωDIC, γAlk, βAlk, and ωAlk are all binary equations concerning pH and DIC concentration. For both the marine system and the terrestrial freshwater system, the variation in these six parameters is less than 1.0. Figure 4 illustrates the correlation between these six parameters and pH under the condition of average DIC concentration in surface seawater (2.2 mM). For βDIC, γDIC, ωDIC, and γAlk within the watershed system affected by AMD, the variation in these four parameters widens during water acidification and CO2 degassing.
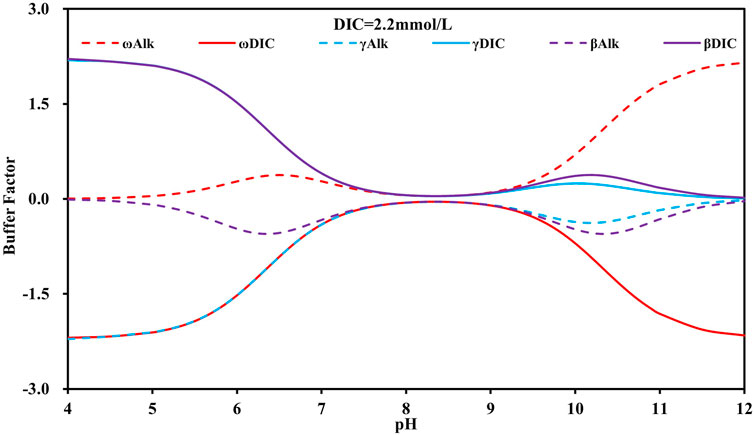
FIGURE 4. Characteristics of buffer factors (βDIC, βAlk, γDIC, γAlk, ωDIC, ωAlk) relative to pH in the surface seawater system.
Interestingly, the βDIC and γDIC curves overlap under acidic conditions, while the ωDIC and γAlk curves also overlap (Figure 4). An explanation for this result is that CO32- is negligible under acidic conditions; the expression equations of βDIC and γDIC can be simplified to Eq. 6, while the expression equations of ωDIC and γAlk can be simplified to Eq. 7. There is only a slight difference between these two sets of parameters. Moreover, βAlk and ωAlk are similarly opposite to each other (Eqs. 8, 9). Under acidic conditions, DIC comprises mainly HCO3− and CO2, which are mutually related. At pH = 6.4, the extreme values of βAlk and ωAlk appear, and HCO3− and CO2 each account for half of the DIC.
Under alkaline conditions, the six parameters can be summarized as three sets of mutually signed equations for γDIC vs. γAlk, βDIC vs. βAlk, and ωDIC vs. ωAlk. Among these, ωDIC vs. ωAlk has a larger variation interval. ωDIC, ωAlk, βDIC, and βAlk demonstrate extreme values at pH = 10.3, where HCO3− and CO32- each account for half of the DIC. However, pH rarely exceeds 10 under natural water conditions.
The buffer effect of the carbonate system was further revealed by establishing a three-dimensional plot of buffer factor versus pH and Log (pCO2), which appears in Supplementary Figure S3. Supplementary Figure S4 displays a three-dimensional plot of the buffer factor versus pH and DIC. Within the given pH (4–12) and Log (pCO2) (−4∼+6), there are obvious differences in the distribution patterns of the six buffer factors for γDIC, βDIC, ωDIC, γAlk, βAlk, and ωAlk. Because various explanations are possible, a comprehensive analysis of parameters such as pH and pCO2 is necessary when discussing the buffering effect of a terrestrial freshwater system. Simply discussing the buffering factors may lead to implausible inferences.
According to Supplementary Figure S3, the extreme values of the buffer factors did not mean that the buffer effect of the carbonate system in the water body was in equilibrium. It is also obvious that γDIC, βDIC, ωDIC, and γAlk had large variation intervals and were more sensitive to the change in pCO2 under acidic conditions. Of the factors under consideration, ωDIC was the only one of the six factors that was sensitive to changes in a large pH range (4–12). In fact, under natural conditions, the six buffer factors only spread in a limited distribution interval, as shown in Supplementary Figures S3, S4, and the peaks in alkaline conditions do not have much practical significance.
Buffer processes in the Huatan River watershed
The Huatan River is a typical karst watershed influenced by AMD (Huang et al., 2022). The DIC concentration in this watershed has a relatively large variation (1.69–4.53 mM), with a mean value of 3.44 mM, which is significantly higher than that in the Wujiang River downstream as well as the marine system (Makkaveev, 2013; Zhong et al., 2017). Under the influence of AMD, the pH varies from 6.8 to 8.9, and ∆pH reaches 2.1 units. According to Huang et al. (2022), the study area is subject to strong CO2 degassing from upstream to downstream. Taking the data from October 2021 as an example, the variation in the Revelle factor in the Huatan River watershed ranged from 12.5 to 48 (Supplementary Table S1). From sampling point HT01 to HT14, the CO2 degassing process resulted in a 0.77 unit increase in pH and a 0.3 mM loss of dissolved CO2. Therefore, the buffer effect of the water carbonate system exerts an essential influence in terms of maintaining the stability of water pH in the watershed.
Buffer processes indicated by the Revelle factor
The variation in the Revelle factor in the Huatan River watershed ranged from 12.5 to 53.6, with an average value as high as 42.2, revealing a significantly lower buffer capacity than the marine system (Hagens et al., 2015; Hagens and Middelburg, 2016a). This finding was also lower than that of the Guijiang River watershed in Guangxi, China, which has a similar karst geological background (Zhang et al., 2019). As shown in Figure 2B, the Revelle factor in the Huatan River watershed demonstrated obvious seasonal variation characteristics. The data points in winter are basically near the peak in the figure, indicating that the carbonate system in the watershed might have basically reached equilibrium at this time, and the kinetic transformation of DIC was relatively weak. In spring, the data points are basically located in the right interval of the peak in the figure. Along with the increase in pH, the concentration of CO32- in the water gradually increased, indicating an ability to absorb atmospheric CO2 and promote CaCO3 precipitation. In summer and autumn, the pH in the watershed decreases under the influence of AMD recharge (Huang et al., 2022; Li et al., 2022). As a reslut, the Revelle factor was mainly distributed in the left interval of the peak, showing strong CO2 degassing characteristics and the ability to dissolve limestone.
However, according to Figure 2D, although the Huatan River yielded higher Revelle factor values in winter, pCO2 still displayed obvious CO2 degassing characteristics during that season. This finding suggests that the carbonate system in the watershed had not reached equilibrium, which might have been related to strong hydrodynamic conditions and high DIC concentrations (Pu et al., 2017). Moreover, in October 2021, the DIC concentration decreased by 1.69 mM from HT01 to HT16 sampling sites; while, the Revelle factor increased by only 9.4, pH increased by only 0.3 units, and only 0.08 mM of dissolved CO2 was lost. These values suggest that the transport and evolution of DIC in terrestrial freshwater systems is more complex, and the dynamic equilibrium of the water carbonate system is controlled by a variety of factors. Hence, an analysis of the Revelle factor alone may be insufficient to draw any firm conclusions.
Buffer processes indicated by γDIC, βDIC, ωDIC, γAlk, βAlk and ωAlk
To further reveal the CO2 degassing and buffering process of the carbonate system in the Huatan River watershed under the influence of AMD, we analyzed the correlation between the six buffer factors (γDIC, βDIC, ωDIC, γAlk, βAlk, and ωAlk) and Log (pCO2) and pH (Figure 5 and Supplementary Figure S1). Given that the pH in the Huatan River watershed ranged from 6.8 to 8.9, the absolute values of the six buffer factors did not differ much, but they were still able to reflect the dynamic transformation processes of the carbonate system in the water near the extreme values. As shown in Figure 5, the Huatan River watershed demonstrated strong degassing characteristics in summer and autumn on the whole. In autumn and winter, the absolute values of the six buffer factors were all less than 0.10. The change was even small, suggesting that the water body had a weak buffer capacity during the autumn and winter, the CO2 transmission at the water-air interface was basically in equilibrium, and the dynamics of DIC in the river were very weak.
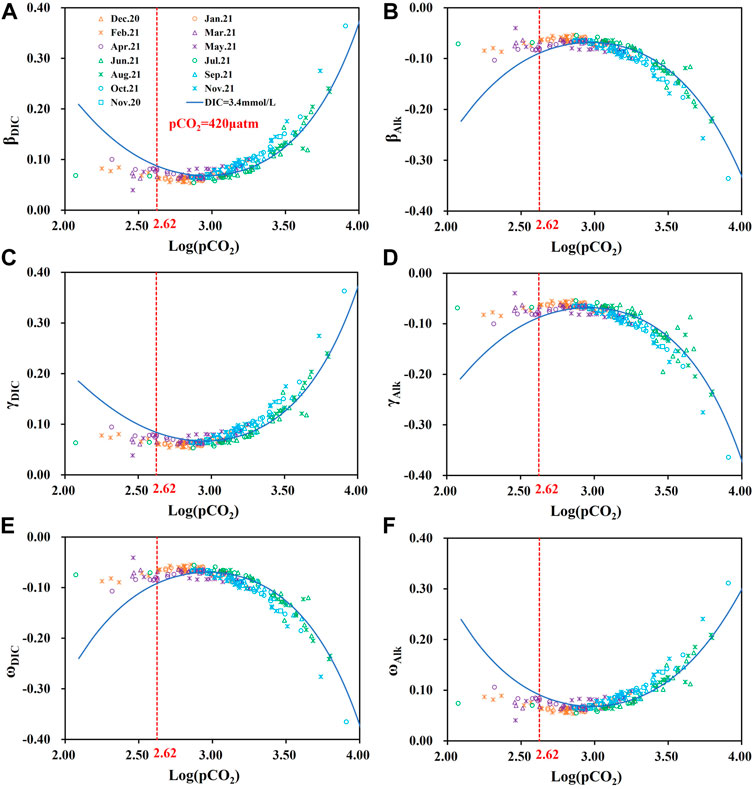
FIGURE 5. (A) Correlation between βDIC and Log(pCO2); (B) Correlation between βAlk and Log(pCO2); (C) Correlation between γDIC and Log(pCO2); (D) Correlation between γAlk and Log(pCO2); (E) Correlation between ωDIC and Log(pCO2); (F) Correlation between ωAlk and Log(pCO2) response in the Huatan River watershed.
Figure 6 shows the correlation between ωDIC and different DIC fractions. The response of ωDIC to DIC concentration is not very obvious, while the effect of pH to ωDIC is more visible. This difference may be due to the buffer factors being affected by a combination of conditions, such as temperature, salinity, alkalinity, DIC, and pH. The increase in dissolved CO2 concentration was an critical driver of the increase in the absolute value of ωDIC. This process was accompanied by water acidification and significant CO2 degassing, which resulted in a buffer effect on H+. When the CO32- concentration >0.03mM, an increase in the concentration of CO32- had a limited effect on ωDIC (Figure 6C).
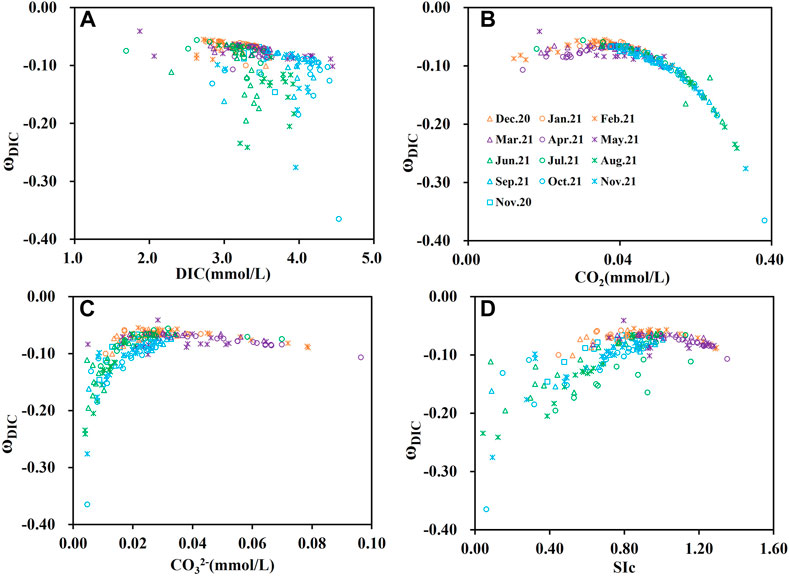
FIGURE 6. (A) Correlation between ωDIC and DIC concentration; (B) Correlation between ωDIC and CO2; (C) Correlation between ωDIC and CO32−; (D) Correlation between ωDIC and calcite saturation (SIc) in the Huatan River watershed.
The saturation index of calcium carbonate (SIc) is a vital indicator of the equilibrium state of the carbonate system in water. When the aqueous carbonate is in a supersaturated state, the response of the buffer factor is not obvious in conjunction with the increase of supersaturation degree. This phenomenon indicates that the water carbonate system is not very efficient in absorbing atmospheric CO2. When calcium carbonate is unsaturated, the response of the buffer factor becomes more sensitive as the degree of unsaturation increases, reflecting the buffer of H+ by the CO2 degassing process, which is beneficial in maintaining the stability of water pH.
Characteristics of buffer processes in the Huatan River watershed under different RCP scenarios
According to the four RCP scenarios included in the IPCC’s fifth assessment report (RCP2.6, RCP4.5, RCP6.0, and RCP8.5), atmospheric CO2 concentrations are likely to reach 420 ppm, 538 ppm, 670 ppm, and 936 ppm by 2,100 (Meinshausen et al., 2011; IPCC 2013). As Figure 2D shows, the pCO2 in the Huatan River generally exceeded 1,000 μatm in summer and autumn, indicating a strong CO2 degassing process under the different RCP scenarios, but the degassing rate would be obviously different. Therefore, we made a rough calculation of the variation in the degassing rate under the four RCP scenarios. In this calculation, we did not consider the temperature changes under the different scenarios. The results revealed that the degassing rate of the Huatan River watershed would decrease by 5.0%, 14.7%, 25.6%, or 47.7%, depending on the scenario. Obviously, climate change will have a significant impact on the karst process.
Conversely, the water body in the Huatan River watershed could be anticipated to increase the background of increasing atmospheric CO2 concentration and global climate change, the carbon sink effect of karstification in limestone outcropping areas will become increasingly important.
Conclusion
1) The Revelle factor did not reflect the CO2 transport process at the water-gas interface accurately under different DIC concentration conditions. In the marine system, the pH variation is small, and the value of the Revelle factor appears only when pH > 8.5. Contrariwise, within the freshwater system examined in this study, the data for the Revelle factor were distributed on both sides of the peak and revealed a much larger variation. Therefore, the interpretation of the Revelle factor within the terrestrial freshwater system must be carefully combined with the variations in pH and pCO2 for a comprehensive analysis.
2) Within the given pH and Log (pCO2) ranges, there were obvious differences in the distribution patterns of γDIC, βDIC, ωDIC, γAlk, βAlk, and ωAlk. Under natural conditions, the six buffer factors were only spread within a limited distribution interval. Under acidic conditions, γDIC, βDIC, ωDIC, and γAlk had a large variation and were sensitive to changes in pCO2. The extreme value of buffer factors did not always mean that the buffer effect of the carbonate system in water reached equilibrium.
3) The increase in CO2(aq) concentration was a crucial driving factor for the increase in the absolute value of ωDIC in the Huatan River, and this process was accompanied by water acidification and significant CO2 degassing. This process had a buffer effect on H+ and helped maintain the stability of water pH. In addition, an increase in the concentration of CO32- had a limited effect on ωDIC.
4) Under the four scenarios for RCP, the degassing rate in the Huatan River would decrease by 5.0%, 15%, 26%, or 48%, depending on the scenario. Even if this phenomenon manifests as a source of atmospheric CO2 in winter and spring under current conditions, it will eventually change, becoming a sink for atmospheric CO2 as atmospheric CO2 concentration increases. Therefore, against the background of increasing atmospheric CO2 concentration and global climate change, the carbon sink effect of karstification in limestone outcropping areas will become increasingly significant.
Data availability statement
The original contributions presented in the study are included in the article/Supplementary Material, further inquiries can be directed to the corresponding author.
Author contributions
JH collected the data performed the analysis wrote the paper. QL conceived and designed the analysis collected the data performed the analysis wrote the paper manuscript correction. PW conceived and designed the analysis performed the analysis. SW conceived and designed the analysis. SG manuscript correction. MG experimental tests. YF manuscript correction.
Funding
This study was sponsored by the National Natural Science Foundation of China (Nos. 41867050, 42267033, U1612442), the National Key Research and Development Plan of China (No.2019YFC1805300), Guizhou Provincial Science and Technology Foundation (No.(2019)1096), Guizhou Province Talent Base Project (No. RCJD 2018-21), First-class Discipline Construction Project of Guizhou Province (No. GNYL (2017) 007).
Conflict of interest
The authors declare that the research was conducted in the absence of any commercial or financial relationships that could be construed as a potential conflict of interest.
The handling editor JW declared a shared affiliation with the authors SW and MG at the time of review.
Publisher’s note
All claims expressed in this article are solely those of the authors and do not necessarily represent those of their affiliated organizations, or those of the publisher, the editors and the reviewers. Any product that may be evaluated in this article, or claim that may be made by its manufacturer, is not guaranteed or endorsed by the publisher.
Supplementary material
The Supplementary Material for this article can be found online at: https://www.frontiersin.org/articles/10.3389/fenvs.2022.1020452/full#supplementary-material
References
Battin, T. J., Luyssaert, S., Kaplan, L. A., Aufdenkampe, A. K., Richter, A., and Tranvik, L. A. (2009). The boundless carbon cycle. Nat. Geosci. 2, 598–600. doi:10.1038/ngeo618
Bianucci, L., Long, W., Khangaonkar, T., Pelletier, G., Ahmed, A., Mohamedali, T., et al. (2018). Sensitivity of the regional ocean acidification and carbonate system in Puget Sound to ocean and freshwater inputs. Elem. Sci. Anthropocene 6, 22. doi:10.1525/elementa.151
Borges, A. V., Darchambeau, F., Teodoru, C. R., Marwick, T. R., Tamooh, F., Geeraert, N., et al. (2015). Globally significant greenhouse-gas emissions from African inland waters. Nat. Geosci. 8, 637–642. doi:10.1038/ngeo2486
Cai, W. J., Hu, X. P., Huang, W. J., Murrell, M. C., Lehrter, J. C., Lohrenz, S. E., et al. (2011). Acidification of subsurface coastal waters enhanced by eutrophication. Nat. Geosci. 4, 766–770. doi:10.1038/ngeo1297
Cai, W. J. (2011). Estuarine and Coastal Ocean carbon paradox: CO2 sinks or sites of terrestrial carbon incineration? Ann. Rev. Mar. Sci. 3, 123–145. doi:10.1146/annurev-marine-120709-142723
Caldeira, K., and Wickett, M. E. (2003). Anthropogenic carbon and ocean pH. Nature 425, 365. doi:10.1038/425365a
Cole, J. J., Prairie, Y. T., Caraco, N. F., McDowell, W. H., Tranvik, L. J., Striegl, R. G., et al. (2007). Plumbing the global carbon cycle: integrating inland waters into the terrestrial carbon budget. Ecosystems 10, 172–185. doi:10.1007/s10021-006-9013-8
Du, S. X., An, L., Huang, J. X., Li, Q. G., Wu, P., Guo, X. Q., et al. (2022). Sources and migration characteristics of fluorine in the river water of a small karst watershed influenced by coal mining. Front. Environ. Sci. 10, 97928. doi:10.3389/fenvs.2022.979286
Egleston, E. S., Sabine, C. L., and François, M. M. M. (2010). Revelle revisited: Buffer factors that quantify the response of ocean chemistry to changes in DIC and alkalinity. Glob. Biogeochem. Cycles 24 (1), GB1002. doi:10.1029/2008gb003407
Gattuso, J. P., Magnan, A., Bille, R., Cheung, W. W. L., Howes, E. L., Joos, F., et al. (2015). Contrasting futures for ocean and society from different anthropogenic CO2 emissions scenarios. Science 349, aac4722. doi:10.1126/science.aac4722
Gombert, P. (2002). Role of karstic dissolution in global carbon cycle. Glob. Planet. Change 33, 177–184. doi:10.1016/s0921-8181(02)00069-3
Hagens, M., and Middelburg, J. J. (2016a). Generalised expressions for the response of pH to changes in ocean chemistry. Geochim. Cosmochim. Acta 187, 334–349. doi:10.1016/j.gca.2016.04.012
Hagens, M., and Middelburg, J. J. (2016b). Attributing seasonal pH variability in surface ocean waters to governing factors. Geophys. Res. Lett. 43, 12528–12537. doi:10.1002/2016GL071719
Hagens, M., Slomp, C. P., Meysman, F. J. R., Seitaj, D., Harlay, J., Borges, A. V., et al. (2015). Biogeochemical processes and buffering capacity concurrently affect acidification in a seasonally hypoxic coastal marine basin. Biogeosciences 12, 1561–1583. doi:10.5194/bg-12-1561-2015
Han, G. L., and Liu, C. Q. (2004). Water geochemistry controlled by carbonate dissolution: a study of the river waters draining karst-dominated terrain, Guizhou Province, China. Chem. Geol. 204, 1–21. doi:10.1016/j.chemgeo.2003.09.009
Han, P. F., Lin, X. H., Zhang, W., Wang, G. C., and Wang, Y. N. (2019). Projected changes of alpine grassland carbon dynamics in response to climate change and elevated CO2 concentrations under Representative Concentration Pathways (RCP) scenarios. PLOS ONE 14, e0215261. doi:10.1371/journal.pone.0215261
Hofmann, A. F., Middelburg, J. J., Soetaert, K., Wolf-Gladrow, D. A., and Meysman, F. J. R. (2010). Proton cycling, buffering, and reaction stoichiometry in natural waters. Mar. Chem. 121, 246–255. doi:10.1016/j.marchem.2010.05.004
Huang, Q. B., Qin, X. Q., Liu, P. Y., Zhang, L. K., and Su, C. T. (2017). Impact of sulfuric and nitric acids on carbonate dissolution, and the associated deficit of CO2 uptake in the upper–middle reaches of the Wujiang River, China. J. Contam. Hydrol. 203, 18–27. doi:10.1016/j.jconhyd.2017.05.006
Huang, J. X., Li, Q. G., Wu, P., Wang, S. L., Guo, M. W., and Liu, K. (2022). The effects of weathering of coal-bearing stratum on the transport and transformation of DIC in karst watershed. Sci. total Environ. 838, 156436. accepted. doi:10.1016/j.scitotenv.2022.156436
Intergovernmental Panel on Climate Change (2014). Climate change 2013 - the physical science basis. Cambridge: Cambridge University Press. doi:10.1017/CBO9781107415324
Jiang, L. Q., Carter, B. R., Feely, R. A., Lauvset, S. K., and Olsen, A. (2019). Surface ocean pH and buffer capacity: Past, present and future. Sci. Rep. 9, 18624. doi:10.1038/s41598-019-55039-4
Jin, Z. X., Wang, J. F., Chen, J. G., Zhang, R. X., Li, Y., Lu, Y. T., et al. (2020). Identifying the sources of nitrate in a small watershed using δ15N-δ18O isotopes of nitrate in the Kelan Reservoir, Guangxi, China. Agric. Ecosyst. Environ. 297, 106936. doi:10.1016/j.agee.2020.106936
Lan, C., Chen, J. G., Wang, J. F., Guo, J. Y., Yu, J., Yu, P. P., et al. (2017). Application of circular bubble Plume Diffusers to Restore water quality in a sub-deep reservoir. Int. J. Environ. Res. Public Health 14, 1298. doi:10.3390/ijerph14111298
Lauvset, S. K., Gruber, N., Landschützer, P., Olsen, A., and Tjiputra, J. (2015). Trends and drivers in global surface ocean pH over the past 3 decades. Biogeosciences 12, 1285–1298. doi:10.5194/bg-12-1285-2015
Lauvset, S. K., Carter, B. R., Perez, F. F., Jiang, L. Q., Feely, R. A., Velo, A., et al. (2020). Processes driving global interior ocean pH distribution. Glob. Biogeochem. Cycles 34. doi:10.1029/2019gb006229
Li, A. N., Wang, J. W., Wang, R. L., Yang, H., Yang, W., Yang, C. P., et al. (2020). MaxEnt modeling to predict current and future distributions of Batocera lineolata (Coleoptera: Cerambycidae) under climate change in China. Ecoscience 27, 23–31. doi:10.1080/11956860.2019.1673604
Li, S. L., Calmels, D., Han, G. L., Gaillardet, J., and Liu, C. Q. (2008). Sulfuric acid as an agent of carbonate weathering constrained by δ13CDIC: Examples from Southwest China. Earth Planet. Sci. Lett. 270, 189–199. doi:10.1016/j.epsl.2008.02.039
Li, Q. G., Wu, P., Li, X. X., Gu, S. Y., Zhang, R. X., Zha, X. F., et al. (2022). The effect of mining development in karst areas on water acidification and fluorine enrichment in surface watersheds. Ecotoxicol. Environ. Saf. 242, 113954. doi:10.1016/j.ecoenv.2022.113954
Li, Q. G., Wu, P., Zha, X. F., Li, X. X., Wu, L. N., and Gu, S. Y. (2018). Effects of mining activities on evolution of water chemistry in coal-bearing aquifers in karst region of midwestern Guizhou, China: Evidences from δ13C of dissolved inorganic carbon and δ34S of sulfate. Environ. Sci. Pollut. Res. Int. 25, 18038–18048. doi:10.1007/s11356-018-1969-3
Li, S. L., Xu, S., Wang, T. J., Yue, F. J., Peng, T., Zhong, J., et al. (2020). Effects of agricultural activities coupled with karst structures on riverine biogeochemical cycles and environmental quality in the karst region. Agric. Ecosyst. Environ. 303, 107120. doi:10.1016/j.agee.2020.107120
Liu, Z. H., Dreybrodt, W., and Wang, H. J. (2010). A new direction in effective accounting for the atmospheric CO2 budget: Considering the combined action of carbonate dissolution, the global water cycle and photosynthetic uptake of DIC by aquatic organisms. Earth. Sci. Rev. 99, 162–172. doi:10.1016/j.earscirev.2010.03.001
Liu, Z. H., Macpherson, G. L., Groves, C., Martin, J. B., Yuan, D. X., and Zeng, S. B. (2018). Large and active CO2 uptake by coupled carbonate weathering. Earth-Science Rev. 182, 42–49. doi:10.1016/j.earscirev.2018.05.007
Lueker, T. J., Dickson, A. G., and Keeling, C. D. (2000). Ocean pCO2 calculated from dissolved inorganic carbon, alkalinity, and equations for K1 and K2: validation based on laboratory measurements of CO2 in gas and seawater at equilibrium. Mar. Chem. 70, 105–119. doi:10.1016/s0304-4203(00)00022-0
Makkaveev, P. N. (2013). Dissolved inorganic carbon in the ocean and climate. Water Resour. 40, 677–683. doi:10.1134/s0097807813070075
Meinshausen, M., Smith, S. J., Calvin, K., Daniel, J. S., Kainuma, M. L. T., Lamarque, J. F., et al. (2011). The RCP greenhouse gas concentrations and their extensions from 1765 to 2300. Clim. Change 109, 213–241. doi:10.1007/s10584-011-0156-z
Moss, R. H., Edmonds, J. A., Hibbard, K. A., Manning, M. R., Rose, S. K., van Vuuren, D. P., et al. (2010). The next generation of scenarios for climate change research and assessment. Nature 463, 747–756. doi:10.1038/nature08823
Omta, A. W., Goodwin, P., and Follows, M. J. (2010). Multiple regimes of air-sea carbon partitioning identified from constant-alkalinity buffer factors. Glob. Biogeochem. Cycles 24, GB3008. doi:10.1029/2009GB003726
Probst, J. L., Mortatti, J., and Tardy, Y. (1994). Carbon river fluxes and weathering CO2 consumption in the Congo and Amazon river basins. Appl. Geochem. 9, 1–13. doi:10.1016/0883-2927(94)90047-7
Pu, J. B., Li, J. H., Khadka, M. B., Martin, J. B., Zhang, T., Yu, S., et al. (2017). In-stream metabolism and atmospheric carbon sequestration in a groundwater-fed karst stream. Sci. Total Environ. 579, 1343–1355. doi:10.1016/j.scitotenv.2016.11.132
Quéré, O. L., Andrew, R. M., Friedlingstein, P., Sitch, S., Pongratz, J., Manning, A. C., et al. (2018). Global carbon budget 2017. Earth Syst. Sci. Data 10, 405–448. doi:10.5194/essd-10-405-2018
Raymond, P. A., Hartmann, J., Lauerwald, R., Sobek, S., McDonald, C., Hoover, M., et al. (2013). Global carbon dioxide emissions from inland waters. Nature 503, 355–359. doi:10.1038/nature12760
Regnier, P., Friedlingstein, P., Ciais, P., Mackenzie, F. T., Gruber, N., Janssens, I. V., et al. (2013). Anthropogenic perturbation of the carbon fluxes from land to ocean. Nat. Geosci. 6, 597–607. doi:10.1038/ngeo1830
Revelle, R., and Suess, H. E. (1957). Carbon dioxide exchange between atmosphere and ocean and the question of an increase of atmospheric CO2 during the past decades. Tellus 9, 18–27. doi:10.1111/j.2153-3490.1957.tb01849.x
Sabine, C. L., Feely, R. A., Gruber, N., Key, R. M., Lee, K., Bullister, J. L., et al. (2004). The Oceanic sink for anthropogenic CO2. Science 305, 367–371. doi:10.1126/science.1097403
Shaw, E. C., McNeil, B. I., Tilbrook, B., Matear, R., and Bates, M. L. (2013). Anthropogenic changes to seawater buffer capacity combined with natural reef metabolism induce extreme future coral reef CO2 conditions. Glob. Chang. Biol. 19, 1632–1641. doi:10.1111/gcb.12154
Shin, W. J., Chung, G. S., Lee, D., and Lee, K. S. (2011). Dissolved inorganic carbon export from carbonate and silicate catchments estimated from carbonate chemistry and δ13CDIC. Hydrol. Earth Syst. Sci. 15, 2551–2560. doi:10.5194/hess-15-2551-2011
Sunda, W. G., and Cai, W. J. (2012). Eutrophication induced CO2-acidification of subsurface coastal waters: Interactive effects of temperature, salinity, and atmospheric pCO2. Environ. Sci. Technol. 46, 10651–10659. doi:10.1021/es300626f
Sundquist, E. T., Plummer, L. N., and Wigley, T. M. (1979). Carbon dioxide in the Ocean surface: The homogeneous buffer factor. Science 204, 1203–1205. doi:10.1126/science.204.4398.1203
Țăranu, L. (2016). Projections of changes in productivity of major agricultural crops in the Republic of Moldova according to CMIP5 ensemble of 21 GCMs for RCP2.6, RCP4.5 and RCP8.5 scenarios. Sci. Pap. Ser. A. Agron. 59, 431–440.
Thomas, H., Prowe, A. E. F., Heuven, S. V., Bozec, Y., Baar, H. J. W. D., Schiettecatte, L. S., et al. (2007). Rapid decline of the CO2 buffering capacity in the north Sea and implications for the north atlantic Ocean. Glob. Biogeochem. Cycles 21, B4001-1–B4001-13. doi:10.1029/2006GB002825
Wang, W. Y., and Li, Q. G. (2021). The buffering effect of chemical equilibrium of CaCO3--CO32--HCO3--CO2 on CO2 in freshwater carbonate lake—a case study from Baihua Lake, Guizhou. Carsologica Sin. 40, 572–579. doi:10.11932/karst2021y05
Wei, B., Wang, R. L., Hou, K., Wang, X. Y., and Wu, W. (2018). Predicting the current and future cultivation regions of Carthamus tinctorius L. using MaxEnt model under climate change in China. Glob. Ecol. Conserv. 16, e00477. doi:10.1016/j.gecco.2018.e00477
Xu, S., Li, S. L., Su, J., Yue, F. J., Zhong, J., and Chen, S. (2021). Oxidation of pyrite and reducing nitrogen fertilizer enhanced the carbon cycle by driving terrestrial chemical weathering. Sci. Total Environ. 768, 144343. doi:10.1016/j.scitotenv.2020.144343
Zhang, T., Li, J. H., Pu, J. B., and Yuan, D. X. (2019). Carbon dioxide exchanges and their controlling factors in Guijiang River, SW China. J. Hydrol. 578, 124073. doi:10.1016/j.jhydrol.2019.124073
Keywords: karstification, Revelle factor, chemical equilibrium of carbonate, buffer mechanism, CO2 degassing, AMD input
Citation: Huang J, Li Q, Wu P, Wang S, Gu S, Guo M and Fu Y (2022) The buffering of a riverine carbonate system under the input of acid mine drainage: Example from a small karst watershed, southwest China. Front. Environ. Sci. 10:1020452. doi: 10.3389/fenvs.2022.1020452
Received: 16 August 2022; Accepted: 29 August 2022;
Published: 29 September 2022.
Edited by:
Jingfu Wang, Institute of Geochemistry (CAS), ChinaCopyright © 2022 Huang, Li, Wu, Wang, Gu, Guo and Fu. This is an open-access article distributed under the terms of the Creative Commons Attribution License (CC BY). The use, distribution or reproduction in other forums is permitted, provided the original author(s) and the copyright owner(s) are credited and that the original publication in this journal is cited, in accordance with accepted academic practice. No use, distribution or reproduction is permitted which does not comply with these terms.
*Correspondence: Qingguang Li, bGVlcWcxMkAxNjMuY29t