 Yaolin Liu
 Hongxin Zhang
 Huiting Chen
 Cuizhen Chen4
- 1School of Resource and Environmental Sciences, Wuhan University, Wuhan, China
- 2Key Laboratory of Geographic Information System, Ministry of Education, Wuhan University, Wuhan, China
- 3Collaborative Innovation Center for Geospatial Information Technology, Wuhan University, Wuhan, China
- 4Wuhan Institute of Water Science Researching in Hubei Province, Wuhan, China
Rainfall events have become more frequent and more serious, leading to rampant floods. Floods in urban areas greatly impair the serviceability of the transport system and cause disruption to commuting. However, little is known about the commute response under various rainfall scenarios in developing country cities despite the uncertainty of climate change. A high-resolution flood modeling module and a commute simulation module were integrated to examine the impact on commuting under floods. Flood maps under three rainfall scenarios with increasing rainfall intensity and duration were obtained, and road vulnerability was assessed considering the speed drop. We innovatively employed location-based service big data to perform commute simulation under floods based on the shortest time cost principle. The results show that a large amount of passable but affected commuters become disconnected commuters as the rainfall intensity increases. Also, commute loss of each traffic zone would not increase linearly, which means that the emphasis and strategy of disaster prevention and mitigation are not the same in different rainfall scenarios. We integrated hot spots of flood exposure, road vulnerability, and commuting loss and found that there was inconsistent spatial distribution between the three indicators. This indicates that areas need to take different measures according to the local damage characteristics. This work studied the relationship between severe weather conditions and commuting activity performance at the city level and has important practical guiding significance for building resilient cities.
1 Introduction
Under the backdrop of climate change and its uncertainty, studies predict that future rainfall intensity and frequency would continue to increase (Kendon et al., 2012; Birch, 2014). With dense population and economic activities, cities have high land-use density and high proportion of impervious cover area. Moreover, due to the promotion of intensive and economical land use, increasing underground space mining and other construction activities have further greatly changed the urban built environment (Zhang et al., 2019). These changes, coupled with inadequate response by drainage facilities, eventually led to floods. Due to the high-intensity utilization of urban space, road and drainage systems have become two highly overlapped systems related to surface floods. When the drainage system is insufficient or poorly managed to accommodate the runoff caused by high-intensity rainwater, the road system would be the first to be directly affected (Singh et al., 2018; Yang et al., 2019). Flood damage to road systems will hinder urban traffic and greatly weaken the service capacity of urban transport systems (Fu et al., 2014; Borowska-Stefańska and Wiśniewski, 2018). To mitigate the impact of flood disruptions, it is necessary to obtain knowledge of traffic response in flood scenarios. Flood response is often passive and lacks proactive preventive research in many cities of developing countries. Also, many researchers have studied coastal cities to explore the impact of floods on urban commuting (Keeler et al., 2018; Kasmalkar et al., 2020a). However, there are few case studies exploring traffic response under floods in inland cities. Therefore, it is very urgent to evaluate urban road vulnerability and traffic response of inland cities in developing countries under floods caused by bad weather.
A recent literature suggests that road vulnerability in bad weather is receiving increasing attention. A more commonly accepted definition of road network vulnerability is the “susceptibility” or “sensitivity” of road networks to disruptions (Berdica, 2002). According to different research interests of the research field, the value dimensions of performance indicators to reveal road vulnerability are different (Jenelius et al., 2006; Balijepalli and Oppong, 2014; El-Rashidy and Grant-Muller, 2014; Mattsson and Jenelius, 2015). Many scholars in the field of transportation networks focused on measuring the impact of local road failure on the overall road network system from a global perspective (Demirel et al., 2015; Casali and Heinimann, 2019). Scholars who focus on spatial justice tend to reveal local road damage in spatial units or at the scale of road sections (Liu et al., 2021). Many researchers often use critical thresholds based on the work of Shah et al. (2021) to determine whether a road section can work. Roads that flooded deep below the threshold are considered normal, while roads that flooded above the threshold are removed during road network modeling (Chen et al., 2015; Jie et al., 2016; Coles et al., 2017). This binary assumption means that the impact on the specific service performance of roads is ignored. Because flooded roads do not necessarily mean complete failure, it is possible for them to travel at a lower speed. Liu et al. (2021) used the actual monitoring data to distinguish between smooth or congested or severely congested roads and to measure road vulnerability in floods, which also means that road damage within the same threshold is seen as homogenized. Speed, as an important service performance of road infrastructure, is an important measure under disturbance, but has not been given sufficient attention in the current road vulnerability research. Pregnolato et al. (2017) simulated the relationship between flood depth and the vehicle speed and plotted the relationship. The characterization of this relationship opens up the space for discussion of the speed impact details of flooded roads. Using this equation, the reduction of network speed during floods can be calculated. This study will also use the depth speed curve to further modify the speed of flooded roads to simulate residents’ routes based on the shortest travel time rule to explore commuting responses in flood scenarios.
So far, traffic response, especially the commuting theme under floods, has attracted the attention of many scholars and accumulated a large amount of contributions. Popular topics for commuting exposure in floods mainly include the accessibility assessment between regions, prediction of the amount of impassable commuters, and the estimation of increased commuting time costs and their economic costs (Aghababaei et al., 2021; Borowska-Stefańska and Wiśniewski, 2018; Debionne et al., 2016; Hauer et al., 2021a; Liu et al., 2021). Some studies have found knowledge of local commuting disruption and road performance under flood events by analyzing the actual traffic data during floods (Chung, 2012; Liu et al., 2021). The advantage of this data-driven method is that the results are credible. However, due to the limited financial and monitoring resources, it is difficult for most cities to collect spatiotemporal commuting behavior data in real disasters. Therefore, it is necessary to grasp the knowledge of commuting response in flood events in advance through simulation methods. In addition, the uncertainty of climate change also makes it necessary to know in advance under various rainfall scenarios. The development of hydrological models makes it possible to simulate urban waterlogging with high precision. Integrating the flood simulation module and the commuting simulation module that can be flexibly applied to various flood scenarios, to measure the commuting impact under flood events, is the common method used in many studies (Kasmalkar et al., 2020b; Tsang and Scott, 2020; Hauer et al., 2021a).
As for commuting simulation, it is important to accurately clarify the commuting demands of residents. The commonly used method is the four-step traffic assignment method, including trip generation, trip distribution, modal split, and traffic assignment (Sharma and Chandel, 2020). A commuting survey sampling dataset was also employed to determine travel OD demand (He et al., 2021a). Many studies employed the gravity model and the Monte Carlo method through demographic data and other spatial data of employment to estimate travel OD (Hu and Downs, 2019; Liu et al., 2021). Although this method can be verified by statistical data to some extent, it is still not the real commuting OD of urban residents but only a proxy indicator for commuting OD demand. With the development of information technology, geographic commuting big data have gradually been applied to urban studies (Zhao and Cao, 2020; An et al., 2022). Many Internet companies have the ability to collect location-based services’ request information received from various applications loaded on residents’ electronic devices, and the location of urban residents’ homes and workplaces can be calculated by clustering methods such as the density-based spatial clustering of applications with noise (DBSCAN) method (Wang et al., 2021). This kind of emerging data can greatly help to promote commuting simulation under floods. However, as far as we know, it is rare to see research that incorporates this commuting big data into the hazard field to guide analysis and decision-making. This study obtained flood maps under various rainfall scenarios using a high-precision hydrological model and attempted to use Baidu location-based service (LBS) commuting big data to predict commuting responses under floods, providing spatial information about commuting disruptions, thereby contributing to the literature.
This study has three main objectives: 1) to determine road vulnerability under multiple rainfall scenarios in combination with the impact of floods on road speed; 2) to predict and quantify the commute loss under different flood events; and 3) to explore the spatial hot spot patterns of flood exposure, road vulnerability, and commute loss. This study integrates flood modeling and spatial analysis to understand the commuting response under different flood events, aiming to provide a decision-making basis for disaster prevention and mitigation, urban planning, and commuting resilience promotion.
The remainder of this article is organized as follows. Section 2 introduces the context of the study area, Wuhan City, the experimental data and main methods including flood modeling and commute simulation, and the hot spot analysis methods used to explore the spatial patterns of flood exposure, road vulnerability, and commuter impact. In Section 3, the results of flood exposure are presented first, followed by the description of road vulnerability and commuting loss. Also, we integrated the hot spot analysis results of these three indicators and explained the similarities and differences of spatial high-value/low-value aggregation patterns. Section 4 is the discussion, focusing on the theoretical value and application value of this study and the limitation and the future direction. This article concludes with Section 5.
2 Materials and methods
2.1 Study area description
Wuhan, as the capital of Hubei Province, is an important industrial area, educational base, and transportation center in China, located between 113°41′E-115°05′E and 29°58′N-31°22′N. The terrain in the central urban area of Wuhan is low and flat, with an average elevation of about 24 m, which is lower than the average flood level of the Yangtze River (25.56 m, monitoring data from 1865 to 2013). Therefore, Wuhan is often threatened by floods in rainy seasons and has experienced frequent rainstorms and waterlogging disasters in recent years (Liu et al., 2021). On 18 June 2011, the maximum 24-h rainfall in Wuhan reached 200.5 mm, and 88 locations in the urban area were flooded. On 7 July 2013, the maximum rainfall was increased to 258.5 mm. In June 2016, Wuhan suffered the most severe flood disaster since 1998. The maximum rainfall in a single day reached 582.5 mm, which paralyzed the traffic, and nearly 200 major roads in the city were impassable (Zhiqiang, 2016).
The central urban area of Wuhan was adopted as the study area in this work, circled by the Third Ring Road, and we took the traffic analysis zone (TAZ) as the smallest research unit (Figure 1). TAZ was a commonly used research unit in the current commuting analysis. We divided the TAZs based on the road network data provided by Wuhan Geomatics Institute and adjusted it according to the Wuhan Urban Planning Unit. Finally, we obtained 512 TAZs in central Wuhan with an average area of 0.91 km2.
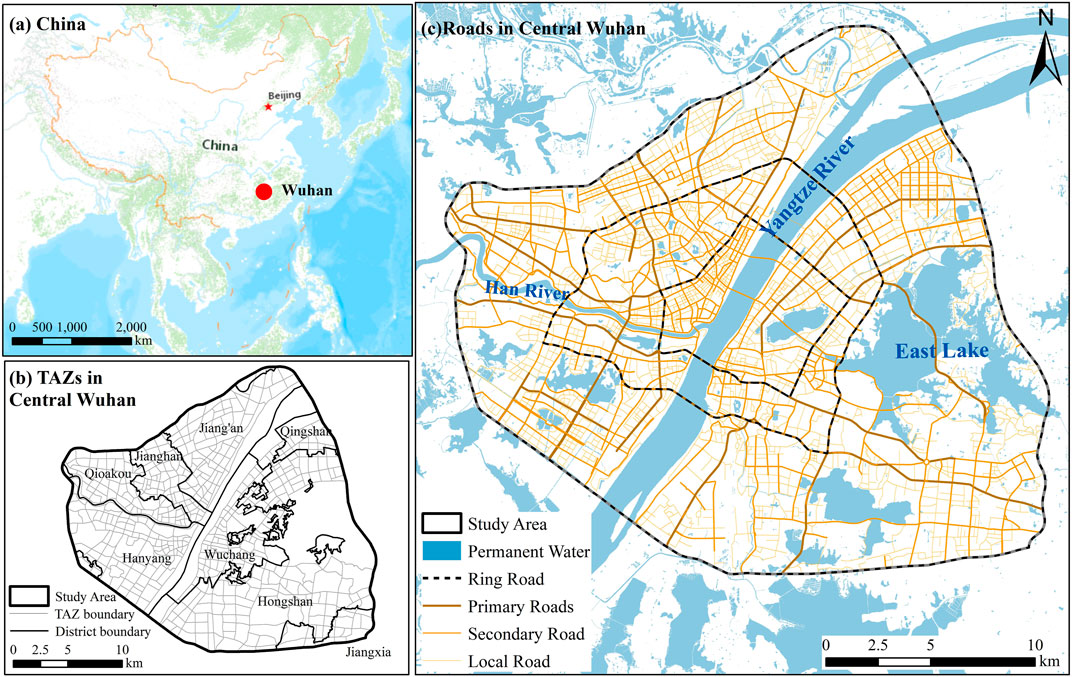
FIGURE 1. Location of the study area: (A) Wuhan’s location in China; (B) Traffic analysis zones in Central Wuhan; (C) Roads in Central Wuhan.
2.2 Data acquisition and processing
The data used in this article are mainly used to support hydrological simulation and commuting simulation. The types and sources are shown in Table 1. The flood hydrological simulation module mainly uses vector data including land use data, digital elevation model data (DEM), drainage network facilities data, and building data. The urban building data are derived from the basic geographical conditions monitoring data of Wuhan City in 2018, and the resolution of digital elevation model (DEM) data is 10 m.
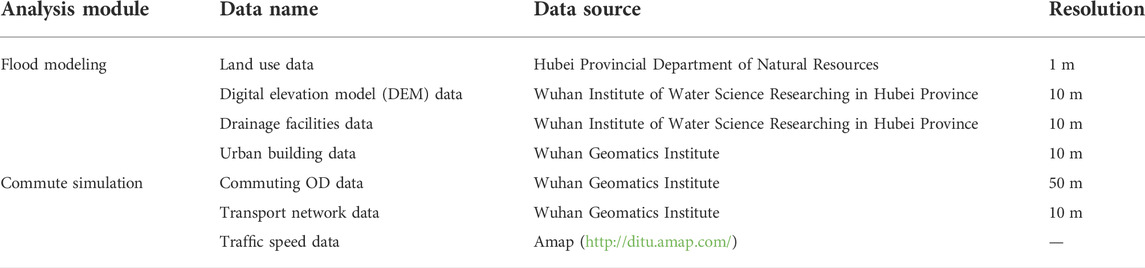
TABLE 1. Names and sources of study data.
In the commuting simulation process, commuting OD data come from location-based service (LBS) data collected by Baidu whose base station records the user’s location point every 5s, and the positioning accuracy in the main city of Wuhan is 50 m. In this study, we collected all of the location records during 21 working days of June 2018. First, we merged all location records into one dataset and then adopted the density-based spatial clustering of applications with noise (DBSCAN) to cluster the location points. If the clusters with large number point of night time (21:00-8:00) were located in residence land, then its geometric center was defined as the user’s residence location. In the same way, clusters’ center of daytime (9:00-17:00) with work land type was defined as the workplace. When the user stayed at home, his dwell points stayed around the residence. When he began to commute, the acquisition time of the first moving points was the start time. Similarly, the acquisition time of the last moving points near the workplace was the end time. Meanwhile, his commuting trajectory was also recorded so that the commuting distance, time, and speed can be calculated. Finally, more than 840,000 commuting OD data were identified in central Wuhan with attributes of the user’s residence, employment location, and commuting trajectory characteristics (including commuting distance, time, and speed). Furthermore, the transport network data were also obtained from the General Survey and Monitoring of Geography and National Conditions in 2018, which includes attributes of road types, speed limits, and road width. The traffic speed data were crawled from Amap (http://ditu.amap.com/) based on the Python program, and the data acquisition time is from 5 April to 11 April 2021.
2.3 Flood modeling
To capture the flood inundation situation of the area under a set of rainfall scenarios, we used a hydrodynamic model to perform hazard simulation instead of directly using flooding events records, which cannot satisfy the data demand of continuous rainfall intensity sequence. The Wallingford Software model for integrated catchment management (ICM6.5) is employed in this study to produce outputs for each time step of the simulation to give flood depths and velocities. ICM6.5, integrating shallow drainage pipe network and river channels, can construct one-dimensional and two-dimensional water conservancy models of urban waterlogging for comprehensive drainage simulation at high resolution (Sidek et al., 2021). This study used the Chicago rainfall pattern and considered rainfall intensity uniform across the model domain. The rainfall series considered is summarized in Table 2. In this study, we choose 10-year, 30-year, and 50-year floods to perform hazard modeling, considering the local climate condition in Wuhan. The degree of the most severe flood disaster in Wuhan recently (in 2016) was basically close to a 50-year flood (People’s Government of Hubei Province, 2016), and the common rainfall intensity in summer is similar to that of a 10-year flood. We add a 30-year flood between them in order to set a continuous sequence.
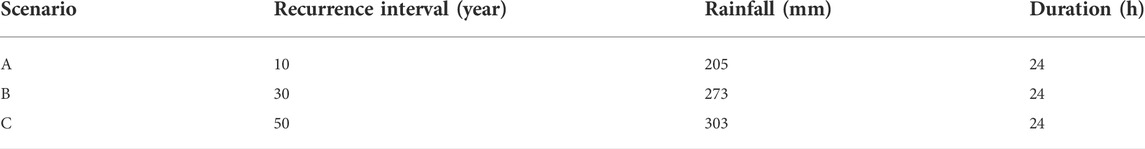
TABLE 2. Rainfall intensity of the simulated design rainfall scenarios with reference to Planning and Design Standards of Wuhan Drainage and Waterlogging Prevention System (HubeiBureauofQualityandTechnicalSupervision, 2013).
The process of flood modeling during rainfall consists of three main steps (Chen et al., 2016).
(1) Model building. Data of drainage facilities responsible for rainwater discharge functions, including rainwater pipe networks, drainage ports, pumping stations, and storage lakes, were imported into InfoWorks ICM6.5, which was commonly used in flood modeling (Sidek et al., 2021). The catchment area was divided based on the terrain and image data, and runoff generation parameters were determined through the analysis of the underlying surface. The SWMM (storm water management model) nonlinear reservoir method (Xiong and Melching, 2005) (i.e., using the finite difference method to approximate the continuous equation and the Manning equations) was used to simulate the surface confluence process of subcatchment areas divided in the runoff generation model.
(2) Model calibration and validation. We selected the actual measurement data and facility operating condition data in the water system during heavy rain from 12:00 on 30 June 2016 to 12:00 on 14 July 2016 to calibrate and check the model. The maximum rainfall in this field on the 7th day is 582.5 mm (Wuhan National Meteorological Station), which is the highest weekly rainfall since the meteorological record of Wuhan City. After one-dimensional and two-dimensional calibrations, the simulated water level and the monitored water level of each monitoring station are evaluated using the NSE (Nash–Sutcliffe coefficient) (Moriasi et al., 2007). The closer the NSE to 1, the smaller the deviation between the simulated value and the measured value, and the better the simulation effect. NSE <0 means that the simulation reliability is low, NSE >0.5 means that the simulation result has good credibility, and NSE ≥0.65 means the simulation result is very good and has high credibility. The results of comparative analysis of calculated values of the main lake nodes (see Supplementary Appendix SA1) show that the overall agreement between the model simulation results and the measured data after verification is good.
(3) Model calculation. For a given scenario of rainfall, water depth and velocity were calculated dynamically throughout the simulation period and reported at each time step as each subcatchment area (divided based on the terrain and image data). However, with the huge amount of computation, caution must be applied, the maximum inundation depth instead of the dynamic changes during the entire process was selected for subsequent road network analysis to reduce the calculating burden. This is reasonable in this study as residents are inclined to make driving decisions based on the most severe submergence of road sections out of caution.
2.4 Commute simulation under floods
In order to compare the discrepancy between residents’ commuting distance and time under different scenarios, it is necessary to distribute the commuting routes of every OD pair. The simulation process is divided into three steps.
(1) OD pairs filtering and road network processing. Different from the normal scenario, it is vital to consider the impact of floods on the road under flood scenarios. When the flooded depth exceeds 30 cm, the air intake of the vehicle will be submerged, which will seriously affect the performance of the vehicle (Shah et al., 2021). Therefore, the OD pairs and roads located in areas with flood depth more than 30 cm have been removed. Moreover, although roads with a water depth of less than 30 cm can pass normally, the speed of vehicles on this road will be limited. Pregnolato et al. (2017) proposed a function that described the relationship between the maximum vehicle speed and water depth under flood scenarios (Eq. 1):
where the speed
(2) Shortest path distributing. Based on the OD pairs’ location and the construction of road network, commute route distributions were implemented with ArcMap10.5 software by the extensions module “network analyst.” Assuming that the commuters tend to take the least-time-cost path, we applied the new route option in the network analyst to assign commute paths between origins and destinations with the objective of minimizing time cost. Each path’s commute distance and time can also be calculated.
(3) Results verification. We compared our simulation results under normal scenario to real commute time and distance in original OD pair records of the LBS data. The Pearson correlation coefficient (CORREL) and root mean square error (RMSE) were used as evaluation indices. Figure 2 shows the fitting curves of the modeled and real commute time and distance. The modeled results are highly consistent with the real commute time and distance. The modeled time and real time have a Pearson correlation coefficient of 0.913** (p < 0.01) and a root mean square error of 0.12, while the distance has a Pearson correlation coefficient of 0.958**(p < 0.01) and a root mean square error of 1.79.
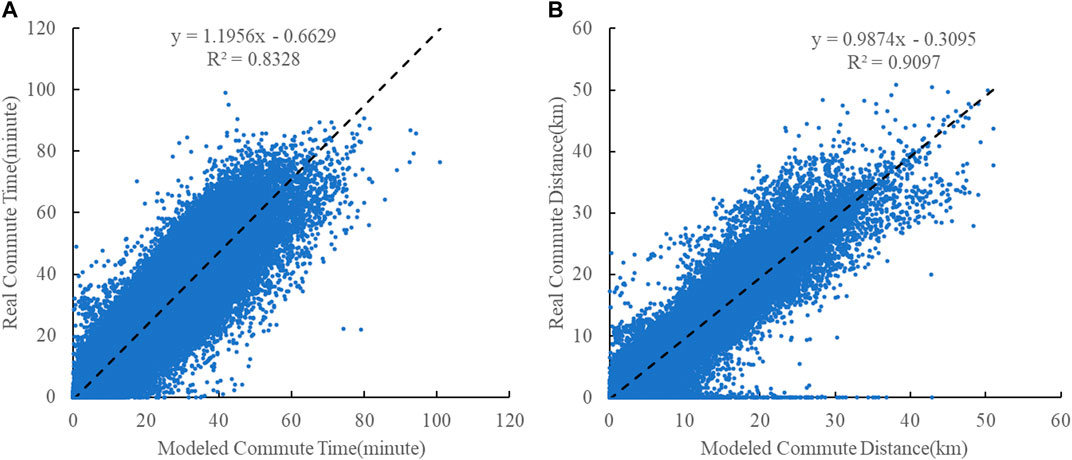
FIGURE 2. Results verification: modeled commute time (A) and modeled commute distance (B).
2.5 Hot spot analysis
Hot spot analysis (Getis-Ord Gi*) can be calculated by ArcGIS software to obtain the spatial distribution of high-value and low-value elements and clustering situation. The Z score of the calculation result represents the multiple of standard deviation, which can reflect the dispersion degree of the dataset. A highly affected cluster area by flood surrounding a highly affected area is called a hot-spot cluster. On the contrary, the less affected area surrounded by a clustered area of low value is called a cold spot clustered area (CAO et al., 2020). In this work, Getis-Ord Gi* local statistics was used to identify statistically significant hot spots and cold spots of TAZs affected by floods. The calculation formula is shown in Eqs 2–4.
where Gi is the Z score of output result; ki is th statistic index of TAZ i; zhi is the spatial weight between TAZ h and i; n is the total amount of TAZ; X is the average of statistical index; S is the standard deviation.
3 Results
3.1 Flood modeling and exposure mapping
Taking the traffic analysis zones as the analysis unit, we counted the flood area at different depths under the three rainfall scenarios (Figure 3), including less than 15 cm, 15–30 cm, and more than 30 cm, respectively. The results revealed that water area of depth less than 15 cm increased the smallest, only from 2,679 to 3,176 ha, while water area of depth greater than 30 cm increased the most of 2,228 ha. We use an indicator of flood exposure to represent the comprehensive hazard degree. The space of the traffic analysis zones (TAZs) that bears the disaster was homogenized, while the degree of flood disaster is considered and divided into three types including less than 15 cm, 15–30 cm, and more than 30 cm. Then, AHP (analytic hierarchy process) (Saaty, 1980) was adopted to derive the severity weight of the three types of flood depths (see Supplementary Appendix SA2 for the weight results). The flooded area of each traffic zone was multiplied by the weight to obtain the flood exposure, and subsequently, the product results were summarized and shown at the scale of the traffic analysis zones. As the intensity of flood increases, flood exposure of a 30-year flood became approximately 1.7 times that of a 10-year flood, and flood exposure of 50-year flood became more than twice the 10-year flood exposure.
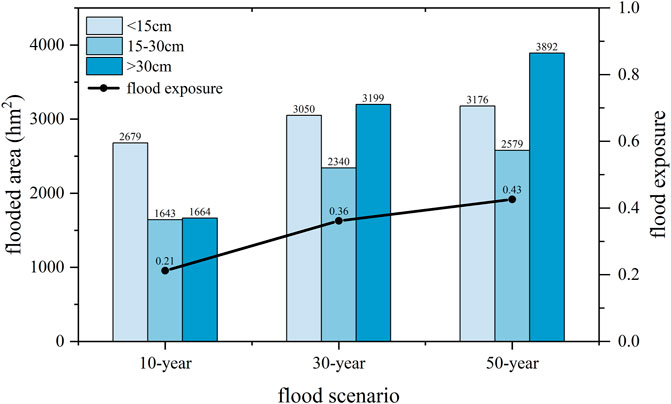
FIGURE 3. Characterization of the flood area and flood exposure.
Figure 4 shows the spatial distribution of flood exposure under three flood scenarios, and we put the spatial distribution map of flood area under three rainfall scenarios in Supplementary Appendix SA1). Under the 10-year flood scenario, flood exposure of the whole area is relatively light, and only three TAZs have more than 18.84 ha of standing water. With the increase in rainfall intensity, areas seriously flooded began to increase. Large patches of standing water emerged in Qiaokou District and Jianghan District in the northwest. The terrain in this area is relatively low and flat, combined with many buildings, wide impervious surface, and poor drainage capacity, resulting in serious water accumulation. Also, there was serious water accumulation around East Lake, Shahu Lake, South Lake, and other lakes. This may be due to the generally low terrain around the lake. If the water storage capacity of the lake exceeds a certain limit, it is prone to overflow when urban waterlogging occurs; therefore, the areas around the lake are easily affected.
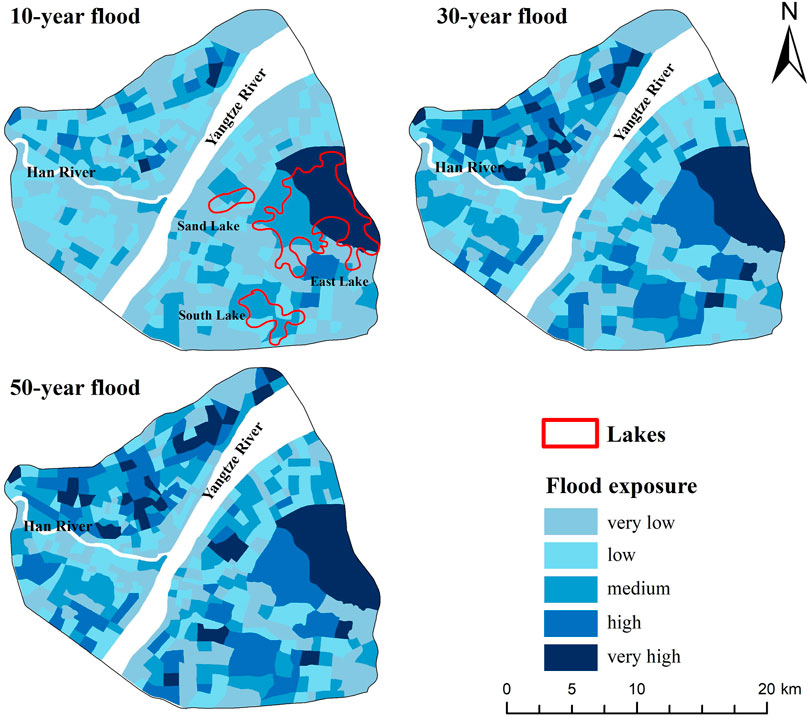
FIGURE 4. Spatial distribution of flood exposure under three flood scenarios in traffic analysis zones.
3.2 Vulnerability assessment of road networks
Figure 5 shows the proportion of flooded road length under different floods. In a 10-year flood, 10.53% of the roads are flooded, and this ratio increases to 13.63% in a 50-year flood. Among the flooded roads, flooded roads of 15–30 cm depth accounted for the highest proportion and increased the most with the increase in flood intensity, which increased twice by 123.19 km from a 10-year flood to a 50-year flood. Flooded roads of depth more than 30 cm, or failed impassable roads, also increase in length as the flood intensity increases. The impassable road in the 10-year flood is 2.35 km, which increases to 3.92 km in the 30-year flood and finally to 11.99 km in the 50-year flood, more than five times that in the 10-year flood.
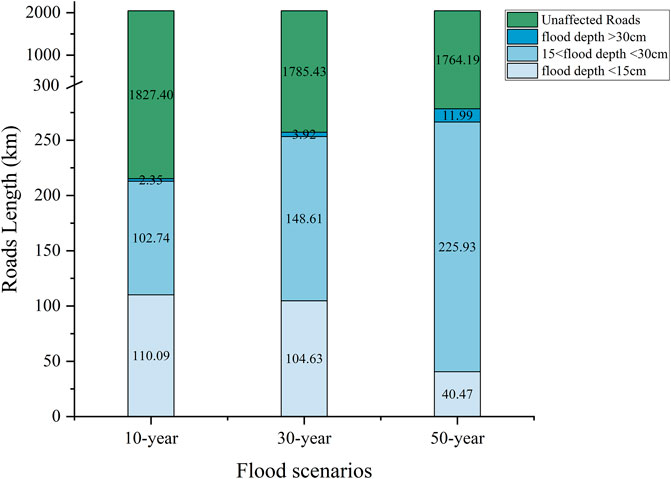
FIGURE 5. Characterization of the flooded road under three flood scenarios.
The first line of Figure 6 shows the distribution of the roads affected by standing water under each flood scenario within the Third Ring. It can be seen that the distribution pattern of the affected roads is consistent with the standing water, and the declined velocity of the road in the area with severe stagnation is relatively high. Specifically, affected roads were mainly present in Jiang’an District, Jianghan District, and Jiangdi Street of Hanyang District in the northwest, as well as the area around East Lake. In terms of the changes in roads velocity under three scenarios, the speed reduction in the 10-year scenario is relatively small, generally within 1–10 km/h. With the increase in flood intensity, the speed limit gradually increases. In the 50-year scenario, roads with a velocity decline of more than 30 km/h becomes the major part.
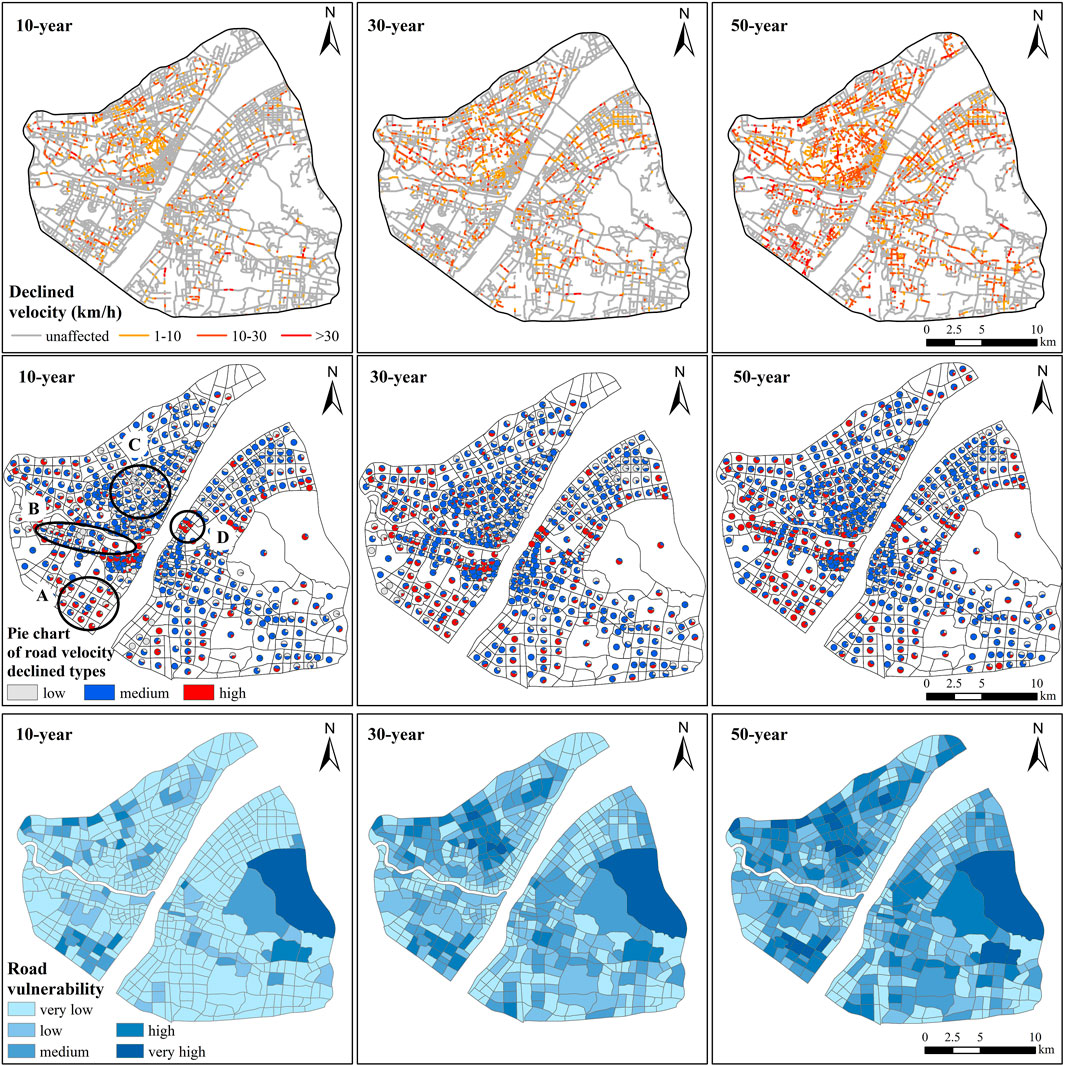
FIGURE 6. Vulnerability results of roads in traffic analysis zones.
According to the declined velocity of the road, we further classified the affected roads into three types. The roads with a decrease in travel speed of 1–10 km/h were divided into low-declined type, the roads with a decrease of 11–30 km/h were divided into medium-declined type, and the decrease of more than 30 km/h were divided into high-declined type. Then, the proportion of the roads in three types is calculated. The second line of Figure 6 shows the length ratio of the three declined types in each TAZ. The area A in Figure 6 located in Jiangdi Street and the area D located in the north of Jiyuqiao Street both have a high level of road speed reduction under the three flood scenarios. Almost all flooded roads in the two areas experienced a speed drop of more than 30 km/h. The surroundings of area A are all highlands; therefore, the accumulated water is easy to converge to area A. Area D is located between Sand Lake and the Yangtze River, therefore more vulnerable to floods. The declined level of road speed in area B shows a trend from low to medium to high. It can be seen that the drop in the road travel speed is also increasing with the increase in flood intensity in this area. Area C is the area with more serious flood exposure under the flood scenario, but the main speed drop level of the traffic area is relatively low. Even in the 50-year flood, the main type seemed to be medium, and only a few regions showed high level. This may be because the area belongs to the central business district of Wuhan City. The traffic in this area is relatively congested, and the road speed is low under normal times, basically around 30 km/h.
The impact of floods on the transport network within a traffic zone includes not only the declined velocity of affected roads but also the length of roads affected. Therefore, we measure the vulnerability of the road network in terms of both the length of the affected roads and the declined velocity (Formula 1).
Roads vulnerability = Affected length of roads × Declined velocity.
The third line of Figure 6 shows the distribution of road vulnerability at the scale of the traffic analysis zones in each scenario. The road vulnerability level is generally low in the 10-year flood. Only the southern Jiangdi Street, the northwestern Hanxing Street and Changfeng Street, and the eastern East Lake Scenic Area Streets showed a higher level. When the flood intensity increased to 30-year and 50-year return period, the road vulnerability level increased significantly, showing a spatial pattern of contiguous distribution of high-level vulnerable traffic analysis zones.
3.3 Analysis of commute condition under floods
The commuting loss caused by flood is mainly seen in two aspects, including commuting trip cancellation and increased commuting time. Under floods, all commuting trips can be divided into three categories: disconnected, passable but affected, and unaffected. Figure 7 shows the statistical results of the three commuting types under three flood scenarios. The horizontal axis in the figure represents the commuting distance in the normal scenario, with a distance interval of 5 km. The left ordinate represents the proportion of the three types, and the right ordinate represents the number of commuters of a certain commuting distance type.
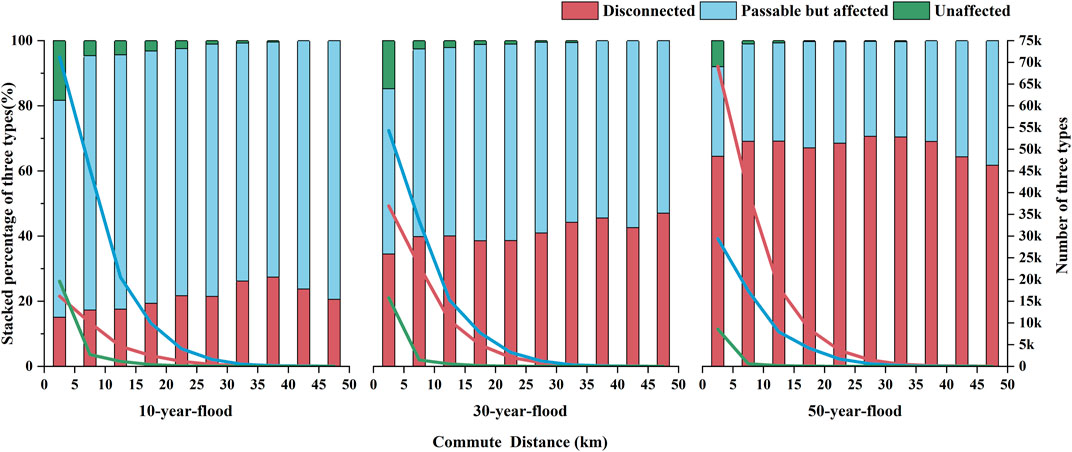
FIGURE 7. Structural analysis of commuters under three flood scenarios.
Figure 7 shows that it is dominated by short-distance commuters in the study area. Commuting trips within 0–10 km account for the vast majority, and the number of commuting trip gradually decreases with the increase in travel distance. Among the three types, unaffected commuters account for the highest proportion in the commuting distance of 0–5 km under floods, indicating that short-distance commuters are less vulnerable to floods than long-distance commuters. When commuting distances are between 30 and 40 km, commuters are more likely to be disconnected. Also, the proportion and number of passable commuters in all distance intervals are the largest in the 10-year flood, and about 80% of commuting trips can be completed. In the 30-year flood, the order of the number of the three types is passable but affected commuters > disconnected commuters > unaffected commuters. With the increase in flood intensity, the proportion of disconnected commuters increases gradually, and the proportion of passable but affected commuters and disconnected commuters decrease gradually. In the 50-year flood, the proportion of disconnected commuters exceeds that of passable but affected commuters.
The cumulative distribution function of commute distance in Figure 8A shows that the slope decreases as the commute distance increases. The proportion of long-distance commuters decreases as the commute distance increases, with more than 50% of commuting distance below 10 km. Moreover, the greater the flood intensity, the greater is the proportion of short-distance commuters. Within 2 km commuting distance, the proportion in a 50-year flood is the highest, followed by the 30-year, and then the 10-year flood. When the distance exceeds 10 km, the cumulative probability of the four scenarios is reversed. The cumulative probability under the normal scenario is the highest, followed by the 10-year flood, the 30-year flood, and the minimum is the 50-year flood. This indicates that long-distance commuters are more vulnerable to flood disruption, while short-distance commuters are less vulnerable. In addition, the increase in flood intensity also leads to an increase in the commuting distance. The cumulative function of commuting in a baseline scenario reaches saturation at about 25 km, while the longest commuting distance in the 50-year flood has reached 80 km.
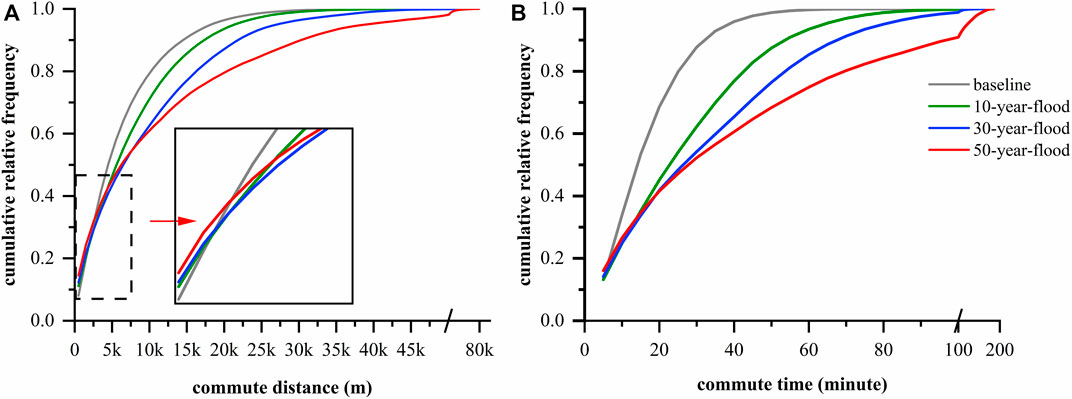
FIGURE 8. Cumulative function distribution of commuting travel distance (A) and commuting travel time (B) under floods.
The results of the commuting time cumulative function (Figure 8B) are similar to the characteristics of the commuting distance cumulative function. In the baseline scenario, more than 50% of the commuting time is less than 15 min, while this value reaches 40 min in the 50-year flood. The greater the flood intensity, the greater is the proportion of short-time commuters. Commuting trips within 20 min account for the highest proportion in the 50-year flood, followed by the 30-year flood, and then the 10-year flood. When the commuting time exceeds 20 min, the proportion order changes that cumulative probability in the 10-year ranks first, followed by that in the 30-year flood, and then that in the 50-year flood. In the baseline scenario, the travel time is less than 1 h, while the maximum commuting time reaches 3 h in the 50-year flood.
Comparing the commuting distance cumulative function diagram and the commuting time cumulative function diagram, it can be seen that the slope difference of the commuting time cumulative function in the baseline scenario and three flood scenarios is greater, while the difference between the commuting distance cumulative functions is more moderate. This shows that there are differences in the results of time-cost and distance-cost indicators, and the increase in time is greater than the increase in distance, which is consistent with the research results of Pyatkova et al. (2019). A study had also pointed out that the time cost was more suitable for measuring the delay of the urban network, and the distance cost is more suitable for sparse road network (Balijepalli and Oppong, 2014).
Our model divides into two ways in which floods have impacts on commuting. One is to characterize the number of unsatisfied OD, including the disconnected commuters due to flooded homes or workplaces and necessary roads failure. The other is to measure the cost of extended commuting time due to floods. In order to better demonstrate the impact on commuting from floods, we equate each unsatisfied OD with an 8-h extended travel time (the same as the legal working time in China) and then normalize the comprehensive commuting loss. The results were displayed at the traffic analysis zones scale, in which home and workplace of the commute OD pairs were located.
The top three panels of Figure 9 aggregate the disconnected commuters by their home traffic analysis zones, while the bottom three panels aggregate the disconnected commuters by their workplace traffic analysis zones. Figures 10, 11 show the results of extended time and comprehensive commute loss in the same way.
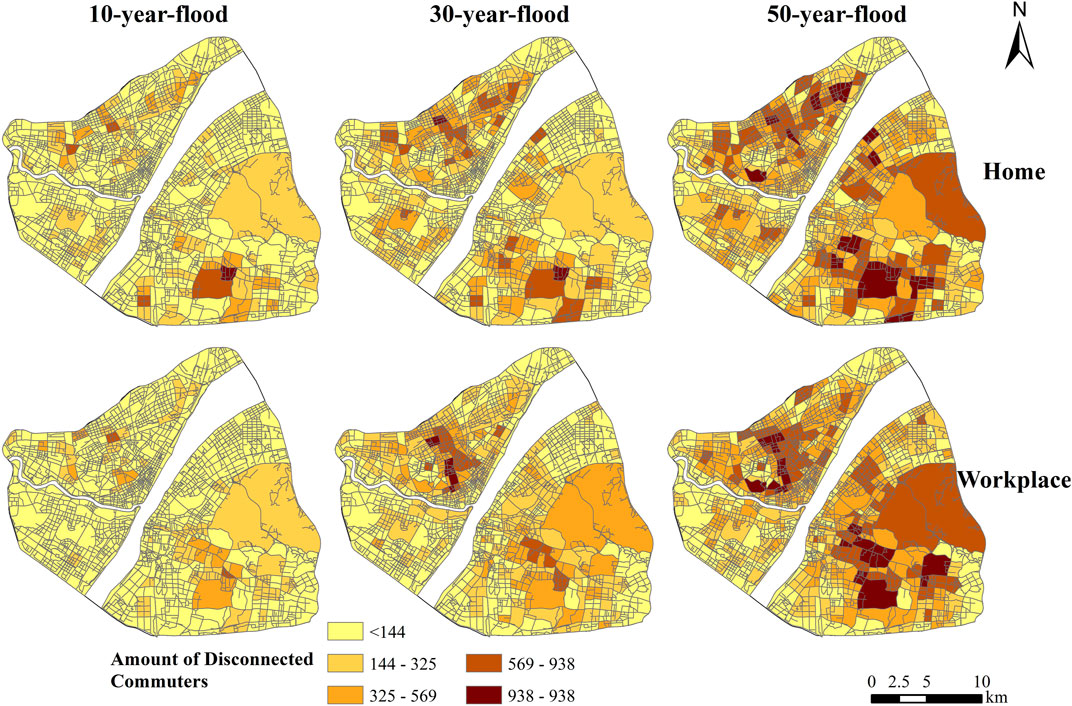
FIGURE 9. Number of disconnected OD of traffic analysis zones under three flood scenarios.
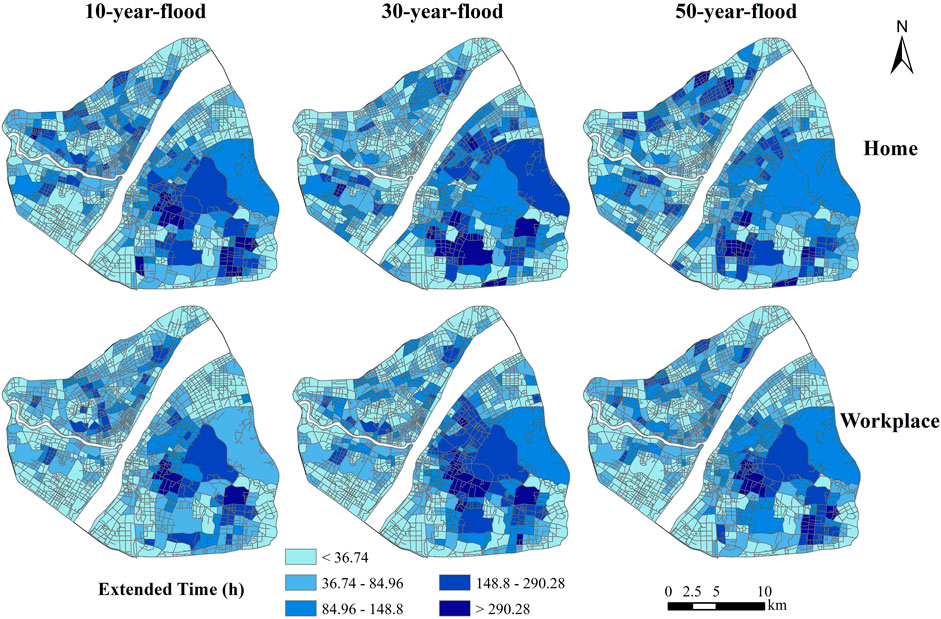
FIGURE 10. Extended time of traffic analysis zones under three flood scenarios.
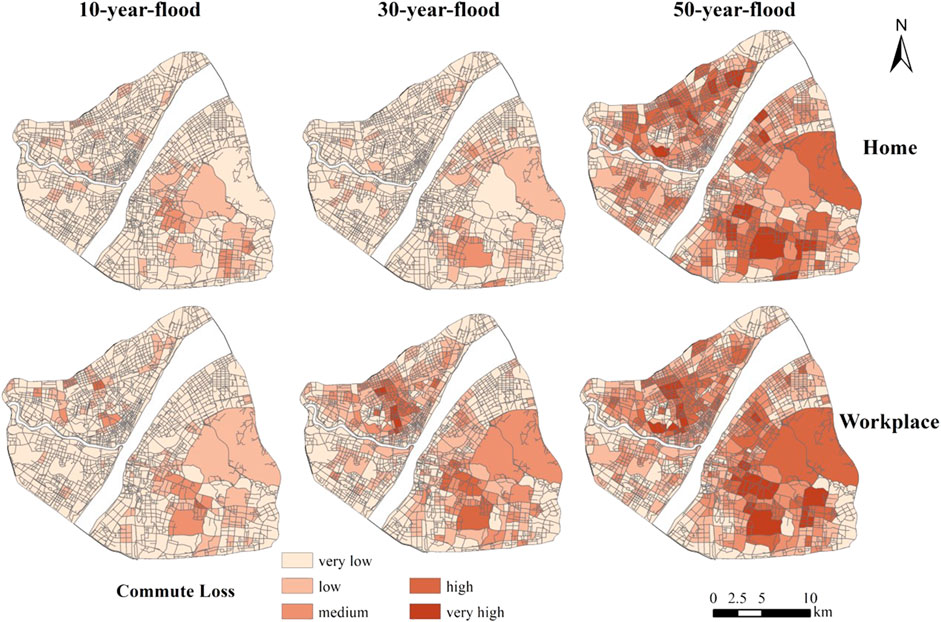
FIGURE 11. Comprehensive commute loss of traffic analysis zones under three flood scenarios.
The magnitude of the disconnected OD increases with flood intensity, as seen in Figure 9. A large number of residents were unable to accomplish the commuting under the 50-year flood. The highest values of the disconnected commuters by their workplace traffic analysis zones were more concentrated in urban center than that by their home traffic analysis zones.
The distribution of extended time is quite different from that of the disconnected OD (Figure 10). With the increase in flood intensity, the extent of extension time did not significantly deepen. This may be because when the flood intensity increases, delayed trips in the previous state transformed to disconnected trips so that the extended time of almost all traffic analysis zones does not increase globally. High values of extended time by their home traffic analysis zones are mainly concentrated in the junction areas of Shizishan Street, Luonan Street, and Hongshan Street, while high values of that by their workplace traffic analysis zones were more north-distributed, mainly in the junction areas of Zhongnan Road Street, Shuiguo Lake Street, and Luonan Street.
The distribution of comprehensive commuting loss is more consistent with the distribution of disconnected OD, as seen in Figure 11. Areas with a huge commute loss under floods are still concentrated in the Qiaokou–Jianghan–Jiang’ an areas in the northwestern and the Guanshan Street in the southeastern. These two areas should be the key areas for the allocation of flood control and disaster prevention resources.
3.4 Comparison of flood exposure, road vulnerability, and commuting loss hot spots
We normalized these three indicators including flood exposure, road vulnerability, and commute loss to see and compare their changes under three flood scenarios, as shown in Figure 12. All of the three indicators increase with the increase of flood intensity, but the magnitude of the variation is different. In the 10-year flood, the normalized value of flood exposure is the largest, followed by road vulnerability, and then commuting loss. From the 10-year flood to the 30-year flood, the order of the three indicators has not changed, but the increase in commuting loss is higher than the other two indicators. The normalized value of commuting loss is the highest in the 50-year flood, followed by road vulnerability, and then flood exposure.
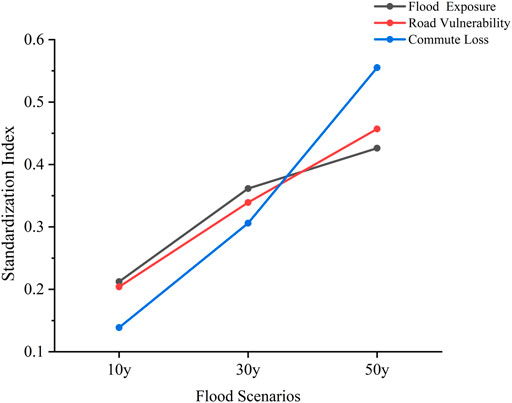
FIGURE 12. Normalized curves of flood exposure, road vulnerability, and commute loss under three floods.
The hot spot analysis tool is employed to analyze flood exposure, road vulnerability, and commuting loss, and the high–high adjacent (99% confidence hot spot clustering) and low–low adjacent (99% confidence cold spot clustering) are extracted for visualization, as shown in Figure 13.
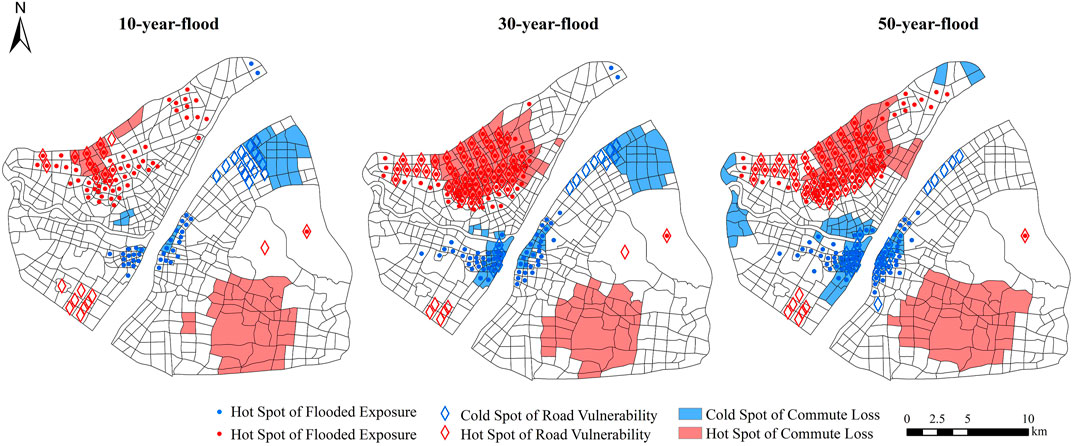
FIGURE 13. Getis-Ord Gi* results of flood exposure, road vulnerability, and commuting loss under three flood scenarios.
Flood exposure mainly shows high-value aggregation in Qiaokou District and Jianghan District in the northwest, and low-value aggregation in the southern bank of the Hanjiang River and the southern bank of the Yangtze River at the junction of the Hanjiang River and the Yangtze River (Lu et al., 2021). As for road vulnerability, there are two high-value aggregations; one is located in Qiaokou District and Jianghan District in the northwest, which is consistent with the distribution of flood exposure hot spots. It can be seen that there is a high-value aggregation area of flood exposure, road vulnerability, and commuting loss under the 30-year flood and 50-year flood in the northwest. This is mainly due to the serious damage to the road network caused by the contiguous flood, which makes the commuting of residents in the area seriously damaged. Another high-value area of road vulnerability is located in the Jiangdi Subdistrict Office in the southwest of the study area. The road speed in this area was relatively fast in the baseline scenario, and the occurrence of floods greatly limits the speed of the original road speed, resulting in a high-value concentration of road vulnerability. The low-value aggregation area of road vulnerability is distributed at the junction of Qingshan District and Wuchang District in the northeast of the study area.
The hot spots of commuting loss show two agglomeration areas in the study area. One is distributed in the northwest, which coincides with flood exposure and road vulnerability. The other high-value agglomeration area is located in the Luonan Street and Hongshan Street office area in the southeast, which is not a high-value aggregation of flood exposure and road vulnerability. Due to the poor connectivity of the road network caused by its geographical isolation, small flood disturbances can make particularly high commuting losses in this area. The cold spot aggregation area of commuting loss shows a large distribution difference under the three floods, mainly the global commuting pattern would be affected under different floods. In the 10-year flood, the low-value aggregation area is mainly located at the junction of Hongshan District and Qingshan District in the northeast, while located at the junction of the Hanjiang River and the Yangtze River in the 30-year flood, and the intersection of the two rivers in the central region and Yongfeng Street in the west in the 50-year flood.
4 Discussion
In the context of climate change, regional and global floods are becoming more and more frequent (Birch, 2014). Although the road network construction in various cities is still constantly improving and the government is also continuously increasing investment in the construction of drainage facilities, there is still a growing trend of flood damage to the road network. China’s urbanization process is still advancing. As the capital city of central China, Wuhan’s population concentration in urban areas has gradually increased, making floods have a great impact on commuting as a necessary transportation activity (Liu et al., 2021). Measuring flood exposure, road network vulnerability, and commuting loss (People’SGovernmentofHubeiProvince, 2016) is critical to building resilient cities. This is an important contribution of our research. At present, there is a certain foundation for the combination of a hydrological model and a spatial analysis tool to explore the commuting risk under flood (Tsang and Scott, 2020). We integrated flood modeling and transportation network and further discussed the flood exposure and commuting loss under various rainfall scenarios based on commuting simulation. As opposed to a large number of studies using survey data or statistical data to calculate the amount of commuting activities (Borowska-Stefańska et al., 2018; Hu and Downs, 2019; Liu et al., 2021; Sharma and Chandel, 2020), we innovatively employed Baidu’s commuting big data in this field. Baidu’s commuting big data have a high data granularity. By actually monitoring the actual commuting activities of residents, it can accurately indicate the commuting demands of each resident (An et al., 2022). It is difficult to conduct a large-scale survey of commuting activities under floods. Knowing the accurate origin and destination of residents is an important guarantee for commuting simulation. In addition, we took into consideration the speed decline in the measurement of road vulnerability based on the flood depth-speed influence curve (Pregnolato et al., 2017). It is worth mentioning that this is not a monitored road decline rate, but the predicted road speed decline based on flood exposure results.
Studying the relationship between severe weather conditions and transportation system performance at the city level has important practical guiding significance for building sustainable cities (Hauer et al., 2021b). First of all, flood exposure under different scenarios can help guide the investment and improvement of drainage facilities. The road vulnerability assessment results identified vulnerable road sections under flood pressure, enabling decision makers to determine the order of priority interventions. The commuting loss results show that long-distance commuters are more vulnerable to flooding than short-distance commuters. In addition, the spatial distribution of commuting losses was shown in the form of traffic analysis zones, which helps to understand the response of urban commuting during floods and design adaptation and resilience strategies. Through the simple normalization of the three indicators, we found that when the flood intensity increased from a 30-year return period to a 50-year return period, the increase in commuter losses far exceeded the increase in flood exposure and road vulnerability. Also, the damage degree of each traffic zone will not increase linearly with the increase in flood intensity. In areas that are not severely damaged in a former less severe flood, it is highly likely that the damage will increase sharply as the flood intensity increases. The emphasis and strategy of disaster prevention and mitigation are not the same in different rainfall scenarios (Liu et al., 2021); therefore, it is very important to conduct an assessment under various rainfall scenarios.
The hot spot analysis of these three indicators, through the identification of high-concentration areas, clarifies which places are urgent to be equipped with resources (He et al., 2021b). Second, by comprehensively combining the results of flood exposure, road vulnerability, and commuting loss hot spot analysis, some enlightening conclusions are also obtained by exploring the correlation factors and possible causes of overlap and difference. The northwest of the study area is the overlapping area of flood exposure, road vulnerability, and commuter loss, which is also the key area of flood resistance and mitigation in the future. For the nonoverlapping areas of the three indicators, different measures should be taken according to the local damage characteristics. A hot spot of commuting loss but not the other two indicator was found in the southwest, mainly due to the defect of the road network caused by the geographical barrier of Wuhan (Liu et al., 2021), which makes small flood disturbance also have a great impact on commuting. In order to improve the traffic resilience under floods, urban decision-makers should give priority to improving the road network construction in the region to make it more resilient.
Despite the comprehensive findings, this research has several limitations. First of all, in order to reduce the computational burden, we only selected the maximum flood depth when calculating flood exposure and did not discuss the entire flood process. Also, our commuting simulation has only been tested in the baseline scenario. Due to the lack of actual commuting behavior during the flood period, the reroute results during the flood period were not actually validated but were consistent with the previous Wuhan City studies (Liu et al., 2021; Liu et al., 2021). Because this study focuses on exploring the response of traffic network and commuting under floods, we only made the exploration at the traffic analysis zones scale. In order to provide suggestions for disaster prevention and mitigation, traffic management and urban planning, the research scale can be further increased in the future, including the planning unit scale and the catchment scale that can reflect the topographic characteristics.
5 Conclusion
This article integrated the flood modeling module and the commute simulation module to obtain knowledge about commute response under three rainfall scenarios, including a 10-year flood, a 30-year flood, and a 50-year flood. High-resolution flood maps were obtained through the hydrological model considering the condition of drainage facilities. Road vulnerability was assessed at the scale of road sections and traffic analysis zones (TAZs). We considered the declined speed based on the correlation between flood depth and travel speed, therefore, a targeted adaptation plan can be designed to manage them and promote the transport resilience. In the process of commute simulation, we introduced the Baidu location-based service (LBS) data to get the accurate location of residents’ homes and workplaces, and modified the normal commuting speed based on the calculated speed under floods to reroute residents’ commute trips. The results in Wuhan showed that short-distance commutes are less vulnerable to floods than long-distance commutes. In the 50-year flood, the proportion of disconnected commuters exceeds that of passable but affected commuters. There are differences in the results of time-cost and distance-cost indicators, and the increase in time is greater than the increase in distance. When the flood intensity increased, delayed trips in the previous state transformed into disconnected trips, so the extended time of almost all traffic analysis zones (TAZs) did not increase globally, while a number of disconnected commuters did. The hot spot analysis tool is employed to analyze flood exposure, road vulnerability, and commuting loss and we finally integrated them. Spatial distribution inconsistency of hot spots for flood exposure, road vulnerability, and commute loss was identified, and these areas need to take different measures according to the local damage characteristics. This article examined road vulnerability and commute loss under floods, which can provide a decision-making basis for disaster prevention and mitigation, emergency management, and urban planning in the context of climate change.
Data availability statement
The data analyzed in this study are subject to the following licenses/restrictions. The original data are confidential and we have signed a confidentiality agreement with the data holder for scientific analysis only. Requests to access these datasets should be directed to huiting_chen@whu.edu.cn.
Author contributions
YL: conceptualization, writing—reviewing and editing, and supervision. HZ: methodology, writing—reviewing and editing, visualization, and validation. HC: conceptualization, methodology, writing—original draft, and software. CC: methodology, software, and visualization.
Funding
This research was financially supported by the National Key Research and Development Program of China (No. 2017YFB0503601).
Conflict of interest
The authors declare that the research was conducted in the absence of any commercial or financial relationships that could be construed as a potential conflict of interest.
Publisher’s note
All claims expressed in this article are solely those of the authors and do not necessarily represent those of their affiliated organizations, or those of the publisher, the editors, and the reviewers. Any product that may be evaluated in this article, or claim that may be made by its manufacturer, is not guaranteed or endorsed by the publisher.
Supplementary material
The supplementary material for this article can be found online at: https://www.frontiersin.org/articles/10.3389/fenvs.2022.1056854/full#supplementary-material
References
Aghababaei, M. T. S., Costello, S. B., and Ranjitkar, P. (2021). Measures to evaluate post-disaster trip resilience on road networks. J. Transp. Geogr. 95, 103154. doi:10.1016/j.jtrangeo.2021.103154
An, R., Wu, Z., Tong, Z., Qin, S., Zhu, Y., and Liu, Y. (2022). How the built environment promotes public transportation in Wuhan: A multiscale geographically weighted regression analysis. Travel Behav. Soc. 29, 186–199. doi:10.1016/j.tbs.2022.06.011
Balijepalli, C., and Oppong, O. (2014). Measuring vulnerability of road network considering the extent of serviceability of critical road links in urban areas. J. Transp. Geogr. 39, 145–155. doi:10.1016/j.jtrangeo.2014.06.025
Berdica, K. (2002). An introduction to road vulnerability: What has been done, is done and should be done. Transp. Policy 9 (2), 117–127. doi:10.1016/S0967-070X(02)00011-2
Birch, E. L. (2014). A Review of “ climate change 2014: Impacts, adaptation, and vulnerability ” and “ climate change 2014: Mitigation of climate change. J. Am. Plan. Assoc. 80 (2), 184–185. doi:10.1080/01944363.2014.954464
Borowska-Stefańska, M., Domagalski, A., and Wiśniewski, S. (2018). Changes concerning commute traffic distribution on a road network following the occurrence of a natural disaster – the example of a flood in the Mazovian Voivodeship (Eastern Poland). Transp. Res. Part D Transp. Environ. 65, 116–137. doi:10.1016/j.trd.2018.08.008
Borowska-Stefańska, M., and Wiśniewski, S. (2018). Changes in transport accessibility as a result of flooding: A case study of the Mazovia Province (eastern Poland). Environ. hazards 17 (1), 56–83. doi:10.1080/17477891.2017.1343177
Cao, Y., Cao, Y., Li, G., Tian, Y., Fang, X., Li, Y., et al. (2020). Linking ecosystem services trade-offs, bundles and hotspot identification with cropland management in the coastal Hangzhou Bay area of China. LAND USE POLICY 97, 104689. doi:10.1016/j.landusepol.2020.104689
Casali, Y., and Heinimann, H. R. (2019). A topological characterization of flooding impacts on the Zurich road network. PLoS One 14 (7), e0220338. doi:10.1371/journal.pone.0220338
Chen, C., Jiang, J., and Li, M. (2016). Jiyu SHUILIMOXING DE QINGSHAN HAOMIANSHIFANQU PAISHUI FANGLAO FENGXIAN PINGGU. CHINA WATER& WASTEWATER 17, 105–108. doi:10.19853/j.zgjsps.1000-4602.2016.17.023
Chen, X., Lu, Q., Peng, Z., and Ash, J. E. (2015). Analysis of transportation network vulnerability under flooding disasters. Transp. Res. Rec. 2532 (1), 37–44. doi:10.3141/2532-05
Chung, Y. (2012). Assessment of non-recurrent congestion caused by precipitation using archived weather and traffic flow data. Transp. Policy 19 (1), 167–173. doi:10.1016/j.tranpol.2011.10.001
Coles, D., Yu, D., Wilby, R. L., Green, D., and Herring, Z. (2017). Beyond ‘flood hotspots’: Modelling emergency service accessibility during flooding in York, UK. J. HYDROLOGY 546, 419–436. doi:10.1016/j.jhydrol.2016.12.013
Debionne, S., Ruin, I., Shabou, S., Lutoff, C., and Creutin, J. (2016). Assessment of commuters’ daily exposure to flash flooding over the roads of the Gard region, France. J. HYDROLOGY 541, 636–648. doi:10.1016/j.jhydrol.2016.01.064
Demirel, H., Kompil, M., and Nemry, F. (2015). A framework to analyze the vulnerability of European road networks due to Sea-Level Rise (SLR) and sea storm surges. Transp. Res. Part A Policy Pract. 81, 62–76. doi:10.1016/j.tra.2015.05.002
El-Rashidy, R. A., and Grant-Muller, S. M. (2014). An assessment method for highway network vulnerability. J. Transp. Geogr. 34, 34–43. doi:10.1016/j.jtrangeo.2013.10.017
Fu, G., Dawson, R., Khoury, M., and Bullock, S. (2014). Interdependent networks: Vulnerability analysis and strategies to limit cascading failure. Eur. Phys. J. B 87 (7), 148. doi:10.1140/epjb/e2014-40876-y
Hauer, M., Mueller, V., Sheriff, G., and Zhong, Q. (2021a). More than a nuisance: Measuring how sea level rise delays commuters in Miami, FL. Environ. Res. Lett. 16 (6), 064041. doi:10.1088/1748-9326/abfd5c
Hauer, M., Mueller, V., Sheriff, G., and Zhong, Q. (2021b). More than a nuisance: Measuring how sea level rise delays commuters in Miami, FL. Environ. Res. Lett. 16 (6), 064041. doi:10.1088/1748-9326/abfd5c
He, Y., Thies, S., Avner, P., and Rentschler, J. (2021a). Flood impacts on urban transit and accessibility—a case study of Kinshasa. Transp. Res. Part D Transp. Environ. 96, 102889. doi:10.1016/j.trd.2021.102889
He, Y., Thies, S., Avner, P., and Rentschler, J. (2021b). Flood impacts on urban transit and accessibility—a case study of Kinshasa. Transp. Res. Part D Transp. Environ. 96, 102889. doi:10.1016/j.trd.2021.102889
Hu, Y., and Downs, J. (2019). Measuring and visualizing place-based space-time job accessibility. J. Transp. Geogr. 74, 278–288. doi:10.1016/j.jtrangeo.2018.12.002
Hubei, F. (2013). Planning and design standards of Wuhan drainage and waterlogging prevention. System. Available at: http://gtghj.wuhan.gov.cn/UploadFile/20131030025327433.pdf.
Jenelius, E., Petersen, T., and Mattsson, L. (2006). Importance and exposure in road network vulnerability analysis. Transp. Res. Part A Policy Pract. 40 (7), 537–560. doi:10.1016/j.tra.2005.11.003
Jie, Y., Yu, D., Zhane, Y., Min, L., and Qing, H. (2016). Evaluating the impact and risk of pluvial flash flood on intra-urban road network; a case study in the city center of Shanghai, China. J. hydrology (Amsterdam) 537, 138–145. doi:10.1016/j.jhydrol.2016.03.037
Kasmalkar, I. G., Serafin, K. A., Miao, Y., Bick, I. A., Ortolano, L., Ouyang, D., et al. (2020a). When floods hit the road: Resilience to flood-related traffic disruption in the San Francisco Bay Area and beyond, 6. doi:10.1126/sciadv.aba2423
Kasmalkar, I. G., Serafin, K. A., Miao, Y., Bick, I. A., Ortolano, L., Ouyang, D., et al. (2020b). When floods hit the road: Resilience to flood-related traffic disruption in the San Francisco Bay Area and beyond. Sci. Adv. 6 (32), a2423. doi:10.1126/sciadv.aba2423
Keeler, A. G., McNamara, D. E., and Irish, J. L. (2018). Responding to sea level rise: Does short-Term risk reduction Inhibit Successful long-Term adaptation? Earth's. Future 6 (4), 618–621. doi:10.1002/2018EF000828
Kendon, E. J., Roberts, N. M., Senior, C. A., and Roberts, M. J. (2012). Realism of rainfall in a very high-resolution regional climate model. J. Clim. 25 (17), 5791–5806. doi:10.1175/JCLI-D-11-00562.1
Liu, J., Shi, Z., and Tan, X. (2021). Measuring the dynamic evolution of road network vulnerability to floods: A case study of Wuhan, China. Travel Behav. Soc. 23, 13–24. doi:10.1016/j.tbs.2020.10.009
Lu, X., Yang, S., Ye, T., An, R., and Chen, C. (2021). A new approach to estimating flood-affected populations by combining mobility patterns with multi-source data: A case study of Wuhan, China. Int. J. Disaster Risk Reduct. 55, 102106. doi:10.1016/j.ijdrr.2021.102106
Mattsson, L., and Jenelius, E. (2015). Vulnerability and resilience of transport systems – a discussion of recent research. Transp. Res. Part A Policy Pract. 81, 16–34. doi:10.1016/j.tra.2015.06.002
Moriasi, D. N., Arnold, J. G., Van Liew, M. W., Bingner, R. L., Harmel, R. D., and Veith, T. L. (2007). Model evaluation GUIDELINES for SYSTEMATIC QUANTIFICATION OF accuracy IN WATERSHED simulations. Trans. ASABE 50 (3), 885–900. doi:10.13031/2013.23153
People'SgovernmentofHubeiProvince, (2016). As at 10 : 00 on july 6. Wuhan. ' s Wkly. rainfall Exceed. its Hist. maximum, 23. Available at: http://www.hubei.gov.cn/zwgk/bmdt/201607/t20160706_860661.shtml.
Pregnolato, M., Ford, A., Wilkinson, S. M., and Dawson, R. J. (2017). The impact of flooding on road transport: A depth-disruption function. Transp. Res. Part D Transp. Environ. 55, 67–81. doi:10.1016/j.trd.2017.06.020
Pyatkova, K., Chen, A. S., Butler, D., Vojinović, Z., and Djordjević, S. (2019). Assessing the knock-on effects of flooding on road transportation. J. Environ. Manag. 244, 48–60. doi:10.1016/j.jenvman.2019.05.013
Saaty, T. L. (1980). The analytic hierarchy process: Planning, priority setting, resource allocation. Eur. J. Oper. Res. 9, 97–98. doi:10.1016/0377-2217(82)90022-4
Shah, S. M. H., Mustaffa, Z., Martinez-Gomariz, E., Kim, D. K., and Yusof, K. W. (2021). Criterion of vehicle instability in floodwaters: Past, present and future. Int. J. river basin Manag. 19 (1), 1–23. doi:10.1080/15715124.2019.1566240
Sharma, I., and Chandel, M. K. (2020). Impact of past rainfall events on the urban transport sector of the Mumbai Metropolitan region: Current and future Projections under BAU scenario. Transp. Dev. Econ. 6 (2), 13. doi:10.1007/s40890-020-00104-1
Sidek, L. M., Jaafar, A. S., Majid, W. H. A. W., Basri, H., Marufuzzaman, M., Fared, M. M., et al. (2021). High-resolution hydrological-Hydraulic modeling of urban floods using InfoWorks ICM. Sustainability 13 (18), 10259. doi:10.3390/su131810259
Singh, P., Sinha, V. S. P., Vijhani, A., and Pahuja, N. (2018). Vulnerability assessment of urban road network from urban flood. Int. J. Disaster Risk Reduct. 28, 237–250. doi:10.1016/j.ijdrr.2018.03.017
Tsang, M., and Scott, D. M. (2020). An integrated approach to modeling the impact of floods on emergency services: A case study of Calgary, Alberta. J. Transp. Geogr. 86, 102774. doi:10.1016/j.jtrangeo.2020.102774
Wang, J., Qin, S., Xiang, W., Kan, C., and Yan, H. (2021). Tongqin Tezheng Shuju Queding Fangfa, Zhuangzhi, Dianzi Shebei and Cunchu Jiezhi No. 202110501129.0.
Zhiqiang, L. (2016). Experts Interpret the Causes of frequent Flood in Wuhan. BeijingNews. Retreved Sep 20 from http://www.xinhuanet.com//politics/2016-07/07/c_129123063.htm.
Xiong, Y., and Melching, C. (20052005). Comparison of Kinematic-Wave and nonlinear reservoir routing of urban Watershed runoff. J. Hydrol. Eng. 10 (24), 39–49. 10:1(39). doi:10.1061/(asce)1084-0699(2005)10:1(39)
Yang, Y., Ng, S. T., Zhou, S., Xu, F. J., and Li, H. (2019). A physics-based framework for analyzing the resilience of interdependent civil infrastructure systems: A climatic extreme event case in Hong Kong. Sustain. Cities Soc. 47, 101485. doi:10.1016/j.scs.2019.101485
Zhang, Y., Liu, Y., Jin, M., Jing, Y., Liu, Y., Liu, Y., et al. (2019). Monitoring land Subsidence in Wuhan city (China) using the SBAS-InSAR method with Radarsat-2 Imagery data. Sensors (Basel) 19 (3), 743. doi:10.3390/s19030743
Keywords: urban flood, flood mapping, road vulnerability, commute simulation, location-based service (LBS) data
Citation: Liu Y, Zhang H, Chen H and Chen C (2022) Flood impact on urban roads and commuting: A case study of Wuhan, China. Front. Environ. Sci. 10:1056854. doi: 10.3389/fenvs.2022.1056854
Received: 29 September 2022; Accepted: 26 October 2022;
Published: 11 November 2022.
Edited by:
Ding Ma, Shenzhen University, ChinaCopyright © 2022 Liu, Zhang, Chen and Chen. This is an open-access article distributed under the terms of the Creative Commons Attribution License (CC BY). The use, distribution or reproduction in other forums is permitted, provided the original author(s) and the copyright owner(s) are credited and that the original publication in this journal is cited, in accordance with accepted academic practice. No use, distribution or reproduction is permitted which does not comply with these terms.
*Correspondence: Huiting Chen, aHVpdGluZ19jaGVuQHdodS5lZHUuY24=