 Chunyuan Dong
 Rongrong Qiao2
 Lihui Luo
 Xueli Chang
- 1School of Resources and Environmental Engineering, Ludong University, Yantai, China
- 2School of Life Sciences, Nanjing University, Nanjing, China
- 3Northwest Institute of Eco-Environment and Resources, Chinese Academy of Sciences, Lanzhou, China
Remote sensing ecological index (RSEI) has the advantages of rapid, repeatable and relatively accurate in regional eco-environment quality assessment. Due to the lack of consideration of the interaction of adjacent analysis units in RSEI calculation, there is a few uncertainties in the assessment results. Based on RSEI, the landscape diversity index (LDI) was introduced, which considered the heterogeneity caused by the difference between the assessment unit and the adjacent one, and rebuilt modified remote sensing ecological index (MRSEI) to evaluate the eco-environment quality in the artificial oasis of Ningxia section of Yellow River. The results showed that the area of Fair and Poor grades in the low MRSEI year (2000) was greater than that of other grades, and the area of Moderate and Fair grades was greater than that of other grades in the high MRSEI year (2020). The conversion characteristics of different grades were Poor and Fair grades to adjacent high grades. During the study period, the eco-environment quality of the study area was improved, and the composition and pattern of land use types had a significant impact on MRSEI. Introduction of LDI-improved MRSEI can not only include the heterogeneous effect between the analysis unit and the adjacent one, but also consider the spatial scale effect of LDI to make the evaluation results more credible. However, some evaluation factors of RSEI and MRSEI (e.g., LDI, NDVI, and NDBSI) represent the accumulation of surface status over long-time scales, while others (e.g., Wet and LST) reflects only short-time scale features of the land surface. Therefore, how to eliminate the uncertainty caused by temporal scale mismatch is a challenge for RSEI and MRSEI applications.
1 Introduction
Regional eco-environmental quality is directly affected by local natural resources and human exploitation system, and the amplification effect of human activity intensity on eco-environmental quality is very significant. Especially in developing countries with the largest land area in the world and rapid industrialization and urbanization, the rate of change of land use/cover has greatly influenced regional or global climate and environmental change (Yang et al., 2020; Mukesh et al., 2021). In recent decades, using satellite remote sensing data and geographic information systems to extract and analyze land surface information is a very common and effective method to rapidly assess regional eco-environmental quality (Ellis, et al., 2006; Willis, 2015). Thus, these data are used to identify basic ecosystem properties and to judge their different components, such as leaf area index, aboveground biomass, and land cover type (Reza and Abdullah, 2011; de Araujo Barbosa et al., 2015), and these techniques have also been widely used in ecological and environmental surveys in China and other parts of the world (Tilt et al., 2007; Chen, et al., 2014; Kennedy et al., 2014; Willis, 2015; White et al., 2016). Various remote sensing ecological indicators play an important role in quantifying and mapping the characteristics and functions of ecosystems. In these findings, methodologies typically focus on only one aspect of the eco-environment and then produce a single ecological factor for evaluation (Nichol, 2009). For example, normalized differential vegetation index (NDVI), leaf area index (LAI), normalized differential water index (NDWI), and light index (LI) have been used to describe spatiotemporal changes in vegetation, biodiversity, water bodies, bare land, and cities (Choudhary et al., 2019; Kappas and Propastin 2012; Fu et al., 2013). Especially in the pattern analysis of land surface temperature (LST), it was found that the heat island effect in Leipzig (Germany), was more reliable in densely urbanized areas than in areas with low population density (Schwarz et al., 2012). The sandy vegetation pattern in Horqin (China) was negatively correlated with land surface temperature, and the more complex the vegetation structure, the closer the correlation (Qiao et al., 2021). These studies are of great significance for carrying out more targeted ecological restoration work, and are also the current hotspots for quantitatively describing and estimating the spatio-temporal dynamics of eco-environmental quality and promoting sustainable development in different regions.
After the improvement of a single remote sensing index for the evaluation of a certain land surface attribute state, combined with pressure-state-response (PSR) model and analytic hierarchy process (AHP), a method of comprehensively using multiple remote sensing indicators to determine regional eco-environmental quality has been formed (Fulton Elizabeth, 2010; Yu and Hong, 2022; Tom´as et al., 2004; Patrício et al., 2016). In this method, structure construction and factor weight distribution are the key. Because the factor weight system must contain subjective weight, and expert knowledge and experience such as AHP must be integrated into the analysis process (Zhao et al., 2016), which is not conducive to the rapid evaluation of the eco-environmental quality of a certain region. The multi-dimensional and multi-feature technology developed in the past decade has shown great advantages in regional eco-environmental quality assessment (Boori et al., 2018; Xu et al., 2018; Wu et al., 2020). In particular, Xu (2013) proposed the Remote Sensing Ecological Index (RSEI), which integrates four calculated indicators based on remote sensing bands to represent four major ecological elements (NDVI; Wet; NDBSI; LST), and principal component analysis (PCA) based on covariance was used to determine the comprehensive contribution of the four factors to eco-environmental quality. The effectiveness of the proposed method was evaluated in different landscape types, such as urban landscape, alpine grassland landscape, Loess Plateau landscape and agricultural and forestry mixed with water landscape. (Hu and Xu, 2018; Liu et al., 2019; Sun et al., 2020; Yuan, et al., 2021). However, two problems in RSEI have attracted the attention of researchers (Yuan, et al., 2021). One is that RSEI calculated based on grid data cannot express the differences caused by homogeneity (or heterogeneity) of adjacent grids. Secondly, the evaluation factors used by RSEI usually have a high correlation with each other, and NDVI has the highest eigenvalue on PC1, which leads to some contradictions in comparing RSEI results in ecological interpretation of different multi-ecosystems landscapes. That is, the area with the dominant agricultural land ecosystem may obtain a higher RSEI value. So how do you avoid these problems in your RSEI evaluation? The introduction of landscape diversity index (LDI) may be an appropriate method to correct the above deficiency, because the calculation of LDI takes into account the differences of basic unit attributes within a certain scale. At the same time, there are a large number of shared and paid resources to choose from land cover interpretation products based on Landsat data, and there are also some landscape analysis software to calculate LDI, such as PCA.
If LDI is added to modify RSEI (MRSEI), the first problem to be solved is to determine the appropriate scale, that is, to obtain the scale-dependent characteristics of LDI (Li et al., 2018; Liang and Li, 2018; Yang, et al., 2021). Previous studies have shown that there are differences in scale dependence between similar or different landscape areas. Therefore, identifying the scale dependence of LDI in the study area is the basis of landscape analysis.
In terms of the practical significance of eco-environmental quality assessment, there is no doubt that AHP, RSEI or MRSEI, are not only meaningful in theory for judging the status and change trend of eco-environmental quality in the study area, but also an important means for regional sustainable development planning, management and evaluation in practice. For example, the RSEI study for different geographical units and types such as watersheds (Gao and Zhang, 2021; Luo et al., 2022) and National Nature Reserve (Liu et al., 2019) show great practical significance. The Yellow River Oasis Area in Ningxia Hui Autonomous Region is densely covered with lakes and wetlands, and is the core area of the National Yellow River Economic Zone, as well as the key area of ecological function zoning. How the regional environment changes have attracted much attention from the state and local governments, and how to implement the rapid and effective environmental quality assessment of artificial oasis is a challenge for the academic community.
Here, we used MRSEI method to evaluate the changes of the oasis of Ningxia section of the Yellow River in recent decades by increasing the LDI factor, to identify the main driving factors, and to evaluate the value of MRSEI in the analysis of eco-environmental quality.
2 Materials and methods
2.1 Study area
The oasis in Ningxia section of the Yellow River is located in the northern part of Ningxia Hui Autonomous Region, which ranges from 37°20′ ∼ 39°20′ N, 105°0′ ∼ 107°0′E, and an area of about 10,831.3 km2. The core area of Ningxia section of the Yellow River is an artificial oasis composed of the Weining and the Yinchuan irrigation district connected by the Yellow River, with oases areas accounting for more than 60% (Figure 1). Farmland, lakes and wetlands are densely distributed in the study area. The main irrigation channels are longitudinally distributed east trunk Canal, west trunk canal, Han Yan Canal, Tang Lai Canal and so on. The soil is mainly alluvial soil and meadow soil. The natural vegetation is mainly date forest scattered shrub woddland, composed of Elaeagnus angustifolia, Lycium chinense, Tamarix chinensis and Phragmites communis and so on. This area is the core area of the national Yellow Economic Zone, and also the key area of China’s national ecological function zoning.
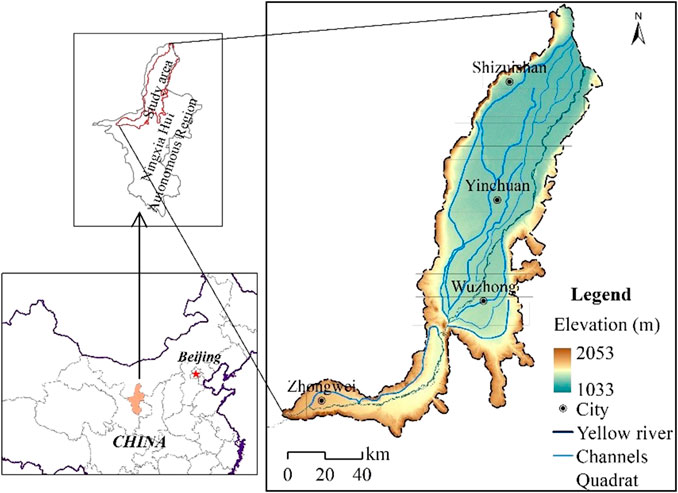
FIGURE 1. Location of the study area.
2.2 Satellite data and pre-processing
Conventional Landsat imagery has been widely used for large-scale and periodic ecological monitoring (e.g., NDVI and LU). Using a shared dataset supported by the U.S. Geological Survey (USGS), including the Landsat data Collection, 2 Tier 1 and Top of atmospheric (TOA) Reflectance (https://earthengine.google.com/), the spatial resolution of the data of 30 m. Data were preprocessed with atmospheric and geometric corrections. To ensure the similarity of vegetation growth conditions and the comparability of ecological results, the data were collected from July 5 to 22 August 2000 and August 19 to 28 August 2020, respectively. Since the study area involved three images (129,033, 129,034 and 130,034), the data of Landsat 5 TM and Landsat 8 OLI were selected to be concatenated into one image, respectively.
Land use (LU) data were obtained from the Data Center for Resources and Environmental Sciences, Chinese Academy of Sciences (Chen, et al., 2014; Zhang. 2020). The study area involved eight types of land surfaces, including cultivated land, woodland, shrub, grassland, wetland, water body, urban and built-up areas, and wasteland, with the overall interpretation accuracy (Kappa coefficient) ranging from .78 to .82 (https://www.resdc.cn/).
2.3 Identification of LDI threshold
LDI is an indicator to measure the number of landscape composition types and the proportion of its area information in landscape ecology research, and is also the main level of biodiversity research. A higher LDI means a higher diversity of ecosystem types in the study area. Therefore, LDI is credible as an assessment factor for eco-environmental quality. Here, the LDI is represented by Shannon-Weiner index and calculated in the neighborhood analysis method of ArcGIS. It can be computed using the following equation:
where Pi is the proportion of a certain land use type to the area of the analysis unit. A quadrat gradient as 90 m × 90 m, 300 m × 300 m, 600 m × 600 m, 900 m × 900 m, 1200 m × 1200 m, 1500 m × 1500 m, 3000 m × 3,000 m, 4500 m × 4500 m and 6000 m × 6000 m was used to calculate the scale-dependent characteristics and thresholds of LDI in 2000 and 2020, respectively.
2.4 Assessment factor normalization and MRSEI calculations
The calculation methods of NDVI, WET, NDBSI, and LST in this study are consistent with the literature (Yuan et al., 2021). Since the MRSEI assessment takes grid as the basic unit, it does not consider the influence of the diversity of adjacent units, and ignores the girds are not only affected by the influence factor of the same spatial domain, but also have a significant effect between adjacent units, that is, the edge effects phenomenon in ecology. To compensate for this shortcoming in MRSEI, we added the LDI factor to RSEI and renamed it as MRSEI. Due to the differences in unit and quantity sizes of the input factors, normalization is required to unify the index values between 0 and 1. In this paper, the forward normalization (Eq. 2) method is used for standardization.
In Eq. 2, F represents the input factor, and i represents LDI, NDVI, WET, NDBSI, and LST, respectively; X represents the input factor cell value. After the evaluative factors were normalized, MRSEI was calculated using Eq. 3:
where MRSEI is a modified remote sensing ecological index, and the larger the MRSEI value, the better the eco-environment; Vice versa. N represents the number of components whose principal component eigenvalues accumulate to more than 90%. In MRSEI analysis, the input factor is 5, therefore, 1 ≤ i ≤ 5 (i is an integer). EVi and ETi are ith eigenvalues and accumulative eigenvalues of eigenvectors, respectively. In order to make the MRSEI values of different years comparable, the calculated MESEI was normalized again with a positive difference of the range to unify them between 0 and 1. The spatial heterogeneity analysis of MRSEI was based on the classification and treated by the equivalent interval method, which was defined as: poor (0–.2), fair (.2–.4), moderate (.4–.6), good (.6–.8), and excellent (.8–1.0).
The entire MRSEI of study area can be calculated by Eq. 4:
where Mi is the average MRSEITotal of Class i grades in the assessment area, and PAi is the relative area of MRSEITotal Class i grades in the assessment area. Statistical analysis was done with SPSS and Excel. The correlation coefficients of different evaluation factors were examined for R significance. The thresholds were R4, .05 = .811 and R4, .01 = .917, respectively.
2.5 Relationship between MRSEI and land use type
The MRSEI was obtained by calculating landscape diversity index (LDI), greenness (NDVI), humidity (WET), dryness (NDBSI) and heat (LST). The impact of these five factors on MRSEI was direct. In regional MRSEI determination, land use type will indirectly affect all factors involved in MRSEI, especially in MRSEI analysis on time series. Therefore, unary multiple linear regression was used to calculate the impact of LU on MRSEI after completing MRSEI analysis. The regression analysis took MRSEI as the dependent variable, and the area of the eight land use types mentioned above as the dependent variable. Stepwise linear regression was used for optimization selection, and the model with the highest significance was selected. Due to the large area of various land use types, range normalization was carried out before modeling so that all dependent variables fell into (0–1).
In order to test the accuracy of the regression model constructed by LU, standard error (SE) and mean error coefficient (MEC) were selected to test the model. A total of 10 test samples were distributed in parallel throughout the study area (Figure 1).
The calculation formula is as follows:
where y is the MRSEI calculated value based on the PCA method, y' is estimated using the obtained optimized regression model and LU data, and n is the number of validated samples.
3 Results
3.1 The scale dependent threshold for the LDI
The LU in the two periods were analyzed, and the average value of LDI was calculated to determine the scale dependence. It was found that there was a significant trend described by quadratic equation (p < .001 R > .990). The inflection point of LDI change could be captured within the range of 6,000 m (at 3,000 m, in the ellipse in Figure 2). When the analytical scale was smaller than the inflection point scale, the LDI showed a steep increase trend. When the analysis scale was larger than the inflection point scale, LDI showed a gentle increasing trend. Therefore, the basic unit of 3,000 m × 3,000 m was used to calculate the LDI in this paper. After the calculation, the LDI was resampled to 30 m × 30 m in order to be consistent with the other three indexes in resolution.
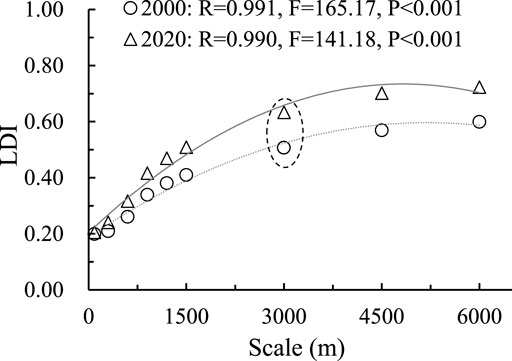
FIGURE 2. Scale dependent characteristics of LDI.
3.2 Relationship between evaluation factors for PCA
After the introduction of LDI, the original relationship and degree of association of MRSEI evaluation factors did not change (Table 1), and NDVI and WET were also kept in the same group, and the load vector in PC1 component was positive, which was the driving factor for the improvement of eco-environmental quality (Table 2). NDBSI and LST belong to the same group, and the load vector was negative in PC1 component, which was the driving factor of eco-environmental quality deterioration. The between-group positive association and between-group negative association were also unchanged. Except for the correlation between NDVI and LST in 2000, all the other combinations had high significance. It should be emphasized that the correlation between LDI and other factors was low, and the maximum correlation coefficient (absolute value) of the 2 years did not exceed .298. LDI increased the dimensions of eco-environmental quality assessment and made the results more inclusive.
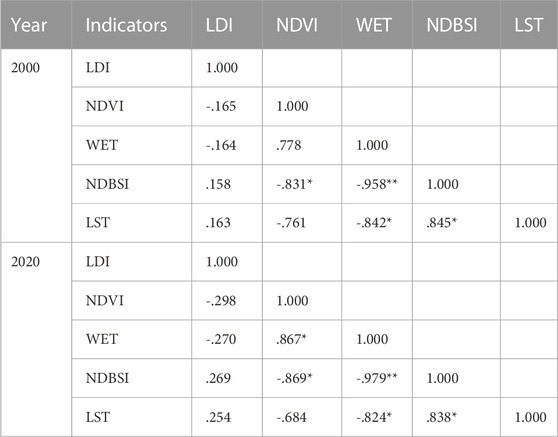
TABLE 1. Pearson correlation semi-matrix of evaluative indicators in 2000 and 2020 (* and **: Two tails check is significant at the level of .05 and .01 levels respectively).
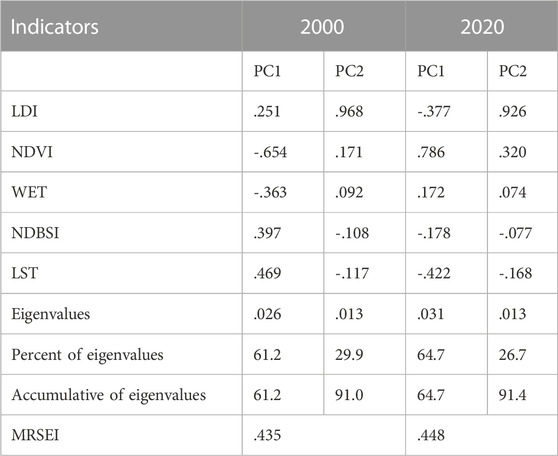
TABLE 2. The results of principal component analysis of five evaluation factors in 2000 and 2020.
The PCA results in 2000 and 2020 showed (Table 2) that the cumulative contribution rate of PC1 and PC2 exceeded 90% after dimensionality reduction analysis of the five evaluation factors. Among them, the maximum load vectors of PC2 axis were LDI, which were .968 and .926 respectively, far exceeding other evaluation factors, indicating that LDI maintains multi-dimensional representation.
From the relationship between MRSEI and PC1 and PC2 (Figure 3), when the cumulative contribution rate exceeded 90% and the number of components was 2, the change of MRSEI showed complexity. At the overall level, the NDVI of MRSEI in PC1 component was .285 (±.216), and the LDI of MRSEI in PC2 component was .386 (±.141). The lowest region of MRSEI changes formed by the two components appeared in the high value region of PC1 component and the low-quality region of PC2 component (lower right corner of Figure 3), while the high value region appeared in the low value region of PC1 component and the high-quality region of PC2 component (upper left corner of Figure 3). In 2020, the dominant NDVI in PC1 component was .451 (±.281), and the dominant LDI in PC2 component was .468 (±.181). The lowest MRSEI change region formed by the two components appeared in the low-quality region of PC1 and PC2 components (lower left corner of Figure 3). However, the high value area appeared in the intersection area of high value of PC1 and PC2 components (upper right corner of Figure 3). The obvious trend was that when the MRSEI changed from the low MRSEI in 2000 to the high MRSEI in 2020 (Figure 4), MRSEI showed a change trend of rotation to the right with its value center as the axis. The ecological interpretation was as follows: the resultant force of evaluation factor in the state of regional average had a relatively stable median MRSEI value; When the regional eco-environment changed for the better (from 2000 to 2020), the distribution of the low value of MRSEI was restricted by the high value of the component controlled by NDVI and the low value of the component controlled by LDI, and transformed to the low value of the component controlled by them. On the contrary, the MRSEI high value distribution was restricted by the low value of the component controlled by NDVI and the high value of the component controlled by LDI, and converted to the high value of the component controlled by them.
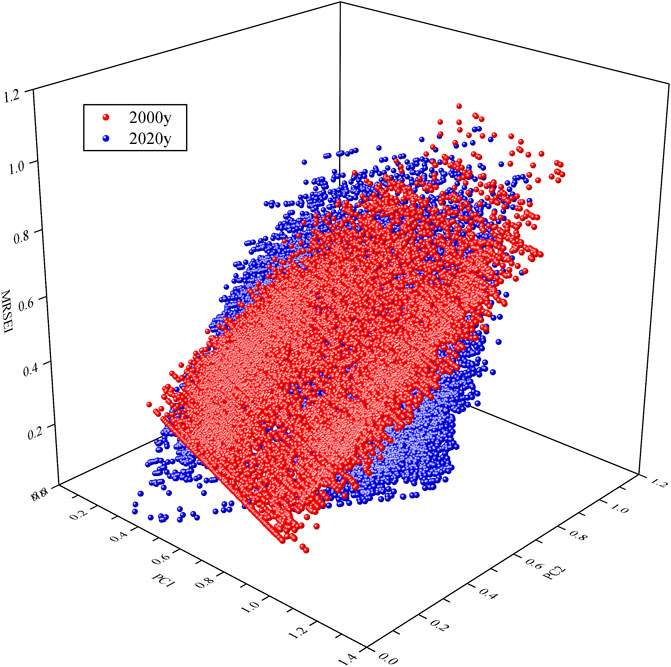
FIGURE 3. A 3D-scatter plot showing the relationship among MRSEI, PC1 and PC2 (red balls, 2000; blue balls, 2020).
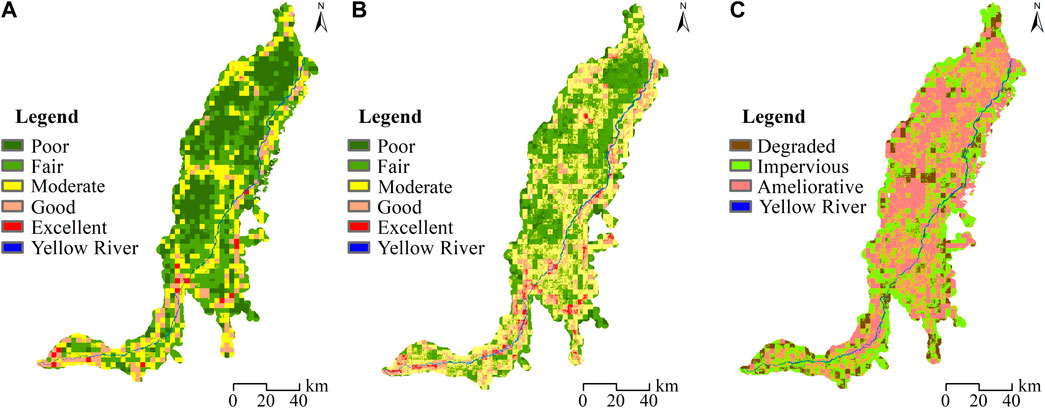
FIGURE 4. Spatial distribution of different MRSEI grades along the Yellow River Oasis in Ningxia [(A), MRSEI of 2000; (B), MRSEI of 2020; (C), change from 2000 to 2020].
According to above mention, it could be inferred that in the process of improving eco-environmental quality in the multi-ecosystems region, under the certain condition of PC2 (dominated by LDI), the effect of PC1 (dominated by NDVI) on MRSEI changed from a decreasing to an increasing trend with the increase of PC1. The distribution range of MRSEI high value changed from .4–.6 of PC1 in 2000 to .6–.8 in 2020. However, the effect of PC2 on MRSEI was obviously different, and its effect was increasing during this period. The high value region of MRSEI was consistent with that of PC2. This is very obvious during the improvement of MRSEI in the study area, the influence of NDVI on MRSEI varied greatly, while the influence of LDI on MRSEI was relatively stable.
3.3 Ecological quality status and hierarchical pattern
According to the spatial distribution analysis of MRSEI classification pattern, in the 2 years of the study, the areas with high eco-environmental quality were mainly distributed near the boundary of the study area and the two banks of the Yellow River (Figures 4A,B), indicating that the artificial oasis area in the semi-arid region had obvious boundary effect on a large scale. In time (Table 3), in 2000, the Fair and Poor areas with low eco-environmental quality were relatively large, which were 3,911.1 km2 and 3,138.3 km2, accounting for 65.1% of the total area. On the contrary, the areas of Good and Excellent grades with high eco-environmental quality were relatively small, which were 1,109.4 km2 and 132.2 km2 respectively, accounting for only 11.5% of the total area. In 2020, the area of Fair level increased to 4,233.1 km2, but the area of Poor level decreased greatly, only 631.9 km2 remained, and the area of low-level ecological quality accounted for 44.9% of the total area. On the contrary, the areas of Good and Excellent, which had high eco-environmental quality, increased to 1,544.2 km2 and 185.1 km2, respectively, accounting for 16.0% of the total area. The Moderate level increased by 15.7 percent from 2,539.7 km2 in 2000 to 4,236.4 km2 in 202.
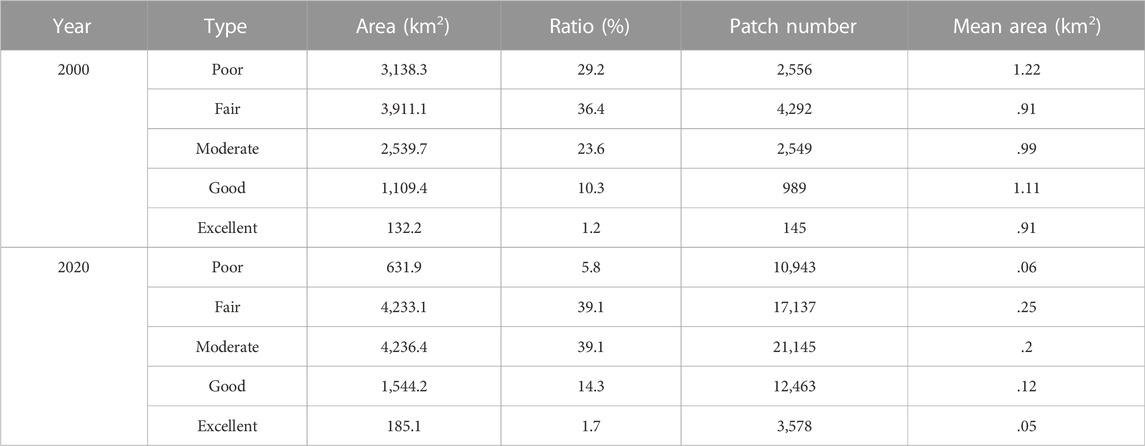
TABLE 3. The status of different MRSEI grades in 2000 and 2020.
From 2000 to 2020, the number and average patch area of different grades showed an obvious increasing trend. Factor analysis in the above section showed that the overall levels of NDVI and LDI in 2000 were lower than those in 2020, indicating that the classification pattern of MRSEI tended to be fragmented during the study period (Table 3). For details of the excellent level, its area was distributed over a total area of 132.2 km2 in 2000 to 185.1 km2 in 2020, but the average patch area decreased from .91 km2 to .05. km2. This phenomenon indicates that the excellent area in the study area had changed from concentrated continuous distribution to scattered distribution, which can be seen from Figures 4A, B, and most of the intact excellent areas (grids) in 2000 are fragmented in 2020.
From 2000 to 2020, the eco-environmental quality changed towards good. The improved type was the main body in the middle and upper part of the study area, and the impervious type was the main body in the lower part of the study area (Figure 4C). The improved and impervious area were 5,423.5 km2 and 4,357.7 km2 respectively, accounting for 9.3% of the total area, while the area of the degraded area was only 1,049.6 km2, accounting for less than 10% (Table 4). For the details of the changes (Figure 5), the Poor grade was mainly characterized by the transformation to Fair and Moderate grades, which were 2034.0 km2 and 576.6 km2, respectively. The general grade was characterized by transformation to Moderate grade and good grade, which were 1779.3 km2 and 201.6 km2, respectively. The moderate grade was mainly transformed to moderate grade and good grade, which were 391.6 km2 and 617.0 km2, respectively. The good grade was mainly transformed to moderate grade, which were 377.5 km2. The excellent grade increased from 129.9 km2 in 2000 to 185.0 km2 in 2020, mainly from the “moderate” and “good” grades. The quality of eco-environment has been improved not only at the whole area scale, but also at the patch scale.
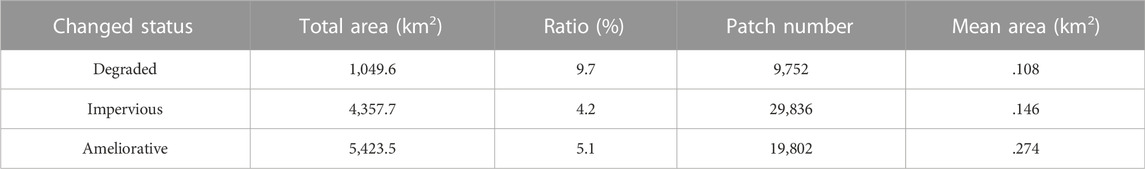
TABLE 4. Change results of different MRSEI grades from 2000 to 2020.
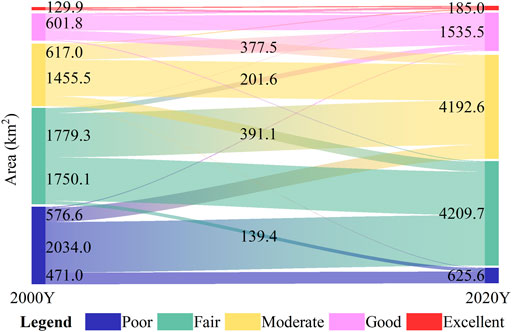
FIGURE 5. The details of transferred area of different MRSEI grades during 2000–2020 in the oasis of Ningxia section of the Yellow River.
From the perspective of driving forces of the transformation mechanism during 2000–2020, LU change under the guidance of policies such as urbanization process, eco-environmental protection measures and adjustment of agricultural planting structure pattern is the main driving force of MRSEI transformation.
3.4 Effect of LU composition on MRSEI
The composition and pattern of LU types are affected by evaluation factors such as NDVI and LDI, which in turn affect MRSEI. Therefore, LU types affect MRSEI. Forward stepwise linear regression analysis showed that the relationship between oasis MRSEI and LU types in the oasis of Ningxia section of the Yellow River was different in different years (Table 5). In the year with low MRSEI levels (2000), there was a significant multivariate linear relationship between MRSEI and the variables (LU type) such as grassland, shrubland, artificial surface and barren land area. The regression equation was MRSEI 2000 = .348–.245 grassland +2.943 shrubs +.678 urban land and built-up land +2.368 wasteland (R2 = .925, F = 7.460, p = .025), among which wasteland and artificial surface area were more important. Accounted for .491 and .401, respectively. In the year with high MRSEI (2020), there was also a significant multivariate linear relationship between MRSEI and shrub, wetland, water and artificial surface area. The regression equation was MRSEI2020 = .455–7.733 shrubs +17.525 wetland -1.571 Water +.248 urban and built-up land (R2 = .914, F = 13.330, p = .007), and the wetland area was the most important (.759).
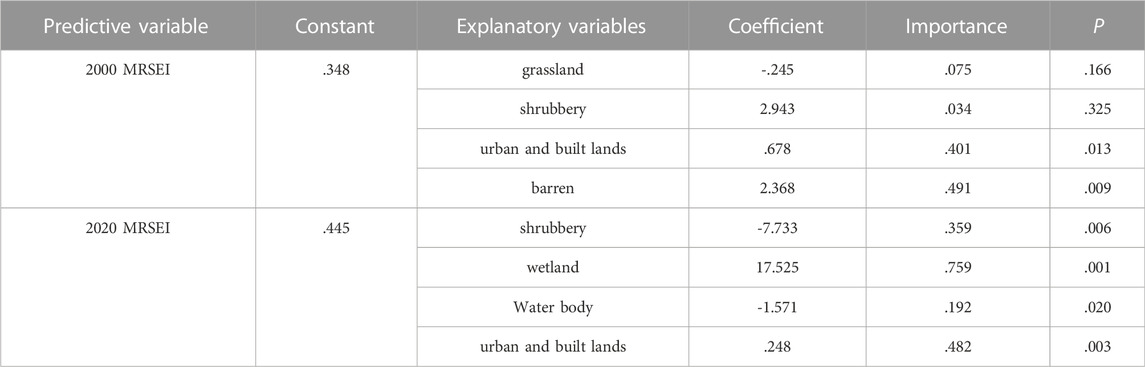
TABLE 5. Results of forward stepwise linear regression of the eco-environmental quality (MRSEI value, predictive variable) and the land use/cover type areas (explanatory variables) in the Oasis of Ningxia section of the Yellow River.
The accuracy test of the above regression model showed that SE and MEC were 2.41% and 4.87% in 2000 and 1.68% and 3.75% in 2020, respectively. This indicates that the higher the overall level of MRSEI, the higher the accuracy of the corresponding model (the lower the error rate), and the relationship between MRSEI and its predicted value varies with year (p < .001) (Figure 6).
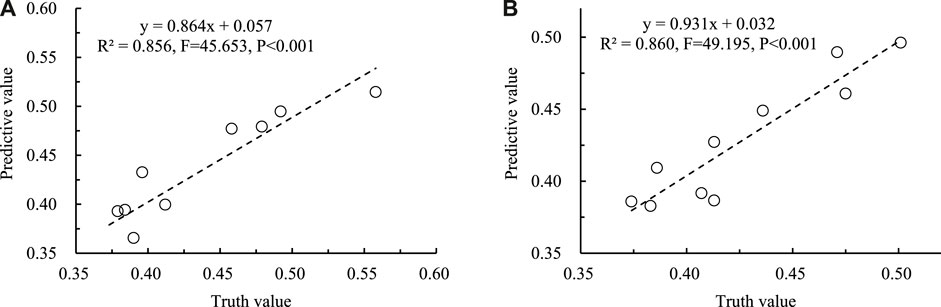
FIGURE 6. Relationship between truth values and predictive values of MRSEI [(A), 2000; (B), 2020].
In terms of the statistical analysis of the prediction results (Table 6), the MRSEI predicted mean was .002 more than the true value and the standard deviation and coefficient of variation were almost identical in 2000. In 2020, the MRSEI predicted mean was .002 less than the true value, and the standard deviation and coefficient of variation of the true value were .004 and .008 more than the predicted value, respectively. It is explained that the multiple regression model constructed based on LU type and forward stepwise linear regression method would basically express (predict) the influence mechanism of LU on MRSEI changes.
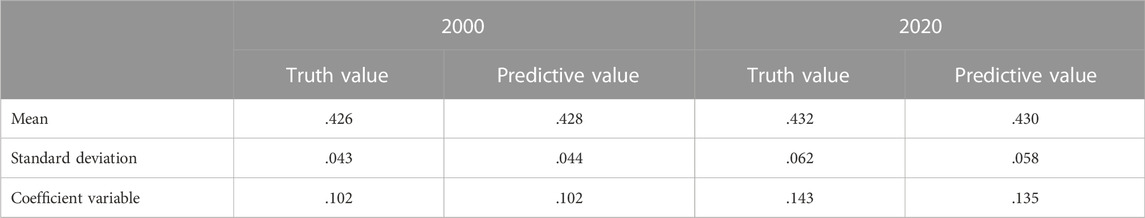
TABLE 6. Statistical analysis comparison of MRSEI prediction value and truth value.
4 Discussion
This study shows that the introduction of LDI can modify the regional eco-environment assessment method based on MRSEI model, which not only considers the element composition around the MRSEI analysis unit, but also considers the spatial scale effect of LDI, which can make the assessment results more credible.
The LDI spatial threshold of different landscape types was different, but it did not change much in specific regions (Li, et al., 2018; Liang and li, 2018; Yang et al., 2021). Our study shows that the LDI spatial threshold of the oasis of the Ningxia section of the Yellow River is 3,000 m (Figure 2 ellipse).
After the introduction of LDI, the relationship between the existing factors was not affected by LDI, as the maximum correlation coefficient did not exceed .3 within 2 years (Table 1), which verified that MRSEI was complementary to RSEI. At the same time, PCA results after the introduction of LDI significantly reduced the phenomenon that more than 75% of the eigenvalues were concentrated on PC1 (Xu et al., 2019; Yuan et al., 2021). The improvement of the method makes up for the lack of attention to heterogeneity in the evaluation of regional environmental quality. By introducing LDI, MRSEI reduces the dimensionality of multiple factors and disperses them into multiple dimensions (the cumulative eigenvalue is greater than 90%), which highlights the complexity and multiplicity of MRSEI. Determining the scale dependence of LDI (Figure 2) can not only ensure the expression of heterogeneity between adjacent elements, but also avoid the uncertainty of MRSEI results caused by the scale effect of LDI (O’neill et al., 1996; Gallé, et al., 2020). The method of this study improves the deficiency that RSEI does not express the eco-environmental quality of water body in regional eco-environment assessment.
To recognize whether the MRSEI results have organized for the oasis, the multiple regression approach with MRSEI, PC1 and PC2 are subsequently applied to the Ningxia section of Yellow River. The regression could be expresses as MRSEI = .041E-5+.156PC1+.768PC2 (R = .999, F = 1.246E9, p < .001) when the overall level of MRSEI is lower (2000). And it also could be expressed as MRSEI = .012–.034PC1+.796PC2 (R = .999, F = 1.094E9, p < .001) when the overall level of MRSEI was higher (2020). Compared the MRSEI findings with the RSEI in different regions, MRSEI values (.43) in Ningxia section of the Yellow River was more than RSEI value (.24) in the desert area (Jiang et al., 2019; Li et al., 2019), less than RSEI value (.63) in forested/vegetation-dense areas (Wang et al., 2016), and close to RSEI value (.43–.54) in tableland of loess plateau region (Sun et al., 2020). This indicated that the LDI introduction does not conflict with the original RSEI assessment results from the overall characteristics, and the change is only the spatial pattern of the eco-environment quality. Simultaneously, it was evident from Figure 4A and Figure 4B where MRSEI calculations do not require water body exclusion and form distinct MRSEI high-value zones in the land-water body transition zone (along the Yellow River) and the oasis edge zone. In terms of the MRSEI change characteristics from lower level (2000) to higher level (2020), the MRSEI degraded area was almost distributed in the edge area of the oasis and the water body or land transition zone along the Yellow River besides of the less scattered distribution in the urban areas such as Yinchuan in the middle of the study area (Figure 4C), and this phenomenon once again confirmed the occurrence of edge effects and vulnerability among different ecosystems from a dynamic perspective (Hofmeister et al., 2013; Estoque et al., 2017; Mansoury et al., 2021). Due to the grade level change details (Figure 5), transferred areas occurred mostly in adjacent levels and less cross-level. Among of them, Poor and Fair had the largest upward conversion, with 2034.0 km2 and 1779.3 km2, respectively. The overall conversion characteristics were mainly Poor class area decreased significantly and Moderate class area increased significantly, increasing by −3,019.0 km2 and 1,61.6 km2, respectively. The phenomena indicated that the improvement of the eco-environment in the semi-arid artificial oasis area generally occurred below Moderate level, and the change scope above good level was not large.
LU type is the basis for calculating LDI in the assessment of the eco-environment quality, its composition and pattern not only directly affect LDI, but also have an indirect effect on RSEI or MRSEI through influencing the distribution of all evaluative factors (Liu et al., 2007; Xu et al., 2018; Yuan et al., 2021). Based on the spatial sampling (Figure 1) and the LU classification, multiple stepwise regression analysis that selected MRSEI as predictive variable and LU types as explanatory variables showed that had inconsistent explanatory variable combinations in different yearly MRSEI levels. In the low MRSEI levels (2000), grasslands, shrublands, urban and built-up lands and barren land lands areas had a good predictive result on MRSEI, with an accuracy of more than 95%. In the higher MRSEI levels (2020), shrubland, wetland, water body and urban and built-up lands had a good predictive result on MRSEI, the accuracy also reached more than 95%. Importance values indicated that urban and built-up lands and barren land area with low ecological quality in 2000 shown to have a greater impact on MRSEI, while water body and wetland with higher ecological quality in 2020 had a greater impact on MRSEI, this result is basically consistent with that of RSEI change research in Dongting Lake and can be mutually verified (Yuan et al., 2021).
However, a common defect of RSEI and MRSEI is that the participating evaluation factors LDI, NDVI, and NDBSI reflect the long-term accumulated surface reflection characteristics, while Wet and LST only reflect the short-term surface reflection characteristics (Bindlish and Barros, 2001; Sobrino et al., 2008; Qiao et al., 2021). The removal of this uncertainty due to time scale mismatch is a challenge for RSEI and MRSEI applications. In addition, from the application prospect of MRSEI, as long as the study area is a multi-ecosystem, LDI introduction has both theoretical basis and practical significance, because LDI can express the complexity of evaluation units and adjacent units.
5 Conclusion
In regional eco-environment assessment, MRSEI can make up for the defects that RSEI cannot evaluate water areas. The introduction of LDI with defined threshold values fully expresses the heterogeneity (diversity) of adjacent units of analysis.
From 2000 to 2020, the MRSEITotal in the study area changed from .435 to .448, both of which were at a moderate grade, but the area of good and excellent increased, and the transformation from poor and moderate level to adjacent high level was the main direction.
LU types have indirect effects on MRSEI through the composition and pattern of impact assessment factors. When the MRSEI level was high, shrub, wetland, water and urban built-up area were the main influencing factors. When the MRSEI level is low, grassland, shrub, urban built-up area and barren area are the main influencing factors.
Data availability statement
The original contributions presented in the study are included in the article/Supplementary Material, further inquiries can be directed to the corresponding author.
Author contributions
CD: Contributed ideas and designed the study, collected the remote sensing data with support from, conducted the data analysis and wrote the manuscript with the help of all the other authors. RQ: Did the field surveys and collected survey data, collected the remote sensing data with support from, conducted the data analysis. ZY: Collected the remote sensing data with support from. LL: Contributed ideas and designed the study, conducted the data analysis and wrote the manuscript with the help of all the other authors. XC: Contributed ideas and designed the study, collected the remote sensing data with support from, identified the study area boundary, conducted the data analysis and wrote the manuscript with the help of all the other authors, did the field surveys and collected survey data, supported. All authors gave final approval for publication, did the field surveys and collected survey data.
Funding
This research was funded by the Key Research and Development Program of Ningxia Hui Autonomous Region (2021BGE02010), National Natural Science Foundation of China (41271193).
Acknowledgments
The authors sincerely thank for the data support from “Data Center of Resources and Environmental Sciences of the Chinese Academy of Sciences (https://www.resdc.cn/)”, and thank the editors and reviewers for their kindly view and constructive suggestions.
Conflict of interest
The authors declare that the research was conducted in the absence of any commercial or financial relationships that could be construed as a potential conflict of interest.
Publisher’s note
All claims expressed in this article are solely those of the authors and do not necessarily represent those of their affiliated organizations, or those of the publisher, the editors and the reviewers. Any product that may be evaluated in this article, or claim that may be made by its manufacturer, is not guaranteed or endorsed by the publisher.
Supplementary material
The Supplementary Material for this article can be found online at: https://www.frontiersin.org/articles/10.3389/fenvs.2022.1071631/full#supplementary-material
References
Bindlish, R., and Barros, A. P. (2001). Parameterization of vegetation backscatter in radar-based, soil moisture estimation. Remote Sens. Environ. 76 (1), 130–137. doi:10.1016/s0034-4257(00)00200-5
Boori, M. S., Paringer, R., Choudhary, K., and Kupriyanov, A. (2018). Comparison of hyperspectral and multi-spectral imagery to building a spectral library and land cover classification performance. Comput. Opt. 42 (6), 1035–1045. doi:10.18287/2412-6179-2018-42-6-1035-1045
Chen, J., Ban, Y., and Li, S. (2014). China: Open access to Earth land-cover map. Nature 514 (7523), 434. doi:10.1038/514434c
Choudhary, K., Shi, W., Boori, M. S., and Corgne, S. (2019). Agriculture phenology monitoring using NDVI time series based on remote sensing satellites: A case study of guangdong, China. Opt. Mem. Neural Netw. 28 (3), 204–214. doi:10.3103/s1060992x19030093
de Araujo Barbosa, C. C., Atkinson, P. M., and Dearing, J. A. (2015). Remote sensing of ecosystem services: A systematic review. Ecol. Indic. 52, 430–443. doi:10.1016/j.ecolind.2015.01.007
Ellis, E. C., Wang, H. Q., Xiao, H. S., Peng, K., Liu, X. P., Lie, S. C., et al. (2006). Measuring long-term ecological changes in densely populated landscapes using current and historical high-resolution imagery. Remote Sens. Environ. 100 (457-4), 457–473. doi:10.1016/j.rse.2005.11.002
Estoque, R. C., Murayama, Y., and Myint, S. W. (2017). Effects of landscape composition and pattern on land surface temperature: An urban heat island study in the megacities of southeast asia. Sci. Total Environ. 577, 349–359. doi:10.1016/j.scitotenv.2016.10.195
Fu, Y., Lu, X., Zhao, Y., Zeng, X., and Xia, L. (2013). Assessment impacts of weather and land use/land cover (lulc) change on urban vegetation net primary productivity (NPP): A case study in guangzhou, China. Remote Sens. (Basel). 2013 (5), 4125–4144. doi:10.3390/rs5084125
Fulton Elizabeth, A. (2010). Approaches to end-to-end ecosystem models. J. Mar. Syst. 81 (1-2), 171–183. doi:10.1016/j.jmarsys.2009.12.012
Gallé, R., Geppert, C., Földesi, R., Tscharntke, T., and Batáry, P. (2020). Arthropod functional traits shaped by landscape-scale field size, local agri-environment schemes and edge effects. Basic Appl. Ecol. 48, 102–111. doi:10.1016/j.baae.202.09.006
Gao, W. L., Zhang, S. W., Rao, X., Lin, X., and Li, R. (2021). Landsat TM/OLI-Based ecological and environmental quality survey of Yellow River basin, inner Mongolia section. Remote Sens. 13 (21), 4477. doi:10.3390/rs13214477
Hofmeister, J, Jan, H, Brabec, M, Hédl, R, and Modrý, M (2013). Strong influence of long-distance edge effect on herb-layer vegetation in forest fragments in an agricultural landscape. Perspect. Plant Ecol. Evol. Syst. 15 (6), 293–303. doi:10.1016/j.ppees.2013.08.004
Hu, X., and Xu, H. (2018). A new remote sensing index for assessing the spatial heterogeneity in urban ecological quality: A case from fuzhou city, China. Ecol. Indic. 89, 11–21. doi:10.1016/j.ecolind.2018.02.006
Jiang, C. L., Wu, L., Liu, D., and Wang, S. M. (2019). Dynamic monitoring of eco-environmental quality in arid desert area by remote sensing: Taking the gurbantunggut desert China as an example. J. Appl. Ecol. 30, 877–883. doi:10.13287/j.1001-9332.201903.008
Kappas, M. W., and Propastin, P. A. (2012). Review of available products of leaf area index and their suitability over the formerly soviet central Asia. J. Sens. 11, 582159. doi:10.1155/2012/582159
Kennedy, R. E., Andréfouët, S., Cohen, W. B., Gómez, C., Griffiths, P., Hais, M., et al. (2014). Bringing an ecological view of change to Landsat-based remote sensing. Front. Ecol. Environ. 12, 339–346. doi:10.1890/130066
Li, Q., Yang, Y., Wang, Z., Cui, J., Yang, G., and Lian, G. (2019). Dynamic change analysis of remote sensing ecological index in Aksu based on TM data analysis. Southwest China J. Agric. Sci. 32, 1646–1651. doi:10.16213/j.cnki.scjas.2019.7.030
Li, Y. Y., You, L. L., Chen, Y. S., and Huang, J. X. (2018). Spatial-temporal characteristics of multi-pond landscape change and their driving factors in the Chaohu Basin, China. Acta Ecol. Sin. 38 (17), 6280–6291. doi:10.5846/stxb201708281551
Liang, J. X., and Li, X. J. (2018). Characteristics of temporal-spatial differentiation in landscape pattern vulnerability in Nansihu Lake wetland, China. Chin. J. Appl. Ecol. 29 (2), 626–634. doi:10.13287/j.1001-9332.201802.018
Liu, M., Liu, C., and Wang, K. (2007). Eco-security in Dongting Lake watershed: Its changes and relevant driving forces. Chin. J. Ecol. 26, 1271–1276. doi:10.13292/j.1000-4890.2007.0220
Liu, Q., Yang, Z., Han, F., Shi, H., Wang, Z., and Chen, X. (2019). Ecological environment assessment in world natural heritage site based on remote-sensing data. A case study from the bayinbuluke. Sustainability 11, 6385. doi:10.3390/su11226385
Luo, M., Zhang, S. W., Huang, L., Liu, Z. Q., Yang, L., Li, R. S., et al. (2022). Temporal and spatial changes of ecological environment quality based on RSEI: A case study in ulan mulun river basin, China. Sustainability 14, 13232. doi:10.3390/su142013232
Mansoury, M, Hamed, M, Karmustaji, R, Hannan, F A, and Safrany, S T. (2021). The edge effect: A global problem. The trouble with culturing cells in 96-well plates. Biochem. Biophysics Rep. 26, 100987. doi:10.1016/j.bbrep.2021.100987
Mukesh, S. B., Komal, C., Rustam, P., and Alexander, K. (2021). Eco-environmental quality assessment based on pressure-state-response framework by remote sensing and GIS. Remote Sens. Appl. Soc. Environ. 23 (2021), 10053. doi:10.1016/j.rsase.2021.100530
Nichol, J. (2009). An emissivity modulation method for spatial enhancement of thermal satellite images in urban heat island analysis. Photogramm. Eng. remote Sens. 75, 547–556. doi:10.14358/pers.75.5.547
O’neill, R., Hunsaker, C., Timmins, S. P., Jackson, B. L., Jones, K. B., Riitters, K. H., et al. (1996). Scale problems in reporting landscape pattern at the regional scale. Landsc. Ecol. 11 (3), 169–180. doi:10.1007/bf02447515
Patrício, J., Elliott, M., Mazik, K., Papadopoulou, K.-N., and Smith, C. J. (2016). DPSIR—Two decades of trying to develop a unifying framework for marine environmental management? Front. Mar. Sci. 3, 177. doi:10.3389/fmars.2016.00177
Qiao, R. R., Dong, C. Y., Ji, S. X., and Chang, X. L. (2021). Spatial scale effects of the relationship between fractional vegetation coverage and land surface temperature in Horqin sandy land, north China. Sensors 21 (20), 6914. doi:10.3390/s21206914
Reza, M. I. H., and Abdullah, S. A. (2011). Regional index of ecological integrity: A need for sustainable management of natural resources. Ecol. Indic. 11, 220–229. doi:10.1016/j.ecolind.2010.08.010
Schwarz, N., Schlink, U., Franck, U., and Großmann, K. (2012). Relationship of land surface and air temperatures and its implications for quantifying urban heat island indicators: An application for the city of Leipzig (Germany). Ecol. Indic. 18, 693–704. doi:10.1016/j.ecolind.2012.01.001
Sobrino, J. A., Jimenez-Muoz, J. C., Soria, G., Romaguera, M., Guanter, L., Moreno, J., et al. (2008). Land surface emissivity retrieval from different VNIR and TIR sensors. IEEE Trans. Geosci. Remote Sens. 46, 316–327. doi:10.1109/tgrs.2007.904834
Sun, C., Li, X., Zhang, W., and Li, X. (2020). Evolution of ecological security in the tableland region of the Chinese loess plateau using a remote-sensing-based index. Sustainability 12, 3489. doi:10.3390/su12083489
Tilt, J. H., Unfried, T. M., and Roca, B. (2007). Using objective and subjective measures of neighborhood greenness and accessible destinations for understanding walking trips and BMI in Seattle, Washington. Am. J. Health Promot. 21, 371–379. doi:10.4278/0890-1171-21.4s.371
Tom as, B., Ramos, S., Caeiro, J., and de Melo, J. (2004). Environmental indicator frameworks to design and assess environmental monitoring programs. Impact Assess. Proj. Apprais. 22 (1), 47–62. doi:10.3152/147154604781766111
Wang, S., Zhang, X., Zhu, T., Yang, W., and Zhao, J. (2016). Assessment of ecological environment quality in the Changbai Mountain Nature Reserve based on remote sensing technology. Prog. Geogr. 35, 1269–1278. doi:10.18306/dlkxjz.2016.10.010
White, D. C., Lewis, M. M., Green, G., and Gotch, T. B. (2016). A generalizable NDVI-based wetland delineation indicator for remote monitoring of groundwater flows in the Australian Great Artesian Basin. Ecol. Indic. 60, 1309–1320. doi:10.1016/j.ecolind.2015.01.032
Willis, K. S. (2015). Remote sensing change detection for ecological monitoring in United States protected areas. Biol. Conserv. 182, 233–242. doi:10.1016/j.biocon.2014.12.006
Wu, T. X., Sang, S., Wang, S. D., Yang, Y. Y., and Li, M. Y. (2020). Remote sensing assessment and spatiotemporal variations analysis of ecological carrying capacity in the Aral Sea Basin. Sci. Total Environ. 735 (2020), 139562. doi:10.1016/j.scitotenv.2020.139562
Xu, H. (2013). A remote sensing index for assessment of regional ecological changes. China Environ. Sci. 33 (5), 889–897. doi:10.3969/j.issn.1000-6923.2013.05.019
Xu, H., Wang, M., Shi, T., Guan, H., Fang, C., and Lin, Z. (2018). Prediction of ecological effects of potential population and impervious surface increases using a remote sensing based ecological index (RSEI). Ecol. Indic. 93, 730–740. doi:10.1016/j.ecolind.2018.05.055
Xu, H., Wang, Y., Guan, H., Shi, T., and Hu, X. (2019). Detecting ecological changes with a remote sensing based ecological index (RSEI) produced time series and change vector analysis. Remote Sens. (Basel). 11, 2345. doi:10.3390/rs11202345
Yang, G., Zhang, Z. J., Cao, Y. G., Zhuang, Y. N., Yang, K., and Bai, Z. K. (2021). Spatial-temporal heterogeneity of landscape ecological risk of large-scale open-pit mining area in north Shanxi. Chin. J. Ecol. 40 (1), 187–198. doi:10.13292/j.1000-4890.202101.003
Yang, Y., Bao, W., Li, Y., Wang, Y., and Chen, Z. (2020). Land use transition and its eco-environmental effects in the beijing–tianjin–hebei urban agglomeration: A production–living–ecological perspective. Land 9, 285. doi:10.3390/land9090285
Yu, D. J., and Hong, X. Y. (2022). A theme evolution and knowledge trajectory study in AHP using science mapping and main path analysis. Expert Syst. Appl. 205, 117675. doi:10.1016/j.eswa.2022.117675
Yuan, B. D., Fu, L. N., Zou, Y. A., Zhang, S. Q., Chen, X. S., Li, F., et al. (2021). Spatiotemporal change detection of ecological quality and the associated affecting factors in Dongting Lake Basin, based on RSEI. J. Clean. Prod. 302 (2021), 126995. doi:10.1016/j.jclepro.2021.126995
Zhang, X. (2020). Global land-cover classification and mapping at 30 m using quantitative remote sensing technique. Beijing: University of Chinese Academy of Sciences, p133. doi:10.44231/d.cnki.gktxc.2020.000011
Keywords: eco-environmental quality, oasis, land use/cover, Yellow River, MRSEI
Citation: Dong C, Qiao R, Yang Z, Luo L and Chang X (2023) Eco-environmental quality assessment of the artificial oasis of Ningxia section of the Yellow River with the MRSEI approach. Front. Environ. Sci. 10:1071631. doi: 10.3389/fenvs.2022.1071631
Received: 16 October 2022; Accepted: 02 December 2022;
Published: 04 January 2023.
Edited by:
Yonghao Xu, Institute of Advanced Research in Artificial Intelligence (IARAI), AustriaReviewed by:
Xianhua Guo, Chongqing Three Gorges University, ChinaZhang Shengwei, Inner Mongolia Agricultural University, China
Honghai Kuang, Southwest University, China
Copyright © 2023 Dong, Qiao, Yang, Luo and Chang. This is an open-access article distributed under the terms of the Creative Commons Attribution License (CC BY). The use, distribution or reproduction in other forums is permitted, provided the original author(s) and the copyright owner(s) are credited and that the original publication in this journal is cited, in accordance with accepted academic practice. No use, distribution or reproduction is permitted which does not comply with these terms.
*Correspondence: Xueli Chang, eGxjaGFuZ0AxMjYuY29t