 Basra Semab1
 Kanwar Muhammad Javed Iqbal
 Sarah Amir
 Muhammad Atiq Ur Rehman Tariq
- 1Department of Environmental Science, International Islamic University, Islamabad, Pakistan
- 2National Institute of Maritime Affairs, Bahria University, Islamabad, Pakistan
- 3College of Engineering, IT & Environment, Charles Darwin University, Darwin, NT, Australia
- 4College of Engineering and Science, Victoria University, Melbourne, VIC, Australia
Maritime transportation has drawn international attention due to the gradual rise and projected growth of Greenhouse Gas (GHG) emissions resulting from fossil fuel consumption. It is alarming that the overall maritime transportation emissions are neither attended to nor mainstreamed under the transportation sector. The actual national inventory of GHG emissions vis-à-vis all types/sizes of maritime vessels is so far not established particularly in developing countries, which clearly indicates the inadequacy of their climate mitigation response. Accurate assessment of GHGs is essential to provide reliable input for climate policy, strategies, and decision-making processes by flag states. Therefore, the establishment of a baseline reference scenario by considering all types/sizes of maritime vessels is crucial to know the actual gravity of the problem, which is still unknown. This entailed the need to explore the actual extent of GHG emissions from the maritime transportation sector. In this context, the present study tried to assess the potential GHG emissions from maritime vessels by undertaking the case of Pakistan and using the top-down approach, which took into account fuel consumption and emission factors for GHGs. It revealed that 2,468,789.21 tonnes of GHGs (CO2e) are being emitted annually from the maritime vessels of Pakistan, which is 4.9% of the overall transport sector emissions of the country. Carbon offset cost of 37, 031, 838.14 US$/annum and approximately 20,020 hectares of mature mangrove forest to remove 2,468,789.21 metric tonnes of CO2e emissions from the atmosphere in a timeline of 1 year are required to become carbon neutral. It is anticipated that this study’s outcome will serve as a baseline reference scenario for national GHG inventory and help in devising climate mitigation responses for maritime vessels by bridging the existing knowledge gap.
1 Introduction
Climate change is quickly becoming a survival concern because it brings multiple challenges globally (GoP, 2021b). Since about 1750, the observed rise in Greenhouse Gases (GHGs) is clearly due to anthropogenic activities (IPCC, 2021). The burning of fossil fuels due to anthropogenic activities including transportation is one of the main causes of the increase in CO2 emissions (IPCC, 2014; Notte et al., 2018; Hussain et al., 2020). Over the last century, international sea transportation has been the primary means of transit (Halim et al., 2018) accounting for 80–90% of global trade (Chang, 2012; Chu-Van et al., 2019; MERSIN et al., 2019; Yang and Ma, 2019; Zhou et al., 2020; Al-Enazi et al., 2021). Maritime vessels are directly involved in climate change by releasing the substances of global warming because of the utilization of fossil fuels (Fitzgerald et al., 2011; Kokosalakis et al., 2020). Emissions depend on the type of fuel used, the type of engine, and its efficiency. Marine fuel oil, Heavy fuel oil, and Marine diesel oil are the most often utilized fuels in maritime vessels (Walker et al., 2018; Schnurr and Walker, 2019; Zincir, 2020). In 2019, annual atmospheric concentrations of carbon dioxide (CO2), methane (CH4), and nitrous oxide (N2O) have reached averages of 410 ppm, 1866 ppb, and 332 ppb respectively (IPCC, 2021) and if storage and use methods are not developed, future increases will lead to catastrophic problems of climate change (Al Baroudi et al., 2021). It is critical to highlight that global warming, in the 21st century, will increase by 1.5°C and 2°C unless GHG emissions are significantly reduced in the next few decades (IPCC, 2021).
The fourth International Maritime Organization (IMO) GHG study demonstrated that shipping transportation is accountable for 2.89% of global CO2 emissions (IMO, 2021a) whereas CO2 emissions from the business-as-usual scenario of shipping will probably increase up to 250% by 2050 (IMO, 2015; Bouman et al., 2017; Gritsenko, 2017; Tatar and Ozer, 2018) if no mitigation action will be taken (Bouman et al., 2017; Inal et al., 2021). Paris Agreement aimed to keep the century’s average temperature rise to 2°C; however, reductions in GHG emissions from maritime transportation were not included in the plan (Halim et al., 2018; Muhammad and Long, 2020). In abatement strategies that seek to preserve global GHG concentrations around 450 ppm or 550 ppm, all forms of transportation would be needed to significantly increase fuel efficiency, utilize more low-carbon fuels, and implement behavioral changes (Cames et al., 2015). The objective of the Paris Agreement for limiting the global temperature rise would be jeopardized unless the maritime sector contributes towards climate mitigation strategies (Halim et al., 2018).
However, the IMO approved a resolution in 2018 to cut shipping emissions by at least 50% and CO2 emissions by at least 70% by 2050 (Chen et al., 2019; IMO, 2019; Muhammad and Long, 2020; Zincir, 2020). Considerable resources and investments are required to achieve this goal (UNCTAD, 2020). Merk (2014) projected that Asia and Africa will witness the largest increases in emissions because of substantial port traffic development and insufficient mitigating efforts. Therefore, mitigation strategies are necessary for all types of sea-going vessels, but the gravity of the problem needs to be identified first which is a major challenge in developing countries including Pakistan.
Existing studies now including the IMO studies have some sort of shortcomings, for instance, the fourth IMO GHG study has only covered ships of 100 GT and above. The omission of fishing vessels and other small commercial vessels from IMO’s GHG studies is also reported in a study in the United Kingdom (Coello et al., 2015). In addition, the national GHG emission scenario is also not provided. So, there is a question that arises where Pakistan is ranked among other countries in the breakdown of GHG emissions. It is critical to mention that significant gaps regarding the under-reporting of fuel data (IMO, 2009), the unavailability of Automatic Identification System (AIS) data for some years during the study period (IMO, 2015), and no reporting of fuel consumption data to International Energy Agency (IEA) by countries except a few ones (IMO, 2015; 2021b) have been reported in IMO’s GHG Studies. Accurate estimation of GHG emissions is vital for providing credible input to policy-making processes and climate response (Notte et al., 2018). So, the aforementioned gaps raise the question regarding the accurate calculation of global GHG emissions from maritime vessels of all types and sizes.
On the other hand, in the case of Pakistan, the actual national inventory of GHG emissions vis-à-vis all types/sizes of vessels is so far not established. Moreover, the allocation of emissions from ships has been hotly disputed based on the nationality of the transporting firm, country of departure, or the area where the fuel is sold, etc (Villalba and Gemechu, 2011a). GHGs and other air pollutants are considered transnational issues because they have no boundaries. However, a transnational issue doesn’t mean that you should put your emissions in the hands of others; rather, everyone must come up with climate mitigation plans and strategies. Therefore, the case of Pakistan is significant due to the large number of fishing vessels that are active in the Arabian Sea. Their cumulative effect, along with other types/sizes of vessels, on GHG emissions is unknown. Therefore, the establishment of a baseline reference scenario and knowing the carbon offset cost is crucial to know the actual gravity of the problem to contribute toward climate mitigation response as well as fulfillment of objectives and targets set under the National Climate Change Policy (NCCP) 2021 (GoP, 2021a) and Nationally Determined Contribution (NDC) 2021 (GoP, 2021b).
Hence, this entailed the need to explore and assess the overall GHG emission scenario from the most ignored and unattended segment of the maritime economy. In this context, this paper tried to analyze the potential GHG emissions for all types and sizes of sea-going vessels and their carbon offset cost by taking the case of a developing country i.e. Pakistan. The outcome of the study provides a baseline reference scenario for the GHG inventory and adds knowledge to the existing pool of literature which would help in developing policy and climate mitigation strategies specific to all types of maritime vessels.
2 Materials and methods
2.1 Review of methodologies and emission factors
In the literature, the main available methodologies to calculate shipping emissions are classified into the top-down approach and bottom-up approach (Eyring et al., 2010) proposed by Intergovernmental Panel on Climate change (IPCC) (Yang and Ma, 2019). In a top-down approach, emissions are calculated without regard to location. Emissions are calculated by gauging fuel use by power generation first and then it is multiplied by the emission factor. Whereas, in a bottom-up approach, ship, and route-specific emissions within a geographical context are directly estimated depending on vessel characteristics, vessel movements, and vessel emissions factors (Eyring et al., 2010). Several publications scientifically research the problem of GHG emissions from the combustion of fuel oil in maritime vessels (Kokosalakis et al., 2020). Tokuslu (2021) examined the GHG emissions from maritime vessels in four of Georgia’s main ports using the bottom-up approach. Kramel et al. (2021) presented a bottom-up evaluation of GHGs and aerosol emissions from the shipping industry. Johansson et al. (2017) estimated worldwide emissions from shipping for the year 2015 by using the Ship Traffic Emission Assessment Model (STEAM3), specification data of ships, and Automatic Identification System (AIS) data. Chen et al. (2016) evaluated ship exhaust emissions using activity-based methods and AIS data for the Tianjin Port, China. Styhre et al. (2017) examined the GHG emissions from ships in four ports using yearly data from the Ports of Gothenburg, Long Beach, Osaka, and Sydney using a model developed by IVL Swedish Environmental Research Institute. Olukanni and Esu (2018) calculated the quantity of GHGs released by port vessel activities in the Nigerian ports of Lagos and Tin Can using a bottom-up technique based on individual vessel characteristics. Chang et al. (2013) examined GHG emissions from port shipping activities in Korea’s Port of Incheon and found significant differences when comparing the results of the bottom-up approach with the top-down approach. Additionally, several studies have discussed the best possible measures for climate mitigation in the maritime transportation sector (Li et al., 2019; MERSIN et al., 2019; Prasad and Raturi, 2019; Jiang et al., 2020; Joung et al., 2020; Zincir, 2020; Al-Enazi et al., 2021; Inal et al., 2021). However, no study has been found that explores and compares the overall GHG emission scenario from the maritime transportation sector by taking into account all types and sizes of maritime vessels – a research gap that is explored in this study.
This section, as a whole, demonstrates the methodology used for the calculation of GHG emissions from all types and sizes of maritime vessels in Pakistan. The review of methodologies used for calculations of GHG emissions globally and emission factors are briefed in sub-section 2.1. Sub-section 2.2 deals with the implications of existing methodologies for this study. Similarly, the selection of the GHG emissions method and variables involved are described in sub-section 2.3 and sub-section 2.4 respectively. Sub-section 2.5 explains the data acquisition of maritime vessels from concerned departments and authorities. The scope of GHGs under this study, selection, and normalization of GHG emissions factors, and selection of GHG emission calculation method for this study is described in sub-section 2.6 to sub-section 2.9 respectively.
Various methodologies and emission factors relating to GHG emissions were scrutinized during the methodological review process. It has been identified that various GHG methodologies and emission factors remained in leading practice globally by Intergovernmental Panel on Climate Change (IPCC) (IPCC, 2006), International Maritime Organization (IMO) (IMO, 2015), United States Environmental Protection Agency (US-EPA) (US EPA, 2022a), European Monitoring and Evaluation Program/European Environment Agency (EMEP/EEA), and Core Inventory of Air Emissions (CORINAIR) Guidebooks (EEA, 2021).
2.1.1 Methodologies developed by IPCC
Over the time, IPCC has provided different methodological approaches and emissions factors for measuring GHG emissions generated from all water-borne navigation, which are followed globally. IPCC guidelines 2006 for national GHG inventories are the recent ones to which significant refinements were made in May 2019. IPCC, in its 2006 Guidelines, has presented two methodological tiers for the estimation of Carbon Dioxide, Methane, and Nitrous Oxide emissions. In the Tier one method, emissions of the above-mentioned gases can be calculated based on fuel consumption data and default emissions factors by applying the following equation:
Emissions = ∑ (Fuel consumedab• Emission factorab)
Where “a” is fuel type and “b” is water-borne navigation type.
However, Tier two also uses the same equation for estimating shipping emissions yet country-specific emission factors with higher precision in fuel type, classification mode, and engine type are required. Based on these variables, the EMEP/CORINAIR emission inventory guidebook provides an in-depth methodology for estimating shipping emissions (IPCC, 2006).
2.1.2 EMEP/EEA Air pollutant emission inventory guidebook
EMEP/EEA air pollutant emission inventory guidebook was previously known as the EMEP CORINAIR emission inventory guidebook. EMEP/EEA emission inventory guidebooks are available from 2006 to 2019. EMEP/EEA air pollutant emission inventory guidebook 2019 was updated in December 2021 (EEA, 2021) and provides three detailed methodological tiers for estimating shipping emissions which include Tier 1 (Default approach), Tier 2 (Technology Specific approach), and Tier 3 (Ship movement methodology). The Tier one method simply uses the mass of fuel consumed with fuel-specific-emissions factors for the type of fuel used. This guidebook also presents emission factors for air pollutants of different types of fuels for all three tiers but it doesn’t cover specific GHG emission factors under its scope. However, Tier two and Tier three methodological approaches are only useful when detailed information is available about all required variables i.e. engine types, fuel types, vessel trip phases, etc.
2.1.3 Methodologies used by IMO
IMO has used top-down and bottom-up methodological approaches to estimate global shipping emissions in all its previous studies (IMO, 2009, 2015; 2021b). The top-down approach is based on fuel statistics and the bottom-up approach is based on activity datasets.
2.2 Implications of the existing methodologies for this study
IMO’s GHG Studies are based on AIS-transmitted data for the bottom-up approach and fuel consumption data from International Energy Agency (IEA) for the top-down approach. However, significant gaps exist regarding fuel consumption records at the international level for the years i.e. 2012 and 2018 as reported in the third and fourth IMO GHG Studies (IMO, 2015; 2021b). IMO doesn’t have the breakdown of actual fuel consumption data vis-à-vis all types/sizes of maritime vessels as they just relied on fuel consumption data provided by IEA. Given the unavailability of data for the study, the period is further challenging in determining the actual extent of global shipping emissions which indicates that the global shipping emissions would be much higher when actual fuel consumption data of all types/sizes of vessels will be incorporated. Moreover, IMO has relied on AIS data for a bottom-up approach; AIS data covers ships of 100 GT and above only associated with an IMO number. Ships below 100 GT don’t have an IMO number and mostly fishing crafts and harbor crafts fall in this category hence their record is missing.
Collecting fishing vessel data is technically a difficult task. There is no check and balance on how much fuel vessels consume. Record maintenance is also not streamlined particularly in developing countries. Operational aspects of fishing vessels are not on record to determine the actual fuel consumption by these vessels. So, it raises the question regarding the trend of global shipping emissions when all the missing aspects will be considered. All the aforementioned methodologies evolved over time and have come up to an advanced level where various variables are accounted towards the calculation of GHG emissions. National maritime emission scenarios towards global GHG emissions matter a lot since climate change has no boundaries and these emissions impact globally. So, in developing countries, particularly in the case of Pakistan, the share of all types and sizes of sea-going vessels might be higher than ships for national transportation which is unattended. Given the constraints vis-a-vis time, resources, and the size and scope of the study, this study is trying to attempt an initial preliminary assessment.
2.3 Selection of GHG emissions method for this study
Owing to the limitation of AIS Data for the bottom-up approach and considering the unattended vessels having no IMO number, the best possible method is the top-down method (based on fuel consumption) which is adopted for the current study. To narrow it down further to cover all aspects, an in-depth study is needed, which can be undertaken in the future but this study is also authentic as it is relying on the actual data of fuel consumed by sea-going vessels. This initial preliminary assessment would provide an initial baseline upon which an in-depth study needs to be built. Moreover, it would provide insight into the actual gravity of the problem and scale and trend to foresee its share in national transportation.
2.4 Variables involved
In this study, GHG emissions are taken as a dependent variable, and fuel consumption as a major independent variable. The GHG emissions and fuel consumption of maritime vessels are depending on the type of vessel, size of the vessel, type of fuel used, the average amount of fuel consumed, emission factor of specific greenhouse gas (i.e., CO2, CH4, and N2O) and respective global warming potential. Therefore, GHG emissions depend on a wide range of independent variables as a subgroup of the fuel consumption, which includes type and size of the vessel, type of fuel, fuel consumption vis-a-vis different phases of trips, type of engine, size of the engine, engine speed, engine nominal power, engine load factor, and emission factor of pollutant, etc. (IPCC, 2006; EEA, 2021). However, the GHG emissions will vary depending on the range of variables vis-a-vis methodology selected for the calculation of GHG emissions from maritime vessels.
2.5 Data acquisition
Fleet data of PNSC were collected from Pakistan National Shipping Corporation (PNSC). This data includes annual fuel consumption data of ships vis-à-vis ship type and fuel type for the fiscal year 2021-2022. Data on PMSA’s own fleet including ship type, engine type/size, and annual fuel consumption vis-a-vis fuel type were collected from the Pakistan Maritime Security Agency (PMSA). Fuel consumption data of fishing vessels and other crafts of both provinces i.e. Sindh and Balochistan were acquired from the PMSA as well as from consultations with various boat owners and nakhudas. A consultation session was arranged with the technical and administrative assistance of WWF-Pakistan (World Wide Fund for Nature) in Karachi to get information and data about the business-as-usual case of fishing vessels’ fuel consumption per trip vis-a-vis different types and sizes of boats i.e. big sized (local term: Launch), medium-sized (local term: Hora) and small-sized (local term: Dhonda). Moreover, telephone interviews with random boat owners and nakhudas of fishing vessels at fish harbors of Karachi, Korangi, Keti Bandar, Ormara, Pasni, Gwadar, Gadani, and Jiwani were conducted to determine the fuel consumption per trip. Based on PMSA’s input and consultation with various relevant actors, gathered data was scrutinized and rationalized to determine the average annual fuel consumption. First of all, fuel consumption data of vessels per trip viz vessels type/size was determined, and then annual fuel consumption was estimated. Annual fuel consumption data of harbor crafts such as dredgers, tugs, barges, floating cranes, and ferry boats were obtained from Karachi Port Trust (KPT) and Port Qasim Authority (PQA).
2.6 Scope of GHGs in this study
Mainly six GHGs (CO2, CH4, N2O, HFCs, PFCs, and SF6) are considered by the UNFCCC (United Nations Framework Convention on Climate Change) and its Kyoto Protocol (UNCTAD, 2009). Over 90% of the fuel used for transportation is petroleum based such as gasoline and diesel (US EPA, 2022b). As a result of fuel combustion, the majority of the GHGs emitted are carbon dioxide (CO2) with relatively small amounts of methane (CH4) and nitrous oxide (N2O). Moreover, a small amount of hydrofluorocarbons (HFCs) emits from refrigerators and air conditioners (IMO, 2015; US EPA, 2022b). The scope of this study primarily covers three GHGs namely carbon dioxide, methane, and nitrous oxide, resulting from fuel consumption in all types/sizes of sea-going vessels except naval ships. GHGs and their source of emissions from maritime vessels are given in Table 1.
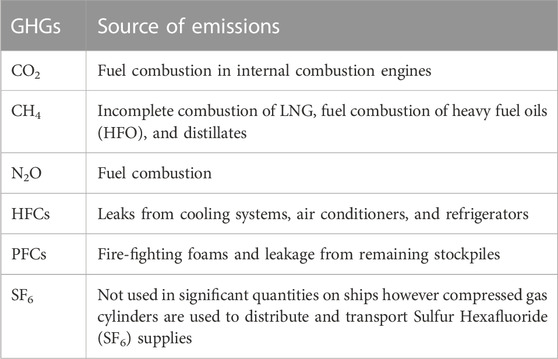
TABLE 1. Data retrieved from Third IMO GHG study 2015 and US-EPA.
2.7 Selection of GHG emission factors (EFs)
The following emission factors (Table 2) have been selected after a thorough review and cross-examination of factors either developed or remained in use by US-EPA, IMO, and IPCC.
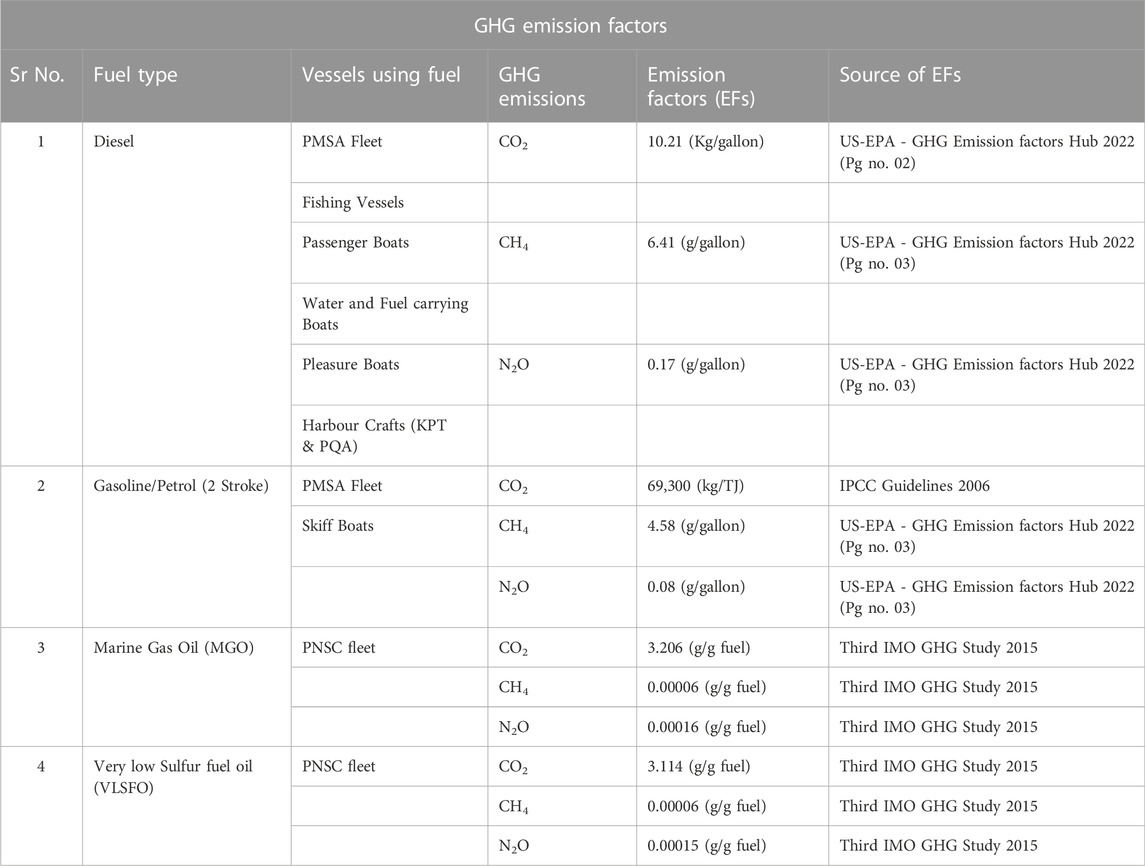
TABLE 2. GHG Emission Factors (EFs) for various fuel categories.
2.8 Normalization of GHG emission factors
As aforementioned, various emission factors of GHGs for various categories of fuels have been retrieved from the literature. All these emission factors were having different units so for avoiding any confusion these emission factors have been normalized and converted to the same unit i.e., kg/gallon. Emissions factors of GHGs for various fuel categories are as follows:
2.8.1 Diesel
The GHG emission factors for diesel are provided in Table 3 hereunder.
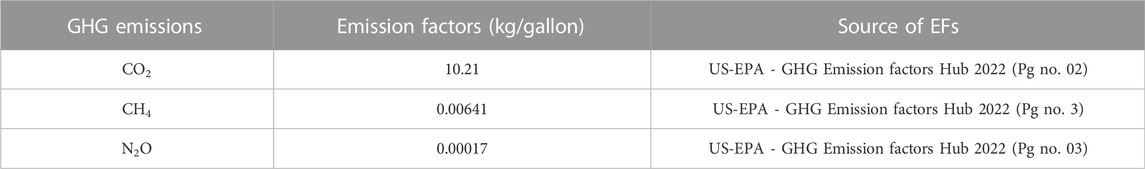
TABLE 3. GHG emission factors (EFs) for diesel.
2.8.2 Gasoline/petrol
The GHG emission factors for gasoline/petrol are provided in Table 4 hereunder.
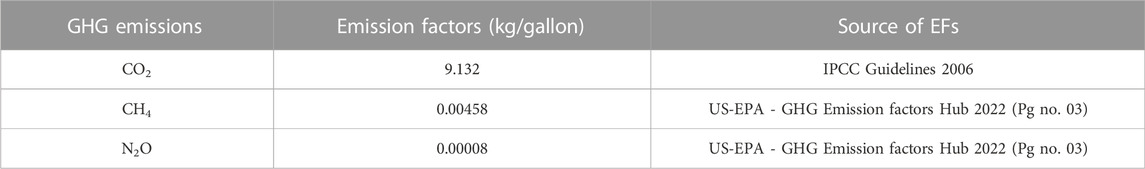
TABLE 4. GHG emission factors (EFs) for gasoline/petrol.
2.8.3 Marine gas oil (MGO)
The GHG emission factors for marine gas oil (MGO) are provided in Table 5 hereunder.
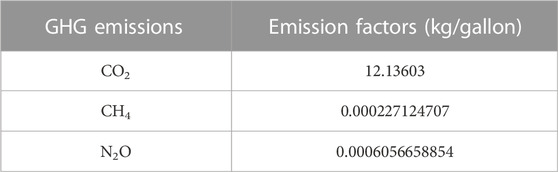
TABLE 5. GHG emission factors (EFs) for marine gas oil (MGO).
2.8.4 Very low sulfur fuel oil (VLSFO)
The GHG emission factors for very low Sulfur fuel oil (VLSFO) are provided in Table 6 hereunder.
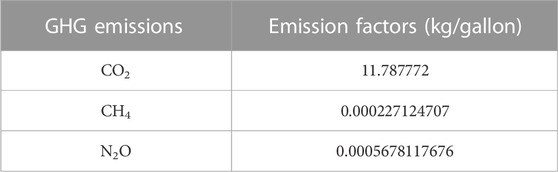
TABLE 6. GHG emission factors (EFs) for VLSFO.
2.9 Selection of GHG emission calculation method for this study
Tier one method developed by IPCC is selected for this study to calculate GHG emissions and customized according to the need under the scope of the study. The equation is as follows:
Emissions = ∑ (Fuel consumedab • Emission factorab) (IPCC, 2006)
In the above equation, “a” represents the type of fuel, and “b” represents water-borne navigation type such as boat or ship and possibly the type of engine.
2.9.1 Basis of formulae
Based on fuel consumption data and taking three gases, the following two formulas were developed and used for the calculation of GHG emissions load and GHG emissions in CO2e with respect to global warming potential (GWP) of all types and sizes of maritime vessels (except naval platforms) in terms of national baseline maritime emissions reference scenario of Pakistan.
Formula Equation 1 - GHG emissions load estimation:
Where;
Formula Equation 2 – GHG emissions (CO2e with respect to GWP):
Where;
3 Results
This section demonstrates the amount of greenhouse gas emissions resulting from the maritime transportation sector of Pakistan and the carbon offsetting costs for maritime vessels. This assessment would provide insight into the most neglected sector that how all types of vessels vis-à-vis sizes are contributing towards national emissions as a silent contributor. As part of this study, the GHG emissions load of all sea-going vessels and their respective Global Warming Potential (CO2e) is studied separately.
3.1 GHG emissions from the maritime transportation sector of Pakistan
In this study, Pakistan maritime vessels are classified into six different categories i.e. PNSC’s merchant ships; PMSA’s surveillance vessels at sea; KPT’s port operations’ assistance crafts; PQA’s port operations’ assistance crafts; fishing vessels; and recreational and other crafts. Figure 1 illustrates the total share of GHG emissions (CO2e) with respect to global warming potential contributed by each category of the sea-going vessel in the maritime transportation sector. Total GHG emissions and warming potential of each gas i.e., carbon dioxide, methane, and nitrous oxide by each category of the sea-going vessel are presented in Table 7 and Table 8. The total greenhouse gas (GHG) emissions with respect to their global warming potential (GWP, CO2e) including carbon dioxide (CO2), methane (CH4), and nitrous oxide (N2O), of Pakistan’s maritime transportation sector, are 2,468,789.21 tonnes (CO2e) based on annual fuel consumption for the year 2021-2022. Maritime vessels consumed a total of 310,885.75 tonnes of fuel for the aforementioned period including diesel, petrol, marine gas oil (MGO), and very low sulfur fuel oil (VLSFO).
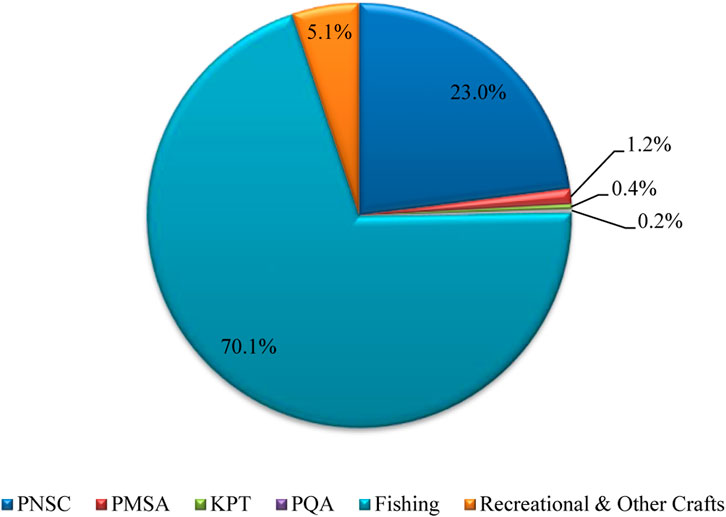
FIGURE 1. Share of GHG emissions (CO2e) from maritime vessels (A)PNSC: Pakistan National Shipping Corporation (B) PMSA: Pakistan Maritime Security Agency (C)KPT: Karachi Port Trust (D) PQA: Port Qasim Authority (E)Fishing vessels (F)Recreational and other crafts such as skiff boats, passenger boats, water and fuel carrying boats.
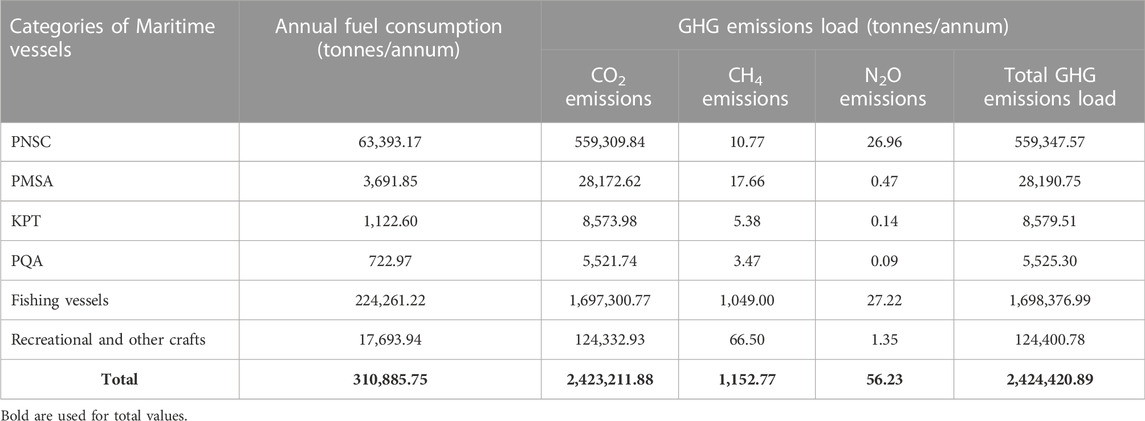
TABLE 7. Total GHG emissions load from each category of maritime vessels.
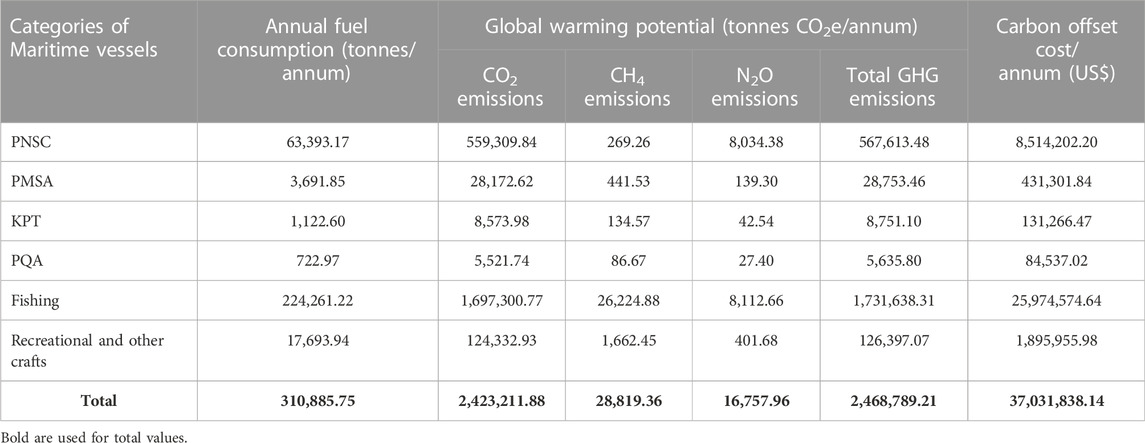
TABLE 8. Global Warming Potential (GWP, CO2e) from each category of maritime vessels and respective carbon offset cost.
The results demonstrate that carbon dioxide is the highest emitting GHG from the maritime transportation sector of Pakistan. Carbon dioxide emissions from all types and sizes of maritime vessels amounted to 2,423,211.88 tonnes while methane (CH4) and nitrous oxide (N2O) emissions are 1,152.77 tonnes and 56.23 tonnes respectively. Results show that fishing vessels are the largest contributors to maritime GHG emissions. Fishing vessels are responsible for 1,731,638.31 tonnes of GHG emissions (CO2e) having a total share of 70.1% of the country’s total maritime vessel emissions. Similarly, PNSC’s merchant ships are the second largest emitters of GHGs which corresponds to a 23% share with emissions of 567,613.48 tonnes (CO2e). The third GHG contributor i.e. recreational and other crafts accounting for 126,397.07 tonnes (CO2e) have a total of 5.1% share in maritime emissions followed by sea-going vessels of PMSA, KPT, and PQA. PMSA’s surveillance vessels are responsible for 28,753.46 tonnes (CO2e) emissions, along with port operations’ assistance crafts of KPT and PQA accounting for 8,751.10 and 5,635.80 tonnes (CO2e) and these three collectively have a share of 1.8% in total GHG emissions from the maritime sector of Pakistan.
3.2 Breakdown of GHG emissions from sea-going vessels
A detailed breakdown of GHG emissions from each type of sea-going vessel is given below:
3.2.1 PNSC’s merchant ships
Pakistan National Shipping Corporation (PNSC) is a national flag carrier and provides effective shipping services to other countries and seaborne trade in Pakistan (PNSC, 2015). Currently, Pakistan National Shipping Corporation (PNSC) has a total of 13 ships; out of which eight are tankers and five are bulk carriers. The vessel names of the tankers are Khairpur, Bolan, Quetta, Lahore, Karachi, Shalamar, Mardan, and Sargodha whereas Chitral, Malakand, Hyderabad, Sibi, and Multan are bulk carriers. Two tankers (Mardan and Sargodha) have been added to PNSC’s fleet recently however only 11 ships were operational on the ground during the study period. Figure 2 represents the breakdown of GHG emission (CO2, CH4, N2O) load from all merchant ships of PNSC based on annual fuel consumption i.e. Very Low Sulfur Fuel Oil (VLSFO) for the fiscal year 2021 to 2022. Whereas6, Figure 3 illustrates the total annual GHG emissions (CO2e) from the PNSC fleet. A detailed breakdown of GHG emissions from PNSC’s fleet resulting from the consumption of VLSFO is presented in Table 9.
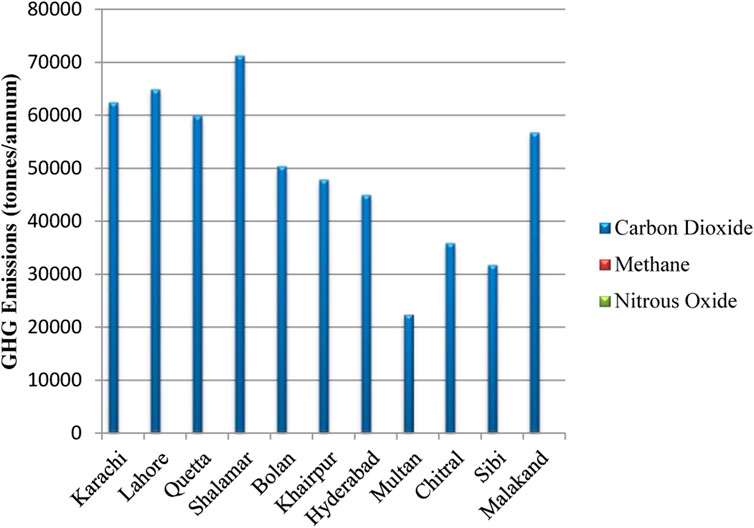
FIGURE 2. Breakdown of annual GHG emission load from all vessels of PNSC based on fuel consumption (VLSFO).
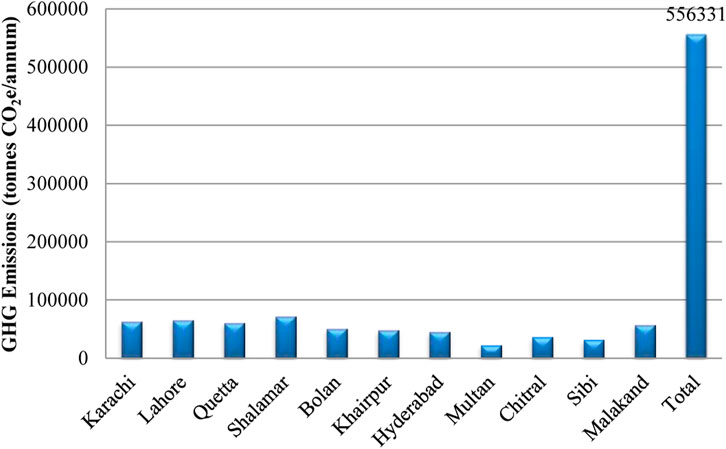
FIGURE 3. Total annual GHG emissions (CO2e) from PNSC fleet based on fuel consumption (VLSFO).
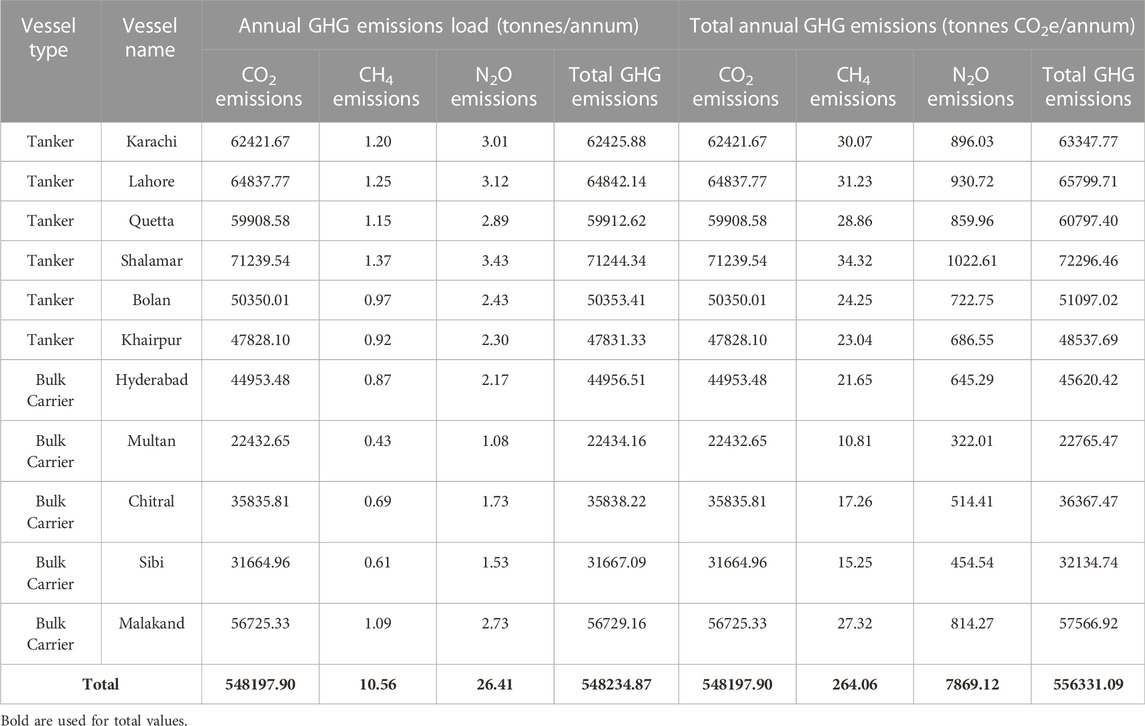
TABLE 9. Breakdown of total GHG Emissions from PNSC’s fleet based on fuel consumption of VLSFO.
The results depict that PNSC’s fleet accounted for a total of 556,331.09 tonnes of GHG emissions (CO2e) annually based on the fuel consumption of VLSFO. As shown in Figure 2, Shalamar is contributing the highest amount of carbon dioxide emissions i.e. 71,239.54 tonnes followed by Lahore and Karachi with emissions of 64,837.77 tonnes and 62,421.67 tonnes respectively. Malakand, Quetta, Bolan, Khairpur, Hyderabad, Chitral, Sibi, and Multan also have a significant share of global CO2 emissions. On contrary, methane (CH4) and nitrous oxide (N2O) emissions from all vessels are negligible.
Figure 4 represents the breakdown of GHG emissions (CO2, CH4, N2O) load from all vessels of PNSC based on annual fuel consumption i.e. Marine gas oil (MGO) whereas, Figure 5 illustrates total annual GHG emissions (CO2e) for PNSC’s fleet. A detailed breakdown of GHG emissions from PNSC’s fleet resulting from the consumption of MGO is presented in Table 10. Results depict that PNSC’s fleet accounted for a total of 11,282.40 tonnes of GHG emissions (CO2e) based on annual fuel consumption i.e. Marine Gas Oil (MGO) for the fiscal year 2021 to 2022. As shown in Figure 4, Malakand, followed by Hyderabad and Sibi, are the leading contributors to global carbon dioxide emissions, contributing 3,386.24 tonnes, 2,995.87 tonnes, and 2,233.28 tonnes per annum respectively. On the other hand, methane (CH4), and nitrous oxide (N2O) emissions from all merchant’s vessels are very low.
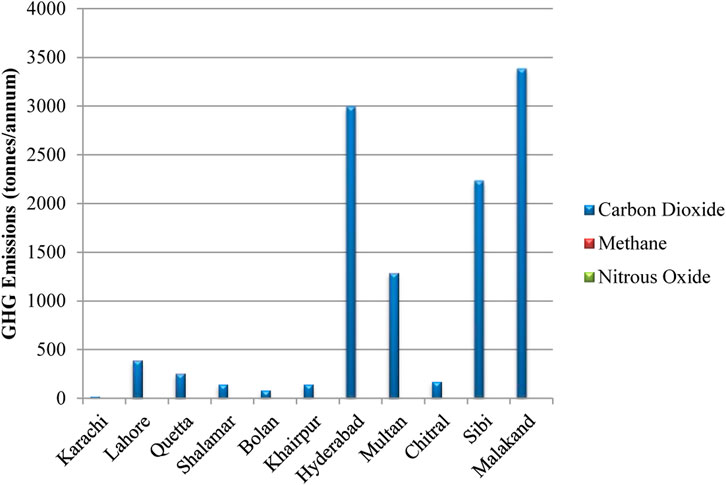
FIGURE 4. Breakdown of annual GHG emissions load from all vessels of PNSC based on fuel consumption (MGO).
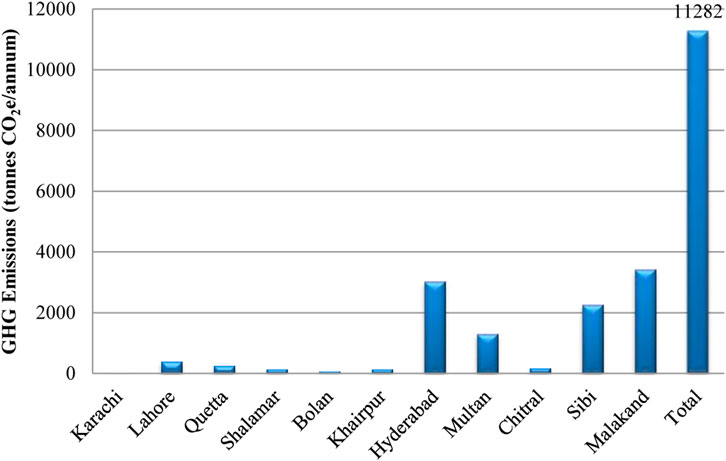
FIGURE 5. Total annual GHG emissions (CO2e) from PNSC fleet based on fuel consumption (MGO).

TABLE 10. Breakdown of total GHG Emissions from PNSC fleet based on fuel consumption of MGO.
3.2.2 PMSA’s fleet
Pakistan Maritime Security Agency (PMSA) is a law enforcement agency that is controlled and managed by Pakistan Navy. Currently, PMSA has a total of 34 vessels which includes 15 hundred tons maritime patrol vessels (15 HT MPVs); 6 hundred tons maritime patrol vessels (6 HT MPVs); corvettes (397 tons); island class (250 tons), and inland patrol boats. Figure 6 illustrates the breakdown of annual GHG emissions load from all types of vessels of PMSA. Figure 7 shows the total annual GHG emissions (CO2e) from the PMSA fleet. A detailed breakdown of annual GHG emissions from PMSA’s fleet is presented in Table 11. Results show that the total GHG emissions from the PMSA fleet accounted for 28,753.46 tonnes (CO2e) based on annual fuel consumption of 3,691.85 tonnes for the period 2021-2022. As shown in Figure 6, 6HT MPVs are leading contributors to carbon dioxide with emissions of 17,505.40 tonnes followed by the second highest contributor i.e. 15HT MPVs with emissions of 8,549.84 tonnes annually. However, Corvettes (397 tons), Island Class (250 tons), Inland Patrol Boats (caterpillar-C9), and Inland Patrol Boats – OBM (outboard motor) are responsible for 1,090.34 tonnes, 418.71 tonnes, 205.25 tonnes, and 403.07 tonnes of carbon dioxide. Whereas, on other hand, annual emissions of methane (CH4) and nitrous oxide (N2O) are very low.
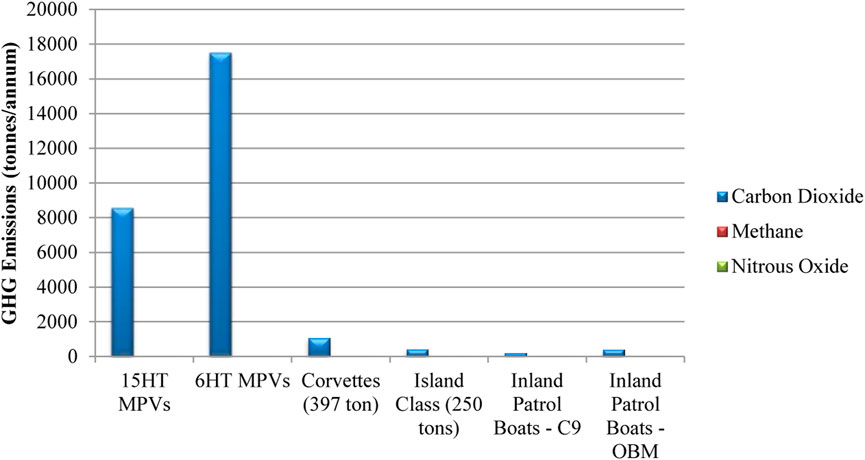
FIGURE 6. Breakdown of annual GHG emissions load from all types of PMSA vessels.
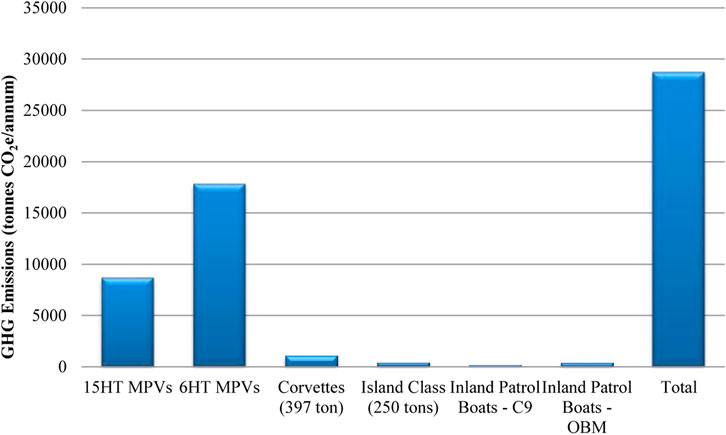
FIGURE 7. Total annual GHG emissions (CO2e) from PMSA fleet.
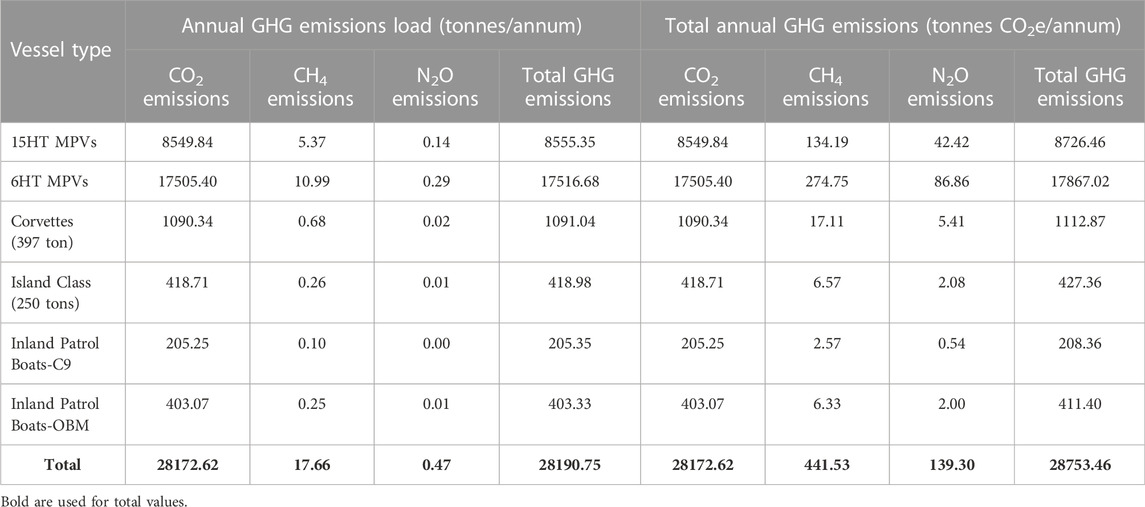
TABLE 11. Breakdown of total GHG Emissions from PMSA Fleet.
3.2.3 Karachi port trust
Karachi Port Trust (KPT) is a federal government agency administered by Federal Maritime Secretary. KPT manages the operations of the Karachi port through several harbour crafts which include dredgers, tugs, barges, floating cranes, and ferry boats. Figure 8 illustrates the breakdown of GHG emissions load from all types of harbour crafts of KPT. Figure 9 shows the total annual GHG emissions (CO2e) from harbour crafts of KPT. Table 12 presents a detailed breakdown of annual GHG emissions resulting from fuel consumption of harbour crafts of KPT. Results show that the total annual GHG emissions from the harbour crafts of KPT accounted for 8,751.10 tonnes of CO2e emissions based on annual fuel consumption of 1,122.60 tonnes of diesel and petrol for the years 2021-2022. Figure 8 depicts that tugs are the leading emitters of carbon dioxide among all other types with an annual emission of 3,994.14 tonnes followed by dredgers with emissions of 3,689.77 tonnes of CO2. On other hand, barges, ferry boats, and floating cranes are responsible for 534.04 tonnes, 248.14 tonnes, and 107.89 tonnes of CO2 respectively with negligible amounts of CH4 and N2O.
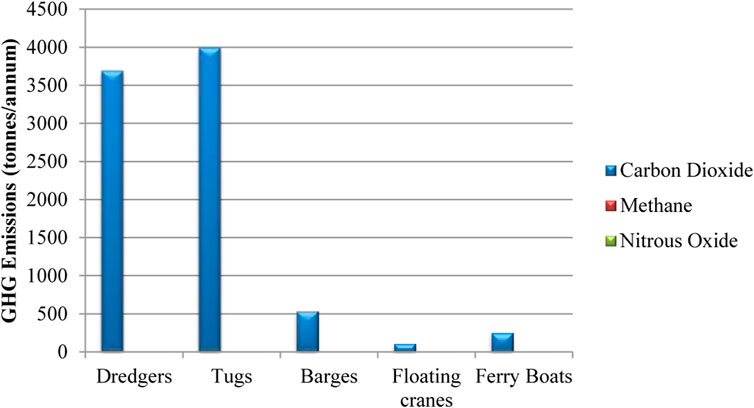
FIGURE 8. Breakdown of GHG emissions load from all types of harbour crafts of KPT.
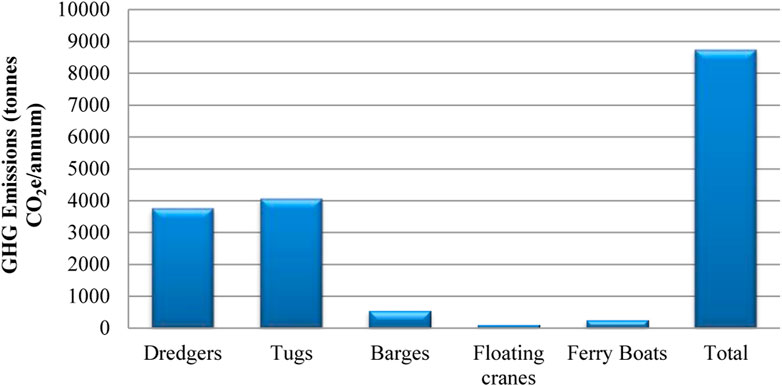
FIGURE 9. Total annual GHG emissions (CO2e) from harbour crafts of KPT.
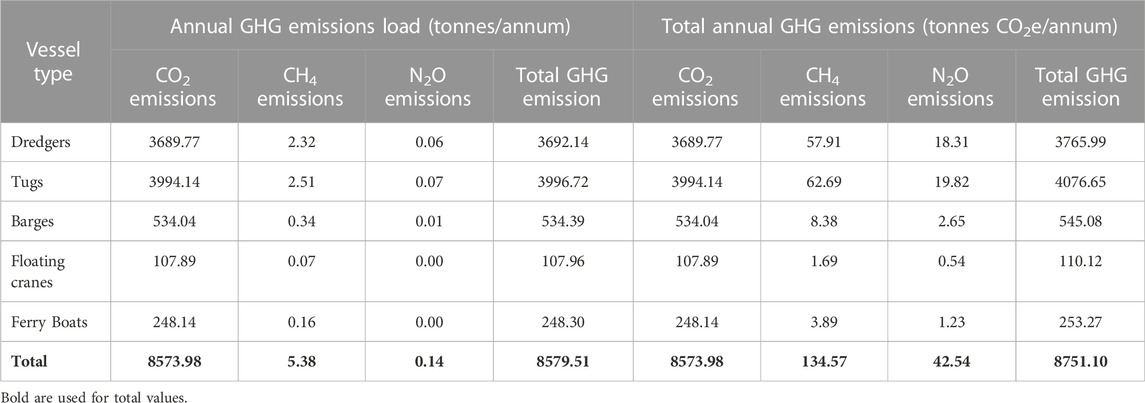
TABLE 12. Breakdown of total annual GHG emissions from harbour crafts of KPT.
3.2.4 Port qasim authority
Several harbour crafts are used by Port Qasim Authority (PQA) to manage and facilitate the operations at Port Qasim including tugs, pilot boats, and small boats. Figure 10 presents the breakdown of the annual GHG emissions load and Figure 11 illustrates the total annual GHG emissions (CO2e) from the harbour crafts of PQA. Results illustrate that the total GHG emissions from harbour crafts of PQA are 5,635.80 tonnes (CO2e) per annum based on annual fuel consumption of 722.97 tonnes of high-speed diesel (HSD). Carbon dioxide is the highest emitted greenhouse gas with emissions of 5,521.74 tonnes annually as shown in Figure 10. Relatively, annual emissions of methane and nitrous oxide are very low i.e. 3.47 and 0.09 tonnes respectively.
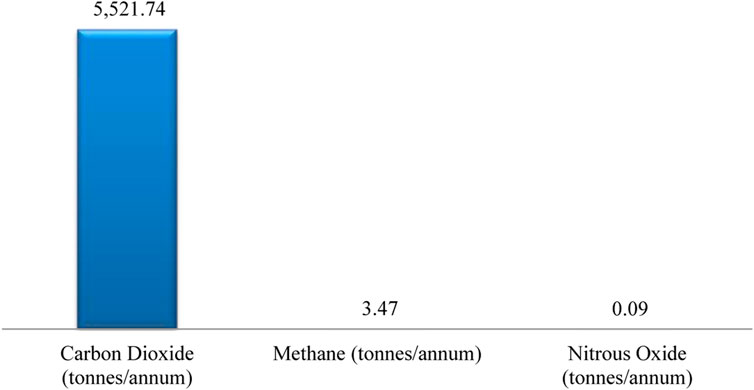
FIGURE 10. Annual GHG emissions load (tonnes/annum) from harbour crafts of PQA.

FIGURE 11. Total annual GHG emissions (tonnes CO2e/annum) from harbour crafts of PQA.
3.2.5 Fishing and other crafts in sindh
There are a total number of 21,899 ships currently operational in the Sindh Province of Pakistan which includes fishing vessels, skiff boats, passenger boats, water and fuel carrying boats, and pleasure boats. Figure 12 shows the breakdown of GHG emissions load from all types of sea-going vessels in Sindh based on annual fuel consumption. Figure 13 presents the total annual GHG emissions (CO2e) from fishing vessels and other crafts in Sindh. A detailed breakdown of GHG Emissions from fishing and all other types of crafts in Sindh is provided in Table 13. Results demonstrate a total amount of 1,467,672.71 tonnes of GHG emissions (CO2e) emitted from fishing vessels and all other types of crafts in Sindh based on annual fuel consumption of diesel and petrol for the period 2021–2022. Fishing vessels are the largest contributor to carbon dioxide emissions among all other types of sea-going vessels. Fishing vessels are responsible for 1,391,615.06 tonnes of CO2 emissions. Emissions from skiff boats are 42,719.30 tonnes of CO2. Water and fuel-carrying boats, passenger boats, and pleasure boats are responsible for 2,623.92 tonnes, 753.21 tonnes, and 487.37 tonnes of CO2 respectively. On contrary, methane and nitrous oxide emissions are very low.
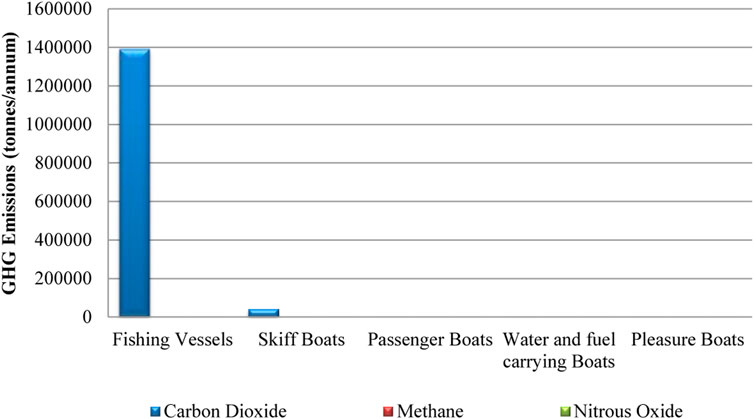
FIGURE 12. Breakdown of GHG emissions load from fishing vessels and other crafts in sindh, Pakistan.
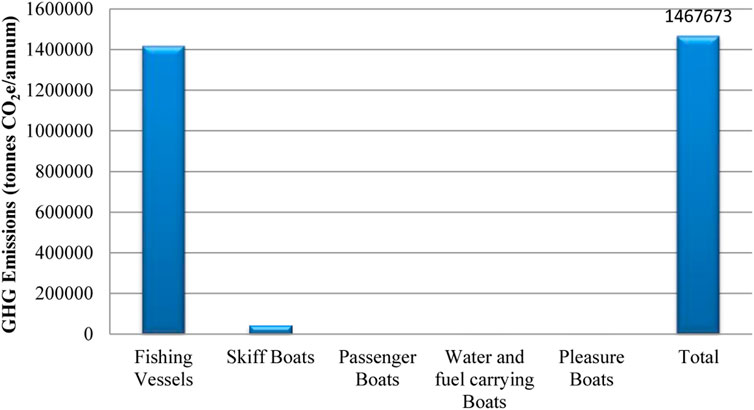
FIGURE 13. Total annual GHG emissions (CO2e) from fishing and other crafts in sindh.
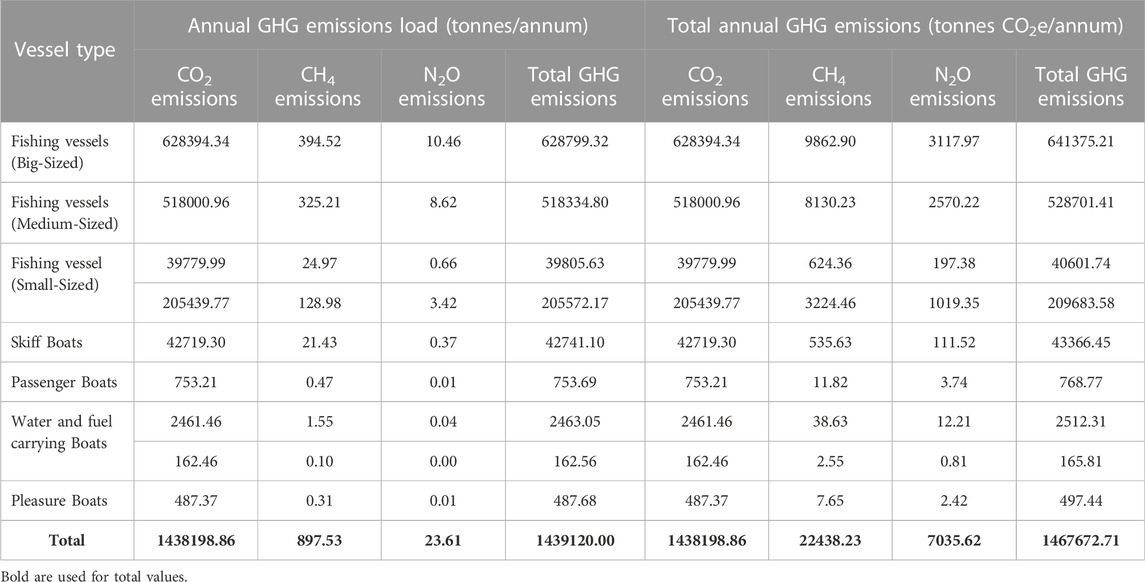
TABLE 13. Breakdown of GHG Emissions from Fishing and other crafts in Sindh, Pakistan.
3.2.6 Fishing and other crafts in balochistan
A total number of 6,837 ships are currently operational in the Balochistan Province of Pakistan which includes fishing vessels, skiff boats, passenger boats, and water and fuel-carrying boats. Figure 14 shows the breakdown of GHG emissions (CO2, CH4, and N2O) from all types of sea-going vessels in Balochistan based on annual fuel consumption. Figure 15 illustrates the total annual GHG emissions (CO2e) from fishing vessels and other crafts in Balochistan. A detailed breakdown of GHG Emissions from fishing and all other types of crafts in Balochistan is provided in Table 14 The results demonstrate a total amount of 390,362.66 tonnes of GHG emissions (CO2e) emitted from fishing vessels and all other types of crafts in Balochistan based on annual fuel consumption for the period 2021–2022. Figure 14 depicts that fishing vessels are the largest contributor to carbon dioxide emissions among all other types of sea-going vessels. Fishing vessels are responsible for 305,685.70 tonnes of CO2 emissions. Emissions from skiff boats are 48,822.06 tonnes of CO2. Passenger boats and water and fuel-carrying boats are responsible for 24,102.61 tonnes and 4,824.46 tonnes of CO2. On contrary, methane and nitrous oxide emissions from all types of sea-going vessels are very low.
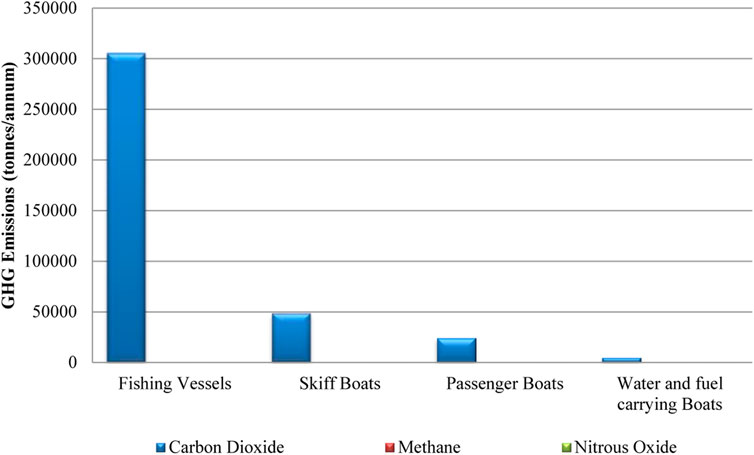
FIGURE 14. Breakdown of GHG emissions from fishing vessels and other crafts in Balochistan, Pakistan.
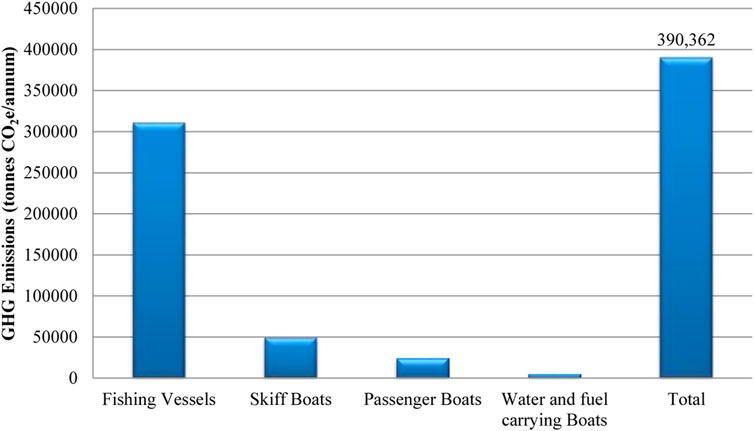
FIGURE 15. Total annual GHG emissions (CO2e) from fishing and other crafts in Balochistan.
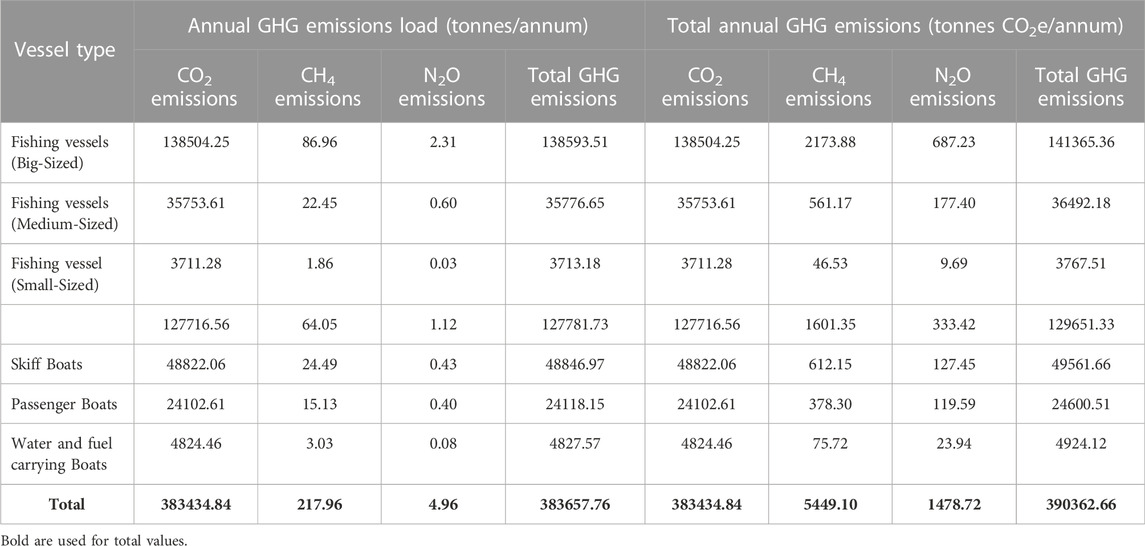
TABLE 14. Breakdown of GHG Emissions from fishing and other crafts in Balochistan, Pakistan.
3.3 Comparison among all types of sea-going vessels in Pakistan
Figure 16 presents the share of all types/sizes of maritime vessels in the country’s total maritime transportation sector emissions. Results depict that fishing vessels are the largest contributor to maritime GHG emissions. Fishing vessels are responsible for 1,731,638.32 tonnes of GHG emissions (CO2e) having a total share of 70.14% of the country’s total emissions from the maritime transportation sector. Tankers are the second largest contributors accounting for 362,926.87 tonnes of GHG emissions (CO2e). Tankers have a share of 14.70% of overall maritime transportation sector emissions. Tankers are followed by bulk carriers and skiff boats. Bulk carriers account for 204,686.61 tonnes of CO2e emissions with a share of 8.29%. Similarly, Skiff boats have a share of 3.76% with annual GHG emissions of 92,928.11 tonnes of CO2e. 6HT MPVs and Passenger Boats represent around 2% of GHG emissions having a value of 17,867.02 and 25,369.28 tonnes of CO2e respectively. The rest of the vessels altogether contributes 1% of the share towards national maritime GHG emissions.
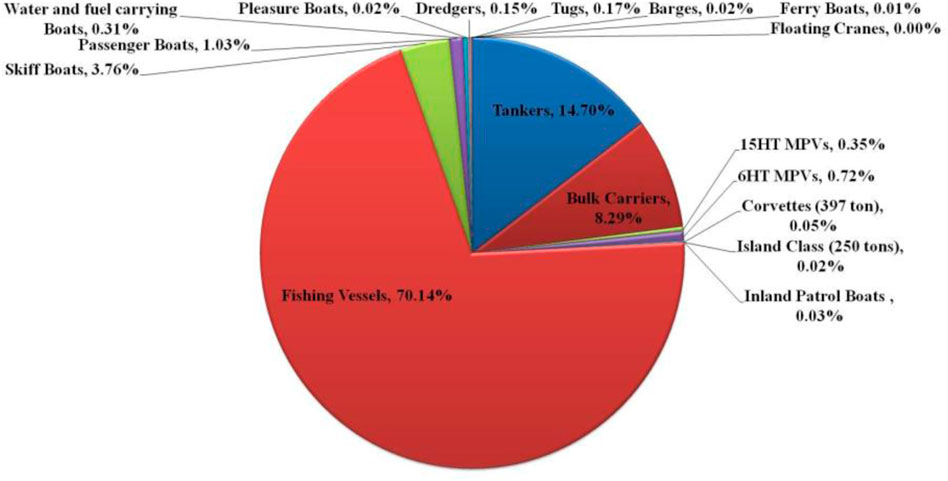
FIGURE 16. Share of GHG emissions (CO2e) from all types/sizes of maritime vessels.
3.4 Calculations of mangroves vis-a-vis carbon offset cost
The area required for mangrove forest vis-à-vis carbon offset scheme is given in Table 15. Mangroves which are recognized as “Blue carbon sinks” sequester 308 kg of carbon dioxide emissions from the atmosphere per tree and 3,082.8 metric tonnes of CO2e are sequestered by mature mangrove forests per hectare based on average growth life i.e. 25 years (Donato et al., 2011; Fatoyinbo et al., 2018; Projects, 2020). Results show that 1 ha of mature mangrove forest will remove 123.312 metric tonnes of CO2e per year hence 20,020 hectares of mature mangrove forest are required to remove 2,468,789.21 metric tonnes of CO2e emissions from the atmosphere in a timeline of 1 year.
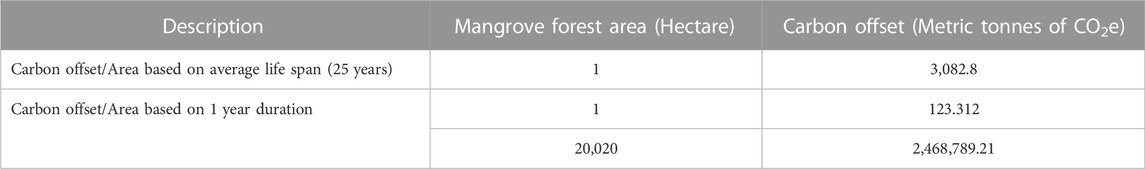
TABLE 15. Mangroves vis-a-vis carbon offset scheme.
4 Discussion
The overall results of the study revealed that the total GHG emissions from all types and sizes of maritime vessels (excluding naval platforms) in Pakistan are 2,468,789.21 tonnes (CO2e) as a result of annual fuel consumption of 310,885.75 tonnes for the period 2021–2022. The business-as-usual case of all types and sizes of maritime vessels in Pakistan has a 4.9% share of reported total emissions from the transportation sector i.e. 51.3 million tonnes (CO2e) in Pakistan’s updated NDC 2021 (GoP, 2021b). Whereas, Pakistan’s Second Communication on Climate Change had reported only a 1% share (0.413 million tonnes CO2e) of maritime vessels in overall transportation sector GHG emissions i.e. 41.197 million tonnes CO2 (GoP, 2018). (Villalba and Gemechu 2011a) highlighted that the allocation of shipping emissions has been the subject of significant controversy (Villalba and Gemechu, 2011b). Although there is a conflict about which emissions should be counted or not counted in the national GHGs inventory vis-à-vis concerns about international voyage-based emissions, the emissions of PNSC’s merchant ships and other crafts should be counted towards the flag state of maritime vessels considering the responsibility, commitments, and strategies of a country towards climate mitigation response.
It is significant to mention that fishing vessels are the largest emitters of GHG emissions (CO2e) accounting for 1,731,638.32 tonnes among all types of sea-going vessels and have a 70% share of the total GHG emissions from the maritime transportation sector. During interviews with various boat owners and Nakhudas from Sindh and Baluchistan, it was found that all kinds of fishing are banned during breeding seasons in June and July. Above mentioned fishing vessels’ emissions are for 10 months excluding June and July. Even then, fishing vessels have dominated as the highest emitters of greenhouse gases.
On one side, fishing vessels, recreational and other crafts collectively are responsible for 75% of the total maritime emissions which are ignored and unaccounted for in the national GHG inventories. It is also quite evident from the study of Parker et al. (2018) that marine fishing fleet is often excluded from global GHGs assessments. The findings of this study revealed that the global fishing fleet accounted for 179 million tonnes of CO2e as a result of 40 billion liters of fuel consumption in 2011 (Parker et al., 2018). On the other side, IMO covered ships of 100 GT and above only for the estimation of global GHG emissions, ignoring ships below 100 GT in which a large number of maritime vessels fall. Fishing vessels, recreational and other crafts are used for multiple purposes in a huge number, and a substantial amount of fuel is consumed, which has not received due attention from authorities or policymakers at the national or international levels. How can the role and impact of the aforementioned vessels be ignored when they have the highest and most significant share of GHG emissions in the maritime sector? Supporting evidence is also reported by Coello et al. (2015) and Endresen et al. (2007) that a significant underestimating of emissions from the maritime sector is non-etheless anticipated to occur from the exclusion of fishing vessels below 100 GT.
Alarmingly, the contribution of GHG emissions from the business-as-usual case of maritime vessels would exceed the calculated value when the fuel consumption of naval ships will be taken into account. Moreover, this study’s results are based on the tier one approach developed by IPCC which relies on fuel consumption data of ships viz-a-viz fuel type. Emissions from maritime vessels would be much higher when detailed studies will be done based on activity-based methods including various aspects of vessel characteristics. The same evidence is also reported by Chang and Wang (2012) and Chang et al. (2013) which highlights the need for a more in-depth analysis of GHG emissions from ports.
The findings of the study by Chang et al. (2013) indicated that the results of GHG emissions from port vessel operations based on an activity-based approach were five times higher than that estimated employing a top-down approach. Therefore, in-depth analysis will assist port authorities in better monitoring GHG emissions and developing GHG emission reduction policies (Chang et al., 2013). However, this study is also significant because this initial preliminary assessment provides insight into the actual gravity of the problem and scale and trend to foresee its share in national transportation. It is critical to highlight that the Government of Pakistan would require 37, 090, 381.57 US$/annum for offsetting carbon emissions i.e. 2,468,789.21 tonnes (CO2e) with an average current market price factor of 15$/tonne CO2e. However, a developing country like Pakistan which is least responsible for the global rising level of GHG emissions (GoP, 2021b) than developed countries but is among the top ten most vulnerable countries (Eckstein and Kreft, 2020) needs to adapt to and mitigate by ensuring a vibrant climate governance framework to combat the emerging climate crisis.
As long as the implication of the carbon offset scheme vis-à-vis mangrove forests is concerned, Pakistan needs approximately 20,020 hectares of mature mangrove forests to remove 2,468,789.21 metric tonnes of CO2e emissions from the atmosphere in a timeline of 1 year. Mangroves are considered one of the most economically effective methods for offsetting carbon emissions because of their massive carbon sequestration potential ranging from 4–10 times more than terrestrial forests (dslb; GreenBiz Group, Inc., 2022). Taillardat et al. (2018) also suggested that mangrove blue carbon strategies are the most effective for climate mitigation at the national level. Now is the time to wake up and take necessary actions and measures to fight against the frightening level of GHG emissions at all levels. The Government of Pakistan must encourage the afforestation of mangroves to deal with the real issue of climate change by offsetting carbon emissions and combatting the climate crisis, successful and effective implementation of which will prove to be fruitful in the years to come.
5 Conclusion
The findings of this study revealed that the total greenhouse gas emissions, including carbon dioxide (CO2), methane (CH4), and nitrous oxide (N2O), from the maritime transportation sector of Pakistan, are 2,468,789.21 tonnes (CO2e) resulting from fuel consumption for the period 2021–2022. The business-as-usual case of all types and sizes of maritime vessels in Pakistan has a 4.9% share of the reported total transportation sector’s emissions in Pakistan’s updated NDC (2021) whereas, Pakistan’s Second Communication on Climate Change had reported only a 1% share of maritime vessels in overall transportation sector GHGs emitted in 2015. Carbon dioxide emissions from maritime transportation amounted to 2,423,211.88 tonnes whereas methane (CH4) and nitrous oxide (N2O) emissions are 1152.77 tonnes and 56.23 tonnes respectively. It is identified that 37, 090, 381.57 US$/annum is required for offsetting carbon emissions. As long as the implication of the carbon offset scheme vis-à-vis mangrove forests is concerned, Pakistan needs approximately 20,020 hectares of mature mangrove forests to remove 2,468,789.21 metric tonnes of CO2e emissions from the atmosphere in a timeline of 1 year. The study’s findings provide a baseline reference scenario for future studies and national GHG inventory and add knowledge to the existing pool of literature which would help in decision-making processes, policy development, and climate mitigation strategies for all types of maritime vessels. Based on the findings of this study, the federal government is suggested to devise a proper mechanism for monitoring of carbon footprint of sea-going vessels and maintaining a periodic GHG emissions inventory by considering the outcome of this study as a baseline reference scenario and launch a GHG emissions reduction programme through shifting maritime vessels to low-carbon or zero-carbon alternative fuels. Besides, this study gives dimensions to future studies to assess the GHG emissions scenario of maritime vessels by employing a bottom-up approach and proposing effective climate mitigation measures for the maritime transportation sector of Pakistan. In addition, this study is limited to the assessment of three GHGs (CO2, CH4, and N2O) resulting from fuel consumption only hence it opens doors for future researchers to explore and analyze the rest of GHGs and other non-GHGs emissions from the maritime transportation sector of Pakistan depending on data availability.
Data availability statement
The data that support the finding of this study are available from the first and corresponding authors on request.
Author contributions
All authors contributed to the article and approved the submitted version. BS developed methodology, data collection, analysis, writing-original Draft; SA supervision, assist in data analysis, Writing-Review and Editing; KMJI Conceptualization, co-supervision, resources, overseeing administration during research work, assist in formal analysis, discussion, writing-review and editing; MAURT writing-review and editing, assist in drawing conclusions, proofread and assistance in submission to the journal by providing resources to cover APC.
Conflict of interest
The authors declare that the research was conducted in the absence of any commercial or financial relationships that could be construed as a potential conflict of interest.
Publisher’s note
All claims expressed in this article are solely those of the authors and do not necessarily represent those of their affiliated organizations, or those of the publisher, the editors and the reviewers. Any product that may be evaluated in this article, or claim that may be made by its manufacturer, is not guaranteed or endorsed by the publisher.
Supplementary material
The Supplementary Material for this article can be found online at: https://www.frontiersin.org/articles/10.3389/fenvs.2022.1076585/full#supplementary-material
References
Al Baroudi, H., Awoyomi, A., Patchigolla, K., Jonnalagadda, K., and Anthony, E. J. (2021). A review of large-scale CO2 shipping and marine emissions management for carbon capture, utilisation and storage. Appl. Energy 287, 116510. doi:10.1016/j.apenergy.2021.116510
Al-Enazi, A., Okonkwo, E. C., Bicer, Y., and Al-Ansari, T. (2021). A review of cleaner alternative fuels for maritime transportation. Energy Rep. 7, 1962–1985. doi:10.1016/j.egyr.2021.03.036
Bouman, E. A., Lindstad, E., Rialland, A. I., and Strømman, A. H. (2017). State-of-the-art technologies, measures, and potential for reducing GHG emissions from shipping – a review. Transp. Res. Part D Transp. Environ. 52, 408–421. doi:10.1016/j.trd.2017.03.022
Cames, M., Graichen, J., Siemons, A., and Cook, V. (2015). Emission reduction targets for international aviation and shipping. Study ENVI Comm. Eur. Union 53, 1689–1699.
Chang, C.-C. (2012). Marine energy consumption , national economic activity , and greenhouse gas emissions from international shipping. Energy Policy 41, 843–848. doi:10.1016/j.enpol.2011.11.066
Chang, C.-C., and Wang, C.-M. (2012). Evaluating the effects of green port policy: Case study of Kaohsiung harbor in Taiwan. Transp. Res. Part D Transp. Environ. 17, 185–189. doi:10.1016/j.trd.2011.11.006
Chang, Y., Song, Y., and Roh, Y. (2013). Assessing greenhouse gas emissions from port vessel operations at the Port of Incheon. Transp. Res. Part D Transp. Environ. 25, 1–4. doi:10.1016/j.trd.2013.06.008
Chen, D., Zhao, Y., Nelson, P., Li, Y., Wang, X., Zhou, Y., et al. (2016). Estimating ship emissions based on AIS data for port of Tianjin, China. Atmos. Environ. X. 145, 10–18. doi:10.1016/j.atmosenv.2016.08.086
Chen, J., Fei, Y., and Wan, Z. (2019). The relationship between the development of global maritime fleets and GHG emission from shipping. J. Environ. Manage. 242, 31–39. doi:10.1016/j.jenvman.2019.03.136
Chu-Van, T., Ristovski, Z., Pourkhesalian, A. M., Rainey, T., Garaniya, V., Abbassi, R., et al. (2019). A comparison of particulate matter and gaseous emission factors from two large cargo vessels during manoeuvring conditions. Energy Rep. 5, 1390–1398. doi:10.1016/j.egyr.2019.10.001
Coello, J., Williams, I., Hudson, D. A., and Kemp, S. (2015). An AIS-based approach to calculate atmospheric emissions from the UK fishing fleet. Atmos. Environ. X. 114, 1–7. doi:10.1016/j.atmosenv.2015.05.011
Donato, D. C., Kauffman, J. B., Murdiyarso, D., Kurnianto, S., Stidham, M., and Kanninen, M. (2011). Mangroves among the most carbon-rich forests in the tropics. Nat. Geosci. 4, 293–297. doi:10.1038/ngeo1123
Eckstein, D., and Kreft, S. (2020). Global climate risk index 2021. Who suffers most from extreme weather events? Think. Tank. Res. 7, 28.Available at: http://germanwatch.org/en/download/8551.pdf
Eden Restoration Project (2020). Plant trees, saves LivesMangrove forest carbon sequestration. Available at: https://rosian.org/documents/mangrove-carbon-offset-eden.pdf (Accessed August 28, 2022).
Endresen, Ø., Sørgård, E., Behrens, H. L., Brett, P. O., and Isaksen, I. S. A. (2007). A historical reconstruction of ships’ fuel consumption and emissions. J. Geophys. Res. 112, D12301–D12317. doi:10.1029/2006JD007630
Eyring, V., Isaksen, I. S. A., Berntsen, T., Collins, W. J., Corbett, J. J., Endresen, O., et al. (2010). Transport impacts on atmosphere and climate : Shipping. Atmos. Environ. X. 44, 4735–4771. doi:10.1016/j.atmosenv.2009.04.059
Fatoyinbo, T., Feliciano, E. A., Lagomasino, D., Lee, S. K., and Trettin, C. (2018). Estimating mangrove aboveground biomass from airborne LiDAR data: A case study from the zambezi river delta. Environ. Res. Lett. 13, 025012. doi:10.1088/1748-9326/aa9f03
Fitzgerald, W. B., Howitt, O. J. A., and Smith, I. J. (2011). Greenhouse gas emissions from the international maritime transport of New Zealand’s imports and exports. Energy Policy 39, 1521–1531. doi:10.1016/j.enpol.2010.12.026
GoP, (2021a). National climate change policy. Islamabad, Pakistan: Government of Pakistan. Available at: http://mocc.gov.pk/Policies.
GoP, (2018). Pakistan’s second national communication on climate change. Islamabad, Pakistan: Government of Pakistan. Available at: http://www.gcisc.org.pk/SNC_Pakistan.pdf.
GoP, (2021b). Updated nationally determined contributions 2021. Islamabad, Pakistan: Government of Pakistan.
GreenBiz Group, Inc. (2022). Apple, Conservation International introduce mangrove carbon credit. Available at: https://www.greenbiz.com/article/apple-conservation-international-introduce-mangrove-carbon-credit (Accessed August 28, 2022).
Gritsenko, D. (2017). Regulating GHG Emissions from shipping: Local, global, or polycentric approach? Mar. Policy 84, 130–133. doi:10.1016/j.marpol.2017.07.010
Halim, R. A., Kirstein, L., Merk, O., and Martinez, L. M. (2018). Decarbonization pathways for international maritime transport : A model-based policy impact assessment. doi:10.3390/su10072243
Hussain, M., Butt, A. R., and Uzma, F. (2020). A comprehensive review of climate change impacts , adaptation , and mitigation on environmental and natural calamities in Pakistan. Calamities 76, 46566.
IMO (2019). IMO’s work to cut GHG emissions from ships. Available at: https://www.imo.org/en/MediaCentre/HotTopics/Pages/Cutting-GHG-emissions.aspx (Accessed September 12, 2022).
Inal, O. B., Zincir, B., and Deniz, C. (2021). Hydrogen and ammonia for the decarbonization of shipping. Int. Hydrog. Technol. Congr. Available at: https://www.researchgate.net/publication/351972036_Hydrogen_and_Ammonia_for_the_Decarbonization_of_Shipping.
Jiang, C., Zheng, S., Ng, A. K. Y., Ge, Y. E., and Fu, X. (2020). The climate change strategies of seaports: Mitigation vs. adaptation. Transp. Res. Part D Transp. Environ. 89, 102603. doi:10.1016/j.trd.2020.102603
Johansson, L., Jalkanen, J. P., and Kukkonen, J. (2017). Global assessment of shipping emissions in 2015 on a high spatial and temporal resolution. Atmos. Environ. X. 167, 403–415. doi:10.1016/j.atmosenv.2017.08.042
Joung, T.-H., Kang, S.-G., Lee, J.-K., and Ahn, J. (2020). The IMO initial strategy for reducing Greenhouse Gas(GHG) emissions, and its follow-up actions towards 2050. J. Int. Marit. Saf. Environ. Aff. Shipp. 4, 1–7. doi:10.1080/25725084.2019.1707938
Kokosalakis, G., Merika, A., and Merika, X. A. (2020). Environmental regulation on the energy-intensive container ship sector: A restraint or opportunity? Mar. Policy 125, 104278. doi:10.1016/j.marpol.2020.104278
Kramel, D., Muri, H., Kim, Y., Lonka, R., Nielsen, J. B., Ringvold, A. L., et al. (2021). Global shipping emissions from a well-to-wake perspective: The MariTEAM model. Environ. Sci. Technol. 55, 15040–15050. doi:10.1021/acs.est.1c03937
Li, X., Kuang, H., and Hu, Y. (2019). Carbon mitigation strategies of port selection and multimodal transport operations-A case study of Northeast China. Sustainability 11, 4877. doi:10.3390/su11184877
Mersin, K., Bayirhan, I., and Gazioglu, C. (2019). Review of CO2 emission and reducing methods in maritime transportation. Therm. Sci. 23, 2073–2079. Available at: http://www.doiserbia.nb.rs/img/doi/0354-9836/2019/0354-98361900372M.pdf.
Muhammad, S., and Long, X. (2020). China’s seaborne oil import and shipping emissions: The prospect of belt and road initiative. Mar. Pollut. Bull. 158, 111422. doi:10.1016/j.marpolbul.2020.111422
Notte, A. L., Tonin, S., and Lucaroni, G. (2018). Assessing direct and indirect emissions of greenhouse gases in road transportation , taking into account the role of uncertainty in the emissions inventory. Environ. Impact Assess. Rev. 69, 82–93. doi:10.1016/j.eiar.2017.11.008
Olukanni, D. O., and Esu, C. O. (2018). Estimating greenhouse gas emissions from port vessel operations at the Lagos and Tin Can ports of Nigeria. Cogent Eng. 5, 1507267–1507269. doi:10.1080/23311916.2018.1507267
Parker, R. W. R., Blanchard, J. L., Gardner, C., Green, B. S., Hartmann, K., Tyedmers, P. H., et al. (2018). Fuel use and greenhouse gas emissions of world fisheries. Nat. Clim. Chang. 8, 333–337. doi:10.1038/s41558-018-0117-x
PNSC (2015). Pakistan national shipping corporation. Available at: https://www.pnsc.com.pk/(Accessed October 4, 2022).
Prasad, R. D., and Raturi, A. (2019). Fuel demand and emissions for maritime sector in Fiji: Current status and low-carbon strategies. Mar. Policy 102, 40–50. doi:10.1016/j.marpol.2019.01.008
Schnurr, R. E. J., and Walker, T. R. (2019). Marine transportation and energy use. Ref. Modul. Earth Syst. Environ. Sci. doi:10.1016/b978-0-12-409548-9.09270-8
Styhre, L., Winnes, H., Black, J., Lee, J., and Le-Griffin, H. (2017). Greenhouse gas emissions from ships in ports – case studies in four continents. Transp. Res. Part D Transp. Environ. 54, 212–224. doi:10.1016/J.TRD.2017.04.033
Taillardat, P., Friess, D. A., Lupascu, M., Da, F., and Taillardat, P. (2018). Mangrove blue carbon strategies for climate change mitigation are most effective at the national scale. Carbon 34, 178292.
Tatar, V., and Ozer, M. B. (2018). The impacts of CO2 emissions from maritime transport on the environment and climate change. Int. J. Environ. Trends 2 (1), 5–24.
Tokuslu, A. (2021). Estimating greenhouse gas emissions from ships on four ports of Georgia from 2010 to 2018. Environ. Monit. Assess. 193, 385. doi:10.1007/s10661-021-09169-w
UNCTAD (2009). Maritime transport and the climate change challenge. Ports Environ. 45, 1672. doi:10.1108/ijccsm.2012.41404daa.008
US EPA (2022a). Emission factors for greenhouse gas inventories. Available at: https://www.epa.gov/system/files/documents/2022-04/ghg_emission_factors_hub.pdf.
US EPA (2022b). Sources of greenhouse gas emissions. Available at: https://www.epa.gov/ghgemissions/sources-greenhouse-gas-emissions (Accessed May 9, 2022).
Villalba, G., and Gemechu, E. D. (2011a). Estimating GHG emissions of marine ports-the case of Barcelona. Energy Policy 39, 1363–1368. doi:10.1016/j.enpol.2010.12.008
Villalba, G., and Gemechu, E. D. (2011b). Estimating GHG emissions of marine ports—The case of barcelona. Energy Policy 39, 1363–1368. doi:10.1016/J.ENPOL.2010.12.008
Walker, T. R., Adebambo, O., Del Aguila Feijoo, M. C., Elhaimer, E., Hossain, T., Edwards, S. J., et al. (2018). Environmental effects of marine transportation. Second Edi. Elsevier. doi:10.1016/B978-0-12-805052-1.00030-9
Yang, H., and Ma, X. (2019). Uncovering CO2 emissions patterns from China-oriented international maritime transport: Decomposition and decoupling analysis. Sustainability 11, 2826. doi:10.3390/su11102826
Zhou, X., Cheng, L., and Li, M. (2020). Assessing and mapping maritime transportation risk based on spatial fuzzy multi-criteria decision making: A case study in the south China sea. Ocean. Eng. 208, 107403. doi:10.1016/j.oceaneng.2020.107403
Zincir, B. (2020). A short review of ammonia as an alternative marine fuel for decarbonised maritime transportation. Available at: https://www.researchgate.net/publication/346037882.Proceedings of the ICEESENSeptember 2022Turkey
Keywords: GHG emissions, maritime transportation, climate mitigation, sea-going vessels, fuel consumption, carbon offset
Citation: Semab B, Iqbal KMJ, Amir S and Tariq MAUR (2023) Development of greenhouse gas emissions baseline and identification of carbon offset cost for maritime vessels of a developing country. Front. Environ. Sci. 10:1076585. doi: 10.3389/fenvs.2022.1076585
Received: 21 October 2022; Accepted: 29 November 2022;
Published: 04 January 2023.
Edited by:
Gustavo J. Nagy, Universidad de la República, UruguayReviewed by:
Rima Jamal Isaifan, Hamad bin Khalifa University, QatarBarry D. Solomon, Michigan Technological University, United States
Copyright © 2023 Semab, Iqbal, Amir and Tariq. This is an open-access article distributed under the terms of the Creative Commons Attribution License (CC BY). The use, distribution or reproduction in other forums is permitted, provided the original author(s) and the copyright owner(s) are credited and that the original publication in this journal is cited, in accordance with accepted academic practice. No use, distribution or reproduction is permitted which does not comply with these terms.
*Correspondence: Muhammad Atiq Ur Rehman Tariq, YXRpcS50YXJpcUB5YWhvby5jb20=