- 1Sorbonne Université, Observatoire de Paris, Université PSL, CNRS, LERMA, Paris, France
- 2International Center for Tropical Agriculture (CIAT), Cali, Colombia
Weather and climate strongly impact coffee; however, few studies have measured this impact on robusta coffee yield. This is because the yield record is not long enough, and/or the data are only available at a local farm level. A data-driven approach is developed here to 1) identify how sensitive Vietnamese robusta coffee is to weather on district and provincial levels, 2) during which key moments weather is most influential for yield, and 3) how long before harvest, yield could potentially be forecasted. Robusta coffee yield time series were available from 2000 to 2018 for the Central Highlands, where 40% of global robusta coffee is produced. Multiple linear regression has been used to assess the effect of weather on coffee yield, with regularization techniques such as PCA and leave-one-out to avoid over-fitting the regression models. The data suggest that robusta coffee in Vietnam is most sensitive to two key moments: a prolonged rainy season of the previous year favoring vegetative growth, thereby increasing the potential yield (i.e., number of fruiting nodes), while low rainfall during bean formation decreases yield. Depending on location, these moments could be used to forecast the yield anomaly with 3–6 months’ anticipation. The sensitivity of yield anomalies to weather varied substantially between provinces and even districts. In Dak Lak and some Lam Dong districts, weather explained up to 36% of the robusta coffee yield anomalies variation, while low sensitivities were identified in Dak Nong and Gia Lai districts. Our statistical model can be used as a seasonal forecasting tool for the management of coffee production. It can also be applied to climate change studies, i.e., using this statistical model in climate simulations to see the tendency of coffee in the following decades.
1 Introduction
Coffee is one of the most traded agricultural commodities in the world. It is a major cash crop and an important foreign exchange earner for many coffee producing countries. Robusta coffee (Coffea canephora Pierre ex A. Froehner) is the second most economically significant species of coffee plants (FAO, 2019; United States Department of Agriculture - Foreign Agricultural Service, 2019).
Several studies have indicated high sensitivity of coffee to weather (Craparo et al., 2015; Kath et al., 2020, 2021) and climate (Davis et al., 2012; Bunn et al., 2015b; Moat et al., 2017). The interactive effects of precipitation and temperature define where coffee can be grown as an economically profitable crop as well as year-to-year variability in coffee yield and quality. High sensitivity to changing precipitation patterns and increasing temperature have raised strong concerns regarding future viability of coffee to support many coffee farmers’ livelihoods and meet future coffee demand in a climate change context. For example, climate change is expected to significantly reduce areas suitable for coffee growth (Bunn et al., 2015b; Imbach et al., 2017). Furthermore, for robusta coffee in Vietnam and Indonesia, every 1°C increase in mean minimum/maximum temperatures (above 16.2/24.1°C) during the growing season was suggested to lead to a 14 %-yield reduction (Kath et al., 2020). Another study indicates that precipitation-sensitivity is more important for robusta coffee than arabica coffee, the latter being more sensitive to temperature (Bunn et al., 2015b).
Although weather and climate play an important role in agriculture, few studies have addressed the weather impact on coffee yield, especially for robusta coffee. Long-term coffee yield time series for several contrasting environments are required for a robust statistical assessment; however, such data are mostly lacking. Aggregated data on different administrative levels are publicly available from several countries; yet again, most countries have a limited time record and/or report yields only for large spatial areas. Thus, the few studies that assessed weather impact on coffee yield have used yield datasets over some specific locations (e.g., few Brazilian municipalities or farm-level data) with limited time series (the maximum of 10 years) (de Oliveira Aparecido et al., 2017; Valeriano et al., 2018; Kath et al., 2020); while previous global studies made use of indirect coffee information such as the occurrence of coffee-production without yield data (Bunn et al., 2015a, Bunn et al., 2015b). This study focuses on robusta coffee of the Central Highlands of Vietnam, the biggest robusta coffee producing country, using 19 years of data.
Previous studies analyzed differing weather/climate variables from different sources, such as data from surface meteorological stations, interpolated high-resolution climatology data or gridded time-series weather data from satellite and/or models. For example, de Oliveira Aparecido et al. (2017) used weather measurements obtained in automated meteorological stations to forecast coffee yield in Minas Gerais, Brazil. This strategy is only viable in areas with a high density of meteorological stations covering a substantial spatial extent, a long-enough time record, and good quality-check procedures. This is not available in most coffee growing areas. Many studies have also used gridded weather data as major inputs for regional yield forecasting (Zhang and Huang, 2012; Valeriano et al., 2018). Bioclimatic variables based on climatology from WorldClim (Hijmans et al., 2005) have widely been used with species distribution models (O’Donnell and Ignizio, 2012; Bunn et al., 2015a; Bunn et al., 2015b; Läderach et al., 2017; Gomes et al., 2020; Davis et al., 2021).
The approach to link weather to coffee yield can take several forms, from statistical approaches as outlined above to process-based models that intend to integrate the current understanding of plant growth and development (Rodríguez et al., 2011; Rahn et al., 2018; Vezy et al., 2020). The process-based approach is often exemplified at a local scale (e.g., a farm level). This study thus prefers a statistical approach to explore the weather variables affecting coffee production on a larger spatial scale (e.g., the district and/or provincial levels). The challenge with statistical models is the limited time-series yield data (less than 20 years of data). Because 1 year of data represents one sample, it is not easy to obtain enough samples to evaluate the weather information and build impact models. Moreover, once a statistical model is calibrated on historical data, it is particularly challenging to quantify the model performance in different regions or weather conditions, using years not included in the historical record. We aim to tackle this using information content techniques, dimension reduction techniques, multi-linear models, and generalization estimation techniques.
Our study focuses on the coffee yield of the leading robusta coffee-producing provinces in the Central Highlands of Vietnam on province and district levels. The objectives of this study are: 1) to propose a simple approach that identifies the most important weather predictors related to coffee yield; 2) to propose a mathematical framework to predict the weather-related variability of coffee yield; and 3) understand the weather response of Vietnamese robusta coffee.
2 Materials and Methods
2.1 Materials
2.1.1 Study Area
Vietnam is the second-largest coffee producer worldwide after Brazil and the leading robusta coffee producer, with more than 40% of global robusta coffee in 2019 (FAO, 2019; United States Department of Agriculture - Foreign Agricultural Service, 2019). All Vietnamese robusta coffee comes from the Central Highlands, which lies on a series of contiguous plateaus with an elevation ranging from 200 to 1,500 m, with an annual average temperature of about 22 °C and an annual rainfall of 1800–2000 mm per year. Due to the long dry season of 5 months, coffee farms are irrigated (starting in January/February up to the rainy season). The Central Highlands region includes five provinces: Kon Tum, Gia Lai, Dak Lak, Dak Nong, and Lam Dong; each province is divided into several districts.
Figure 1 presents the study area in the Central Highland of Vietnam, including its elevation (Figure 1A) and the coffee information (i.e., average planted area, yield, and production in Figures 1B-D, respectively). Here, we focus on high-intensity robusta coffee production districts, i.e., 20 districts with a coffee planting area higher than 10 thousand hectares (Figure 1B). Figure 1D shows that Dak Lak and Lam Dong districts produce much more coffee than other districts. From 2000 to 2018, Dak Lak produced on average 35.36% of Vietnam’s total coffee (about 1,200 tons), followed by Lam Dong with 27.33%, Dak Nong with 14.82%, and Gia Lai with 13.27%. The coffee harvest season occurs from October to January.
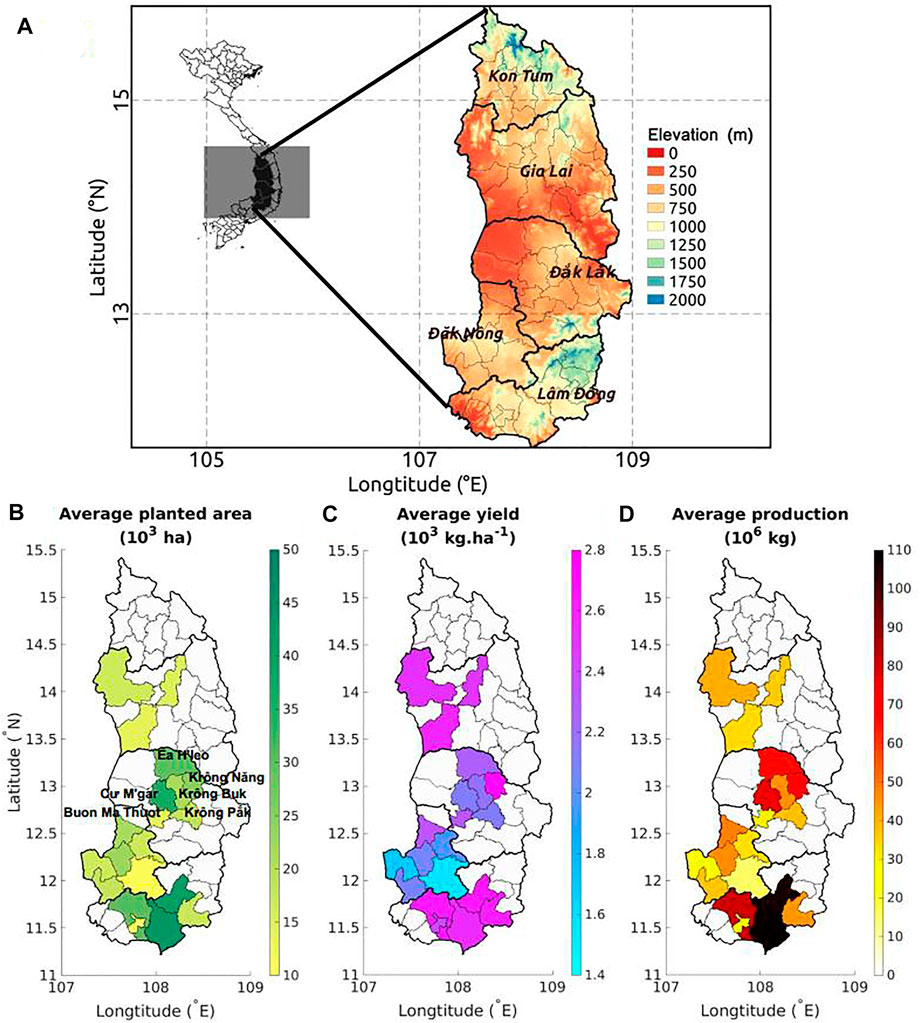
FIGURE 1. (A) The elevation (in m) over the Central Highlands of Vietnam. (B) The average planted coffee area (in 103 ha), (C) coffee yield (in 103 kg⋅ha−1), (D) coffee production (in 106 kg), averaged from 2010 to 2018 over the 20 selected districts—with high-intensity robusta coffee production—in the Central Highlands.
2.1.2 Yield Data
The provincial and district level coffee statistics were obtained from the General Statistics Office of Vietnam (GSOV) for a period of 19 years, from 2000 to 2018 (Figure 2A).
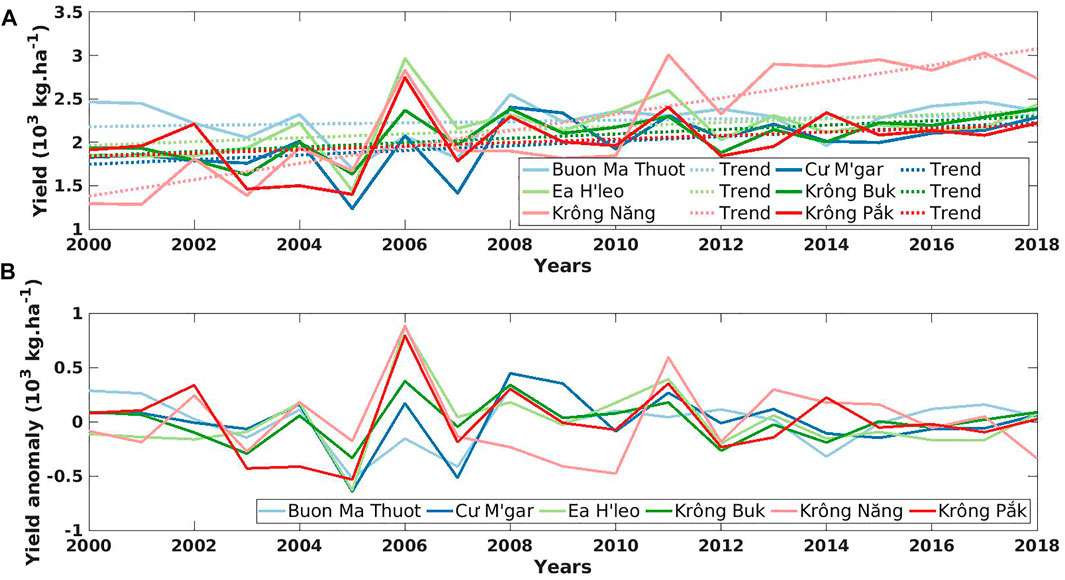
FIGURE 2. (A) The coffee yield time series and its trend (in 103 kg⋅ha−1); and (B) its corresponding yield anomalies (in 103 kg⋅ha−1) of study districts in Dak Lak (Vietnam), from 2000 to 2018.
Long-term trend identification–To analyze the yield data, the long-term trend was first determined. This long-term trend in coffee yield often describes the changes in agricultural practices (e.g., agro-management and irrigation practices) or indirect factors affecting these practices, such as changes in coffee price (Mathieu and Aires, 2016; Miao et al., 2016). Consequently, suppressing this trend from the yield time series allows removing the impact of non-weather related factors.
Anomaly calculation–Analysis of weather impact on coffee yield was based on the absolute yield-anomalies with respect to the previous long-term trend. The coffee yield for year t is defined as y(t), and the long-term trend value is represented by
If a(t) > 0, then the yield in year t is higher than average, and vice versa.
Trend identification–Yield steadily increases from 2000 to 2018 (Figure 2A). Therefore, a simple linear function was used to define the robusta coffee trend:
where y0 is the yield in the year 2000, and α is the annual rate of increment. In Figure 2B, the robusta coffee yield anomalies from 2000 to 2011 show more variability, while fluctuations are lower in the second half period (i.e., 2012–2018). This might be due to the coffee price drop at the beginning of the 21st century, leading to less investments in agronomic management and therefore being more sensitive to weather fluctuations (Miao et al., 2016). In contrast, in the second period, robusta coffee yield became more stable and weather-independent, most likely due to improving agricultural practices.
2.1.3 Phenological Processes and Relationship With Weather
As we aim to study the weather impact on robusta coffee yield, it is necessary to understand the phenological processes and how they are affected by weather. In general, a coffee plant takes roughly 3 years to develop, from seed germination to first flowering and then fruit production (Arcila-Pulgarín et al., 2002; Wintgens, 2004). It is productive for about 30 years (Wintgens, 2004) but can be more than 50 years, or even up to 80 years with good management. The phenological cycle of coffee trees varies depending on various factors such as the species, variety, weather, and agriculture practices.
Figure 3 exemplifies broad phenological stages for robusta coffee in the Central Highlands of Vietnam. Mature coffee trees undergo several plant growth and developmental stages before harvesting:
• Flower bud formation and growth: During this period, the development of a serial bud into a flower bud is largely controlled by plant hormones activated by the change in day length and/or a drop in temperature (Descroix and Snoeck, 2004) (Majerowicz and Sondahl, 2005). At the end of the growing phase, these buds enter into a dormant phase until flowering is stimulated.
• Flowering: The dormancy of the flower buds is usually broken by sudden relief of water stress (e.g., the first rains of the wet season, irrigation) and/or a drastic fall in temperature. Water is necessary for this process, but heavy rain could cause an acute form of floral atrophy. The flowers are often pollinated within 24–48 h.
• Fruit development, including pinhead (a very young fruit) grain expansion, and grain (bean) formation: After pollination, the very young fruits (e.g., pinheads) remain dormant with low water requirements. From the second to third month after blossoming, the fruits start to swell, which increases the water requirements. Thus, this process usually happens during the onset of the rainy season.
• Maturation (fruit ripening): Between the sixth and the eighth months after fertilization, the fruit reaches maturity, which occurs during the beginning and/or the middle of the dry season since adequate temperature and sunlight promote the ripening of coffee fruits.
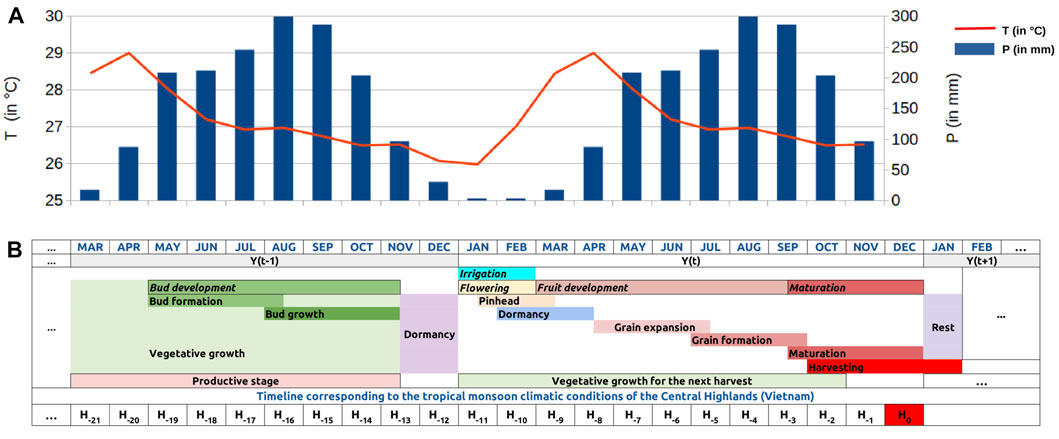
FIGURE 3. (A) The weather profile [3-months average of mean temperature (T) and precipitation (P)] in Dak Lak averaged from 2000 to 2018, and (B) the phenology of robusta coffee corresponding to the tropical monsoon climatic conditions of the Central Highlands (Vietnam).
The time required from flowering until fruit ripening varies according to various factors (e.g., variety, climate condition, management). In general, it is about 9–11 months for robusta coffee.
2.1.4 Weather Data
Monthly-mean data–The monthly-mean of different weather variables, including total precipitation and 2 m temperature data among others, were collected for the period 2000–2018, from the ERA5-Land (covering land areas of the ERA5 re-analysis of the European Center for Medium-Range Weather Forecasts (ECMWF) (Hersbach et al., 2018)), with a spatial resolution of 0.1 ° × 0.1 ° (about 10 km × 10 km). The data are available from https://cds.climate.copernicus.eu/cdsapp#!/home. The data is projected from its original 0.1 ° × 0.1 ° regular grid into the resolution of the selected administrative levels (e.g., provincial and district levels) to match the resolution of coffee yields, presented in Figure 4. Another alternative could be analyzed by, for instance, agroclimatic zones. However, there is a need to gather coffee yield by corresponding zones in this case. This step can mix the coffee information or require yield data at a higher resolution. As a result, our study will work at the same resolution levels provided by the coffee yield information.
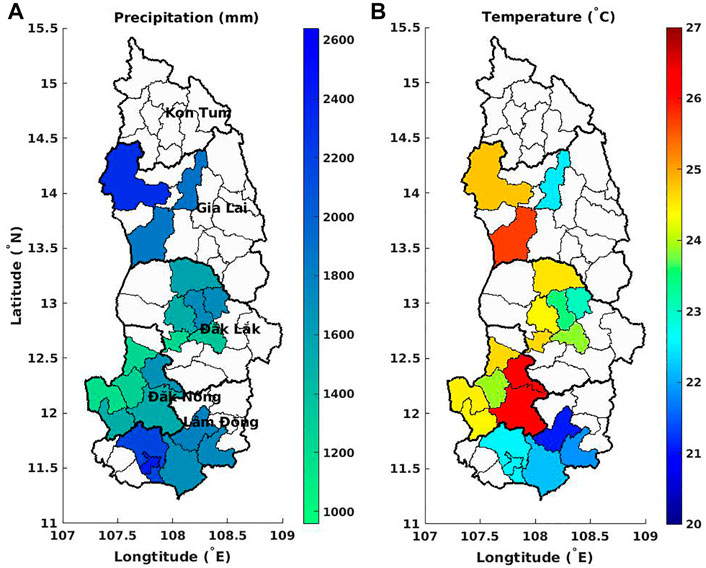
FIGURE 4. (A) Mean annual total precipitation (in mm) and (B) average annual temperature (in °C) over the 20 selected districts in the Central Highlands (Vietnam), averaged from 2010 to 2018.
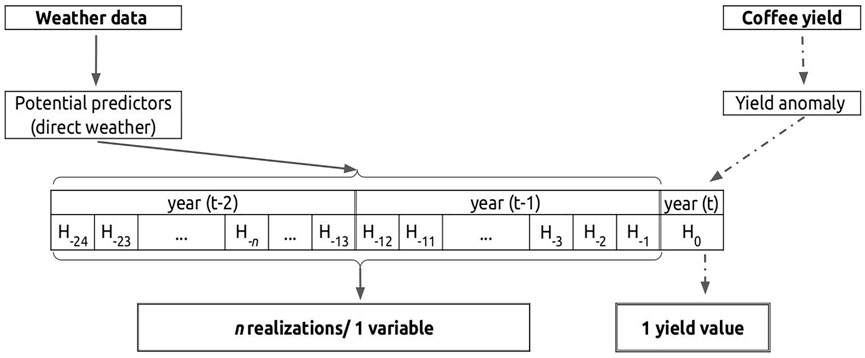
Weather variables–In the literature, statistical approaches often consider precipitation, air temperature (minimum, mean, and maximum), solar radiation, and/or other variables derived from these basic variables (de Oliveira Aparecido et al., 2017; Valeriano et al., 2018; Kath et al., 2020, 2021). This study selects monthly total precipitation (P) and average temperature (T) as explanatory variables for robusta coffee yield. Other variables such as solar radiation, maximum and minimum temperature were also assessed, but they were excluded because they either show low correlations to the yield anomalies or are highly correlated to the precipitation and temperature variables. The weather data will be evaluated for n = 19 months: from the beginning of the bud development to the peak of the harvest season H0 (as shown in Figure 3). The value n varies from 1 to 24 (shown in Figure 5), depending on the coffee phenology in the study locations. Here, we use n = 19, resulting in 38 potential inputs (i.e., 19 realizations (chronological data) for P and T series), for modelling Vietnamese robusta coffee yield.
Similar to the yield data, we considered the trend in weather anomalies, but the trend of about 2 decades is not significant compared to the inter-annual variations (Mathieu and Aires, 2016). Therefore, the long-term trend is omitted, and relative anomalies will be computed from the long-term average. This average value is calculated for each of the n months before H0. Furthermore, a 3-months moving average is applied to reduce the variability at the monthly scale. This variability would introduce instabilities caused by the short time series of the dataset (Dinh and Aires, 2022).
2.2 Methods
2.2.1 Weather-To-Yield Impact Model
There are many regression models that could be considered for measuring the impact of weather anomalies on coffee yield. As regression models are purely data-driven, a learning database is required to empirically describe the relationships between the inputs and the desired coffee yield. Depending on the available data, models can be chosen from domains such as traditional statistics, Bayesian statistics, machine learning, or artificial intelligence. Yield modeling has been based on linear regression (Kouadio et al., 2018), random forest (Kouadio et al., 2018), neural networks (Mathieu and Aires, 2018), or mixed-effect models (Mathieu and Aires, 2016).
Ideally, the complexity of the model is adjusted to the complexity of the relationship under consideration, i.e., the effect of weather on coffee phenology. Thus, a complex regression model would be necessary to model all the processes involved in plant growth and development (described in Section 2.1.3). However, in practice, we are often limited to more simple statistical models due to the limited number of samples (Dinh and Aires, 2022).
As a result, a simple multiple linear regression method is used here to model the relationship between the observations of coffee yield anomalies a(t) and the weather input anomalies Xi. This model is formulated as:
where n is the number of input variables. The unknown coefficients αi (i = 1, 2, …, n) are the model parameters that need to be optimized based on the dataset of samples β = {(s1, s2, …, sm); m = 1, 2, …, m}, where m is the number of samples (i.e., number of years multiplied by the number of locations when several locations are mixed in β). The samples are composed of one output and the n inputs: s = (a, X1, …, Xn). This model is simple, but it has the advantage of having a limited number of parameters, and these parameters αi can be easily interpreted because they represent the sensitivity of coffee yield a to the input Xi. Figure 5 presents the datasets and methods used. In detail, the yield anomaly is induced from the yield for year t, i.e., yield at the peak of the harvest season H0. We then select n potential values from the 2-years time series before H0 for each weather variable. As mentioned in Sect. 2.1.4, this study uses n = 19; thus, the inputs Xi will be chosen from 38 potential inputs (i.e., 19 realizations for each variable P and T).
Other more sophisticated models (e.g., neural network models with different hyperparameters and number of layers) were tested, but this complexity was detrimental, as explained in more detail in the following.
2.2.2 Regularization of the Model
One major difficulty when performing a regression is that the model complexity can be too high compared to the description of the relationships in the database. When the model is too complex, it is said to be over-parameterized. This leads to over-training (or over-fitting), i.e., the model artificially fits the learning database very well, but it is unable to predict data not present in the learning database, meaning that the model is not reliable and cannot be used in practice.
In order to avoid over-training, regularization techniques need to be used. Firstly, we reduced the number of potential inputs by selecting only four important weather variables out of the 38 potential inputs, using correlation score.
Secondly, Principal Component Analysis (PCA) was applied over the four selected variables to compress this information into two inputs. By reducing the number of inputs, PCA reduces the number of parameters in the model, therefore regularizing the model structure and reducing the over-training problem. Furthermore, PCA enables the inclusion of more synthetic inputs, with more robust integrative information on robusta coffee. This pre-processing facilitates the work of the regression, so it helps to regularize the problem. We then compared the two approaches: the four selected weather variables and two PCA components to identify the more robust model that could better deal with over-training.
We assessed the Pearson’s correlation coefficient (COR) and Root Mean Square Error (RMSE =
2.2.3 Assessment of the Model Using the Leave-One-Out
Generally, the model is trained over a learning dataset, and its generalization ability is tested over a so-called generalization database. Since the overall database in this study only includes 19 years (i.e., 19 samples), splitting it into two such databases would be critical. However, with such a limited database, estimating the true generalization ability of the model and determining the optimal model parameters is a real challenge.
The leave-one-out method (Kogan et al., 2013; Zhao et al., 2018; Li et al., 2019) is used here. Given N available samples (i.e., 19 years), the model is calibrated N times, using N − 1 samples (leaving one sample out). The resulting model is tested on the sample not used in the learning. Since this is reproduced N times, we will obtain N generalization estimates for each sample. In the end, N estimated yield anomalies (aest) will be compared with the real yield observations (aobs). The same diagnostics COR (i.e., generalization score) and RMSE were considered to measure the model quality over these N samples.
2.2.4 Sensitivity to the Model Spatial Scale
Each region/district differs in terms of elevation, weather, and perhaps even agricultural practices. Thus, calibrating a localized model could be beneficial if the model can take into account these specificities. However, this is not always possible as sufficient yield data are often unavailable or the weather data is too coarse; therefore, it is of interest to evaluate the differences between scales. Also, when working at a large scale, we can compensate for all small region uncertainties, thus gain better results. Hence, working at each spatial scale has advantages and disadvantages, depending on the problems and applications. Therefore, it is necessary to study this scaling aspect and identify at which spatial scale it is more optimal to work on.
In this study, the coffee yield data are available at both provincial and district scales. Therefore, we analyzed our regression model at both scales to better understand the following questions: 1) at which scale can yields be better forecasted, 2) do we gain more when we go to higher spatial resolution. We first set up the two models at the provincial and district levels. However, to perform comparison between the models, we applied the provincial model to the district scale to compare it with the district model, and we also integrated the district model prediction at the provincial scale to compare these results to the provincial model.
3 Results
3.1 Spatial Variability of Weather Data
Large spatial variations can be observed in the weather (including P and T) over the study districts in the Central Highlands (Figure 4). Overall, Dak Lak and Dak Nong show higher temperatures and lower precipitation than Lam Dong and Gia Lai. The selected Lam Dong districts have the lowest annual mean temperature (2010–2018) and high precipitation. The weather in three study districts in Gia Lai varies greatly, especially for the annual mean temperature ranging from 22.5 to 26 °C. Districts with high coffee yield (e.g., Lam Dong districts) are located in high elevation areas, high precipitation, and low/moderate temperature.
3.2 Weather-Yield Correlation Analysis
Dak Lak provincial level case study–Figure 6 presents the correlation between the coffee yield anomalies and the weather variables (P and T variables) at the Dak Lak provincial level. (Results of other provinces (i.e., Gia Lai, Dak Nong, Lam Dong). are presented in Supplementary Figure S1). An opposite relation is observed between precipitation and temperature. During the fruit maturation period in Dak Lak from H−2 to H−1, robusta coffee trees benefit from higher temperature rather than increased water availability, as shown by the positive correlations between temperature and absolute yield anomalies, while the precipitation variables show negative correlations. Additionally, precipitation and temperature differ in their correlation signs at other phenological stages (i.e., bud development, flowering, and fruit development). The end of the rainy season of the previous year (H−13) and the peak of the rainy season of the year of harvest (H−4) show the highest correlations with yield anomaly, both are positively correlated with precipitation (0.50 and 0.55, respectively) and negatively correlated with temperature (-0.45 and -0.40, respectively).
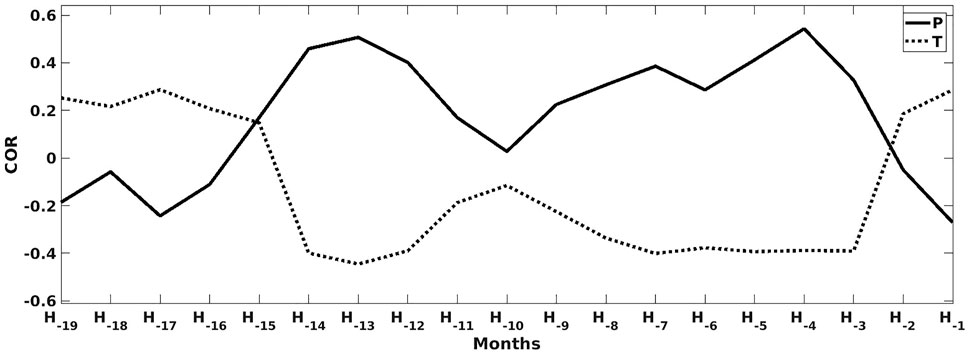
FIGURE 6. Correlation (COR) between the yield anomalies and weather variables [i.e., precipitation (P) and temperature (T)] for Dak Lak province.
Variable selection for all selected districts of the Central Highlands–Figure 7 shows the 2 months with the highest correlations between weather variables and yield anomalies, e.g., H−5 and H−13 for Ea H’leo district. In other words, the four selected weather variables (mentioned in Section 2.2.2) are the precipitation and temperature of these 2 months. In addition, these selected months vary from district to district which could be due to the climatic variation among districts. Overall, the most important month (i.e., shown in Figure 7A) ranges from the sixth to the third month before the harvest (H−6 to H−3), corresponding to the end of fruit development stage (the bean formation). In details, in the areas at higher elevations (i.e., 600–1,000 m, as shown in Figure 1A), the weather at 6 months ahead of the harvest is the most important variable, while at lower elevations (i.e., 200–600 m), the coffee yield anomalies are impacted more by the precipitation and temperature at H−3. The second most important month (i.e., shown in Figure 7B) is related to the vegetative growth and bud development stages, i.e., H−17 to H−12.
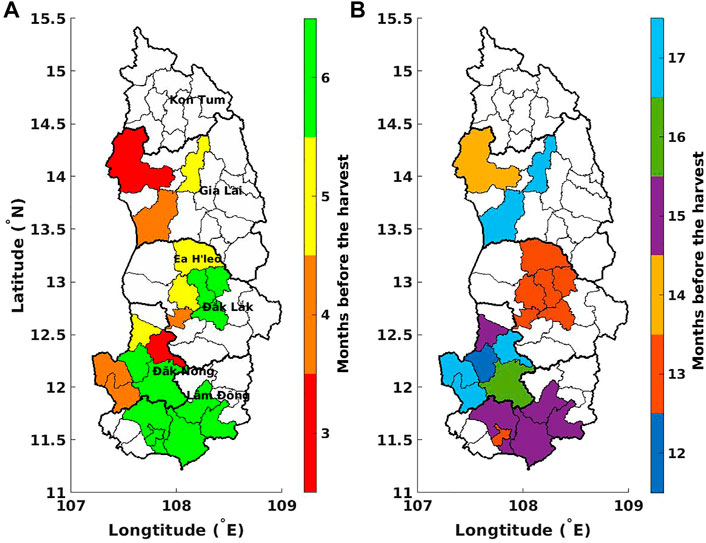
FIGURE 7. The 2 months with highest correlation between weather variables (i.e., precipitation and temperature) and coffee yield anomalies, at the district scale, in the Central Highlands of Vietnam: (A) the month with highest correlation, and (B) the month with second highest correlation.
3.3 Regression Models
Dak Lak district-level case study–Table 1 shows the learning and generalization scores, or the correlations and RMSE between observed and estimated yield anomalies over the Dak Lak districts, for the two input configurations: the four selected weather variables and the two PCA components.

TABLE 1. Correlation (COR) and RMSE (in 103 kg⋅ha−1) between observed and estimated yield anomalies over the Dak Lak districts.
The correlation for the model using four selected variables is much higher over the training dataset than over the generalization (Table 1). This indicates that over-training is occurring when using too many inputs. For instance, in Buon Ma Thuot, the correlation between aest and aobs reduces approximately by 0.4 and the RMSE by 0.07 × 10³ kg⋅ha−1. On the other hand, the learning and generalization scores are more similar and the RMSE difference is much smaller when using PCA, which means that over-training is reduced. Besides, we obtained better generalization scores when using two PCA components instead of the four selected variables. A more realistic generalization correlation/score (0.55) with a lower RMSE (0.17 × 10³ kg⋅ha−1) is obtained for robusta coffee in Buon Ma Thuot and the average correlation of 0.49 for the whole province of Dak Lak. It confirms that PCA is a good regularization technique, which will be used in the subsequent models. The generalization correlation ranges from about 0.4 to 0.6, which shows considerable differences among districts. Different environmental conditions can explain these differences, not only between but also within the provinces (Kath et al., 2020).
All selected districts in the Central Highlands–Figure 8A shows the final generalization score, i.e., the correlation between observed and estimated yield anomalies for generalization over the selected districts in the Central Highlands. The explained variance (in %), which equals the square of the correlation coefficient, is also indicated (Figure 8B).
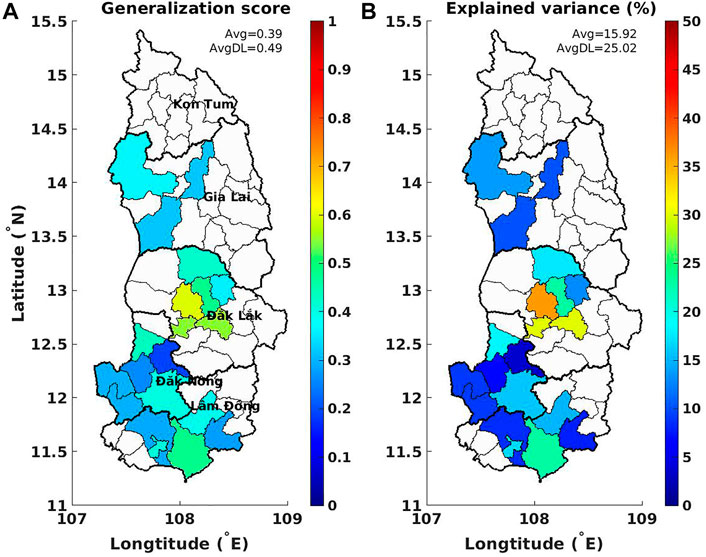
FIGURE 8. (A) Generalization correlation between observed and estimated yield anomalies; (B) the corresponding explained variance (in %) over selected districts in the Central Highlands (Vietnam). The district-average values are indicated on each panel; AvgDL is the value only over Dak Lak province.
Figure 8 shows that the model works best over the Dak Lak districts, followed by Lam Dong, while lower generalization scores are found for Kon Tum and Dak Nong districts. Weather explains up to 36% of the variation in robusta coffee yield anomalies, approximately 25% in Dak Lak province on average, and about 16% for the whole Central Highlands. These values could appear to be low, but it should be kept in mind that the objective here is not to forecast the whole coffee yield anomalies, but only their weather-sensitive part. It is possible that weather/climate explains more of the yield variability, if a larger sample were available allowing for a more complex model (i.e., additional predictors that might capture other weather sensitive phenological stages).
3.4 Yield Estimation
District level case study in Dak Lak–Figure 9 presents the observed and predicted coffee yield anomalies, as well as the corresponding coffee yield (in 103 kg⋅ha−1) time series and its uncertainties in one district of Dak Lak (i.e., Cu M’gar).
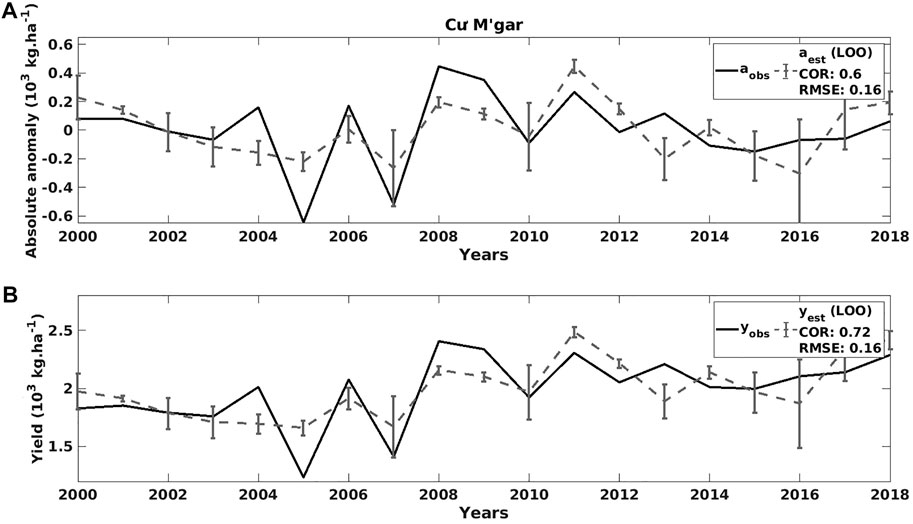
FIGURE 9. (A) The observed (solid lines) and forecast (dashed grey lines) coffee yield anomalies time series and its uncertainties in Cu M’gar (Dak Lak). (B) Same as (A) but for the coffee yield data (in 103 kg⋅ha−1).
As mentioned above, we obtain a correlation of 0.6 between the observation of yield anomalies aobs and its estimation aest in Cu M’gar. Therefore, the model explains 36% (= 0.62) of the variation in coffee yield anomalies in this district. The correlation between yobs and yest (0.72) is certainly higher than the yield anomalies correlations due to the use of the trend that is known in our case without uncertainty (Figure 9). The prediction seems to work better in the 2000–2011 period compared to the 2012–2018 period.
Assessment of model quality–Besides the yield anomalies, it is also interesting to compare the estimated coffee yield (yest) and the observed yield (yobs). The yield forecasting for year t is estimated as
In addition to assessing model quality, we compared two cases: the average state given by the long-term trend (i.e., no weather information) and our weather impact model estimation. The average state is the most straightforward guess/prediction without weather information, resulting in a typical year with no weather anomaly. We compared this simple guess to our model estimation to see how much we gain by using weather information.
Figure 10 presents the results of the yield anomalies (in 103 kg⋅ha−1) and production (in 106 kg) over the selected districts in 2011 of the three cases: 1) the true observation, 2) the average state with no weather information, and 3) our weather impact model. As indicated in panel (A2), the true observation of the total production over the selected districts is 935 × 106 kg in 2011. For this year, our weather impact model shows a similar estimation compared to the true observation (i.e., 926 × 106 kg). Although our model seems to overestimate one Dak Lak district (with an absolute difference of about 16 × 106 kg), the integrated prediction is closer to the true observation.
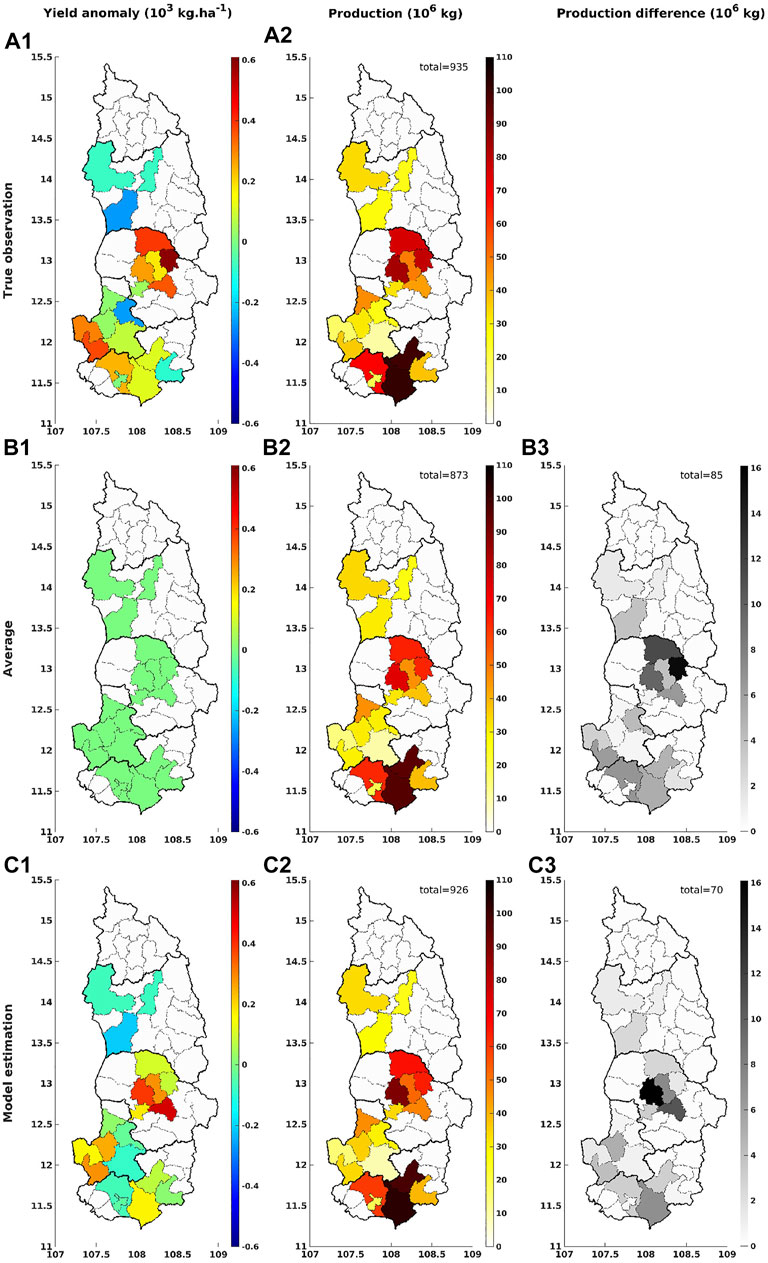
FIGURE 10. The comparison among (1) the true observation, (2) average state from the long-term trend (no weather information), and (3) our weather impact model estimation of the yield anomalies (in 103 kg⋅ha−1) and production (in 106 kg) over the 20 selected districts in the Central Highlands (Vietnam) in 2011. The absolute values (in 106 kg) of the difference between the true production and the estimated production induced from the average state are shown in (B3); and from our weather impact model in (C3). The district-total values are indicated on panels (B2), (B3), (C2), and (C3).
3.5 Sensitivity to the Model Spatial Scale
Figure 11 shows the generalization score of different models when applying to different spatial scales (i.e., province and district). Firstly, considering the comparison at the provincial scale: (A1) is the result of the provincial model, B1 is induced by integrating the district model at the provincial scale. The average generalization score obtained over the Central Highlands is a little higher in (B1) compared to (A1), i.e., 0.51 and 0.44, respectively. These scores indicate that the integration of the district model is more interesting than the provincial model.
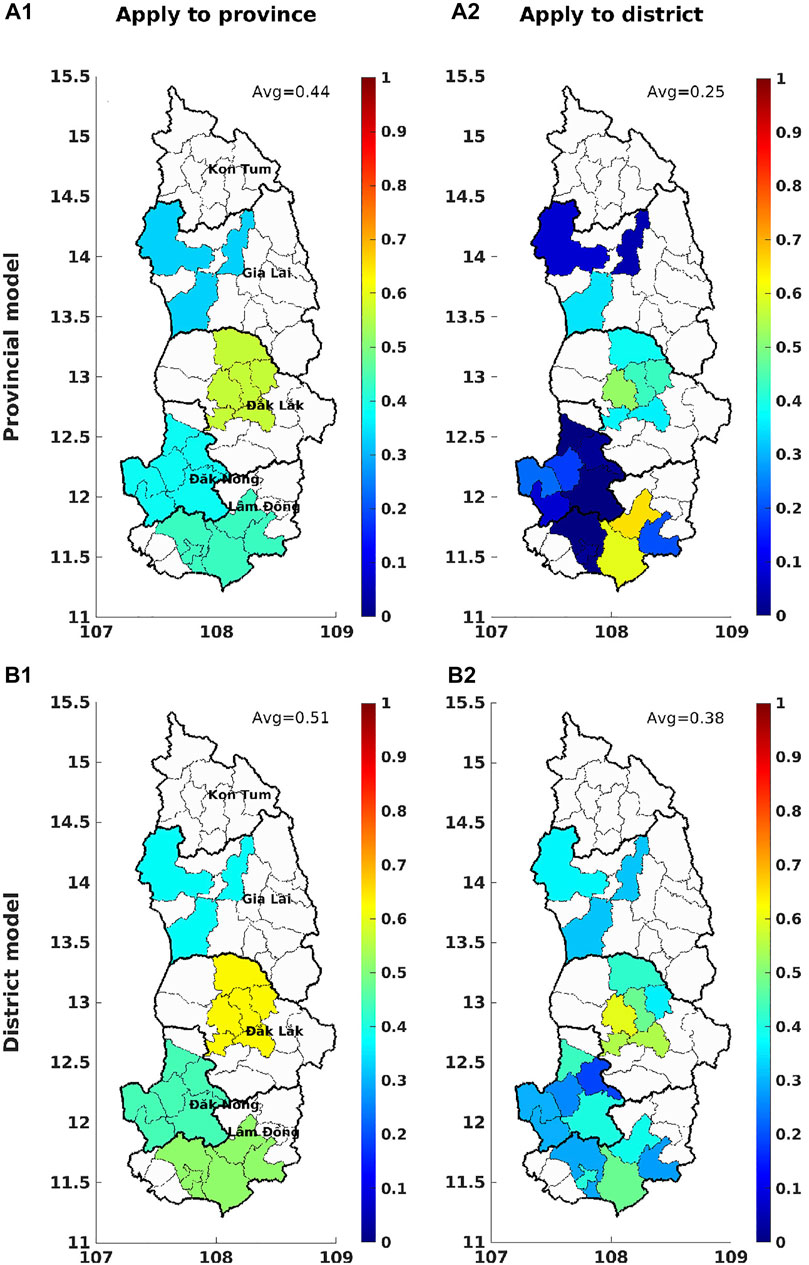
FIGURE 11. Generalization score of different models when applying over different spatial scales (i.e., province and district). The district-average values are indicated on each panel.
Similarly, we consider the two cases at the district scale: applying the provincial model to the district scale (A2), using the district model (B2). Although some Lam Dong districts show high generalization scores (0.6 or 0.7), the average score over the whole study area is very low (0.25) in (A2), i.e., the lowest one among four tested cases. Meanwhile, when using the district model, the overall score is much higher (0.39). In short, as expected, for robusta coffee in the Central Highlands, it is more advantageous to use the model calibrated at the district scale as it is able to take advantage of the local specificities, even if more ambitious task.
4 Discussion
Our study explored how the relationship between phenological processes of the coffee plant (i.e., bud formation and growth, flowering, fruit development, and maturation) and weather affects yield at district and provincial scale in Vietnam. Each phenological stage requires specific weather characteristics for optimal yield. Finally, due to the perennial nature of the coffee plant, climatic effects in the previous year can affect the preceding year’s yield. This understanding is essential in the study of weather patterns that affect coffee yield.
Due to the limited availability of coffee yield data, a simple regression model was used to relate weather with robusta coffee yield over the Vietnamese coffee area. The analysis indicates that precipitation and temperature during 1) vegetative growth of the previous year and 2) bean formation are most influential in determining coffee yield anomalies. The exact timing of these variables varies among coffee districts due to the difference in elevation, climate, and/or agricultural practices. Overall, the model can forecast the coffee yield anomalies from three to 6 months before the harvest, 6 months for the districts located at a higher elevation with cooler temperature and therefore slower development rates. However, the accuracy of such a yield forecast and its value for decision-making would need to be tested in more detail and depend on seasonal climate forecasts for the different districts of interest.
Identifying an appropriate statistical model for a relatively complex crop like coffee is not easy, particularly as there are limited observations (only about 20 years of coffee yield). This explains why using regularization strategies such as favoring simple models (e.g., linear regression) over complex ones and applying good quality assessment diagnostics (e.g., PCA, leave-one-out) are required. In particular, we used the leave-one-out method to avoid potential over-training when a limited number of samples is available.
Our findings indicated that, with about 20 years of data, weather could explain up to 36% (from 16 to 25% on average) of the variation in robusta coffee yield anomalies in the Central Highlands. This value is significant as it means that weather can affect up to one quarter of the farmer revenue. Some Lam Dong districts can show higher weather sensitivity. Other coffee districts in Gia Lai or Dak Nong are not so sensitive to weather, which could partially be due to the adequacy of these regions to the coffee production and/or higher stability of the weather in these regions.
Our results for robusta coffee in Dak Lak agree with Kath et al. (2020), who showed that rainfall has a positive effect, while temperature has a negative effect during the growing season (Mar-Sept). One advantage of our approach is that we can point out the month with the highest correlation, while (Kath et al., 2020) only looked at two seasons (flowering and fruit growth). As phenology dynamically responds to prevailing weather conditions, the key moments that affect yield vary in time and space. For instance, Figure 6 shows a positive correlation score from H−9 to H−3 (i.e., the growing season), with the highest score at H−5 for robusta coffee in Dak Lak. However, the different districts have different key moments where weather most affects yield. In our example of Dak Lak, we found a low correlation score of precipitation at H−11/H−10 (i.e., the beginning of the flowering season) (Figure 6), while Kath et al. (2020) concluded that rainfall has a negative effect on robusta coffee yields during the flowering season (Jan-Mar). It is unclear whether this difference is due to the different spatial scales of used weather data or due to the underlying yield data set.
It also showed that Vietnamese coffee farmers have improved their agricultural practices considerably in the last 10 years, leading to coffee yield becoming less weather sensitive. In addition, by applying our model at different spatial scales, while each scale has its advantages and disadvantages, our model for robusta coffee in the Central Highlands shows more interesting results over the district level.
This study highlights the importance of selecting spatially dynamic weather variables for optimal modelling. This needs to be atomized to apply this model approach at larger scale. Therefore, a practical automatic selection procedure needs to be developed. Secondly, given the relatively high weather sensitivity already detectable with simple linear regression using a small yield database, there is a need to consolidate high quality yield data from all coffee growing regions to enable the development of more complex data driven approaches and elucidate key weather sensitive coffee phenological stages and related yield forecasting skill. We expect to obtain better forecasting scores in regions where coffee is rainfed and thus is more sensitive to the weather.
This work can be extended following different approaches. Firstly, other input variables could be analyzed. For example, other agro-climatic indicators, characterizing plant-climate interactions for global agriculture, are available from 1951 to 2099 at the ECMWF (Hersbach et al., 2018). Some variables could be relevant for coffee, such as (very) heavy precipitation days, the maximum number of consecutive dry days, frost days, etc.). The addition of input variables should not come at the cost of over-training; however, these variables could be interesting for further studies, for instance, when applying over other regions where more yield data are available. Secondly, we could study cluster analysis, which helps identify coffee groups with the same environmental characteristics. We can then define the regions suitable for coffee production and analyze their long-term evolution due to climate change. If more data becomes available, we can also test more sophisticated models (e.g., mixed-effects models) that stay simple, combine data from multiple locations but still keep some specificities for each coffee region.
Here, we only studied the current climate situation (i.e., in the last 20 years). As shown in other studies, (Davis et al., 2012; Bunn et al., 2015a; Bunn et al., 2015b), it is also of interest to look at the future climate, for instance, the 2040–2069 time-slide. Along with the development of the model, in future studies, our model can be applied to the common climate simulations (from several greenhouse gas emission scenarios, i.e., CMIP6), thus we can analyze the impact of climate change on coffee yield (assuming that management practices stay the same). In the climate change scenarios, some locations might become more weather-sensitive or have more extreme events; in such areas, we would expect a significant change in the yield prediction. Therefore, these potential analyzes could improve our understanding of the optimal current and future management practices (Läderach et al., 2017; Challinor et al., 2018). Strategies for the adaptation and mitigation of climate change on coffee production could potentially be refined.
Data Availability Statement
Publicly available datasets were analyzed in this study. This data can be found here: The coffee datasets analyzed for this study can be obtained from Vietnam’s General Statistics Office (GSO) for the 2000-2018 period. These data are available from GSO on reasonable request. For any inquiries, please send an email to YmFuYmllbnRhcEBnc28uZ292LnZu. The weather datasets, i.e., ERA5-Land data, can be downloaded from https://cds.climate.copernicus.eu (Muñoz Sabater, 2019) (last access: 22 Apr 2021).
Author Contributions
All authors conceptualized the research. TD: methodology, visualization, interpretation of the results, writing original draft, and writing review and editing. FA: methodology, interpretation of the results, writing original draft, writing review and editing, and supervision. ER: interpretation of the results, writing review and editing.
Funding
This work benefits from the French state aid managed by the ANR under the “Investissements d’avenir” program with the reference ANR-16-CONV-0003, and the Australian Centre for International Agricultural Research and conducted as part of activities for the project “Enhancing smallholder livelihoods in the Central Highlands of Vietnam through improving the sustainability of coffee and black pepper farming systems and value chains” (AGB/2018/175).
Conflict of Interest
The authors declare that the research was conducted in the absence of any commercial or financial relationships that could be construed as a potential conflict of interest.
Publisher’s Note
All claims expressed in this article are solely those of the authors and do not necessarily represent those of their affiliated organizations, or those of the publisher, the editors and the reviewers. Any product that may be evaluated in this article, or claim that may be made by its manufacturer, is not guaranteed or endorsed by the publisher.
Acknowledgments
We would like to thank the General Statistics Office of Vietnam (GSO), especially Nguyen Thi Hong Hai, for providing the valuable datasets of Vietnamese coffee (which were essential to accomplish this study). Thanks to Patricia de Rosnay and Peter Weston for the discussion about the ECMWF data.
Supplementary Material
The Supplementary Material for this article can be found online at: https://www.frontiersin.org/articles/10.3389/fenvs.2022.820916/full#supplementary-material
References
Arcila-Pulgarín, J., Buhr, L., Bleiholder, H., Hack, H., Meier, U., and Wicke, H. (2002). Application of the Extended BBCH Scale for the Description of the Growth Stages of Coffee (Coffea spp.). Ann. Appl. Biol. 141, 19–27. doi:10.1111/j.1744-7348.2002.tb00191.x
Bunn, C., Läderach, P., Ovalle Rivera, O., and Kirschke, D. (2015b). A Bitter Cup: Climate Change Profile of Global Production of Arabica and Robusta Coffee. Clim. Change 129, 89–101. doi:10.1007/s10584-014-1306-x
Bunn, C., Läderach, P., Pérez Jimenez, J. G., Montagnon, C., and Schilling, T. (2015a). Multiclass Classification of Agro-Ecological Zones for Arabica Coffee: An Improved Understanding of the Impacts of Climate Change. PLoS ONE 10, e0140490. doi:10.1371/journal.pone.0140490
Challinor, A. J., Müller, C., Asseng, S., Deva, C., Nicklin, K. J., Wallach, D., et al. (2018). Improving the Use of Crop Models for Risk Assessment and Climate Change Adaptation. Agric. Syst. 159, 296–306. doi:10.1016/j.agsy.2017.07.010
Craparo, A. C. W., Van Asten, P. J. A., Läderach, P., Jassogne, L. T. P., and Grab, S. W. (2015). Coffea Arabica Yields Decline in tanzania Due to Climate Change: Global Implications. Agric. For. Meteorology 207, 1–10. doi:10.1016/j.agrformet.2015.03.005
Davis, A. P., Gole, T. W., Baena, S., and Moat, J. (2012). The Impact of Climate Change on Indigenous Arabica Coffee (Coffea Arabica): Predicting Future Trends and Identifying Priorities. PLoS ONE 7, e47981–14. doi:10.1371/journal.pone.0047981
Davis, A. P., Mieulet, D., Moat, J., Sarmu, D., and Haggar, J. (2021). Arabica-like Flavour in a Heat-Tolerant Wild Coffee Species. Nat. Plants 7, 413–418. doi:10.1038/s41477-021-00891-4
Descroix, F., and Snoeck, J. (2004). “Environmental Factors Suitable for Coffee Cultivation,” in Coffee: Growing, Processing, Sustainable Production: A Guidebook for Growers, Processors, Traders, and Researchers (Hoboken, NJ, USA: John Wiley & Sons), 164–177. chap. 6. doi:10.1002/9783527619627.ch6
Dinh, T. L. A., and Aires, F. (2022). Nested Leave-Two-Out Cross-Validation for the Optimal Crop Yield Model Selection. Geosci. Model. Dev. 15, 3519–3535. doi:10.5194/gmd-15-3519-2022
Gomes, L. C., Bianchi, F. J. J. A., Cardoso, I. M., Fernandes, R. B. A., Filho, E. I. F., and Schulte, R. P. O. (2020). Agroforestry Systems Can Mitigate the Impacts of Climate Change on Coffee Production: A Spatially Explicit Assessment in Brazil. Agric. Ecosyst. Environ. 294, 106858. doi:10.1016/j.agee.2020.106858
Hersbach, H., de Rosnay, P., Bell, B., Schepers, D., Simmons, A., Soci, C., et al. (2018). Operational Global Reanalysis: Progress, Future Directions and Synergies with Nwp. ERA Rep. Ser. doi:10.21957/tkic6g3wm
Hijmans, R. J., Cameron, S. E., Parra, J. L., Jones, P. G., and Jarvis, A. (2005). Very High Resolution Interpolated Climate Surfaces for Global Land Areas. Int. J. Climatol. 25, 1965–1978. doi:10.1002/joc.1276
Imbach, P., Fung, E., Hannah, L., Navarro-Racines, C. E., Roubik, D. W., Ricketts, T. H., et al. (2017). Coupling of Pollination Services and Coffee Suitability under Climate Change. Proc. Natl. Acad. Sci. U.S.A. 114, 10438–10442. doi:10.1073/pnas.1617940114
Kath, J., Byrareddy, V. M., Craparo, A., Nguyen‐Huy, T., Mushtaq, S., Cao, L., et al. (2020). Not so Robust: Robusta Coffee Production Is Highly Sensitive to Temperature. Glob. Change Biol. 26, 3677–3688. doi:10.1111/gcb.15097
Kath, J., Mittahalli Byrareddy, V., Mushtaq, S., Craparo, A., and Porcel, M. (2021). Temperature and Rainfall Impacts on Robusta Coffee Bean Characteristics. Clim. Risk Manag. 32, 100281. doi:10.1016/j.crm.2021.100281
Kogan, F., Kussul, N., Adamenko, T., Skakun, S., Kravchenko, O., Kryvobok, O., et al. (2013). Winter Wheat Yield Forecasting in Ukraine Based on Earth Observation, Meteorological Data and Biophysical Models. Int. J. Appl. Earth Observation Geoinformation 23, 192–203. doi:10.1016/j.jag.2013.01.002
Kouadio, L., Deo, R. C., Byrareddy, V., Adamowski, J. F., Mushtaq, S., and Phuong Nguyen, V. (2018). Artificial Intelligence Approach for the Prediction of Robusta Coffee Yield Using Soil Fertility Properties. Comput. Electron. Agric. 155, 324–338. doi:10.1016/j.compag.2018.10.014
Läderach, P., Ramirez–Villegas, J., Navarro-Racines, C., Zelaya, C., Martinez–Valle, A., and Jarvis, A. (2017). Climate Change Adaptation of Coffee Production in Space and Time. Clim. Change 141, 47–62. doi:10.1007/s10584-016-1788-9
Li, Y., Guan, K., Yu, A., Peng, B., Zhao, L., Li, B., et al. (2019). Toward Building a Transparent Statistical Model for Improving Crop Yield Prediction: Modeling Rainfed Corn in the u.S. Field Crops Res. 234, 55–65. doi:10.1016/j.fcr.2019.02.005
Majerowicz, N., and Söndahl, M. R. (2005). Induction and Differentiation of Reproductive Buds in Coffea Arabica L. Braz. J. Plant Physiol. 17, 247–254. doi:10.1590/s1677-04202005000200008
Mathieu, J. A., and Aires, F. (2016). Statistical Weather-Impact Models: An Application of Neural Networks and Mixed Effects for Corn Production over the United States. J. Appl. Meteorology Climatol. 55, 2509–2527. doi:10.1175/JAMC-D-16-0055.1
Mathieu, J. A., and Aires, F. (2018). Using Neural Network Classifier Approach for Statistically Forecasting Extreme Corn Yield Losses in Eastern United States. Earth Space Sci. 5, 622–639. doi:10.1029/2017EA000343
Miao, R., Khanna, M., and Huang, H. (2016). Responsiveness of Crop Yield and Acreage to Prices and Climate. Am. J. Agric. Econ. 98, 191–211. doi:10.1093/ajae/aav025
Moat, J., Williams, J., Baena, S., Wilkinson, T., Gole, T. W., Challa, Z. K., et al. (2017). Resilience Potential of the Ethiopian Coffee Sector under Climate Change. Nat. Plants 3, 17081. doi:10.1038/nplants.2017.81
[Dataset] Muñoz Sabater, J. (2019). Era5-land Monthly Averaged Data from 1981 to Present. doi:10.24381/cds.68d2bb3 (Accessed Apr 22, 2021).
O’Donnell, M. S., and Ignizio, D. A. (2012). Bioclimatic Predictors for Supporting Ecological Applications in the Conterminous United States. U. S. Geol. Surv. Data Ser. 691, 10.
Oliveira Aparecido, L. E., Souza Rolim, G., Camargo Lamparelli, R. A., Souza, P. S., and Santos, E. R. (2017). Agrometeorological Models for Forecasting Coffee Yield. Agron. J. 109, 249–258. doi:10.2134/agronj2016.03.0166
Rahn, E., Vaast, P., Läderach, P., van Asten, P., Jassogne, L., and Ghazoul, J. (2018). Exploring Adaptation Strategies of Coffee Production to Climate Change Using a Process-Based Model. Ecol. Model. 371, 76–89. doi:10.1016/j.ecolmodel.2018.01.009
Rodríguez, D., Cure, J. R., Cotes, J. M., Gutierrez, A. P., and Cantor, F. (2011). A Coffee Agroecosystem Model: I. Growth and Development of the Coffee Plant. Ecol. Model. 222, 3626–3639. doi:10.1016/j.ecolmodel.2011.08.003
[Dataset] United States Department of Agriculture - Foreign Agricultural Service (2019). Coffee: World Markets and Trade. Washington, D.C., USA: United States Department of Agriculture (Accessed Apr 22, 2020).
Valeriano, T. T. B., Souza Rolim, G., Oliveira Aparecido, L. E., and Moraes, J. R. d. S. C. (2018). Estimation of Coffee Yield from Gridded Weather Data. Agron. J. 110, 2462–2477. doi:10.2134/agronj2017.11.0649
Vezy, R., le Maire, G., Christina, M., Georgiou, S., Imbach, P., Hidalgo, H. G., et al. (2020). DynACof: A Process-Based Model to Study Growth, Yield and Ecosystem Services of Coffee Agroforestry Systems. Environ. Model. Softw. 124, 104609. doi:10.1016/j.envsoft.2019.104609
Wintgens, J. N. (2004). “The Coffee Plant,” in Coffee: Growing, Processing, Sustainable Production: A Guidebook for Growers, Processors, Traders, and Researchers (Hoboken, NJ, USA: John Wiley & Sons), 1–24. chap. 1. doi:10.1002/9783527619627.ch1
Zhang, T., and Huang, Y. (2012). Impacts of Climate Change and Inter-annual Variability on Cereal Crops in china from 1980 to 2008. J. Sci. Food Agric. 92, 1643–1652. doi:10.1002/jsfa.5523
Keywords: robusta coffee, weather sensitivity, statistical analysis, regularization, yield model
Citation: Dinh TLA, Aires F and Rahn E (2022) Statistical Analysis of the Weather Impact on Robusta Coffee Yield in Vietnam. Front. Environ. Sci. 10:820916. doi: 10.3389/fenvs.2022.820916
Received: 23 November 2021; Accepted: 30 May 2022;
Published: 20 June 2022.
Edited by:
Erwan Personne, AgroParisTech Institut des Sciences et Industries du Vivant et de L’environnement, FranceReviewed by:
Luis Morales-Salinas, University of Chile, ChileThanh Ngo-Duc, University of Science and Technology of Hanoi, Vietnam
Copyright © 2022 Dinh, Aires and Rahn. This is an open-access article distributed under the terms of the Creative Commons Attribution License (CC BY). The use, distribution or reproduction in other forums is permitted, provided the original author(s) and the copyright owner(s) are credited and that the original publication in this journal is cited, in accordance with accepted academic practice. No use, distribution or reproduction is permitted which does not comply with these terms.
*Correspondence: Thi Lan Anh Dinh, bGFuLWFuaC5kaW5oQG9ic3BtLmZy
 Thi Lan Anh Dinh
 Filipe Aires
 Eric Rahn