 Marie-Sophie Maier1,2*
 Anna R. Canning3
 Matthias S. Brennwald4
 Cristian R. Teodoru1,5
 Bernhard Wehrli1,2
- 1Institute of Biogeochemistry and Pollutant Dynamics, Department of Environmental Systems Science, ETH Zurich, Zurich, Switzerland
- 2Department Surface Waters–Research and Management, Eawag, Swiss Federal Institute of Aquatic Science and Technology, Kastanienbaum, Switzerland
- 3GEOMAR Helmholtz-Zentrum für Ozeanforschung Kiel, Kiel, Germany
- 4Department of Water Resources and Drinking Water, Eawag, Swiss Federal Institute of Aquatic Science and Technology, Dübendorf, Switzerland
- 5Romanian National Institute of Marine Geology and Geoecology (GeoEcoMar), Bucharest, Romania
Global estimates see river deltas and estuaries contributing about equally to CO2 and CH4 emissions as lakes and reservoirs, despite a factor 6 smaller surface area. Assessing the horizontal gradients in dissolved gas concentrations from large river reaches to connecting canals and wetland lakes remains a challenge in many deltaic systems. To elucidate the processes affecting local CO2 and CH4 concentrations in the Romanian part of the Danube Delta, we mapped dissolved O2, N2, He and Ar using a portable gas-equilibration membrane-inlet mass spectrometer (GE-MIMS), along with CO2, CH4, water temperature and conductivity. We measured the concentrations along the aquatic continuum from a small houseboat during two campaigns, in spring and autumn, to capture different hydrological and plant growth conditions. Delta-scale concentration patterns were comparably stable across seasons. Small connecting channels were highly influenced by the riparian wetland, which was strongest in the eastern part of the biosphere reserve. These sites represented the delta’s CO2 and CH4 hotspots and showed clear signs of excess air, i.e., supersaturation of dissolved noble gases with respect to air-saturated water. As the adjacent wetland was permanently inundated, this signal was likely caused by root aeration of Phragmites australis, as opposed to traditional excess air formation via water table fluctuations in the unsaturated zone. The special vegetation setting with reed growing on floating peat coincided with the highest CO2 and CH4 concentrations (>700 μmol/L CO2 and 13 μmol/L CH4, respectively) observed in an adjacent channel. Shallow lakes, on the other hand, were major sites of photosynthetic production with O2 oversaturation reaching up to 150% in spring. The observed deficit in non-reactive gases (He, Ar and N2) indicated that the lakes were affected by O2 ebullition from macrophytes. According to our estimations, this ebullitive flux decreased O2 concentrations by up to 2 mg/L. This study highlights the effect of plant-mediated gas transfer on dissolved gas concentrations and supports recent studies stressing the need to account for ebullitive gas exchange when assessing metabolism parameters from O2 in shallow, productive settings.
1 Introduction
The release of greenhouse gases from deltaic and estuarine systems cannot be neglected, but the spatial variability of these emissions is poorly understood (Cai, 2011). For CH4, the most recent global emission estimate from deltas and estuaries is 4.95 TgC year−1 (Borges and Abril, 2011), which equals 25% of the efflux from rivers and streams (0.02 PgC year−1, Stanley et al., 2016). It represents only 3.5–6.3% of the CH4 flux from lakes and reservoirs (0.139–0.078 PgC year−1, depending on lake size distribution, DelSontro et al., 2018). Global CO2 emission estimates from deltas and estuaries of 0.27 ± 0.23 PgC year−1 (Laruelle et al., 2010) are only one order of magnitude smaller than the oceanic and terrestrial CO2 sink (2.5 and 3.4 PgC year−1, Friedlingstein et al., 2020). These estimates are smaller than estimated global CO2 emissions from rivers (0.48–0.85 PgC year−1, Lauerwald et al., 2015) but in a similar range as emissions from lakes and reservoirs (0.32–0.58 PgC year−1, Raymond et al., 2013; Holgerson and Raymond, 2016). These estimates indicate a very active role of river deltas and estuaries because they exhibit 6 times smaller surface areas when compared to lakes and reservoirs (Laruelle et al., 2010; Holgerson and Raymond, 2016).
The increase of global surface temperatures, its adverse effects for humans and the biosphere (IPCC, 2021), and the potential failure of the Paris agreement (Sachs, 2019) all demand a solid understanding of carbon budgets. In this context, Deemer et al. (2016) identified the lack of adequate spatial coverage as a stumbling block for calculating global greenhouse gas emissions from reservoirs. In contrast to the open ocean or large lakes and rivers, many freshwater systems such as small streams or small lakes can show quite strong horizontal concentration gradients (McGinnis et al., 2016; Natchimuthu et al., 2016). In addition, differences in gas exchange parameters depend on channel slope and morphometry and can change over a small distance (Ulseth et al., 2019; Hall and Ulseth, 2020). The drivers of steep concentration changes can be manifold, ranging from groundwater inflow (Horgby et al., 2019) to changes in depth (Natchimuthu et al., 2016) and hydrodynamics (McGinnis et al., 2016) or organic matter availability (Battin et al., 2008). An additional factor that has so far gained little attention is plant-mediated gas transfer. Recent observations point to oxygen ebullition via photosynthesis (Koschorreck et al., 2017) and other studies suggested specific gas-transfer mechanisms for reed stands, which deserve detailed analysis under field conditions (Brix et al., 1996; Sorrell and Brix, 2013).
River deltas are complex sites, where many of these drivers may govern steep spatial gradients of dissolved (greenhouse) gases across different waterscapes and may introduce large uncertainty to any upscaling approach (Abril and Borges, 2019; Maier et al., 2021). Along with the identification of emission hotspots in single systems, it is therefore vital to understand the processes affecting the spatiotemporal variability of greenhouse gas concentrations in order to improve extrapolation to unsampled territory.
The Danube Delta, Romania, shows very large concentration gradients of dissolved CO2 and CH4 with hotspots in some small channels (Maier et al., 2021). Based on these discrete measurements, steep spatial gradients remain unresolved and potential emission hotspots may be undetected. High-resolution portable sensors measuring dissolved gases such as CO2 and CH4 specifically provide a more detailed spatial picture (Canning A. R et al., 2021). Earlier studies showed horizontal gradients in CO2 and CH4 concentrations across Danube Delta lakes (Pavel et al., 2009), as well as daily cycles in CH4 concentrations (Canning A et al., 2021).
While spatial mapping of only CO2 and CH4 gives direct indication on the location of potential emission hot spots, measurements of additional gas species can shed further light on the processes that cause or affect these greenhouse gas patterns. Portable membrane-inlet mass spectrometers (MIMS) allow measurements of several dissolved gases in the field (Brennwald et al., 2016) and thus allow to complement greenhouse gas measurements with measurements of noble gases, O2 and N2. As noble gases are not affected by biological processes, this allows to get a more detailed view on the physical and biological drivers of the dissolved gas variability. Ar, which has similar solubility characteristics as O2, is used in oceanography to account for O2 changes due to physical processes such as waves or degassing (Craig and Hayward, 1987). Recent studies suggest that physical processes like ebullition also play a role in O2 dynamics in shallow lakes (Koschorreck et al., 2017).
This study builds on a 2-year field campaign at discrete sites in the Danube Delta, which quantified carbon fluxes to the atmosphere (Maier et al., 2021). Here we adopt a same high-resolution mapping approach that allowed Canning A et al. (2021) to identify spatial patterns of methane emissions in the Delta. In order to identify physically and biologically driven gas-transfer mechanisms in more detail, we continuously mapped the spatial distribution of a broad set of dissolved gases (CO2, CH4, O2, N2, He and Ar) in the Danube Delta. We aimed at 1) identifying spatial patterns and horizontal gradients across the different deltaic waterscapes during two seasons, 2) applying noble gas measurements for constraining physical and biological processes in emission hotspots of greenhouse gases at terrestrial-aquatic boundaries, and 3) quantifying ebullition as a confounding factor in estimates of ecosystem metabolism.
2 Materials and Methods
2.1 Study Site
Flowing over 2,850 km and receiving water from 19 different European countries, the Danube River discharges into the Black Sea through a three-arm delta, the Danube Delta. It is Europe’s second largest river delta after the Volga wetlands on the Caspian Sea and located at the border of Ukraine to eastern Romania. Runoff from the Carpathian Mountains and the Alps determines the seasonality of the river’s hydrology, where peak discharge in spring is followed by low discharge in autumn (Supplementary Figure S1). These changes in hydrology directly translate into changes in water level in the delta, leading to flooding of the wetland area in spring and subsequent drainage in autumn. Between the main river branches, the delta consists of vast reed areas and shallow flow-through lakes, which are connected to the main branches via small natural and artificial channels (Figure 1). The river water generally enters the delta at the West and flows back into the river in the East close to the Black Sea. However, depending on the water level fluctuations, direction of flow is also known to reverse in some of the eastern channels (Irimus, 2006). With respect to the 20-years average, the Danube River showed below average discharge throughout most of the monitoring year 2017 (Supplementary Figure S1; ICPDR (2019)).
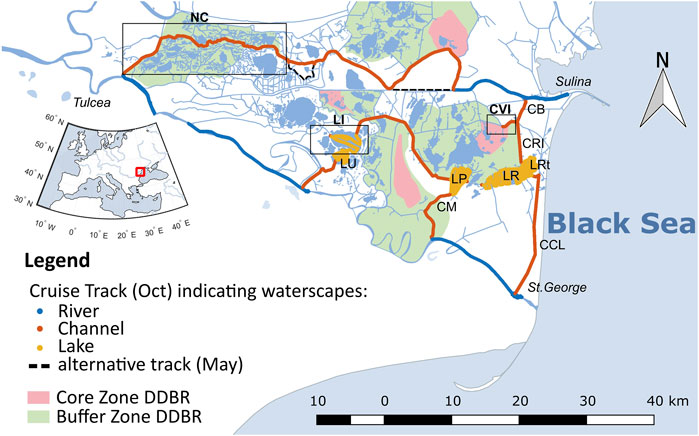
FIGURE 1. Southern part of the Danube Delta with cruise tracks of the sampling campaign in October 2017. Colors indicate the different waterscapes (blue = river, orange = channel, yellow = lake). The black dotted line indicates where the sampling track in May 2017 differed from October 2017. Red and green areas show the location of core and buffer zones of the Danube Delta Biosphere Reserve (Gastescu, 2013). Boxes indicate specifically discussed sites: NC, northern channels, LI, Lake Isac, CVI, Canal Vatafu-Imputita. Other abbreviations stand for LU, Lake Uzlina (Lake Isaccel), LP, Lake Puiu, LR, Lake Rosu, LRt, Lake Rosulet, CM, Canal Mocanului (Canal Mocansca), CB, Canal Busurca, CRI, Canal Rosu-Imputita, CCL, Canal Cordon Litoral (Canal Tataru). Names refer to (Gastescu, 2013), italic names indicate deviating names on maps.google.ch. For mapping details see Methods section.
The Danube Delta is a Ramsar Wetland Site and a World heritage site (UNEP-WCMC (UN Environment Programme World Conservation Monitoring Centre), 2021). Since 1998, it is part of the transboundary UNESCO Biosphere Reserve (UNESCO, 2021). The Danube Delta Biosphere Reserve (DDBR, Figure 1) aims to protect the deltas’ diversity of flora and fauna. To this end, about 9% of the deltas’ area classifies as strictly protected core zone with another 48% representing buffer zones surrounding the core areas (UNESCO, 2021), where tourism and reed harvesting are restricted.
About 23% of the 220,000 ha reed area represent potential harvesting areas (Covaliov et al., 2010). The reed, predominantly consisting of Phragmites australis (Hanganu et al., 2002), is either used as cattle food by locals or professionally harvested by private companies during winter. Burning of the remaining crop parts increases future yield and prevents succession by other plants (Covaliov et al., 2010). Reed grows on reed peat, consisting of a network of viable rhizomes. Initially, this reed peat forms an about 1 m thick floating layer with no contact to the underlaying mineral soil. In Romanian, this is called “plaur”. Bottom contact establishes as the peat grows thicker or during low water levels (Hanganu et al., 2002). Both harvesting and burning increases the buoyancy of the plaur and the reed density (Covaliov et al., 2010), yet reduce the abundance of old and broken reed culms, which play an important role in oxygenating the rhizome (Sorrell and Brix, 2013).
As road infrastructure through the delta is lacking, ships and boats are the most important means of transport there. This boat traffic likely enhances gas exchange in some of the small, highly frequented channels, as well as in the main branches.
2.2 Measured Gas Species
For this study, we complemented CO2 and CH4 measurements with measurements of dissolved noble gases (He and Ar), O2 and N2. Noble gases such as He and Ar help to understand the physical changes affecting all dissolved gas concentrations. As most poorly soluble gas in the water (Figure 2), He is affected most strongly by gas bubbles rising through the water column. On their way through to the surface, less soluble gases from the surrounding water replace more soluble gases initially present in the bubble (McGinnis et al., 2006), which is called stripping. We expected to see such a stripping effect for He during ebullition, i.e., enhanced gas transfer to the atmosphere via bubbles.
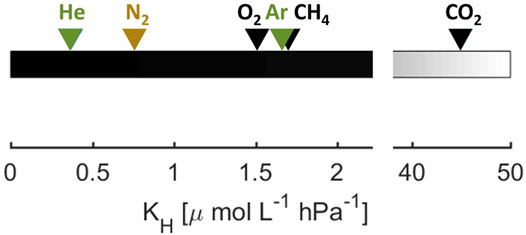
FIGURE 2. Calculated Henry constants of selected gases for T = 15°C and standard pressure. Noble gases are shown in green, biogenic gases and greenhouse gases are shown in black. N2 is considered as not significantly altered by metabolism in this study and therefore shown in ocher.
The solubility properties of Ar are very similar to those of O2 and comparable to N2 (about 2:1). It is therefore often used to account for physical changes affecting these gases or to improve measurement accuracy by employing O2:Ar or N2:Ar ratios (Craig and Hayward, 1987; Groffman et al., 2006). O2:Ar ratios are frequently used in the ocean for quantifying net community production (Craig and Hayward, 1987; Tortell et al., 2015) but also in ice cores (Zhou et al., 2014).
In combination, noble gases can indicate the presence of excess air, i.e., an observed surplus of dissolved gas in excess to atmospheric equilibrium concentrations with air-like gas composition (Heaton and Vogel, 1981). This phenomenon is traditionally observed in unconfined groundwater bodies, where air entrapment during a rising groundwater table leads to an increase in hydraulic pressure, allowing the water to take up more gas and thus partially or fully dissolving the trapped gas bubble (Aeschbach-Hertig et al., 1999). This presence of excess air can raise the O2 and N2 saturation beyond expectation in river banks and groundwater (Mächler et al., 2013).
The concentration of O2 represents an indicator for the ecosystem metabolism, i.e., autotrophic versus net heterotrophic conditions. In-situ O2 concentrations are often used as a measure for net primary productivity, i.e., primary production–respiration. Different methods include the measurement of diel O2 changes in streams and lakes (Staehr et al., 2012; Hall et al., 2016; Bernhardt et al., 2018).
Since our measurement system was not sensitive enough to resolve small biogenic changes in N2 from the comparably large N2 background concentration of air-saturated water, we used molecular nitrogen as a third conservative gas species in this study.
2.3 Sampling
We continuously measured the concentrations of dissolved gases (CO2, CH4, He, Ar, O2, N2) in the southern part of the Danube Delta during two field campaigns in May and October 2017. The journey of our sensor-equipped houseboat covered the different waterscapes of the delta, i.e., main river branches, small channels and large flow-through lakes (Figure 1). The size of our houseboat prevented accessibility of shallower lakes or narrower channels (Supplemenatry Figure S2). Due to time constraints, the paths in May and October deviate slightly in the northern part of the mapping area.
For the analysis of dissolved He, Ar, O2 and N2, we used a membrane-inlet mass spectrometer (MIMS) from Gasometrix (Brennwald et al., 2016) in combination with a submergible pump and a membrane-equilibrator. The total number of datapoints per gas species amounted to ∼8,600 in May and ∼8,900 in October. We filled gasbags with a known composition of pressurized air enriched with CO2 and CH4 and used those as standard gas mixture during the field trip. This standard gas and ambient air were measured in regular intervals (every fifth and 10th sample batch, respectively, with 1 sample batch representing five individual measurements) to ensure data accuracy. The partial pressures and concentrations of the gases dissolved in water were quantified from the raw MIMS data following the procedures described in Brennwald et al. (2016). Given the large concentration gradients in the delta, we performed the calculations for individual measurements. Where necessary, e.g., to compare gases measured by different detectors, averages and standard deviations were calculated for the closest five measurements (i.e., 1 sample batch). Standard/ambient air measurements were performed along the journey, therefore introducing regular gaps in the dissolved concentration maps. Ambient air measurements of He, Ar, N2 and O2 were processed the same way as other samples and used as quality control. The standard deviation varied <1.7% for Ar and O2, ∼0.5% for N2 and <7% for He. Average ambient air measurements were up to about 2% (N2, Ar, O2) or 3.5% (He) smaller than global values (see Supplementary Table S1).
In addition to the MIMS, we used a set-up with combined flow-through sensors, which included CONTROS HydroC® CO2 FT and CONTROS HydroC® CH4 FT sensors (formerly Kongsberg Maritime Contros GmbH, Kiel, Germany; now -4H- JENA Engineering GmbH, Jena, Germany) to measure CO2, and CH4, respectively. The setup also included a SBE 45 micro thermosalinograph (Sea-Bird Scientific, Bellevue, WA, United States) to measure temperature and conductivity on-board. For details please refer to Canning A. R et al. (2021). This part of the data is available via the Pangaea database (Canning et al., 2020) and details on CH4 concentrations were previously published by Canning A et al. (2021). We recorded GPS position, depth and in-situ temperature with a Lowrance HDS5 sonar.
2.4 Data Analysis
2.4.1 Calculation of Saturation Concentrations
We calculated the saturation concentrations for the different gas species according to the temperature-salinity-solubility relations for He (Weiss, 1971), O2 (Garcia and Gordon, 1992), N2 and Ar (Hamme and Emerson, 2004), CO2 (Weiss, 1974) and CH4 (Wiesenburg and Guinasso Jr, 1979). For the actual partial pressure in the atmosphere, we used 400 ppm for CO2 and 1,840 ppb for CH4. Since we are working in freshwater, we set salinity to 0 for the calculations. A comparison of the Henry coefficients at 15°C and standard pressure shows that He is the least soluble of the investigated gases (Figure 2), followed by N2, while O2, Ar and CH4 have very similar solubility, and CO2 is the most soluble gas by far.
2.4.2 Classification Into Waterscapes and Definition of Striking Sites
In the data analysis, we took a closer look at the three different waterscapes, i.e., river, channel and lakes (Figure 1) that were classified as specified in Maier et al. (2021). In brief, the main branches of the River Danube belong to the river class, while old cut-off meanders and small channels with a low flow velocity are defined as channels. The lake class includes the shallow delta lakes. In addition to these three waterscapes, we evaluated three sites, where we found extreme values of dissolved gas concentrations: Lake Isac, Canal Vatafu-Imputita and a combination of channels in the north (see boxes in Figure 1). These sites are representative of different areas within the delta with prominent characteristics.
The northern channels cut through the Sontea-Fortuna lake complex in the north of the delta and include Canal Mila 35, Canal Sontea and Garla Sontea (Gastescu, 2013). Especially in the western-most part of the northern channel complex, the canals are bordered by river levees (Supplementary Figure S8). The vegetation is a mix of natural floodplain forest, mixed reed mace and pure reed vegetation on mineral and organic soils. In some places, the river levees are used for wood extraction, cattle grazing and small vegetable gardens (Hanganu et al., 2002). These channels are representative for most small channels in this area.
Canal Vatafu-Imputita is situated in the Rosu-Puiu complex in the eastern part of the delta (Oosterberg et al., 2000) at the border of the Vatafu-Lungulet core protection zone and the surrounding buffer zone. This area is situated in a depression zone and lies below sea level (Gastescu, 2013). As a result, the area is permanently inundated (Supplementary Figure S8). The dominant vegetation is reed, which mainly occurs on plaur. However at the Easternend of the channel also “mineral soils” and “salinized soils” occur (Hanganu et al., 2002), which may reflect the evolution of the delta over time (Panin, 1996). Judging from vegetation and elevation maps, the channels in the Matita-Merhei lake complex in the North shows similar characteristics (Hanganu et al., 2002; Gastescu, 2013).
Lake Isac belongs to the Gorgova-Uzlina lake complex in the fluvial part of the delta and has a residence time of about 12 days (Oosterberg et al., 2000). With about 10.2 km2 it is the deltas’ fourth largest lake with respect to open water surface area and has an average water depth of 2.4 m (Oosterberg et al., 2000). It was categorized as large and turbid lake by Oosterberg et al. (2000) and as “intermediate” type lake showing “a combination of clear water, submerged vegetation, suspended solids and algal blooming” by Coops et al. (1999). This matches our recent observations, where Lake Isac had abundant submerged vegetation in spring and early summer, while later in the year it showed signs of an algal bloom (Maier et al., 2021). Examples of lakes in the delta showing similar characteristics are Lake Fortuna and Lake Gorgova (Coops et al., 1999). Apart from Lake Isac, the other mapped lakes were classified as “turbid” with less abundant submerged vegetation (Coops et al., 1999; Oosterberg et al., 2000).
2.4.3 Estimation of Excess Air and Equilibration Temperature
To estimate the excess air present in our system, we used both a visual approach for three of the locations, where enough data was present, as well as the “nobelfit”-routine (Brennwald, 2020).
For the visual approach, which is helpful to understand the concept of excess air, we plotted He concentrations against Ar concentrations in ccSTP/g (cubic centimeters at standard conditions per mass of water, 1 ccSTP = 1/22,414 Mol). We included the line that represents air saturated water samples (ASW) equilibrated at different temperatures, as well as a line indicating the concentration changes of ASW when excess air, A, increases at a certain temperature,
The unfractionated excess air model (UA-model) is the simplest concept to describe the excess air phenomenon. It assumes complete dissolution of an entrapped air bubble as described by:
where
Using the script “noblefit.m” (Brennwald, 2020), which is based on a χ2 regression model, we employed He, Ar and N2 as tracers to solve Eq. 1 for
Since He concentrations in our system are likely affected by ebullition, we also used traditional O2:Ar ratios to disentangle the biologically produced amount of O2 from physical changes in dissolved gas saturations.
2.4.4 O2 Estimation From O2:Ar Ratio
Given their similar solubility (Figure 2), O2 and Ar concentrations are affected in a similar way by physical changes, such as changes in temperature and pressure or gas stripping. Biological processes, i.e., O2 production or consumption via photosynthesis or respiration, on the other hand do not affect Ar concentrations, thereby creating a difference in the O2:Ar ratio. In environments where ebullition or air entrapment play a large role and in the absence of other Ar sources or sinks, the O2:Ar ratio can be used to disentangle the biologically induced O2 changes from physical changes (Craig and Hayward, 1987).
We calculated ΔO2/Ar, the biologically induced disequilibrium of O2 with respect to Ar from the O2 and Ar saturation (
where
The amount of O2 associated to biological activity thus follows as:
and can be either positive (photosynthesis) or negative (respiration). We calculated the difference between the measured O2 concentration and the concentration expected from the O2:Ar ratio by adding the biological O2 to the equilibration concentration:
Negative
2.4.5 Spatial Maps and Statistical Analysis
We used Matlab R2017a and R2017b to create the figures and conduct statistical analyses. For the spatial maps, we updated publicly available shape files for Romania and Ukraine (Mapcruzin, 2016; https://mapcruzin.com/, last access: 13 December 2016) using the OpenLayers plugin in QGIS. This data sources contains imformation from openstreetmap.org, which is made available under the Open Database License (ODbL) at https://opendatacommons.org/licenses/odbl/1.0/). To compare the concentrations and saturations in the three different waterscapes and three additional sites of interest, we used the “distributionPlot.m” function (Jonas, 2021). Source code from the “noblefit”-package (Brennwald, 2020) was run on GNU Octave (version 4.2.1).
3 Results
3.1 Dissolved Greenhouse Gases: CO2 and CH4
Both CO2 and CH4 showed very large concentration ranges and steep gradients across the delta with a hotspot area in the East that persisted across seasons (Figure 3). As the green colors indicate, CO2 was undersaturated in many parts of the lakes in both seasons with a median across all lakes of 96% saturation in May and 65% in October. We encountered exceptions for the western lake areas close to the inflow, which receive water from wetlands and channels. These channels, as well as the river main branches, were oversaturated in CO2 across seasons (median in May and October: 279 and 283%, respectively, in the river branches and 1,270%, respectively, 270% in the channels). Compared to the river reaches, the oversaturation in the channels showed a larger range (Supplementary Table S3). The highest concentrations were found in Canal Vatafu-Imputita (median: 3,000% and 4,400% in May and October, respectively, Supplementary Table S4) and the adjoining channels, Canal Busurca (leading north) and Canal Rosu-Imputita (leading south to Lake Rosu, Figure 1). While Canal Busurca showed high concentrations along the whole channel stretch in May, concentration dropped along the channel in October, indicating the reversal of flow direction along the first part of the channel.
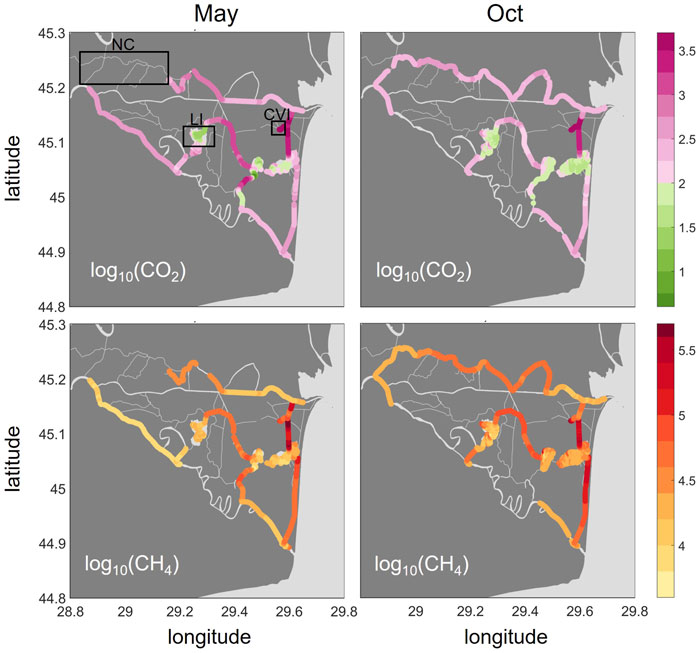
FIGURE 3. Spatial distribution of greenhouse gas saturations (%) as CO2 (top row) and CH4 (bottom row) in May and October 2017 presented as log10 (). Color coding: pink for CO2 represents oversaturation (>2), green indicates undersaturation. CH4 is oversaturated throughout the delta. The boxes in the upper left graph indicate the locations of the Northern Channels (NC), Lake Isac (LI) and Canal Vatafu-Imputita (CVI). The two plots for CH4 were adapted from Canning A et al. (2021).
CH4 was oversaturated in all parts of the delta, with the lowest saturations occurring in the main branches of the Danube (median: 10,700 and 18,000% in May and October, Figure 3 and Supplementary Table S3) followed by the lakes (median: 16,600 and 22,300% in May and October, respectively). Channels showed the highest CH4 saturations (median: 41,200 and 57,700% in May and October, respectively). In contrast to CO2, the highest CH4 saturations were not found in Canal Vatafu-Imputita directly, but rather in Canal Rosu-Imputita. Canal Cordon-Litoral showed elevated CH4 partial pressures that covered a long stretch especially in October. CO2 was only mildly oversaturated in this channel.
3.2 Noble Gases: He and Ar
The noble gases, He and Ar (Figure 4), generally showed undersaturation conditions in lakes, with the strongest undersaturation occurring in Lake Isac for both gases in May (median: 77 and 91%, respectively). The strongest oversaturation, in contrast, was found in small channels. While the highest He saturations were observed in the Northern Channels in October (median: 108%), the eastern channels around Canal Vatafu-Imputita showed the maximum Ar saturations in both seasons (median: 108% in May and 112% in October). Along the stretch of this channel, we observed both under and oversaturated conditions with respect to He.
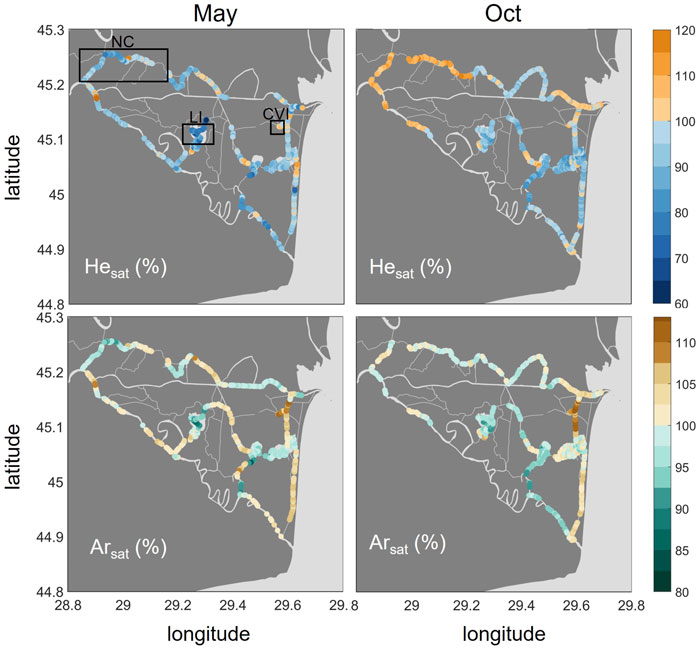
FIGURE 4. Spatial distribution of He (top row) and Ar (bottom row) in % saturation in May and October 2017. Oversaturation is shown in orange/brown and undersaturation in blue/turquoise. Please note the different ranges of the color bars. The boxes in the upper left graph indicate the locations of the Northern Channels (NC), Lake Isac (LI) and Canal Vatafu-Imputita (CVI).
3.3 O2 and N2
O2 saturations covered a large range from 19% to 162% in May and 5.2% to 139% in October (Figure 5). The main river branches were slightly undersaturated in both seasons with a median of 90 and 92% in May and October, respectively. In contrast to the other gases, O2 saturations were highest in the lakes, especially in Lake Isac (median: 147% in May). The CO2 hotspot, Canal Vatafu-Imputita, had the lowest O2 saturations. The saturations were as low as 19% in May and 5% in October at that spot and adjoining channels, which is less than 2 mg/L and therefore too low for the survival of most fish species.
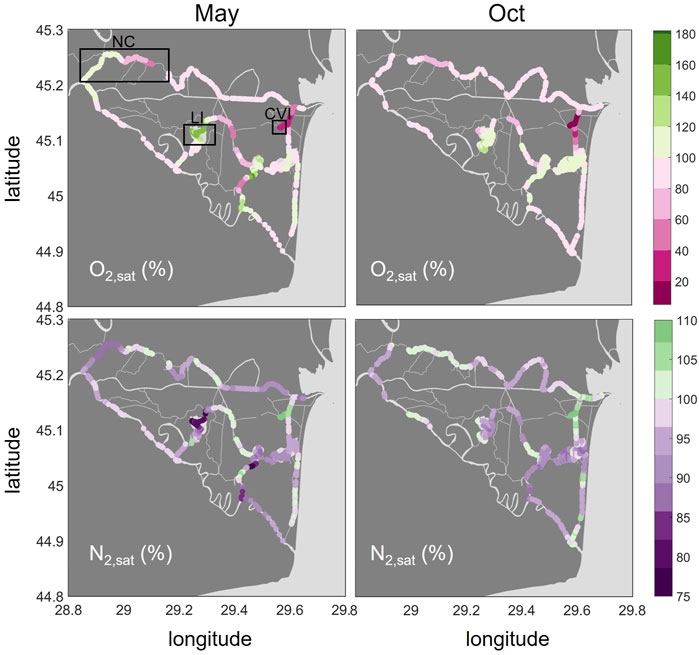
FIGURE 5. Spatial distribution of O2 (top row) and N2 (bottom row) in % saturations in May and October 2017. Oversaturation is shown in green, undersaturation in purple and pink. Please note the different ranges of the colorbars. The boxes in the upper left graph indicate the locations of the Northern Channels (NC), Lake Isac (LI) and Canal Vatafu-Imputita (CVI).
The N2 saturations we observed ranged between 74 and 111% in May and 87–108% in October (Figure 5). N2 was generally undersaturated in the lakes, while some of the channels showed oversaturation. N2 saturations were elevated in the channels downstream of small settlements and lodging houses, for example in the channel leading from the main river to Lake Uzlina (Canal Uzlina) and the channel entering Lake Puiu from the west (Canal Caraorman). The strongest oversaturation in both May and October (median: 109 and 108%, respectively) was found in the CO2 hotspot, Canal Vatafu-Imputita.
4 Discussion
4.1 From Patterns to Processes
The simultaneous analysis of different dissolved gas concentrations at high spatial resolution allows us to identify systematic patterns of concentration anomalies across the waterscapes of the Danube Delta. Comparing reactive with non-reactive gas concentrations, we identify relevant physical and biological processes such as excess air formation (Kipfer et al., 2002), ebullition (Brennwald et al., 2005; McGinnis et al., 2006) and ecosystem metabolism (Staehr et al., 2012). Two features in the concentration maps (Figures 3–5) deserve special attention. In the Eastern channels (Canal Busurca, Canal Rosu-Imputita and Canal Vatafu-Imputita; Figure 1) we observed hotspots of CH4 and CO2 concentrations (Figure 3). The clear oversaturation of non-reactive gases such as Ar and N2 in this area could help us to identify potential drivers of these emission hotspots (Figures 4, 5). By contrast, the survey revealed a general under-saturation of dissolved CO2 in lakes (Figure 3). Here, changes in diel O2 concentrations could allow estimating the intensity of photosynthesis (Staehr et al., 2012). However, the observed under-saturation of He, Ar and N2 (Figures 4, 5) points to a non-biological sink of dissolved gases that could affect primary production estimates based on O2 concentrations.
A statistical display of the individual measurements in May and October reveals a broad distribution of measured values (Figure 6). The plot summarizes all data grouped according to waterscapes in the left panel, while the right-hand side presents only data from “boxed” areas in Figure 1: the Northern Channels, the hotspot channel Canal Vatafu-Imputita in the East and Lake Isac in the center of the study area. Part of the variability is caused by dramatic concentration changes at the local level (Figures 3, 5). The small channels in the vicinity of Canal Vatafu-Imputita are a case in point: here, the hydrology is characterized by stagnant conditions with very slow flow velocities. Sudden changes in discharge in the main river can even reverse the flow direction and introduce water from the Sulina main branch to an area that otherwise receives water from the delta. In contrast to the main branch, the water from the delta has a strong signature from the reed and elevated greenhouse gas concentrations. Therefore, dissolved gas concentrations of CO2, CH4 and O2 change abruptly along channel junctions. In the Northern Channels, the gradients were more gradual. There, larger concentration changes show a relation to channel junctions. We observed similar broad concentrations shifts in lakes such as Lake Isac. Here, greenhouse gas concentrations were highest in the East, where water was entering from a small connecting channel with Canal Litcov and from riparian reed beds. O2 showed the opposite trend with lowest concentrations in the East. Wind-driven gas exchange drove re-equilibration and therefore, the dissolved gas signatures supplied by the lakes to the outflow channels changed gradually with increasing distance from the lake source.
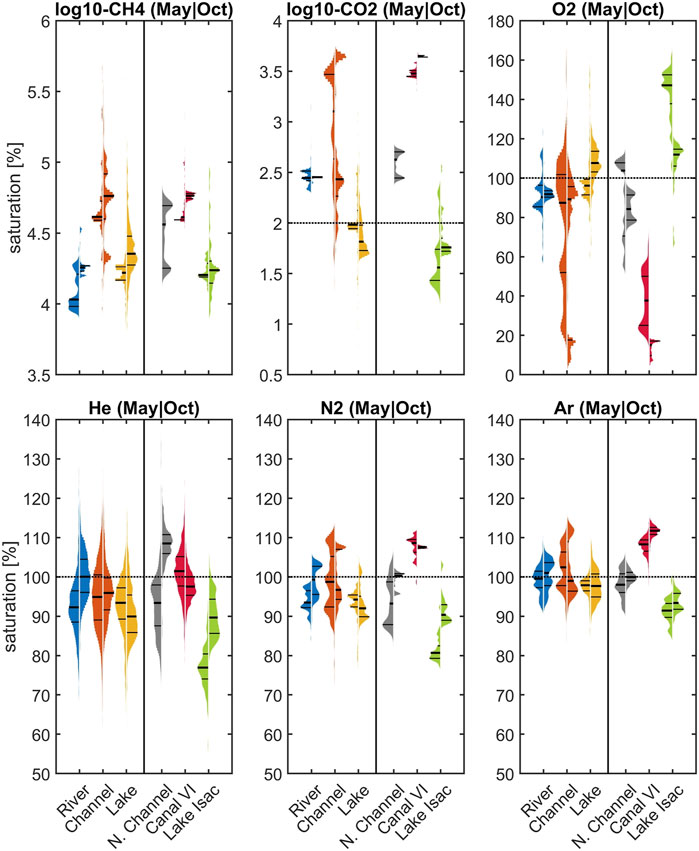
FIGURE 6. Variability in CH4, CO2, O2, He, N2 and Ar saturations with respect to different waterscapes (river, channel, lake) and three selected areas in May (left distribution) and October (distribution on the right). Horizontal lines in the distributions mark the 25th, 50th and 75th percentile. Horizontal dotted lines represent 100% saturation. In case of CH4 this line is below the selected plotted area. Please note the different scaling of the y-axis and the representation of CH4 and CO2 as log10 (). See boxes in Figure 1 for the location of the specific areas Northern Channels, Canal Vatafu-Imputita and Lake Isac and Supplementary Tables S3 and S4.
The comparison of dissolved gas patterns across waterscapes yields valuable diagnostic insights (Figure 6). Focusing on non-reactive gases, the reaches of the Danube River remained close to saturation, whereas parts of the channels and most prominently Canal Vatafu-Imputita remained clearly oversaturated with respect to Ar and N2 during both seasons. Therefore, an effective mechanism of excess air formation seems to be present in some of the small channels that form hot spots of potential greenhouse gas emissions. By contrast, lakes in general, and especially Lake Isac, showed a tendency towards undersaturation in their non-reactive gas concentrations. This undersaturation in He and N2 in Lake Isac was more pronounced in May (77 and 81% for He and N2, respectively) compared to October (∼90% for both He and N2) and indicates that a stripping mechanism is active in the transfer of unreactive gases to the atmosphere.
As expected, the O2 and CO2 patterns revealed heterotrophic characteristics of the main branches of the Danube River (Figure 6) with oversaturation of CO2 and general O2 deficits. The channels showed the same heterotrophic pattern but with a very broad distribution that could potentially be traced to their interaction with the littoral zone and the reed beds. Lake Isac, by contrast, showed evidence for intense photosynthesis in the summer, with around 150% O2 saturation and lower autotrophy in October with about 110% O2.
To discuss possible sources and sinks of unreactive gases, we will address a few hypotheses that could help identifying the role of different physical processes in generating the observed patterns in the Danube Delta (Figure 7). In the context of excess air in channels, several studies documented the role of water table fluctuations in unconfined groundwater bodies (e.g., Kipfer et al., 2002; Mächler et al., 2013). In the Eastern Danube Delta, however, floating reed vegetation is a much more prominent feature of the littoral zone than sand bars or riparian soils, which calls for another supersaturation formation hypothesis. In lakes, the release of methane bubbles at the sediment-water interface could drive gas ebullition to the atmosphere and result in dissolved gas deficits (McGinnis et al., 2006). Alternatively, accumulating oxygen bubbles at the surface of submerged macrophytes would provide an additional pathway for the loss of unreactive gases in the water column (Long et al., 2020).
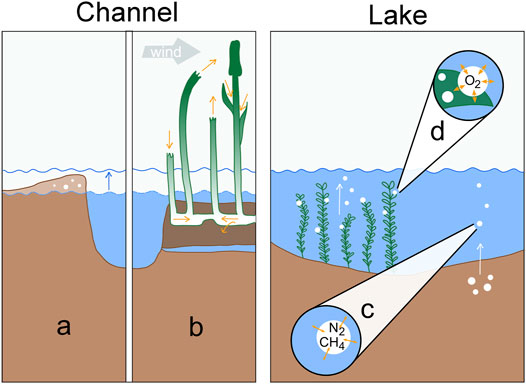
FIGURE 7. Processes determining dissolved gas concentrations in channels (left) and shallow lakes (right): (A) Excess air formation via water table fluctuation in riverbanks. (B) Convective sediment aeration by Phragmites australis in permanently inundated reed areas. The two left culms illustrate venturi-induced convection, the right two culms represent humidity-induced convection. (C) Gas stripping by CH4 bubbles rising from anoxic sediments. (D) Gas stripping by O2 bubbles forming on macrophyte leaves during intensive photosynthesis.
4.2 Excess Air Is Tracing Emission Hotspots Near Reed Beds
The solubility of gases decreases with increasing temperature. The temperature sensitivity of this equilibrium process varies between different gases (Figure 8). While the solubility of He decreases by about 6% when the water temperature increases from 10 to 30°C, Ar solubility will diminish by 33%. This contrasting behavior can be used to estimate the amount of excess air, i.e., the excess in dissolved atmospheric gases, caused by dissolving air bubbles in water. Plotting the data from our surveys in Figure 8 reveals significant excess air components in the samples of Canal Vatafu-Imputita during both seasons, while the Northern Channels only show consistent excess air in October. The data from Lake Isac, by contrast, indicate significant gas loss (Figure 8).
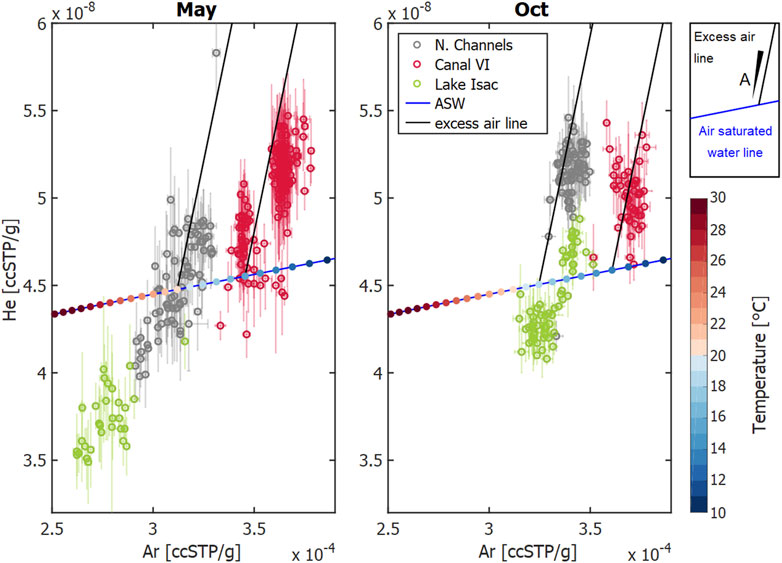
FIGURE 8. He vs. Ar concentration in ccSPT/g, i.e., cubic centimeter of gas at standard pressure and temperature per gram of water in samples from the indicated locations in May and October 2017. The open circles show the average data from different observation sites, standard deviations are shown as error bars. The blue lines represent the concentrations in air-saturated water (ASW) at different temperatures; with temperature in °C represented as color-coded dots at 1°C increments. The solid black lines represent the excess-air lines for temperatures that fit well with the measured data: T = 20°C and T = 15°C (May), and T = 18°C and T = 13°C (Oct). The amount of dissolved air, A, increases with increasing distance from the ASW line.
Knowledge regarding the geomorphological and ecological context of the different sites helps in the identification of processes that cause the observed patterns in Figure 8. The Northern Channels are framed by riverbanks representing a potential setting for excess air formation via water table fluctuations (Supplementary Figure S8). During rising water table, entrapped bubbles in the unsaturated zone dissolve and increase local concentrations above saturation (Kipfer et al., 2002). Both campaigns in spring and autumn took place during falling water level (Supplementary Figure S1), when we expect previously enriched water to exfiltrate from the riverbanks back into the channels (Figure 7A). Once in the channel, gas exchange ensures re-equilibration of the oversaturated water with the atmosphere. In addition, tourist boats navigate the Northern Channels extensively from spring through summer and autumn, enhancing gas exchange, but defining a causal link would require time-resolved monitoring of excess air and boat traffic.
Canal Vatafu-Imputita, on the other hand, is situated in a depression zone framed by permanently inundated reed beds (Supplementary Figure S8). We were thus initially surprised to find supersaturated conditions at this location, especially since it is one of very few locations showing excess air in both seasons (Figure 9). While the excess air signal in October was comparable to the Northern Channels, the equilibration temperature was about 5°C lower (Figure 8; Supplementary Figure S6). As there are no adjacent riverbanks and rather little traffic at Canal Vatafu-Imputita, we found only two potential drivers for the excess air signal at this location: rapid heating or convective gas addition via reed vegetation.
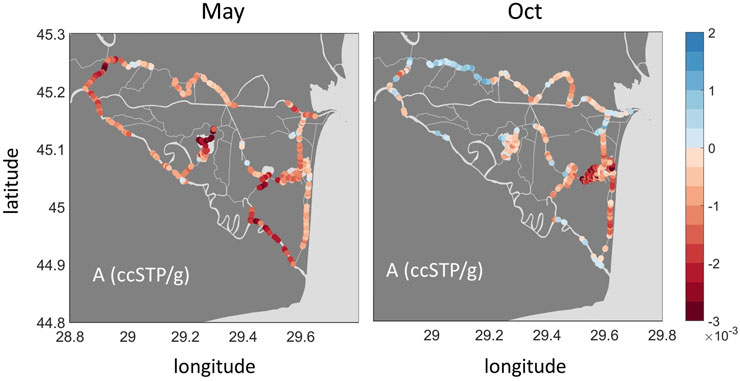
FIGURE 9. Spatial variability in the estimates of excess air A for May (left) and October (right).
As indicated by the difference between equilibrium temperature obtained from the UA-model and the in-situ measured temperature (Supplementary Figure S7), the equilibration could have taken place at an approximately 5°C lower temperature in the sun sheltered reed, with the water parcel heating rapidly without changing its gas content once reaching the channel (Supplementary Figure S4). The channels within reed beds are rather wind sheltered environments as long as the main wind direction is perpendicular to the channel orientation. However, during sporadic measurements of daily temperature cycles in the channel, we only observed temperature fluctuations up to 2°C over the course of 1 day. Therefore, it seems unlikely that rapid heating would lead to the observed excess air signals.
We can therefore hypothesize that the plant physiology of the dominating reed species was the relevant cause of the oversaturation (Figure 7B). Equipped with aerenchyma (i.e., tissue with air channels, e.g., Baldantoni et al. (2009)), Phragmites australis transports O2 in order to aerate its root zone (e.g., Brix et al., 1996). Aerating the root zone is vital for plants living in water logged or inundated soils, since anoxic sediment environments promote several adverse redox reactions (DeLaune and Reddy, 2008). The transportation mechanisms affect all gases present in air and wetland sediments (Sorrell and Brix, 2013). This way, He, Ar and N2 are pumped into the root zone together with O2 and could be used as tracers for plant-mediated oxygen supply.
Convective flow in plants is driven by a pressure gradient within the plant. The two most important gas transport processes in Phragmites australis are venturi-induced convection and humidity-induced convection (Armstrong et al., 1992). Venturi-induced flow is driven by wind blowing across the culms, thereby creating a pressure differential that sucks air out of tall dead culms. Short broken culms act as inflow and lead air along the underground root system to tall culms. The effectiveness of this process increases with wind speed (Armstrong et al., 1992). Humidity-induced flow works best during hot and dry days, since it relies on the pressure difference created by moistening of the air inside the plants living green shoots. Dead and broken culms act as efflux sites in this case (Armstrong et al., 1996). According to field measurements shortly above the water table, the pressure inside live culms is up to 2% higher than ambient air pressure (Arkebauer et al., 2001). The exchange of gases between plant and rhizome is governed by diffusion (Armstrong et al., 1996).
Assuming the plants provide enough air to their root system to saturate the surrounding water with dissolved gases, we can estimate the level of noble gas oversaturation to be expected. The plaur which Phragmites australis grows on is about 0.8–1.3 m thick, so it is reasonable to assume that the root systems reach a depth of 1 m below water level. At this depth, the local hydrostatic pressure is about 104 Pa higher than atmospheric pressure. If the plants would provide enough air to this depth to saturate the water phase at this increased pressure, we would expect 10% oversaturation when comparing it to water equilibrated at local atmospheric pressure. This is approximately the amount of oversaturation we observed for He, Ar and N2 in May and October in Canal Vatafu-Imputita (Supplementary Figure S5).
Based on field measurements, Brix et al. (1996) estimated the total gas exchange by Phragmites australis to 9–11 L m−2 h−1. Assuming an air-like gas composition in the gas transport system of the plant and a dissolution of 10% of the gas transported by the total flux observed by Brix et al. (1996), would mean that 1.5–3.5 h were sufficient to supply the amount of N2 and Ar to the root systems needed to create the observed oversaturation.
If reed beds play a significant role in the injection of excess air and high concentrations of CH4 and CO2, then how can we explain the different patterns observed in the GHG and excess air maps (Figures 3, 9)? Canal Vatafu-Imputita drains a core protection zone of the Danube Delta Biosphere Reserve, which is populated by Phragmites australis, while other core zones generally protect other vegetation types. In the core zone, harvesting and burning of the reed is not permitted, thus we expect more dead and broken culms that can function as efflux culms for the convective flow in this area, together with more degradable organic matter. Brix et al. (1996) report 280 dead and 85 living culms per square meter in their study area. At sites that are harvested and burnt we would expect the ratio to be shifted towards living culms as dead culms are removed regularly, which might restrict sediment aeration. A functioning soil aeration results in the oxidation of reduced species near the root zone, e.g., oxidation of CH4 produced during organic matter degradation to CO2 (DeLaune and Reddy, 2008). Looking at the maps in Figure 3, the high ratio of CO2 to CH4 indicates that CH4 oxidation could be an important process in Canal Vatafu-Imputita. This seems plausible, considering that biofilms inhabiting the root surfaces of Phragmites australis consist to about one-third of bacteria capable of oxidizing CH4 (Faußer et al., 2012). This could explain the buildup of high CO2 concentrations in the water phase below the floating plaur which subsequently drain into Canal Vatafu-Imputita. The adjacent Canal Rosu-Imputita is draining the buffer area, where reed harvesting is allowed within limits. It shows higher CH4 and lower CO2 concentrations than Canal Vatafu-Imputita, especially in spring. The oversaturation of Ar, N2 and He is also less in this channel during the early growing season, which may indicate that nearby reed beds are managed and O2 transfer during the early growing season is hampered, resulting in a reduced oxidation capacity in the root zone.
Once the supersaturated water reaches the channel, diffusive re-equilibration with the atmosphere would decrease the oversaturation towards equilibrium. Intense boat traffic would enhance gas exchange and ebullition could strip the gases even below equilibrium. A combination of these processes might explain the comparably low He saturations observed at Canal Vatafu-Imputita (Figure 6).
4.3 Gas Loss by Ebullition in Shallow Lakes
In contrast to the channels, we observed undersaturation of He, Ar and N2 in the lakes, especially in Lake Isac. This coincided with a CO2 undersaturation and an O2 oversaturation. The undersaturation of He, Ar and N2 indicates that gas stripping by ebullition affects the dissolved gas concentrations, since a rising bubble exchanges gas with the surrounding water column and thereby strips dissolved gases depending on their solubility (Brennwald et al., 2005; McGinnis et al., 2006). Accordingly, in Lake Isac the hardly soluble He showed the strongest undersaturation, followed by the more soluble N2 and Ar (compare Figures 2 and 6). As O2 and Ar exhibit similar solubilities, undersaturation of Ar indicates that O2 must be affected by gas stripping. We calculated the effect on O2 concentration via O2:Ar ratios (Eq. 4 and Figure 10). For oversaturated O2 conditions in May, we found a linear relation with missing O2,dif down to about 2.5 mg/L at 150% saturation.
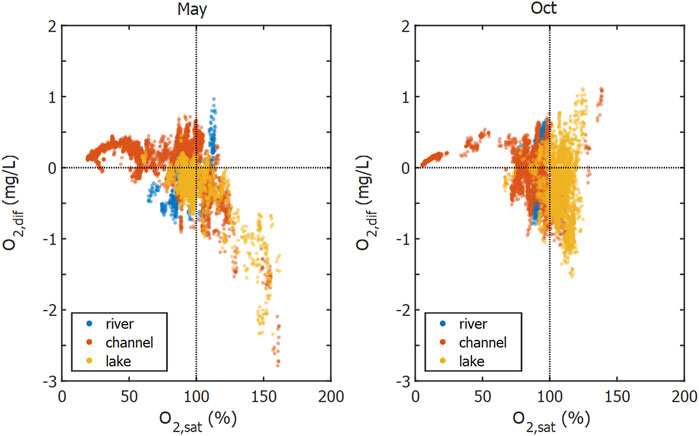
FIGURE 10. O2 concentration difference of O2 calculated from O2:Ar ratio (Eq. 4). Color coding indicates the different waterscapes. Negative values of
Gas ebullition is the most likely cause for the observed oxygen deficit and there are two potential drivers of such a process: CH4 ebullition from the sediment (Figure 7C) and O2 ebullition from macrophyte leaves (Figure 7D). Evaluating the dataset from Maier et al. (2020) showed that CH4 ebullition was most often present in lakes and channels, where it occurred in 43 and 42% cases of flux measurements around the year (Maier et al., 2020). However, with a depth of only about 1.5–4 m, the sampled delta lakes are comparably shallow (Oosterberg et al., 2000), which limits the contact time between water column and the rising gas bubble, thus restricting gas exchange (McGinnis et al., 2006). A pure CH4 bubble with an initial size of 2 mm would still contain 70% of the initial CH4 if released from 4 m depth. Larger bubble diameter or shallower release depth would increase the percentage of initially CH4 transported (Greinert and McGinnis, 2009). CH4 bubbles released from the sediment usually contain large amounts of N2. Assuming the minimum amount of CH4 needed to trigger the rise of a bubble through the sediment would result in an approximate CH4:N2 composition of 35:65% (Langenegger et al., 2019). A CH4/N2 bubble released in a lake with 2 m depth would transport on average about 5.3 μg O2 per bubble to the atmosphere (Supplementary Figure S10). Thus, about 0.8 million methane bubbles per m2 would have to be released to the atmosphere from a fully mixed water column of 2 m depth to account for the buildup of a daily oxygen deficit of 2 g m−3. This would equal a CH4 flux of 3.1 mol m−2 day−1, which is about 60 times higher than the maximum total CH4 flux measured in lakes and more than 2,000 times higher than the median total CH4 flux from lakes in the Danube Delta (Maier et al., 2021). In the case of CH4 ebullition being the sole cause of O2 reduction, we would expect gas stripping to be strongest after macrophyte die-off or in autumn when large amounts of easily degradable material are available. Considering the large fluxes needed and the unusual timing, it is unlikely for CH4 ebullition to be the dominant process reducing the saturation of dissolved gases in May and we therefore turn our attention to photosynthesis.
In spring, the bottom of Lake Isac was covered by macrophytes, many of them reaching close to the water surface (Supplementary Figure S11). If photosynthesis is very productive, bubbles containing N2 and a lot of O2 form on the leave surface of macrophytes and can be released via ebullition (Koschorreck et al., 2017). In contrast to CH4 bubbles rising from the sediment, these O2 bubbles spent considerably longer time in contact with the water column until they detach and rise to the surface. This process would also explain the quasi-linear relationship between observed oversaturation and estimated amount of missing O2, assuming that stronger oversaturation coincided with more O2 bubble formation and increased release to the surface. Strong oversaturation together with missing O2 was almost exclusively observed in the lakes (Supplementary Figure S9), especially in Lake Isac and Lake Puiu in spring where median O2 saturation was 147 and 115%, respectively. Both lakes are also the sites where He and Ar saturations were lowest with median saturations of 76.9 and 91.4% in Lake Isac, and 87.5 and 96.9% in Lake Puiu, respectively. Temperature-corrected, specific conductivity was lower in these lakes than in the main river (Supplementary Figure S3). This may also indicate high primary productivity because intense photosynthesis takes up CO2, thus increasing pH, shifting the carbonate equilibrium, and leading to calcite precipitation and a decrease of specific conductivity (Dittrich et al., 2004; Ostrofsky and Miller, 2017).
The combined measurements of non-reactive gases and O2 thus indicate that photosynthesis was even higher than indicated by in-situ O2 oversaturation. Whether the inter-lake differences are caused by differences in submerged macrophyte abundance (Coops et al., 1999) or caused by differences in macrophyte species (Niculescu et al., 2020) cannot be concluded without further research. In any case, the current findings support several recent studies that highlight the importance of considering ebullitive gas exchange when estimating metabolism from diel O2 concentration measurements in shallow ecosystems and propose to constrain ebullition rates using funnels or modelling the gas exchange from noble gas measurements (Koschorreck et al., 2017; Howard et al., 2018; Long et al., 2020). The reduction of daily net O2 production estimates by ebullitive O2 fluxes is estimated to about 1–21% (Howard et al., 2018).
4.4 Implications for Process Analysis and Upscaling
High-resolution mapping of biogenic and inert dissolved gases across the waterscapes of the Danube Delta revealed a broad range in the saturation state of the greenhouse gases CO2 and CH4 (Figure 3). The main river reaches showed the expected behavior of a net heterotrophic ecosystem metabolism with slight supersaturation in both gases (Figure 6).
The channels in a delta system represent the reactive pipes transferring water from lakes and wetlands back into the main river and finally to the sea. Measuring the patterns of unreactive gases in channels provided additional insights: Signals of excess air in a canal close to floating natural Phragmites stands provided evidence for convective gas transfer into the root zone and for intensified CH4 oxidation resulting in elevated levels of CO2 at comparatively low CH4 concentration. This preliminary assignment of most plausible processes to a set of dissolved gas patterns may help in guiding further research into the “black-box” of terrestrial-aquatic linkages at densely vegetated aquatic-terrestrial boundaries.
In comparison to the river reaches and channels, the shallow lakes were dominated by photosynthesis with clear CO2 deficits and O2 oversaturation (Figures 3, 5). In these highly productive systems (Durisch-Kaiser et al., 2011; Maier et al., 2021), non-reactive gases gave clear evidence for O2 ebullition from macrophytes, a process that deserves further attention. Ebullitive loss of O2 to the atmosphere complicates the estimation of net ecosystem production in shallow lakes (Koschorreck et al., 2017), beds of macrophytes and with floating vegetation (Kleinschroth et al., 2021). Such plant communities in freshwater systems remain a significant challenge for efforts to upscale net CO2 exchange.
The current discussion and global synthesis of the carbon transfer along the land-ocean aquatic continuum (LOAC, Regnier et al., 2013) is still dominated by active pipe models (Cole et al., 2007; Abril and Borges, 2019). Such a river engineering approach falls short of capturing the dramatic changes in the biomorphology of large river corridors of the last century. Surveys identified a loss of around 80% of the riparian wetlands in the lower Danube River corridor (Csagoly et al., 2016). On a global scale, preliminary estimates arrive at a loss of wetland area in the range of 17–50% between 1970 and 2008 depending on the region (Dixon et al., 2016). Loss or restoration of riparian wetland areas will certainly affect the greenhouse gas budgets of large river systems, but adequate measurements and models are needed to derive reliable estimates.
Based on this case study, we conclude, that adding non-reactive gas tracers to the toolbox of biogeochemical analysis offers significant potential for disentangling physical and biological processes in deltaic systems. Our analysis identifies root aeration of Phragmites australis reed beds as a plausible process leading to the oversaturation of small channels with non-reactive gas species as well as greenhouse gases. Furthermore, we highlight the effect of O2 ebullition on dissolved gas concentrations in shallow lakes and the risk of underestimating metabolic rates derived from O2 concentrations.
Data Availability Statement
The datasets presented in this study can be found in the following online repositories: The data set with the MIMS measurements presented (i.e. He, Ar, O2 and N2) and accompanying metadata files are available via the ETH Research Collection at https://doi.org/10.3929/ethz-b-000537695 (Maier et al., 2022). The CO2, CH4, temperature and conductivity data have been uploaded to PANGAEA, available at: https://doi.pangaea.de/10.1594/PANGAEA.925080 (last access: 20.01.2021, Canning et al., 2020).
Author Contributions
MSM, AC and BW conceptualized the present study. MSM, AC, CT and MB participated in field work. AC processed and analyzed the CO2 and CH4 data, MSM processed and analyzed the other dissolved gases. MSM conducted the excess air model calculations with support from MB. MSM prepared the figures, supplementary material, and, together with BW, drafted the manuscript. All authors engaged in discussing and editing the paper.
Funding
This work was supported by the Swiss State Secretariat for Education, Research and Innovation (SERI; grant no. 15.0068). The research leading to these results has received funding from the European Union’s Horizon 2020 research and innovation program under the Marie Skłodowska-Curie Actions (grant no. 643052; C-CASCADES project).
Conflict of Interest
The authors declare that the research was conducted in the absence of any commercial or financial relationships that could be construed as a potential conflict of interest.
Publisher’s Note
All claims expressed in this article are solely those of the authors and do not necessarily represent those of their affiliated organizations, or those of the publisher, the editors and the reviewers. Any product that may be evaluated in this article, or claim that may be made by its manufacturer, is not guaranteed or endorsed by the publisher.
Acknowledgments
The authors thank Tim Kalvelage, Alexander Mistretta, Till Breitenmoser and our Romanian houseboat crew for their support during fieldwork. We thank the entire 4H- JENA team for their support with the CH4 and CO2 sensors, as well as Dan McGinnis and Rolf Kipfer for fruitful discussions and suggestions.
Supplementary Material
The Supplementary Material for this article can be found online at: https://www.frontiersin.org/articles/10.3389/fenvs.2022.838126/full#supplementary-material
References
Abril, G., and Borges, A. V. (2019). Ideas and Perspectives: Carbon Leaks from Flooded Land: Do We Need to Replumb the Inland Water Active Pipe? Biogeosciences 16 (3), 769–784. doi:10.5194/bg-16-769-2019
Aeschbach-Hertig, W., El-Gamal, H., Wieser, M., and Palcsu, L. (2008). Modeling Excess Air and Degassing in Groundwater by Equilibrium Partitioning with a Gas Phase. Water Resour. Res. 44 (8), 1-12. doi:10.1029/2007wr006454
Aeschbach-Hertig, W., Peeters, F., Beyerle, U., and Kipfer, R. (1999). Interpretation of Dissolved Atmospheric noble Gases in Natural Waters. Water Resour. Res. 35 (9), 2779–2792. doi:10.1029/1999wr900130
Arkebauer, T. J., Chanton, J. P., Verma, S. B., and Kim, J. (2001). Field Measurements of Internal Pressurization in Phragmites Australis (Poaceae) and Implications for Regulation of Methane Emissions in a Midlatitude Prairie Wetland. Am. J. Bot. 88 (4), 653–658. doi:10.2307/2657065
Armstrong, J., Armstrong, W., Beckett, P. M., Halder, J. E., Lythe, S., Holt, R., et al. (1996). Pathways of Aeration and the Mechanisms and Beneficial Effects of Humidity- and Venturi-Induced Convections in Phragmites Australis (Cav.) Trin. Ex Steud. Aquat. Bot. 54 (2), 177–197. doi:10.1016/0304-3770(96)01044-3
Armstrong, J., Armstrong, W., and Beckett, P. M. (1992). Phragmites Australis: Venturi- and Humidity-Induced Pressure Flows Enhance Rhizome Aeration and Rhizosphere Oxidation. New Phytol. 120 (2), 197–207. doi:10.1111/j.1469-8137.1992.tb05655.x
Baldantoni, D., Ligrone, R., and Alfani, A. (2009). Macro- and Trace-Element Concentrations in Leaves and Roots of Phragmites Australis in a Volcanic lake in Southern Italy. J. Geochemical Exploration 101 (2), 166–174. doi:10.1016/j.gexplo.2008.06.007
Battin, T. J., Kaplan, L. A., Findlay, S., Hopkinson, C. S., Marti, E., Packman, A. I., et al. (2008). Biophysical Controls on Organic Carbon Fluxes in Fluvial Networks. Nat. Geosci 1 (2), 95–100. doi:10.1038/ngeo101
Bernhardt, E. S., Heffernan, J. B., Grimm, N. B., Stanley, E. H., Harvey, J. W., Arroita, M., et al. (2018). The Metabolic Regimes of Flowing Waters. Limnology and Oceanography 63, S99–S118. doi:10.1002/lno.10726
Borges, A. V., and Abril, G. (2011). “Carbon Dioxide and Methane Dynamics in Estuaries,” in Treatise on Estuarine and Coastal Science. Editors E. Wolanski,, and D. McLusky (Waltham: Academic Press), 119–161. doi:10.1016/b978-0-12-374711-2.00504-0
Brennwald, M. S. (2020). Noblefit - Quantitative Interpretation of Enivronmental Tracer Data [Online]. GitHub.com. Available at: https://github.com/brennmat/noblefit (Accessed 05 29, 2021).
Brennwald, M. S., Kipfer, R., and Imboden, D. M. (2005). Release of Gas Bubbles from lake Sediment Traced by noble Gas Isotopes in the Sediment Pore Water. Earth Planet. Sci. Lett. 235 (1), 31–44. doi:10.1016/j.epsl.2005.03.004
Brennwald, M. S., Schmidt, M., Oser, J., and Kipfer, R. (2016). A Portable and Autonomous Mass Spectrometric System for On-Site Environmental Gas Analysis. Environ. Sci. Technol. 50 (24), 13455–13463. doi:10.1021/acs.est.6b03669
Brix, H., Sorrell, B. K., and Schierup, H.-H. (1996). Gas Fluxes Achieved by In Situ Convective Flow in Phragmites Australis. Aquat. Bot. 54 (2), 151–163. doi:10.1016/0304-3770(96)01042-x
Cai, W.-J. (2011). Estuarine and Coastal Ocean Carbon Paradox: CO2 Sinks or Sites of Terrestrial Carbon Incineration? Annu. Rev. Mar. Sci. 3 (1), 123–145. doi:10.1146/annurev-marine-120709-142723
Canning, A., Maier, M.-S., Wehrli, B., and Körtzinger, A. (2020). [Dataset]. Seasonal High-Resolution Sensor Data for pCO2, pCH4, O2 and Temperature/salinity within the Danube Delta, Romania in 2017. Available at: https://doi.pangaea.de/10.1594/PANGAEA.925080. Accessed from 20 January, 2021.
Canning, A. R., Fietzek, P., Rehder, G., and Körtzinger, A. (2021). Technical Note: Seamless Gas Measurements across the Land-Ocean Aquatic Continuum - Corrections and Evaluation of Sensor Data for CO2, CH4 and O2 from Field Deployments in Contrasting Environments. Biogeosciences 18 (4), 1351–1373. doi:10.5194/bg-18-1351-2021
Canning, A., Wehrli, B., and Körtzinger, A. (2021). Methane in the Danube Delta: the Importance of Spatial Patterns and Diel Cycles for Atmospheric Emission Estimates. Biogeosciences 18 (12), 3961–3979. doi:10.5194/bg-18-3961-2021
Cole, J. J., Prairie, Y. T., Caraco, N. F., McDowell, W. H., Tranvik, L. J., Striegl, R. G., et al. (2007). Plumbing the Global Carbon Cycle: Integrating Inland Waters into the Terrestrial Carbon Budget. Ecosystems 10 (1), 171–184. doi:10.1007/s10021-006-9013-8
Coops, H., Hanganu, J., Tudor, M., and Oosterberg, W. (1999). Classification of Danube Delta Lakes Based on Aquatic Vegetation and Turbidity. Hydrobiologia 415 (0), 187–191. doi:10.1007/978-94-017-0922-4_26
Covaliov, S., Doroftei, M., and Hanganu, J. (2010). Danube Delta Biosphere Reserve (DDBR): Reed Dynamics within Actual Context. Adv. Environ. Sci. 2 (1), 69–79.
Craig, H., and Hayward, T. (1987). Oxygen Supersaturation in the Ocean: Biological versus Physical Contributions. Science 235 (4785), 199–202. doi:10.1126/science.235.4785.199
Csagoly, P., Magnin, G., and Hulea, O. (2016). “Lower Danube Green Corridor,” in The Wetland Book: II: Distribution, Description and Conservation. Editors C. M. Finlayson, G. R. Milton, R. C. Prentice, and N. C. Davidson. (Dordrecht: Springer Netherlands), 1–6. doi:10.1007/978-94-007-6173-5_251-1:
Deemer, B. R., Harrison, J. A., Li, S., Beaulieu, J. J., DelSontro, T., Barros, N., et al. (2016). Greenhouse Gas Emissions from Reservoir Water Surfaces: A New Global Synthesis. BioScience 66 (11), 949–964. doi:10.1093/biosci/biw117
DeLaune, R. D., and Reddy, K. R. (2008). Biogeochemistry of Wetlands: Science and Applications. Boca Raton: CRC Press.
DelSontro, T., Beaulieu, J. J., and Downing, J. A. (2018). Greenhouse Gas Emissions from Lakes and Impoundments: Upscaling in the Face of Global Change. Limnol Oceanogr Lett. 3 (3), 64–75. doi:10.1002/lol2.10073
Dittrich, M., Kurz, P., and Wehrli, B. (2004). The Role of Autotrophic Picocyanobacteria in Calcite Precipitation in an Oligotrophic Lake. Geomicrobiology J. 21 (1), 45–53. doi:10.1080/01490450490253455
Dixon, M. J. R., Loh, J., Davidson, N. C., Beltrame, C., Freeman, R., and Walpole, M. (2016). Tracking Global Change in Ecosystem Area: The Wetland Extent Trends index. Biol. Conservation 193, 27–35. doi:10.1016/j.biocon.2015.10.023
Durisch-Kaiser, E., Doberer, A., Reutimann, J., Pavel, A., Balan, S., Radan, S., et al. (2011). Organic Matter Governs N and P Balance in Danube Delta Lakes. Aquat. Sci. 73 (1), 21–33. doi:10.1007/s00027-010-0156-5
Faußer, A. C., Hoppert, M., Walther, P., and Kazda, M. (2012). Roots of the Wetland Plants Typha Latifolia and Phragmites Australis Are Inhabited by Methanotrophic Bacteria in Biofilms. Flora - Morphol. Distribution, Funct. Ecol. Plants 207 (11), 775–782. doi:10.1016/j.flora.2012.09.002
Friedlingstein, P., O'Sullivan, M., Jones, M. W., Andrew, R. M., Hauck, J., Olsen, A., et al. (2020). Global Carbon Budget 2020. Earth Syst. Sci. Data 12 (4), 3269–3340. doi:10.5194/essd-12-3269-2020
Garcia, H. E., and Gordon, L. I. (1992). Oxygen Solubility in Seawater: Better Fitting Equations. Limnol. Oceanogr. 37 (6), 1307–1312. doi:10.4319/lo.1992.37.6.1307
Gastescu, P. (2013). Map of the Danube Delta Biosphere Reserve. 1:240000. Tulcea, Romania: Danube Delta Biosphere Reserve Authority DDBRA.
Greinert, J., and McGinnis, D. F. (2009). Single Bubble Dissolution Model - the Graphical User Interface SiBu-GUI. Environ. Model. Softw. 24 (8), 1012–1013. doi:10.1016/j.envsoft.2008.12.011
Groffman, P. M., Altabet, M. A., Böhlke, J. K., Butterbach-Bahl, K., David, M. B., Firestone, M. K., et al. (2006). Methods for Measuring Denitrification: Diverse Approaches to a Difficult Problem. Ecol. Appl. 16 (6), 2091–2122. doi:10.1890/1051-0761(2006)016[2091:mfmdda]2.0.co;2
Hall, R. O., Tank, J. L., Baker, M. A., Rosi-Marshall, E. J., and Hotchkiss, E. R. (2016). Metabolism, Gas Exchange, and Carbon Spiraling in Rivers. Ecosystems 19 (1), 73–86. doi:10.1007/s10021-015-9918-1
Hall, R. O., and Ulseth, A. J. (2020). Gas Exchange in Streams and Rivers. WIREs Water 7 (1), e1391. doi:10.1002/wat2.1391
Hamme, R. C., and Emerson, S. R. (2004). The Solubility of Neon, Nitrogen and Argon in Distilled Water and Seawater. Deep Sea Res. Oceanographic Res. Pap. 51 (11), 1517–1528. doi:10.1016/j.dsr.2004.06.009
Hanganu, J., Dubyna, D., Zhmud, E., Grigoras, I., Menke, U., Drost, H., et al. (2002). Vegetation of the Biosphere Reserve "Danube Delta" - with Transboundary Vegetation Map on a 1:150000 Scale. Romania, Ukraine and RIZA: Danube Delta National Institute, M.G. Kholodny - Institute of Botany & Danube Delta Biosphere ReserveThe Netherlands. RIZA rapport 2002.049, Lelystad, ISBN 9036954797.
Heaton, T. H. E., and Vogel, J. C. (1981). “Excess Air” in Groundwater. J. Hydrol. 50, 201–216. doi:10.1016/0022-1694(81)90070-6
Holgerson, M. A., and Raymond, P. A. (2016). Large Contribution to Inland Water CO2 and CH4 Emissions from Very Small Ponds. Nat. Geosci 9 (3), 222–226. doi:10.1038/ngeo2654
Horgby, Å., Canadell, M. B., Ulseth, A. J., Vennemann, T. W., and Battin, T. J. (2019). High‐Resolution Spatial Sampling Identifies Groundwater as Driver of CO 2 Dynamics in an Alpine Stream Network. J. Geophys. Res. Biogeosci. 124 (7), 1961–1976. doi:10.1029/2019JG005047
Howard, E. M., Forbrich, I., Giblin, A. E., Lott, D. E., Cahill, K. L., and Stanley, R. H. R. (2018). Using Noble Gases to Compare Parameterizations of Air‐Water Gas Exchange and to Constrain Oxygen Losses by Ebullition in a Shallow Aquatic Environment. J. Geophys. Res. Biogeosci. 123 (9), 2711–2726. doi:10.1029/2018JG004441
ICPDR (2019). [Dataset]. Danube River Basin Water Quality Database. Available at: http://www.icpdr.org/wq-db/. Accessed from 29 October, 2019.
IPCC (2021). Climate Change 2021: The Physical Science Basis. Contribution of Working Group I to the Sixth Assessment Report of the Intergovernmental Panel on Climate Change. Cambridge University Press.
Irimus, I. (2006). “The Hydrological Regime of the Danube in the Deltaic Sector,” in Danube Delta: Genesis and Biodiversity(. Editors C. Tudorancea, and M. M. Tudorancea (Leiden, Netherlands: Backhuys Publishers), 53–64.
Jonas (2021). Violin Plots for Plotting Multiple Distributions (distributionPlot.M) [Online]. Available at: https://www.mathworks.com/matlabcentral/fileexchange/23661-violin-plots-for-plotting-multiple-distributions-distributionplot-m. MATLAB Central File Exchange (Accessed January 17, 2021).
Kipfer, R., Aeschbach-Hertig, W., Peeters, F., and Stute, M. (2002). Noble Gases in Lakes and Ground Waters. Rev. Mineralogy Geochem. 47 (1), 615–700. doi:10.2138/rmg.2002.47.14
Kleinschroth, F., Winton, R. S., Calamita, E., Niggemann, F., Botter, M., Wehrli, B., et al. (2021). Living with Floating Vegetation Invasions. Ambio 50 (1), 125–137. doi:10.1007/s13280-020-01360-6
Koschorreck, M., Hentschel, I., and Boehrer, B. (2017). Oxygen Ebullition from Lakes. Geophys. Res. Lett. 44 (18), 9372–9378. doi:10.1002/2017gl074591
Langenegger, T., Vachon, D., Donis, D., and McGinnis, D. F. (2019). What the Bubble Knows: Lake Methane Dynamics Revealed by Sediment Gas Bubble Composition. Limnol Oceanogr 64 (4), 1526–1544. doi:10.1002/lno.11133
Laruelle, G. G., Dürr, H. H., Slomp, C. P., and Borges, A. V. (2010). Evaluation of Sinks and Sources of CO2 in the Global Coastal Ocean Using a Spatially-Explicit Typology of Estuaries and continental Shelves. Geophys. Res. Lett. 37 (15), L15607(1-6). doi:10.1029/2010gl043691
Lauerwald, R., Laruelle, G. G., Hartmann, J., Ciais, P., and Regnier, P. A. G. (2015). Spatial Patterns in CO2 evasion from the Global River Network. Glob. Biogeochem. Cycles 29 (5), 534–554. doi:10.1002/2014gb004941
Long, M. H., Sutherland, K., Wankel, S. D., Burdige, D. J., and Zimmerman, R. C. (2020). Ebullition of Oxygen from Seagrasses under Supersaturated Conditions. Limnol Oceanogr 65 (2), 314–324. doi:10.1002/lno.11299
Mächler, L., Peter, S., Brennwald, M. S., and Kipfer, R. (2013). Excess Air Formation as a Mechanism for Delivering Oxygen to Groundwater. Water Resour. Res. 49 (10), 6847–6856. doi:10.1002/wrcr.20547
Maier, M.-S., Teodoru, C. R., and Wehrli, B. (2021). Spatio-temporal Variations in Lateral and Atmospheric Carbon Fluxes from the Danube Delta. Biogeosciences 18 (4), 1417–1437. doi:10.5194/bg-18-1417-2021
Maier, M.-S., Teodoru, C. R., and Wehrli, B. (2020). [Dataset]. “Spatio-temporal Variations of Lateral and Atmospheric Carbon Fluxes from the Danube Delta (Dataset),” in A 2-year Dataset of Measured Concentrations and Fluxes (ETH Zurich). Available at: http://hdl.handle.net/20.500.11850/416925. doi:10.3929/ethz-b-000416925
mapcruzin (2016). Mapcruzin.com [Online]. Available at: https://mapcruzin.com/free-romania-arcgis-maps-shapefiles.htmwww.openstreetmap.org/ (Accessed 12 13, 2016).
McGinnis, D. F., Bilsley, N., Schmidt, M., Fietzek, P., Bodmer, P., Premke, K., et al. (2016). Deconstructing Methane Emissions from a Small Northern European River: Hydrodynamics and Temperature as Key Drivers. Environ. Sci. Technol. 50 (21), 11680–11687. doi:10.1021/acs.est.6b03268
McGinnis, D. F., Greinert, J., Artemov, Y., Beaubien, S., and Wüest, A. (2006). Fate of Rising Methane Bubbles in Stratified Waters: How Much Methane Reaches the Atmosphere? J. Geophys. Res. Oceans 111 (C9), C09007(1-15). doi:10.1029/2005JC003183
Natchimuthu, S., Sundgren, I., Gålfalk, M., Klemedtsson, L., Crill, P., Danielsson, Å., et al. (2016). Spatio-temporal Variability of lake CH4 Fluxes and its Influence on Annual Whole lake Emission Estimates. Limnol. Oceanogr. 61 (S1), S13–S26. doi:10.1002/lno.10222
Niculescu, S., Boissonnat, J.-B., Lardeux, C., Roberts, D., Hanganu, J., Billey, A., et al. (2020). Synergy of High-Resolution Radar and Optical Images Satellite for Identification and Mapping of Wetland Macrophytes on the Danube Delta. Remote Sensing 12 (14), 2188. doi:10.3390/rs12142188
Oosterberg, W., Staras, M., Bogdan, L., Buijse, A. D., Constantinescu, A., Coops, H., et al. (2000). Ecological Gradients in the Danube Delta Lakes: Present State and Man-Induced Changes. Lelystad: RIZA the Netherlands, Danube Delta Natinal Institute Romania and Danube Delta Biosphere Reserve Authority Romania. RIZA rapport nr. 2000.015.
Ostrofsky, M. L., and Miller, C. (2017). Photosynthetically-mediated Calcite and Phosphorus Precipitation by Submersed Aquatic Vascular Plants in Lake Pleasant, Pennsylvania. Aquat. Bot. 143, 36–40. doi:10.1016/j.aquabot.2017.09.002
Pavel, A., Durisch-Kaiser, E., Balan, S., Radan, S., Sobek, S., and Wehrli, B. (2009). Sources and Emission of Greenhouse Gases in Danube Delta Lakes. Environ. Sci. Pollut. Res. Int. 16 Suppl 1 (1), S86–S91. doi:10.1007/s11356-009-0182-9
Raymond, P. A., Hartmann, J., Lauerwald, R., Sobek, S., McDonald, C., Hoover, M., et al. (2013). Global Carbon Dioxide Emissions from Inland Waters. Nature 503 (7476), 355–359. doi:10.1038/nature12760
Regnier, P., Friedlingstein, P., Ciais, P., Mackenzie, F. T., Gruber, N., Janssens, I. A., et al. (2013). Anthropogenic Perturbation of the Carbon Fluxes from Land to Ocean. Nat. Geosci 6, 597–607. doi:10.1038/ngeo1830
Sachs, N. M. (2019). The Paris Agreement in the 2020s: Breakdown or Breakup. Ecol. LQ 46, 865. doi:10.15779/Z38H708140
Sorrell, B. K., and Brix, H. (2013). “Gas Transport and Exchange through Wetland Plant Aerenchyma,” in Methods in Biogeochemistry of Wetlands. Editors R. DeLaune, K. Reddy, C. Richardson, and J. Megonigal (Madison WI: Soil Science Society of America), 177–196.
Staehr, P. A., Testa, J. M., Kemp, W. M., Cole, J. J., Sand-Jensen, K., and Smith, S. V. (2012). The Metabolism of Aquatic Ecosystems: History, Applications, and Future Challenges. Aquat. Sci. 74 (1), 15–29. doi:10.1007/s00027-011-0199-2
Stanley, E. H., Casson, N. J., Christel, S. T., Crawford, J. T., Loken, L. C., and Oliver, S. K. (2016). The Ecology of Methane in Streams and Rivers: Patterns, Controls, and Global Significance. Ecol. Monogr. 86 (2), 146–171. doi:10.1890/15-1027
Tortell, P. D., Bittig, H. C., Körtzinger, A., Jones, E. M., and Hoppema, M. (2015). Biological and Physical Controls on N2, O2, and CO2distributions in Contrasting Southern Ocean Surface Waters. Glob. Biogeochem. Cycles 29 (7), 994–1013. doi:10.1002/2014GB004975
Ulseth, A. J., Hall, R. O., Boix Canadell, M., Madinger, H. L., Niayifar, A., and Battin, T. J. (2019). Distinct Air-Water Gas Exchange Regimes in Low- and High-Energy Streams. Nat. Geosci. 12 (4), 259–263. doi:10.1038/s41561-019-0324-8
UNEP-WCMC (UN Environment Programme World Conservation Monitoring Centre) (2021). World Heritage Datasheet - Danube Delta [Online]. Available at: http://world-heritage-datasheets.unep-wcmc.org/datasheet/output/site/danube-delta/ (Accessed 07 27, 2021).
UNESCO (2021). Ecological Sciences for Sustainable Development. Danube Delta. [Online]. Available at: http://www.unesco.org/new/en/natural-sciences/environment/ecological-sciences/biosphere-reserves/europe-north-america/romaniaukraine/danube-delta/ (Accessed 07 26, 2021).
Weiss, R. F. (1974). Carbon Dioxide in Water and Seawater: the Solubility of a Non-ideal Gas. Mar. Chem. 2 (3), 203–215. doi:10.1016/0304-4203(74)90015-2
Weiss, R. F. (1971). Solubility of Helium and Neon in Water and Seawater. J. Chem. Eng. Data 16 (2), 235–241. doi:10.1021/je60049a019
Wiesenburg, D. A., and Guinasso, N. L. (1979). Equilibrium Solubilities of Methane, Carbon Monoxide, and Hydrogen in Water and Sea Water. J. Chem. Eng. Data 24 (4), 356–360. doi:10.1021/je60083a006
Keywords: carbon cycle, greenhouse gases, noble gases, plant-mediated gas transfer, ebullition, excess air, Danube Delta, membrane-inlet mass spectrometry
Citation: Maier M-S, Canning AR, Brennwald MS, Teodoru CR and Wehrli B (2022) Spatial Mapping of Dissolved Gases in the Danube Delta Reveals Intense Plant-Mediated Gas Transfer. Front. Environ. Sci. 10:838126. doi: 10.3389/fenvs.2022.838126
Received: 17 December 2021; Accepted: 14 March 2022;
Published: 31 March 2022.
Edited by:
Yves T. Prairie, Université du Québec à Montréal, CanadaReviewed by:
Patrick Höhener, Aix Marseille Université, FranceNúria Catalán, UMR8212 Laboratoire des Sciences du Climat et de l’Environnement (LSCE), France
Copyright © 2022 Maier, Canning, Brennwald, Teodoru and Wehrli. This is an open-access article distributed under the terms of the Creative Commons Attribution License (CC BY). The use, distribution or reproduction in other forums is permitted, provided the original author(s) and the copyright owner(s) are credited and that the original publication in this journal is cited, in accordance with accepted academic practice. No use, distribution or reproduction is permitted which does not comply with these terms.
*Correspondence: Marie-Sophie Maier, bWFyaWUtc29waGllLm1haWVyQHVzeXMuZXRoei5jaA==