 Saeed Moghayer1*
 Monika Zurek2
 Maliha Muzammil3
 Daniel Mason-D’Croz4
 John Magrath5Andrzej Tabeau1
 Joost Mattheus Vervoort6
 Thom Achterbosch1
- 1Wageningen Economic Research, Wageningen University & Research, Wageningen, Netherlands
- 2Environmental Change Institute, University of Oxford, Oxford, United Kingdom
- 3United Nations Development Program (UNDP), Dhaka, Bangladesh
- 4Department of Global Development, Cornell University, Ithaca, NY, United States
- 5OXFAM GB, Oxford, United Kingdom
- 6Environmental Governance Group, Copernicus Institute of Sustainable Development, Utrecht University, Wageningen, Netherlands
Feeding and nourishing a growing global population in Bangladesh is a major challenge in a changing climate. A multi-level participatory scenario approach with corresponding modeling and decision support tools is developed and applied to support decision-makers in developing scenario-guided enabling policy for food security in the future under climate change. The results presented in this paper show how, under different scenarios, the agri-food system may transform in the next decade as a result of the interaction of intertwined institutional, technological, and market drivers in Bangladesh. For scenario building, the food and agriculture community was brought together with the climate and energy community. We also experimented with different ways to bring voices that are often less included in policymaking, such as poor rural communities and youth. The scenario quantification is performed by MAGNET, a GTAP-based multi-sector and multi-region computable general equilibrium model. The simulation results depict a comprehensive picture of corresponding and varied pressures on agricultural resources and opportunities for economic development and trade in Bangladesh. Finally, we did an ex-ante assessment of the trade-offs and synergies between zero-hunger- and zero-emission-related targets within the Bangladesh Sustainable Development Goals (SDGs) under the developed scenarios.
1 Introduction
Feeding and nourishing a growing global population is a major challenge, which will be further complicated by a changing climate (Yu et al., 2010; IPCC, 2021). Access to sufficient safe and nutritious food is far from universal. Inequality in the food system can be observed throughout, with unequal distribution of production and access to high-quality diets, leading to the so-called “triple burden of malnutrition” (Global Nutrition Report, 2020). At the same time, achieving the temperature target agreed upon in the Paris Agreement and the Sustainable Development Goal (SDG) 13 (Climate Action) will require substantial changes to societies everywhere. Food systems will play a new role in climate adaptation and mitigation efforts, as today, they account for between a fifth and more than a third of anthropogenic emissions (Rosenzweig et al., 2020; Crippa et al., 2021). Bringing together these key societal goals requires extensive changes, and depending on the chosen development pathways, there will be difficult trade-offs and potential co-benefits between the different objectives. Decision-making can often be highly technical and top-down, omitting sections of society, especially the poorest. Implementing change in food systems and for climate change mitigation is hampered by skewed power relationships and vested interests (Zurek et al., 2022). Food systems, which also provide the livelihood for the majority of the world’s poor, are right at the intersection of hunger, poverty, environmental goals, and underpin resilient societies. Inevitably, there will be trade-offs between alternative pathways to achieving the zero-hunger (SDG 2) and zero-emissions (SDG 13) goals (Pradhan et al., 2017; Valin et al., 2021). These can be exacerbated if planning for one goal (e.g., zero hunger) without considering the implications of other goals (e.g., zero emissions). However, there will be opportunities for co-benefits if policies are designed based on various stakeholder perspectives and needs that span both goals. Therefore, the development of participatory scenarios or plausible futures can be helpful as this process can bring scientific and stakeholder communities together to guide such choices (Carlsson-Kanyamam et al., 2008; Henrichs et al., 2010; Kok et al., 2015; Vervoort and Gupta 2018).
Bangladesh is resource-poor and one of the most vulnerable countries to the impacts of climate change (Banerjee et al., 2015; Aryal et al., 2020a; Aryal et al., 2020b; Eckstein et al., 2020; University of Notre Dame, 2021; WMO, 2021). Inequality in the food system can be observed, with unequal distribution of production and access to high-quality diets (FAO-IFAD-UNICEF-WFP-WHO, 2018; Reggers, 2019). Across South Asia, the temperature has been increasing at a rate of 0.14°C–0.20°C per decade since the 1960s, coupled with a rising number of hot days and warm nights (IPCC, 2021). In this region, a likely increase in the annual mean temperature of 2.1°C–2.6°C is estimated to increase the heat-stressed area by 21% in 2050 (Tesfaye et al., 2017). Most projections of the general circulation models (GCMs) and the special report on emission scenarios (SRES) show that higher temperatures will lead to lower rice yields as a result of shorter growing periods (IPCC, 2021). This will contribute to greater fluctuations in crop production and food availability in Bangladesh. Moreover, food prices by 2050 are projected to be 2.5 times higher compared to 2000 for major food crops (e.g., rice, wheat, maize, and soybean) due to climate change (Nelson et al., 2009). In the absence of adaptation plans, rising market prices and economic losses from climate impacts will reduce the purchasing power of lower-income households, even in a fast-growing country such as Bangladesh (Wang et al., 2017). These impacts will be even more severe for smallholder farmers in Bangladesh because of poor infrastructure, limited access to global markets, low productivity, and lack of access to formal safety nets (Aryal et al., 2020a).
Although the agriculture sector is one of the most impacted by climate change, it is the leading contributor to Bangladesh’s GHG emissions (WRI, 2022). The government of Bangladesh (GoB) has ratified many international agreements to reduce emissions and mainstream renewable energy sources. However, expediting economic growth, access to energy, and ending food insecurity and poverty have had to be prioritized. In the current nationally determined contributions (NDC), Bangladesh’s mitigation contribution only covers the power, transport, and industry sectors, so the GoB is not using the many opportunities for reducing GHG emissions through mitigation and other low-carbon, climate-resilient development opportunities that exist for the agriculture sector. Furthermore, in Bangladesh, there exists a disconnect in the debate across the food security, poverty, and climate change communities due to various political-economic factors that play a significant role in policymaking and implementation (UNFCC, 2021).
Bangladesh has made substantial progress toward reducing hunger and improving the well-being of its growing population over the past several decades, as evidenced by its Global Hunger Index falling from 36.1 (alarming) to 25.8 (serious) (Grebmer et al., 2019) and halving of poverty rates. However, progress along these metrics has begun to slow in part due to increased flooding. Reflecting low incomes, rice continues to provide two-thirds of calories, with 15% of the population having insufficient access to calories, and insufficient dietary diversity continues to be a concern (Welthungerhilfe and Concern Worldwide, 2018). However, food and nutrition security is increasingly threatened by more frequent and severe extreme climate events. Supply shocks caused by the global pandemic and the war in Ukraine further show the high degree of fragility of the agri-food system with subsequent effects on food security. COVID-19 led to an unprecedented global breakdown of trade, transport, and face-to-face human interactions. Food systems were affected by disrupted supply chains, mobility restrictions, and loss of income. Although much remains uncertain, the economic contraction due to the global pandemic is projected to increase extreme poverty and the prevalence of undernutrition in developing countries such as Bangladesh by 20% (Laborde, Martin, and Vos, 2020) and 19%, respectively (FAO, IFAD UNICEF, WFP, and WHO, 2020). The pandemic has impacted food security in several ways. The main driver has been the loss of income and reduced purchasing power and access to food. The Bangladeshi garment sector, for example, which accounts for 80% of Bangladesh’s export earnings (IFC, 2019), was severely disrupted by lockdown measures. Secondarily, food security has been impacted by mobility restrictions that have limited the functioning of food outlets, such as markets, further disrupting the supply of nutrient-rich but perishable foods (Laborde et al., 2020).
The most recent report on the “State of Food Security and Nutrition in the World” (FAO, IFAD UNICEF, WFP, and WHO, 2020) shows that raising the consumer price during the pandemic has made a healthy diet unaffordable for an additional 112 million people around the world. This estimate will be much higher if we account for the income loss during the pandemic and further the impact of the disruption in supply chains and the increase in fertilizers and energy prices due to the war in Ukraine. The pandemic mitigation measures hit the poor disproportionally, who relied more on physical labor, lacked options for remote work, and shifted food expenditure, comprising a large share of total expenditure, toward staples to meet caloric needs (Swinnen and McDermott 2020), potentially sacrificing long-run health.
This study was undertaken as part of the UK GCRF/Foreign, Commonwealth & Development Office (FCDO)-funded project “Zero Hunger-Zero Emissions” and aimed to support national and regional decision-makers in Bangladesh to develop scenario-guided policy and investment planning relevant to food security and climate change. Therefore, we analyzed together with stakeholders four scenarios on how food systems in Bangladesh may transform by 2050, based on different assumptions on changes to governance systems, as well as attitudes to dealing with climate and environmental change, and what these changes might mean for the food system and climate outcomes. To do this, we worked to develop and apply a participatory approach with corresponding modeling tools to create scenarios and analyze their implications. The study used the plausible futures/scenario approach to bring different stakeholder communities, which often do not talk together. Focusing on SDG 2 (zero hunger) and 13 (climate action), this brought the food and agriculture community together with the climate and energy community to discuss how to ensure food security in a world threatened by dangerous levels of climate change while at the same time making drastic cuts in greenhouse gas emissions. The project also experimented with different ways to make the process equitable and include perspectives that are often less heard in policymaking and technical debates, such as from poor rural communities or students and youth groups. The project was able to bring these different perspectives into a debate, thus testing the effectiveness of this technique. The project ensured dialogue on some contentious issues, such as the controversial debate on the need for low-carbon development from a developing country perspective and the role of food systems for this, especially as food security is the key political goal in Bangladesh. For this, the project developed four qualitative scenarios with stakeholders and quantified their implications by modeling a set of variables of interest, such as food security levels or GHG emissions from the agricultural sector up to 2050. The qualitative scenarios were also analyzed and presented to policymakers at the Planning Commission to integrate their views to identify and build consensus around the alternative pathways for achieving the zero-hunger/zero-emission goals by supporting the successful implementation of policies in a range of national contexts.
This paper presents the qualitative scenarios developed with stakeholders in Bangladesh and their quantification using the MAGNET model developed by Wageningen University. It discusses the methods used and the results of the quantification work with respect to achieving food security (SDG 2) and climate action goals (SDG 13) by 2050 and potential synergies and trade-offs of the different development pathways. In light of the economic impact of the COVID-19 pandemic being largely sector-specific and short-term in nature, we did not include the impact of the COVID-19 outbreak in our projections. MAGNET, like many other CGE models, is specifically parametrized to assess long-term impacts. The focus of the CGE models which have been used to assess the macro-economic consequences of the COVID-19 outbreak has so far been limited to the macro-level, with McKibben and Fernando (2020) estimating population and GDP effects and Maliszewska et al. (2020) assessing the impact on GDP and trade. In order to account for short-term disruptions in food security, there is a need for more research and new parameterization of the model, such as new estimation of elasticities of substitution in certain parts of the model to reflect the expected short-term nature of the pandemic.
The next section describes the data and methods used in this study. Section 3 describes the scenario narratives and their quantification, including the description of the four global contextual scenarios which are used to link Bangladesh-specific scenarios to the IPCC-based global Shared Socioeconomic Pathways (SSPs). Section 4 analyzes the results of the scenario quantifications and projections, focusing on the main outcome of each of the four pathways in terms of a set of sustainability indicators and analyzes the trade-off and synergies between SDG 2 and SDG 13. Section 5 presents a conclusion.
2 Data and methods
There are various methods for looking into the future. In this paper, we used a qualitative–quantitative scenario approach in developing a set of scenarios for the future of the Bangladeshi food system and analyzed their implications. This section describes the basic methods we employed.
2.1 Development of qualitative scenarios for Bangladesh
For the development of scenarios, 20 Bangladeshi experts involved in the food or energy sector were interviewed in detail, followed by two workshops in which the participatory scenarios were built. The interviews revealed different perspectives on Bangladesh’s future. However, food security was seen as the country’s number one priority. A key finding was the lack of interaction between the existing agriculture and climate change/energy sectors in the country, which would have to work together in the future to address both the food security and climate change goals of the country.
In the two workshops with stakeholders from government and private sectors, academia, and NGOs, the project facilitated the development of four qualitative scenarios describing alternative future Bangladeshi food systems (for the specific methodology, see Henrichs et al., 2010). Figure 1 describes how the scenario work is framed in this study and the basic steps of the scenario development process. At the start of the scenario-building process, the participants were asked to identify the factors and issues driving change in Bangladesh and its food system. After the collation of the identified drivers, they were organized by category, and the participants were asked to vote for the main drivers of change in terms of their importance but also with respect to the uncertainty about their direction in the future. Thus, two drivers that were seen as both highly influential but also uncertain were identified: governance (inclusive or top-down) and the attitude toward dealing with environmental change (reactive or proactive). This led to four scenarios with different combinations of these drivers. The participants were split into four groups and asked to describe how Bangladesh and its food system might look like in 2041 with either inclusive or top-down governance and reactive or proactive environmental management. Different combinations of governance and environmental management options were identified: a Bangladesh with inclusive governance but bad/reactive environmental management; a country with proactive environmental management and top-down governance; a country with inclusive governance and proactive environmental management; and a Bangladesh with both top-down governance and reactive environmental management. After groups presented their depictions, they were tasked with determining the sequence of events from today that would lead to their imagined world to test the plausibility of the described end states of each scenario, thus developing a set of stories about how the future could unfold. This last step also included choosing two or three drivers from the list developed before and describing their status in the proposed future scenario to give more nuance and context to the developed scenarios. Thus, participants sketched out four plausible futures that might describe Bangladesh and its food system in 2041.
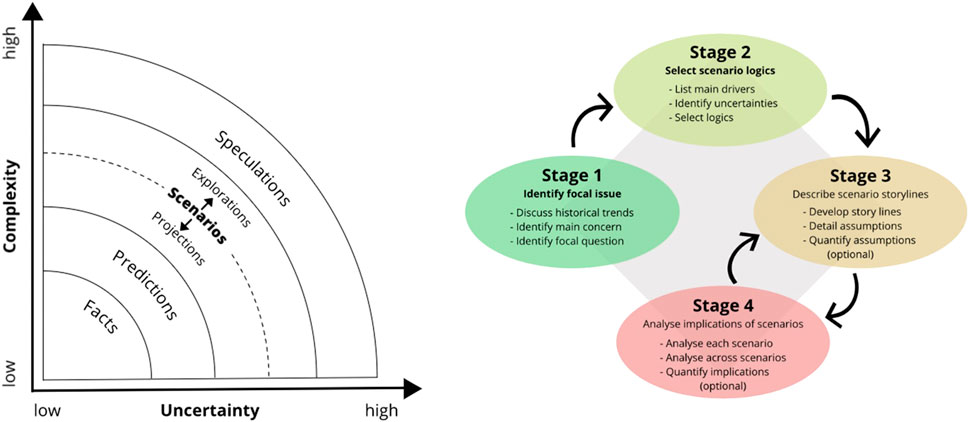
FIGURE 1. Describing how scenario work is framed in the study and which basic steps of the scenario development process were used.
These scenarios were developed further over the following months and shared with rural communities, youth groups, and students for their reactions. The results of their deliberations were brought into the second workshop to help refine the scenarios. The final step of the qualitative scenario-building process was then a discussion of the implications of the different scenarios for various food security and climate change variables (e.g., in which scenario did people have higher levels of food security and in which scenario could the food system contribute more to a low-carbon future) and groups of society. Additional analysis variables included inequality, gender justice, and the potential trade-offs between food security and climate mitigation outcomes.
Looking across the different futures or scenarios allowed for a comparison of the implications of these futures for different groups in society and the environment, revealing important issues that decision-makers need to be aware of concerning future change. These deliberations were also shared in a third workshop with the Bangladeshi Planning Commission, which highlighted key challenges in the food system, including changing behavior, habits, and attitudes to food and how far people are willing—or able—to diversify to healthier diets, reduce consumption of highly sweetened foods, if possible, reduce the overuse of chemical inputs in agriculture, and reduce greenhouse gas emissions from the expanding beef and dairy sectors. Participants reflected that changing patterns in farming, such as male migration and the feminization of the rural workforce, presented challenges and opportunities for positive changes and “doing farming differently” and better via support for small-scale, often women, farmers with advice and credit, appropriate technologies, community enterprises, and co-operatives. Proper land-use planning and management are crucial too. For the energy sector, adopting new technology was identified as critical. However, it will need to be complemented by changing mindsets such that fossil-fuel-based energy models do not continue being the default option. Young people especially pressed for open discussion of ideas, wider engagement, and constructive questioning and urged stakeholders not to play blame games or delegate responsibilities.
The qualitative scenarios were then used to quantify input assumptions for the model.
2.1.1 The model
For the quantification of the pathways and scenarios, the agri-food tailored macro-economic model MAGNET (Woltjer et al., 2014) was used. The MAGNET model is a multi-regional, multi-sectoral, applied general equilibrium model based on neo-classical microeconomic theory (Nowicki et al., 2009, Woltjer et al., 2014; Van Meijl et al., 2018; Van Meijl et al., 2020a). The MAGNET database is built on the GTAP dataset (Aguiar et al., 2016). MAGNET assumes perfect competition, and producers are assumed to choose the cheapest combination of imperfectly substitutable labor, capital, land, natural resources, and intermediates. The core of MAGNET is an input–output (IO) model, which links industries in value-added chains from primary goods, over continuously higher stages of intermediate processing, with the final assembly of goods and services for consumption. MAGNET focuses on modeling agri-food markets and assumes that products traded internationally are differentiated by country of origin (Armington, 1969).
2.2 The model database and the improvement of household food expenditure data
The MAGNET database used in this study is an extension of the GTAP database V10, with 2014 as the reference year (Aguiar, Narayanan, and McDougall, 2016)1. In the construction of the GTAP database, not all data are available for each reference year, and therefore, an updating procedure suitable for generic application across all countries of the world is applied. However, data availability and data quality are always a concern in the construction of complex datasets for models. To this end, a previously developed updating procedure could be used to incorporate new information from our review of alternative Bangladeshi statistics. This is particularly relevant for Bangladesh, given that the input–output (IO) tables are relatively old, dating back to 1994, with the aforementioned GTAP generic updating of the tables to reflect changes in macro-trends in the 20 years between 1994 and the base year of MAGNET, which may miss structural and compositional changes in Bangladeshi expenditure patterns. This is because Bangladesh is not part of the production targeting procedure; the composition of private expenditures will only be affected by changes in trade, while it is confirmed that the total expenditure level is in line with the GDP of the GTAP year.
As the influence of changes in trade on consumption patterns is likely to be limited, the original IO expenditure structure will likely persist during updates of the GTAP dataset. This raises concerns given the 20-year gap between the most recent Bangladeshi IO data and the GTAP data used in MAGNET, which is particularly of concern due to the rapid increases in per capita income during this period, with GDP per capita (in constant 2010 US $) increasing by 84% from 433$ to 797$ or from 1.19 to 2.18 dollars per person a day. Given the solid evidence of Engel’s law (Clements et al., 2017), changes in food expenditures beyond those captured by the GTAP database are expected.
To tackle the aforementioned issue, we used data from Waid et al. (2017), which describe changes in food expenditures for Bangladesh based on a consolidated set of nationally representative household surveys, which has been used in several studies for modeling the subnational level food security of Bangladesh (Waid et al., 2018; Hossain et al., 2019; Brown et al., 2021). All data in GTAP are expressed in dollar values and not physical quantities. These changes in value shares of key food groups over time give an insight into how we may need to adjust the MAGNET expenditure data. The data coverage is close to our 1994 IO reference year (1995) and 2011 GTAP reference year (2014). Although data from Waid et al. (2017) are presented in primary agricultural commodities, the underlying household survey data include composite dishes (or processed foods). These are converted to primary product content. Therefore, these data do not provide guidance on the developments in processed food.
Broad developments from 1995 to 2010 are in line with the cross-sectional patterns of food budget shares moving from low- to high-income groups (Clements et al., 2017): (1) decline in the budget of bread and cereals (starches); (2) increase in meat and seafood; and (3) small increase in dairy. However, the only evident difference is for fruits and vegetables, which increased slightly in Bangladesh (from 9.6% in 1985 to 11.0% of food expenditure), whereas the cross-sectional data show a declining expenditure share for higher-income groups. The budget share of fish in Bangladesh seems relatively high (12.3% in 1985, growing to 14.6% in 2010). Shares in the cross-sectional data for the lowest income quartile countries are 8.8% of food expenditures (these data refer to 2011). In contrast, meat expenditures grow from 5% to 8.8%, below the cross-sectional average for the lowest income quartile (13.2%). Thus, while the increasing trend in meat and fish expenditures is in line with the globally observed pattern, fish plays a more important role in the Bangladeshi diet compared to other countries at a comparable income level. Given the lack of information on processed and other foods in Waid et al. (2017) and at least rough alignment with the cross-sectional pattern in Clements et al. (2017), we used the latter as a reference when approximating changes in the MAGNET expenditure shares not covered by the household surveys. This is especially relevant from the perspective of food versus other non-food expenditures. Categories are also included in Clements et al. (2017).
Based on the previous analysis, we updated the base year data of the model using cross-entropy (CE), an approach based on information theory (Golan, 2007), which allows us to take varied sources of information (CGE model results, national accounts, socioeconomic projections, household survey data, and expert opinion), and reconcile them while minimizing the deviation from original datasets, and thereby allowing us to capture disaggregated household results, with respect to national totals and distribution of observed outcomes at the household level. This approach has been implemented in various settings to help reconcile economic datasets and assumptions for general and partial equilibrium models (Golan, Perloff, and Shen, 2001; Robinson, Cattaneo, and El-Said, 2001). It has also been used to disaggregate national accounts using household survey data in a process similar to our own initial micro-analysis (Robilliard and Robinson, 2003). The data sources and the main variable used for the scenario modeling and simulation are presented in Table 1.
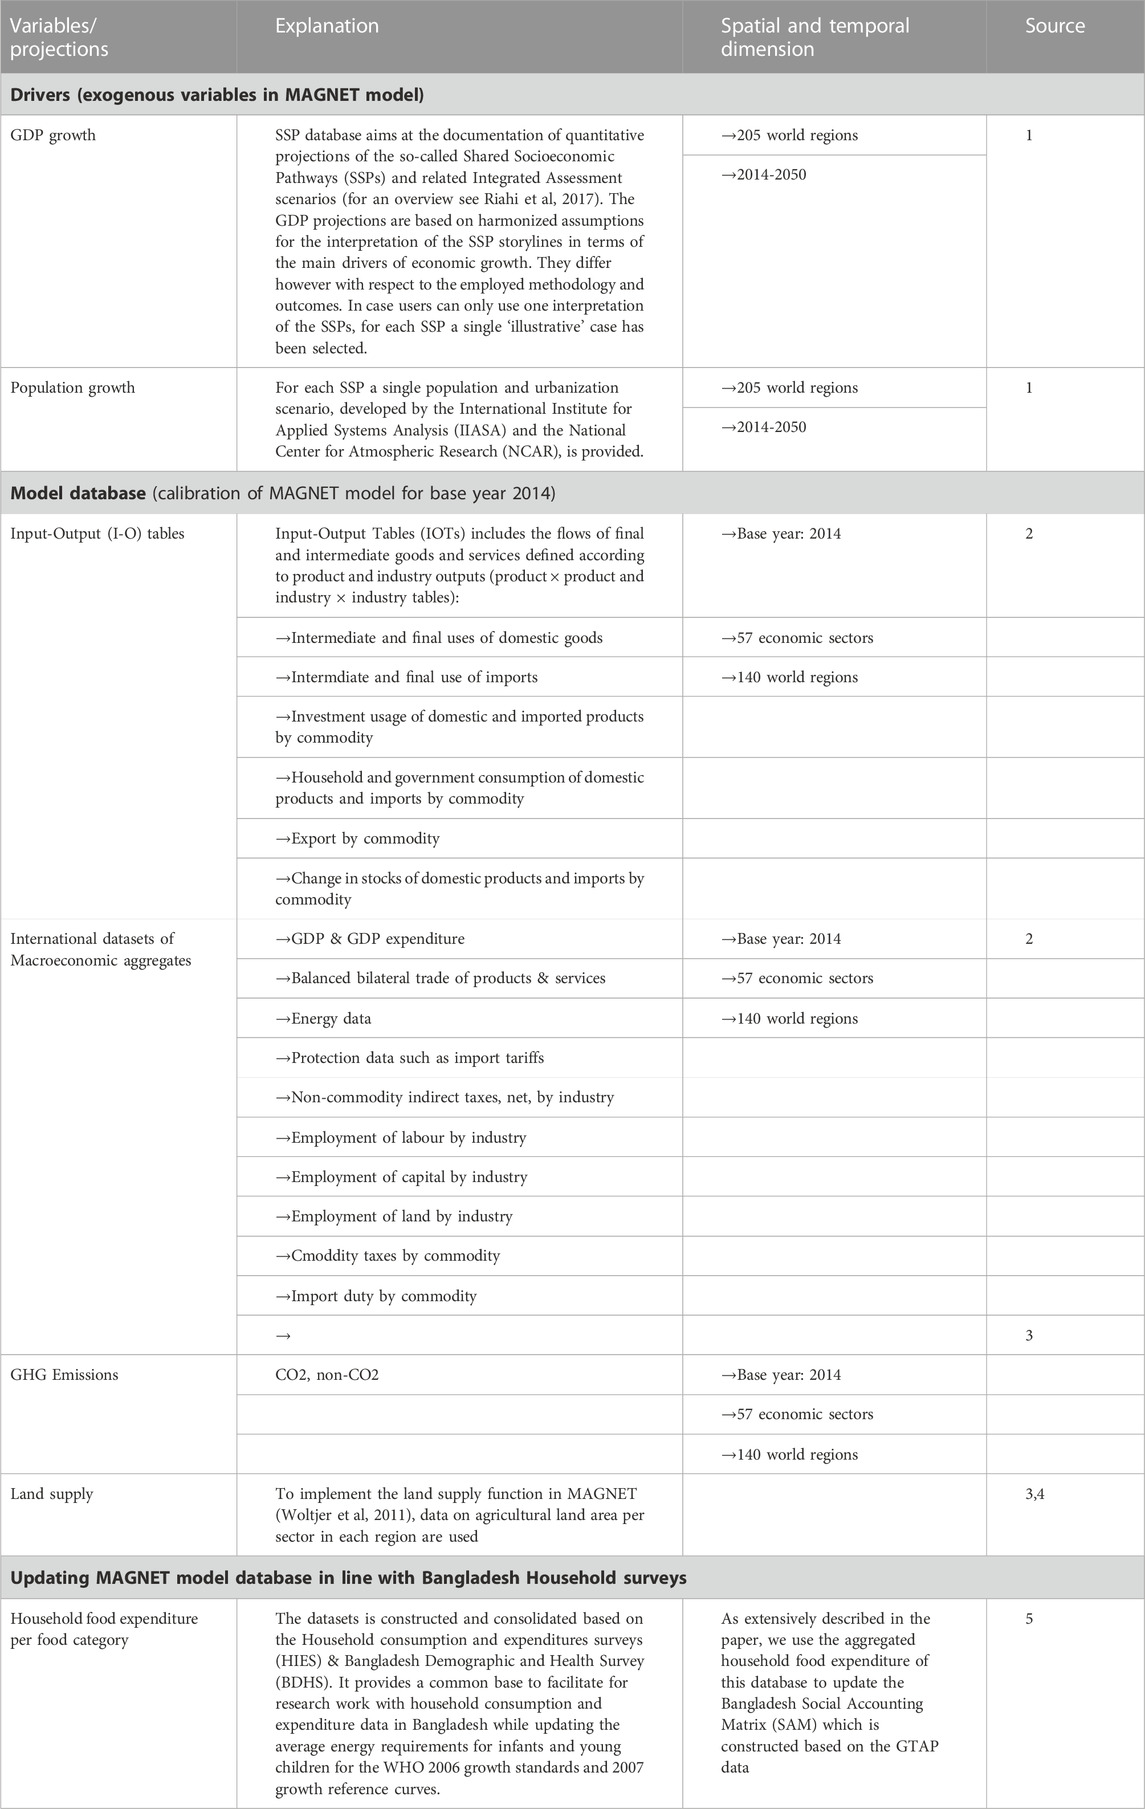
TABLE 1. Sources listed in column S refer to: 1 = SSP database (the datasets can be found here: https://tntcat.iiasa.ac.at/SspDb/dsd?Action=htmlpage&page=about# ; for an overview see Riahi et al, 2017 ); 2 = GTAP database (https://www.gtap.agecon.purdu).
3 The scenario narratives and simulation setup
3.1 Scenario narratives
As described in Section 2, the study developed scenarios in two workshops, using two scenario axes that describe four possible combinations or scenarios of the two main driving forces selected by workshop participants (see Figure 2). These combinations of the two drivers now constituted the basis for the so-called “scenario storylines.” The two key drivers identified by the stakeholders were the type of environmental management that Bangladeshi decision-makers would adopt in the future (proactive vs. reactive mindsets) to address environmental problems and the type of governance system that would prevail in Bangladesh (decentralized, inclusive, and transparent vs. top-down and authoritarian).
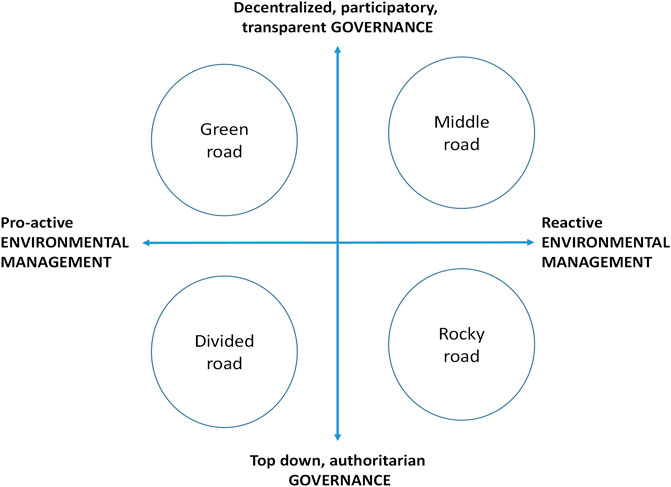
FIGURE 2. Scenario framework: either more decentralized, participatory, and transparent or more top-down and authoritarian.
3.1.1 The Divided Road
Bangladesh takes a Divided Road. A new government comes to power that promises to “clean up” society and the environment. Run by a strong man, it establishes a digitally controlled authoritarian system. Investment flows in from China as part of the Belt and Road initiative. Greater inequality is accepted. In some ways, the government is more effective; it creates a better economy and environment for some, but life is worse for many. The winners are the digitally savvy middle class, many of whom live in the high-tech new capital of Mymensingh. The majority of people, however, are deemed to be “anti-social” or “bad citizens.” The government encourages agri-business and high-tech farming, which saves water and chemical inputs but needs little labor. Much food is grown for export to China. The environment is healthier for the better off, and there is a big boost in renewable energy. However, the promise to “clean up” environmental and social problems is a policy to “clean away” poor neighborhoods, so they are no longer so visible.
3.1.2 The Middle Road
In taking a Middle Road, historical trends continue. There are few radical departures from current policies and practices. Governance, inclusivity, and environmental focus and management are patchy. Despite good policies on paper, practice and implementation leave much to be desired. In theory, the Sustainable Development Goals unify policy. However, in practice, conventional economic growth takes priority. Despite a big expansion in solar power, the country is locked into coal. Coal power generation in the Sundarbans is a big factor explaining the collapse of the ecosystem there. The government strives to mitigate the impacts of disasters, but accelerating climate change is eroding the government’s capacity to get ahead of the problems. Young people continue to drift to the cities, and farming becomes increasingly feminized.
3.1.3 The Green Road
Bangladesh treads a Green Road. Despite their quarrels, all political parties agree to have the Sustainable Development Goals as their guiding vision. Good governance, a more inclusive society, and a healthy environment are priorities. The government motto is “leave no one behind.” “Digital Bangladesh” is a great enabler of good and effective governance. There are great efforts to boost agroecology and green energy and implement land reform and labor rights to boost health, education, and nutrition. As a climate leader, Bangladesh is a major recipient of money from the Green Climate Fund. However, there are still many problems. There is heavy pressure to continue to use artificial fertilizers and pesticides, agroecology runs up against land shortages, and creating a more inclusive government is slow and difficult and faces resistance. The legacy of environmental degradation proves hard to reverse in the short-term.
3.1.4 The Rocky Road
Climate breakdown, environmental decay, and political in-fighting set Bangladesh down a Rocky Road. Government is weak and erratic. Much of the economy is criminalized by being infiltrated by Yaba money. Parts of the country pretty much run themselves—some better than others. Whether a citizen lives well or badly depends on where they live, their connections with the powerful, and how rich they are, as they can buy services and security. Belonging to a particular family or community can, in some parts of the country, buffer some of the difficulties, so the standard of living is quite varied across the country. Agricultural production falters, the industry cannot modernize, air and water pollution worsens, inequality increases, and severe hunger returns. As even more men migrate to survive, women are left behind to face the dual burdens of care and work. Farming is increasingly feminized, but women are vulnerable to violence from rascals trying to grab land.
3.2 Simulation setup
The scenarios were quantified using the agri-food tailored macro-economic model MAGNET (Woltjer et al., 2014). By using the socioeconomic assumptions from the scenario narratives, all the scenarios were ranked with respect to a baseline. These rankings were taken as inputs for the MAGNET model. The model was able to provide us with a range of different output variables which we could choose from. In the development of the quantified scenarios, we identified two levels of influence: the level of global socioeconomic development (contextual scenarios) and the level of the four scenarios for Bangladesh, which were developed in this study and outlined in detail in the previous section.
The contextual baseline scenario is constructed based on several assumptions, as set out in the following. It is assumed that the baseline follows a middle-of-the-road shared socioeconomic pathway (SSP2) up to 2050, meaning that the world economy as a whole is expected to face moderate social and economic challenges over the coming decades, as suggested by the assumed GDP and population growth rates. The narratives of the SSP scenarios can be found in detail in O’Neill et al. (2016). Table 2 summarizes the SSP scenario narratives and assumptions.
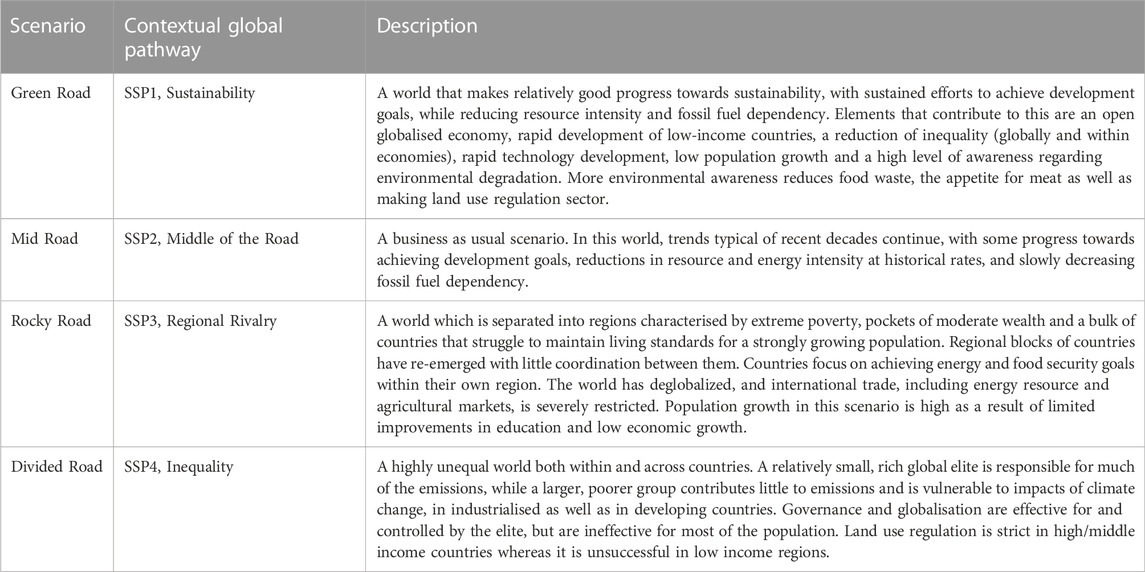
TABLE 2. Shared socio-economic pathway (SSP) scenario description, for more details, see Riahi et al. (2016).
The scenario is implemented in MAGNET and quantified. Table 3 shows the main scenario-specific characteristics for macro-economic development and specific land-use components (for more details, see Doelman et al., 2017).
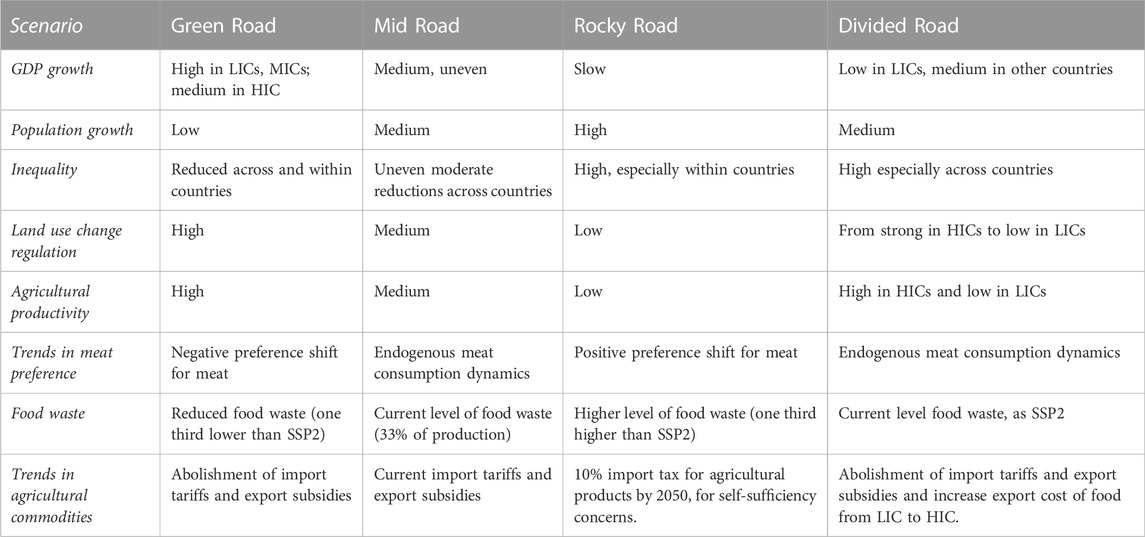
TABLE 3. Scenario-specific characteristics for macro-economic development in agri-food sector and specific land-use components (for more details, see Doelman et al. 2017). Notation: LIC: ‘Low Income Country’; HIC: ‘High Income Country’.
4 Results
4.1 Drivers
On the basis of the aforementioned scenarios and how Bangladesh may develop in the global context in the long-term, the following key contextual scenario projections are inferred from the SSP scenarios linked to the Bangladesh-specific scenario.
4.1.1 Population and GDP
In SSP scenario narratives, population and economic developments strongly impact the ability of societies to anticipate mitigation and adaptation challenges. For example, a larger, poorer population will face more difficulties adapting to the effects of climate change. In SSP2, the global population will grow to 9.4 billion people by 2070 and slowly decline thereafter (KC and Lutz, 2015). GDP follows regional historical trends and grows by a factor of 6 in SSP2 by the end of the century, with the global GDP/capita reaching about 60 (thousand year-2005 USD/capita, purchasing-power-parity—PPP) (Dellink et al., 2015). The SSP2 income projection is situated in between the estimates for SSP1 and SSP3, which reach global average income levels of 82 and 22 (thousand year-2005 USD/capita PPP) by 2100.
For Bangladesh, the assumed population growth trajectory in all four scenarios is presented in Figure 3. In all four scenarios, the population in Bangladesh is expected to increase. In Rocky Road (SSP3), Bangladesh is expected to have a much larger population in 2050 compared to other scenarios. In Rocky Road and Middle Road, Bangladesh assumes a consistent increase in population, with the fastest growth projected during the 2030–2050 period. In contrast, the Green and Divided Roads show a slowdown in population during this time period. In the case of Green Road, this slowdown is in line with a general expectation that population growth would ease as economic growth picks up, as shown in Figure 4. This clearly should be understood in a relative sense.
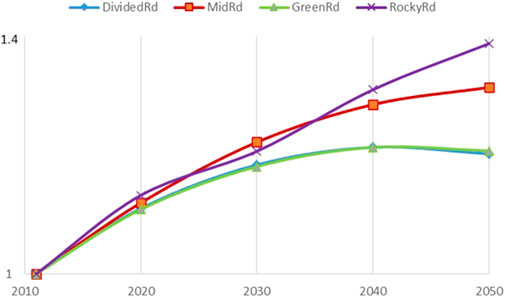
FIGURE 3. Population growth index in algorithmic scale (2011 = 1).
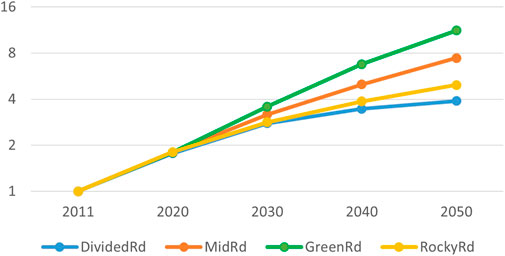
FIGURE 4. GDP PPP growth index in algorithmic scale (2011 = 1).
As shown in Figure 4, the assumed GDP growth rates across all four scenarios are expected to increase in the period 2011–2050, although the growth trajectory varies across the four scenarios and over time, where Bangladesh is expected to see faster GDP growth during 2030–2040 followed by a gradual slowdown. This is in contrast with the Divide Road, in which Bangladesh will be experiencing a gradual slowdown in GDP growth throughout the two projected decades.
4.1.2 Land productivity
Changes in land productivity in the model comprise exogenous and endogenous components. Endogenous changes in land productivity are primarily driven by changing prices in the model, as these would cause the reallocation of economic resources and reshuffling of land-based activities, resulting in changes in land productivity. Exogenous factors reflect assumptions on overall technical progress (e.g., fertilizer application and irrigation) and improvements in land management. Exogenous changes in land productivity are expected to be overall positive in all the scenarios. Land productivity in Bangladesh, in general, shows a slowing growth over the projection periods based on estimates from the IMAGE model (Stehfest et al., 2014). In general, the changes in the ratio are negative in all the regions, reflective of contractive trends in agricultural land supply over the long-term.
4.1.3 Labor, capital, and natural resources
Supplies of labor, capital, and natural resources in Bangladesh are exogenously given in the model. The supply of labor, including skilled and unskilled labor, is assumed to follow population growth trajectories, whereas the supply of capital is assumed to follow the growth of GDP. Moreover, the supply of natural resources is assumed to take a quarter of the underlying GDP growth rates. Thus, assumptions on the supply of these primary factors are consistent with the assumed GDP and population growth, indicative of similar regional and dynamic patterns, applicable to the supply of these endowment commodities.
4.2 Sustainability impact
4.2.1 Agri-food production, consumption, prices, and trade
One of the important aspects under the model’s coverage is the agri-food system, which is also essential in analyzing food security in this paper. The model projects, among other things, agricultural and food production, consumption, and prices for individual commodities and sectors in Bangladesh. Figure 5 presents the projected changes in total production, private consumption, and real market price in the agri-food sector in Bangladesh across all four scenarios.
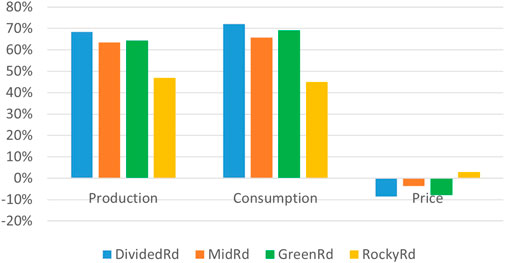
FIGURE 5. Percentage change in production, consumption, and prices of agri-food commodities in 2050 compared to the base year (2011).
Agri-food production and consumption in Bangladesh are projected to increase in all the scenarios. The weakest growth is in Rocky Road. As shown in the previous section, the Bangladeshi population in all four scenarios is expected to grow between 2014 and 2050. At the same time, per capita incomes in 2050 are projected to be a multiple of the base year’s levels. These trends mean that market demand for food will continue to grow, suggesting significant increases in the production of several key commodities. While largely driven by domestic consumption, agri-food production in Bangladesh also needs to compete with imports from other regions, which is projected to emerge in scenarios where economic growth is expected to be high, especially Green Road in 2011–2040. The total import value increased in 2014–2050 due to the 50% reduction in the trade tariffs with all other regions assumed in this scenario (see Table 4).
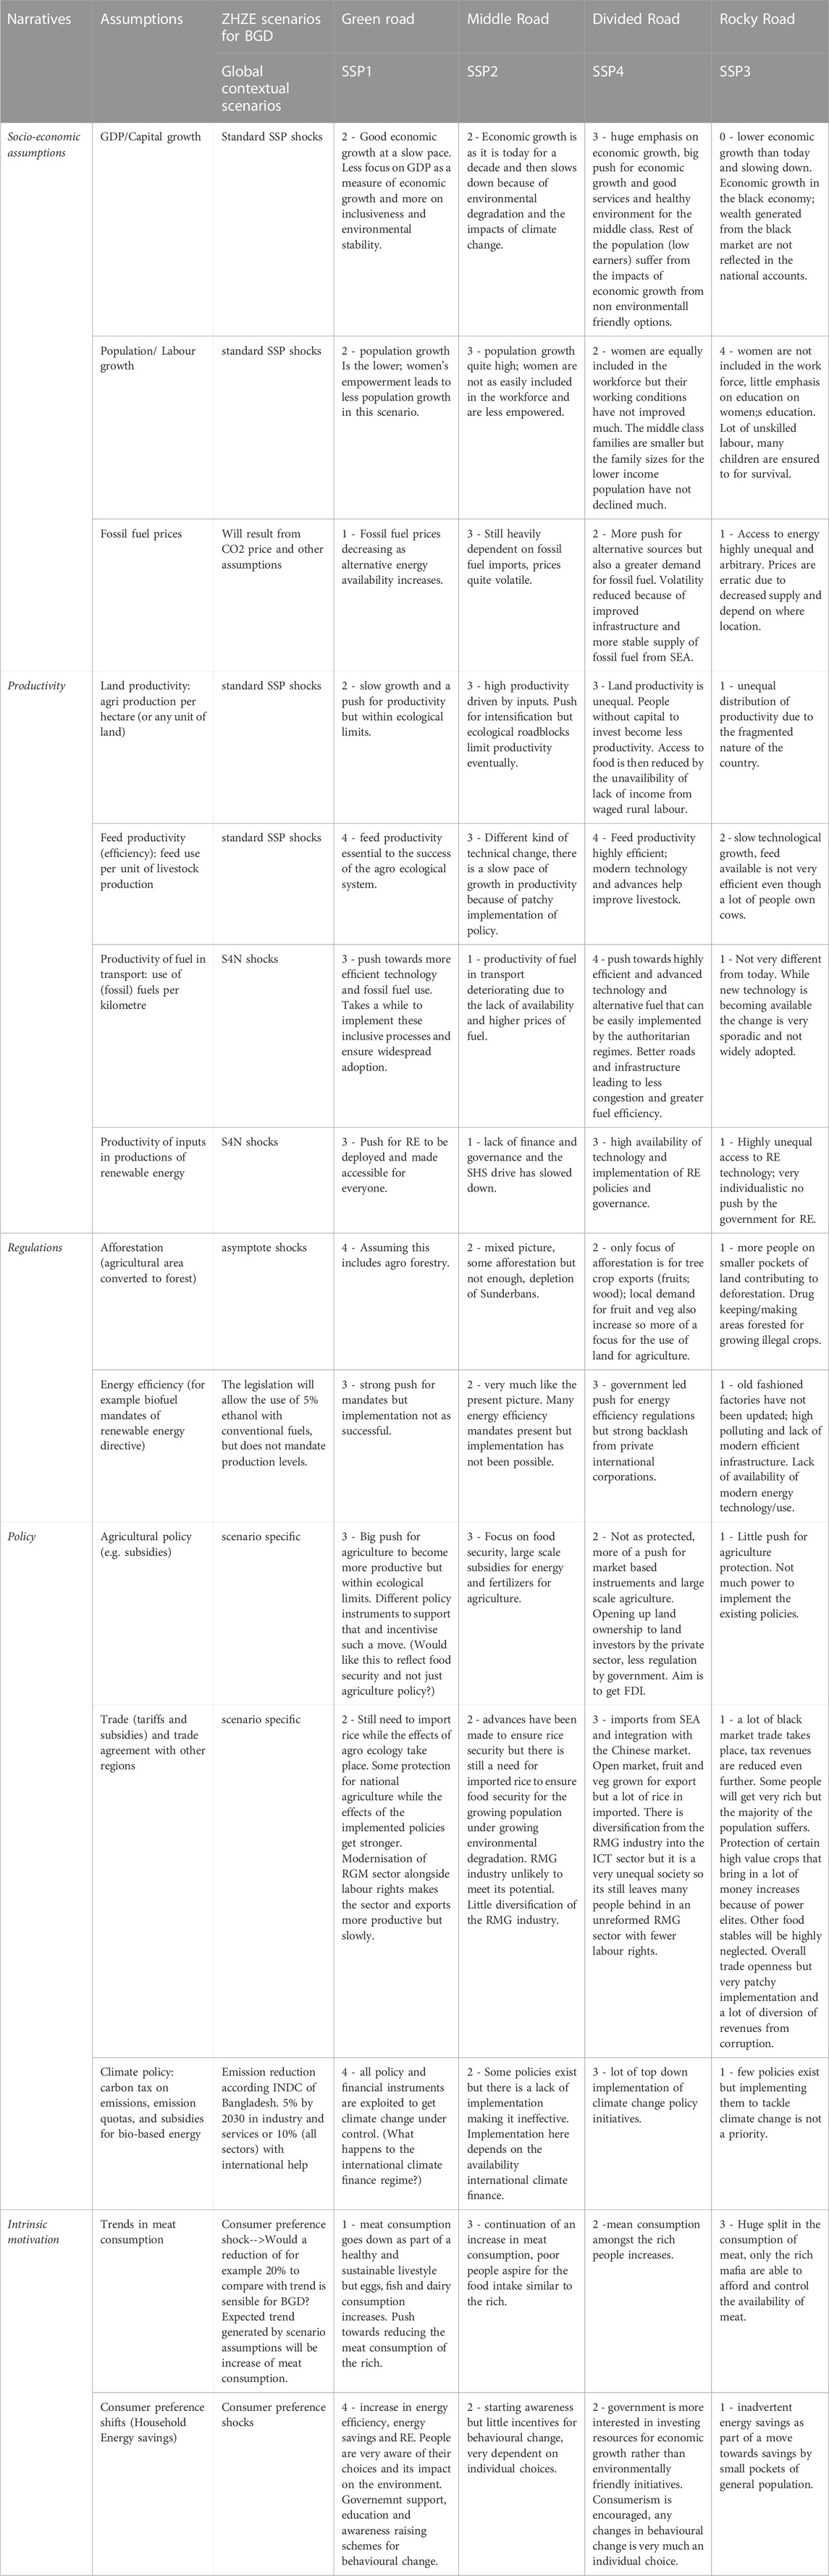
TABLE 4. Scenario quantification assumptions in MAGNET.
The full agricultural trade liberalization between Bangladesh, South-East Asia (SEA), and China, which is assumed in the Divided Road in 2030–2050, results in slightly positive growth in the net export value for Bangladesh compared to the other scenarios (Figure 6).
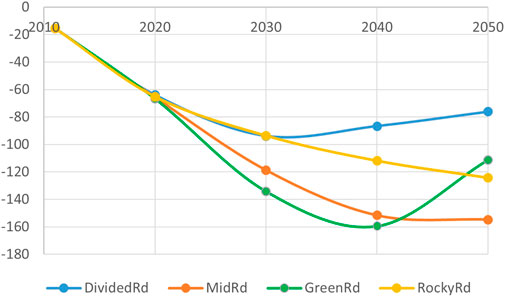
FIGURE 6. Net export value of total agri-food commodities.
4.2.2 Food security
To account for the various aspects of food security, we follow the FAO’s distinction of availability, access, utilization, and stability. We derive model-based indicators for the first three dimensions: food availability, food access, and food utilization. These indicators have been developed and elaborated for the FOODSECURE and IPCC scenarios (van Meijl et al., 2020, respectively). We measure food availability in kcal per capita per day (food available for consumption, e.g., Nelson et al., 2014; Von Lampe et al., 2014). This includes all domestically produced and imported food available for consumption at the household level.
Food access relates to people’s food purchasing power (FPP) and, therefore, to food prices, dietary patterns, and income development (Lele et al., 2016). A first and crude proxy for food access is the change in agri-food prices. The income dimension of food access is neglected in this often-used indicator. The “food purchasing power” (FPP) indicator considers the income dimension by relating the price development of a specific food consumption basket to the income development of a particular income group. More specifically,
In line with Van Meijl et al. (2020a), we use the consumption of cereals (rice and grains) for the food basket as a proxy for the diet of people potentially in poverty, as rice is an important food component of low-income groups in Asia, whereas grains are important in Africa. For the income component of low-income groups, the wages of unskilled (production) workers in the cereals sector are used as a proxy. Less sophisticated proxies are used for the food utilization dimension.
The fraction of calories derived from fruits and vegetables in total calories of food consumption is used as a proxy for food utilization, following the FAO compendium of indicators for nutrition-sensitive agriculture (FAO, IFAD, UNICEF, WFP-WHO, 2018; Van Meijl et al., 2020).
4.2.2.1 Food availability
Overall, the food availability in terms of kcal per capita per day is increasing in all scenarios (Figure 7) due to higher GDP growth and an overall increase in agricultural production. This indicator shows a relatively higher growth in the Green Road as food availability increases owing to the increase in imports of agri-food products, lower prices, and a relatively higher GDP per capita. The other scenarios show relatively less improvement in food availability compared to the Green Road. The Rocky Road has the lowest growth in food availability and even slightly negative growth in 2040–2050 due to a lower GDP/capita growth, an increase in food prices, and a decrease in the food supply, both domestically produced and imported in this period.
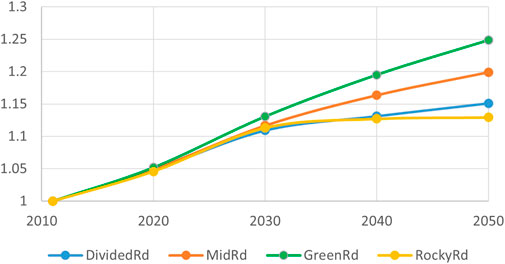
FIGURE 7. Food availability index (2011 = 1) measured by kcal per capita per day available for consumption.
4.2.2.2 Food accessibility
The indicator for food access is the food purchasing power of cereals for unskilled agricultural workers (Figure 8). Unskilled workers in the cereal sector are used as a proxy for unskilled agricultural workers. For the food basket, we use the consumption of cereals (rice and grains) as a proxy for the diet of people potentially in poverty. We use changes in the wages of unskilled workers in the cereals sector as a proxy for the income component of poor people.
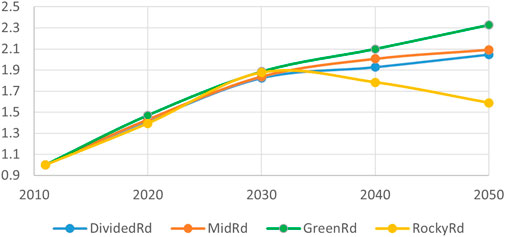
FIGURE 8. Food accessibility index (2011 = 1) measured in food purchasing power cereals for unskilled agricultural workers.
Overall, this indicator shows a relative improvement in all the scenarios due to the overall increase in income per capita. In the Rocky Road, the indicator declines in 2030–2050 caused by lower income/capita growth. Despite higher agri-food prices (cereals), the wages for unskilled people (cereal sector) decrease due to lower economic growth.
4.2.2.3 Food utilization
According to Ruel (2003), micronutrient deficiencies and the burden of non-communicable diseases can be reduced by dietary changes. In this paper, we use the share of calories derived from fruits and vegetables as an imperfect proxy for food utilization (Figure 9). This share rises for an average household in Bangladesh in all the scenarios due to the higher availability and accessibility to a diverse food basket. Despite a high level of access and availability in the Green Road, we do not see a proportional improvement in the utilization. The indicator even shows a decreasing growth rate in 2030–2050. These results are in line with the anticipation that a shift toward fast food will likely shift diets to incorporate fewer whole foods (fruits and vegetables) and more processed foods, especially as we do not assume any exogenous dietary shifts in the scenarios.
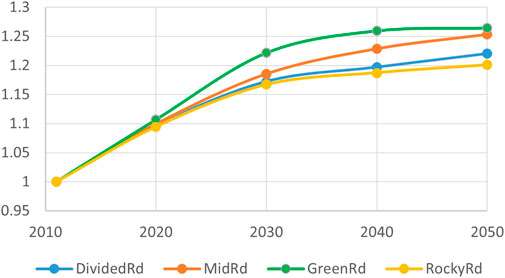
FIGURE 9. Food utilization index (2011 = 1) measures in the share of calories derived from fruits and vegetables.
4.2.3 Environmental impact
MAGNET accounts for different emitting gases (CO2, N2O, CH4, and F-GASes) and different source fuels and activities (coal, crude oil, gas, petrol, chemicals, fertilizer, and industrial activities) as a part of its greenhouse gas emission projections, with aggregate projections across all gases and sources reported in Figure 10 for the agri-food sector.
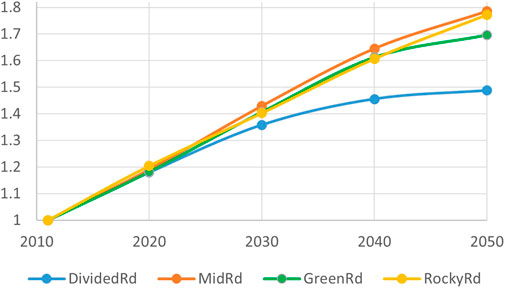
FIGURE 10. GHG emission in agri-food sectors CO2 equivalent index (2011 = 1).
GHG emissions are projected to increase in all scenarios, in line with the assumed economic expansion in these scenarios. Growth in emissions in the two fast-growing scenarios (Green Road and Middle Road) is expected to be substantially higher than in the other regions. However, in the Green Road scenario, Bangladesh complies with the 10% emission reduction target for all sectors, which results in lower growth compared to Mid Road, in which Bangladesh meets the 5% reduction in GHG emission with no mitigation measure taken in the agriculture sector. Despite more drastic mitigation measures and much higher CO2 efficiency in the Green Road (Figure 10), the total GHG emission level is projected to be 70% higher compared to the base year.
Furthermore, the Green Road results in the highest agricultural land pressure compared to the other scenarios (see Figure 11), especially in 2030–2050, in which Bangladesh enjoys very high economic growth.
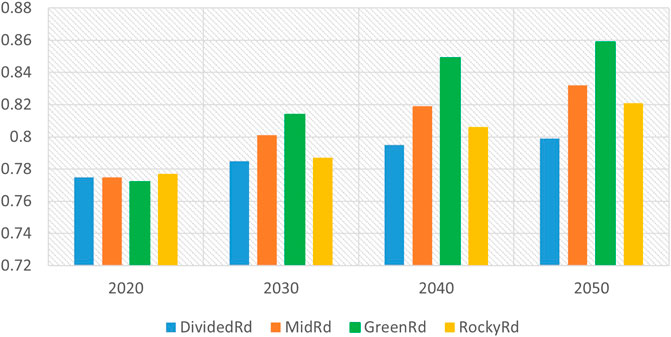
FIGURE 11. Land pressure and agricultural land use percentage of total available land.
4.3 SDG indicators: Synergies and trade-offs
In this section, we present some SDG indicators derived from the SDG insight modules in the model. These indicators complement the variables reported previously, facilitating measuring progress toward the SDGs. Although the SDG modules produce individual indicators consistent with the broad SDG framework, we summarize these indicators using a widely recognized framework known as “People, Planet, and Prosperity.” One advantage of this framework is that it allows us to scrutinize a wide range of SDG indicators through succinct yet inclusive lenses covering social, economic, and environmental domains.
4.3.1 People
Several people-related indicators derived from the SDG 1 and SDG 2 modules are reported in Figure 12. These indicators, including the ratio of rural wage (for unskilled workers) to cereal price, calorie consumption per capita per day, and per capita disposable income, can be used to trace progress toward addressing the direct well-being of people and food security.
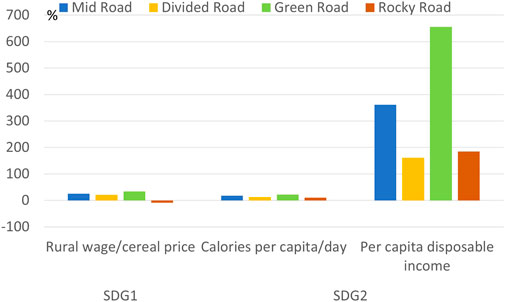
FIGURE 12. SDG 1 and SDG 2 insight indicator growth in 2050: % change in 2050 compared to the base year 2011.
A steady increase in the ratio of rural wage to cereal price is a good measurement that poor people may fare well under a scenario, as is the case in most of the scenarios. However, the Rocky Road stands out as the one scenario expected to have a declining ratio down the track, an indication of likely worsening well-being for the poor in this scenario.
Changes in calorie consumption per capita per day show another different picture across regions. This indicator was discussed in detail in the previous section.
The per capita disposable income (income adjusted for tax payments) is, to some extent, linked to per capita GDP growth, and as such, relatively high growth in per capita GDP in the Green Road. Bangladesh, in this pathway, sees relatively high growth in per capita disposable income, indicative of potential large improvements in the well-being of the overall population in the Green Road. In contrast, the lower-income pathways (Rocky Road and Divided Road) are expected to experience slower growth in per capita disposable income.
4.3.2 Prosperity
Prosperity-related SDG indicators are mainly used to measure the economic performance of a region. Derived from SDG modules 7 and 8, we report indicators defined as the change in net trade position and final energy consumption and relate these indicators to some other variables discussed earlier.
Change in the net trade position, despite not painting a full picture of an economy, sheds light on whether a region or certain sectors in a region may become more or less competitive than other regions. This indicator suggests declining competitiveness across all the scenarios (Figure 13), which may be explained by the rising costs in domestic production. It is noteworthy that the Green Road shows the highest decline among all the other scenarios, which clearly shows a trade-off with gains toward SDG2 targets.
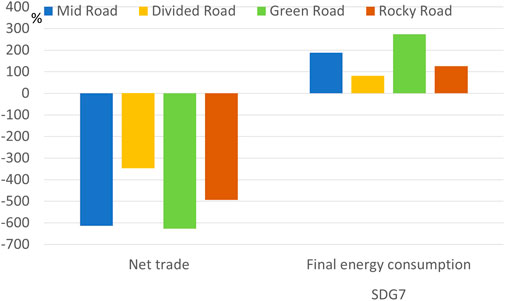
FIGURE 13. SDG 7 insight indicator growth: % change in 2050 compared to the base year 2011.
Final energy consumption is a gauge for access to energy, a measurement consistent with the SDG7 goal—ensure access to affordable, reliable, sustainable, and modern energy for all. Projections on final energy consumption show that higher-income scenarios, Green Road and Mid Road, are expected to experience higher growth in final energy consumption, while the growth trend in lower-income scenarios is less pronounced.
4.3.3 Planet
Planet-related indicators derived from relevant SDG modules (SDGs 9, 12, and 13) measure the extent to which changes in economic activities may become more environmentally friendly. Among other candidates, GHG emissions per unit of GDP, sectoral emissions per unit of value added, and the share of renewable energy in total energy production are reported as measurements for an environment-oriented check.
As an alternative measurement for emissions intensity, emissions per unit of GDP are expected to edge lower in all the scenarios (Figure 13), especially in the Green Road, indicative of economic growth in this scenario being compounded with substantial technological progress rendering commodity production becoming less reliant on energy inputs. This is consistent with broad assumptions made for the baseline, including not only explicit technological progress shocks (e.g., land productivity shocks), but also implicit technological progress built into assumed GDP and population growth. Given the Green Road trajectory, GDP growth may only be partially sustained by the assumed population growth. Thus, this part of the built-in technical progress also contributes to the efficiency gain in energy use and consequently less GHG emissions in the economy.
At the sectoral level, GHG emissions per unit of value added in crops and livestock sectors also show a declining trend across regions. Given the overall declining emissions per unit of GDP, these sectoral results are unsurprising, as these sectoral measurements are simply the decomposition of the Bangladesh country-level measurement, and the reported sectoral results show a consistent trend (Figure 14).
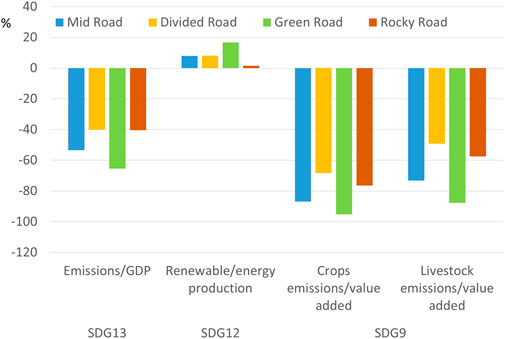
FIGURE 14. SDG 13, SDG 12, SDG 9 insight indicator growth: % change in 2050 compared to the base year 2011.
For the share of renewable energy production in total energy production (see Figure 14), all scenarios are expected to experience an increasing share of renewable energy production. In the case of the Rocky Road, the growth is very low as this is the only scenario in which Bangladesh does not meet the NDC GHG emission targets in 2030. Even the growth in Green Road is only 18%, which is much lower than expected. The impact can also be seen in the high total GHG emission in this scenario, which was reported in the previous sections, suggesting that despite the expected fast growth in renewable energy sectors, the assumed renewable energy trajectories in the Green Road, underpinned by, among other things, implemented biofuels and bioelectricity policy shocks and meeting the highest NDC target by 2030 remain insufficient to increase the share of renewables amongst the energy mix (Figure 14). This highlights another trade-off between rapid economic growth and higher food security and the greening of the economy in the Green Road.
5 Conclusion and future prospects
The scenario work portraying different futures for the Bangladeshi food system shows that diverse pathways for the country are possible, each with differing and far-reaching consequences for food security (SDG 2) and low-carbon development (SDG 13). In general, the scenario results point to similar directions, although they vary in the magnitude and speed of projected changes.
With respect to achieving food security for Bangladesh by 2050 (SDG2), all described pathways make progress toward this goal but at different paces. The Green Road scenario shows the biggest increase, whereas the Rocky Road pathway, characterized by both reactive environmental management and difficult governance circumstance, shows the smallest improvement. Interestingly, the Divided Road scenario only scores a bit better than the Rocky Road scenario, pointing to large differences across the population with respect to food availability. One question that arises here is whether the higher availability of food translates into better nutritional outcomes across the population. The current Bangladeshi diet is relatively low in fresh fruit and vegetable consumption. The Green Road scenario, with its emphasis on strong environmental stewardship and the SDGs, fares quite well in this aspect compared to the other scenarios. However, the overall intake of fruits and vegetables is insufficient to meet healthy consumption targets. This points to the fact that higher availability needs to be combined with a shift in consumer behavior and better access. With respect to food accessibility, the Green Road fares the best again, followed by the Divided and Middle Roads, all of which show an increase in access to food for the population up to 2050. In the Rocky Road, the disintegration of governance and patchiness of economic development led to an overall decline in food accessibility, as substantial parts of the population would struggle to make a living and afford food. However, these results point to the need for further disaggregation of food accessibility data for all scenarios but particularly for the Rocky and Divided Road scenarios to better understand the difference across the whole population.
With respect to climate action for SDG 13 and the Paris Agreement, the total GHG emissions of Bangladesh will not go down completely in any of the scenarios. Although growing efficiency per unit of output will help bring down emissions trajectories, even in the scenario with the strongest proactive environmental management (Green Road), GHG emissions will not reach zero by 2050. In this scenario, gains in efficiency per unit of output will be outpaced by growing emissions due to economic growth. This finding is an important result with far-reaching implications for policymaking as it points to the delicate balance that policymakers will have to strike between the type of economic growth pathway they are choosing and GHG mitigation goals that an emerging economy such as Bangladesh might have to comply with in the future. This points to the difficult choices policymakers will have to make between short-term gains in human well-being and long-term planetary health objectives.
Furthermore, the Green Road scenarios show another important trade-off that might arise in the future, namely, the issue of growing land pressure that this scenario shows despite strong proactive management of natural resources. This results from a combination of agricultural extensification measures and strong income growth in addition to a rise in agricultural exports in the scenario. This interaction of important drivers of land use change exposes the need for strong environmental policies and their implementation for safeguarding biodiversity.
The scenario analysis presented in this paper on possible pathways for Bangladesh presents options for achieving both food security and climate actions simultaneously (see the Green Road scenario). This requires not just strong action around environmental stewardship and management but also the implementation of policies via a well-functioning governance system and the political will to move into a more sustainable trajectory. The analysis also cautions against the assumption that these goals can be achieved without focusing on the type of economic growth pathways sought for Bangladesh or the several other driving forces that will determine the balance between both goals. At the same time, the results also point to the need for close attention to the impact that food security and climate policies might have on the achievements of other goals and the need for an inclusive debate within the country on how to achieve a “good” balance between the various goals that the SDGs have put on the table, as there will be “no free lunch,” i.e., trade-off decisions will have to be made across the various goals.
The recent crises caused by the COVID-19 pandemic and the Ukraine war are causing disruptions in global food supplies with grave consequences. Recent evidence shows that the world is moving backward in achieving many SDG 2 targets leaving the world with an even larger gap to the targets set for 2030 (FAO, IFAD UNICEF, WFP, and WHO, 2020). Although these crises are considered short-run supply shocks, the consequences on food security are likely to be longer-lived, and other similar shocks in the future cannot be discounted. Therefore, effective scenario foresight modeling of food security is needed to better anticipate these types of shock to the food system. However, the parametric values of the MAGNET model used in this study and, in general, the CGE models are equipped by default for long-run scenario analyses, where the time horizons under consideration are typically 5 years or longer. To assess an economic impact spanning shorter time horizons, these types of models will need to be reparametrized to better simulate short-run behavior. There remain many research areas for the future to enhance the treatment of a severe crisis such as COVID-19. The first is to enhance the weakness of CGE models such as modeling demand-side shocks and include better monetary and fiscal policies. Second, a better assessment of food access requires an explicit household dimension in the model to cover both income and food expenditures at a specific household level. Moreover, the importance of transition possibilities of labor from agriculture to other sectors and lock-in effects in segmented labor markets is crucial. Moreover, for a better assessment of the food utilization dimension, the explicit modeling of micro- and macronutrients at the household level is needed in combination with clear guidelines for healthy diets.
Data availability statement
The data analyzed in this study are subject to the following licenses/restrictions: The dataset on which this paper is based on are too large to be retained or publicly archived with available resources. They are also with restricted access. Documentation and methods used to support this study are available from GTAP 9 Database (https://www.gtap.agecon.purdue.edu/databases/v9/default.asp), SSP database (https://tntcat.iiasa.ac.at/SspDb/dsd?Action=htmlpage&page=about), and Bangladesh Household and Expenditure Survey (HIES 2011) data (http://data.bbs.gov.bd/index.php/catalog/HIES). Requests to access these datasets should be directed to SM, c2FlZWQubW9naGF5ZXJAd3VyLm5s.
Ethics statement
Ethics review and approval/written informed consent was not required as per local legislation and institutional requirements.
Author contributions
SM: conceptualization, methodology, modeling work, and writing—original draft. MZ and MM: scenario conceptualization and development, writing. JM: scenario development and narratives. DM-D: data and modeling, writing. AT: model development and simulations. JV: conceptualization, scenarios, and writing (revision). TA: conceptualization, framework, and writing (revision).
Funding
The authors would like to acknowledge funding from the CGIAR Research Program on Climate Change, Agriculture and Food Security (CCAFS), which is carried out with support from the CGIAR Trust Fund and through bilateral funding agreements (see https://ccafs.cgiar.org/donors). Support for this study was also provided by Mitigate+: Research for Low Emissions Food Systems. The views expressed in this document cannot be taken to reflect the official opinions of these organizations.
Acknowledgments
We thank Marijke Kuiper, Irene Guijt, and Saleemul Huq who provided insight and expertise that greatly assisted the research.
Conflict of interest
The authors declare that the research was conducted in the absence of any commercial or financial relationships that could be construed as a potential conflict of interest.
Publisher’s note
All claims expressed in this article are solely those of the authors and do not necessarily represent those of their affiliated organizations or those of the publisher, the editors, and the reviewers. Any product that may be evaluated in this article, or claim that may be made by its manufacturer, is not guaranteed or endorsed by the publisher.
Supplementary material
The Supplementary Material for this article can be found online at: https://www.frontiersin.org/articles/10.3389/fenvs.2022.977760/full#supplementary-material
References
Aguiar, A., Narayanan, B., and McDougall, R. (2016). An overview of the GTAP 9 data base. J. Glob. Econ. Anal. 1 (1), 181–208. doi:10.21642/JGEA.010103AF
Armington, P. S. (1969). The Geographic Pattern of Trade and the Effects of Price Changes (Structure geographique des echanges et incidences des variations de prix) (Estructura geografica del comercio y efectos de la variacion de los precios). Staff Pap. Int. Monet. Fund. 16 (2), 179–201. doi:10.2307/3866431
Aryal, J. P., Sapkota, T. B., Khurana, R., Khatri-Chhetri, A., Rahut, D. B., and Jat, M. L. (2020). Climate change and agriculture in South Asia: Adaptation options in smallholder production systems. Environ. Dev. Sustain. 22, 5045–5075. doi:10.1007/s10668-019-00414-4
Aryal, J. P., Sapkota, T. B., Rahut, D. B., Krupnik, T. J., Shahrin, S., Jat, M. L., et al. (2020). Major climate risks and adaptation strategies of smallholder farmers in coastal Bangladesh. Environ. Manage. 66, 105–120. doi:10.1007/s00267-020-01291-8
Banerjee, O., Mahzab, M., Raihan, S., and Islam, N. (2015). An economy-wide analysis of climate change impacts on agriculture and food security in Bangladesh. Clim. Chang. Econ. (Singap). 06 (01), 1550003. doi:10.1142/S2010007815500037
Banse, M., Van Meijl, H., Tabeau, A., Woltjer, G., Hellmann, F., and Verburg, P. H. (2011). Impact of EU biofuel policies on world agricultural production and land use. Biomass Bioenergy 35, 2385–2390. doi:10.1016/j.biombioe.2010.09.001
Banse, M., van Meijl, H., Tabeau, A., and Woltjer, G. (2008). Will EU biofuel policies affect global agricultural markets? Eur. Rev. Agric. Econ. 35, 117–141. doi:10.1093/erae/jbn023
Brown, C., Calvi, R., and Penglase, J. (2021). Sharing the pie: An analysis of undernutrition and individual consumption in Bangladesh. J. Public Econ. 200, 104460. doi:10.1016/j.jpubeco.2021.104460
Carlsson-Kanyama, A., Dreborg, K. H., Moll, H. C., and Padovan, D. (2008). Participative backcasting: A tool for involving stakeholders in local sustainability planning. Futures 40 (1), 34–46. doi:10.1016/j.futures.2007.06.001
Clements, K. W., Si, J., and Vo, L. (2017). Food and agricultural prices across countries and the law of one price. Available at SSRN 2968742.
Corong, E. L., Hertel, T. W., McDougall, R., Tsigas, M. E., and van der Mensbrugghe, D. (2017). The standard GTAP model, version 7. J. Glob. Econ. Anal. 2 (1), 1–119. doi:10.21642/JGEA.020101AF
Crippa, M., Solazzo, E., Guizzardi, D., Monforti-Ferrario, F., Tubiello, F. N., and Leip, A. (2021). Food systems are responsible for a third of global anthropogenic GHG emissions. Nat. Food 2, 198–209. doi:10.1038/s43016-021-00225-9
Dellink, R., Chateau, J., Lanzi, E., and Magné, B. (2015). Long-term economic growth projections in the shared socioeconomic pathways. Glob. Environ. Change 42, 200–214. doi:10.1016/j.gloenvcha.2015.06.004
Eckstein, D., Künzel, V., Schäfer, L., and Winges, M. (2020). Global climate risk index 2020. Who suffers most from extreme weather events? Available at: www.germanwatch.org.
Ensure sustainable consumption and production patterns (2019). Sustainable consumption and production. New York: United Nations Sustainable Development blog. Available at: https://www.un.org/sustainabledevelopment/sustainable-consumption-production/.
FAO, IFAD UNICEF, WFP, and WHO (2020). The state of food security and nutrition in the world 2020. . Rome: FAO, IFAD, UNICEF, WFP and WHO. doi:10.4060/ca9692en
FAO, IFAD, UNICEF, WFP and WHO (2022). The State of Food Security and Nutrition in the World 2022. Repurposing food and agricultural policies to make healthy diets more affordable. Rome: FAO. doi:10.4060/cc0639en
FAO-IFAD-UNICEF-WFP-WHO (2018). The State of Food Security and Nutrition in the World 2018. Building climate resilience for food security and nutrition. . Rome: FAO. Available at: http://www.fao.org/3/a-I7695e.pdf.
Food and Agriculture Organization of the United Nations (1997). FAOSTAT statistical database. [Rome] :FAO, frank, stefan, petr havlík, elke stehfest, hans van Meijl, peter witzke, ignacio pérez-domínguez, michiel van Dijk, jonathan doelman, thomas fellmann, jason levin-koopman, Andrzej Tabeau, and hugo Valin. (2018) A multi-model assessment of agricultural non-CO2 emission reductions to achieve the 1.5 °C climate target. Nat. Clim. Change. (IF 19.2).
Golan, A. (2007). Information and entropy econometrics-volume overview and synthesis. J. Econ. 138 (2), 379–387. doi:10.1016/j.jeconom.2006.05.001
Golan, A., Perloff, J. M., and Shen, E. Z. (2001). Estimating a demand system with nonnegativity constraints: Mexican meat demand. Rev. Econ. Statistics 83 (3), 541–550. doi:10.1162/00346530152480180
Grebmer, K. v., Bernstein, l., Patterson, F., Wiemers, M., Chéilleachair, R. N., Foely, C., et al. (2019). 2019 global hunger index: The challenge of hunger and climate change, 72.
Gtap, d., Aguiar, A., Chepeliev, M., Corong, E. L., McDougall, R., and Van Der Mensbrugghe, D. (2019). The GTAP data base: Version 10. J. Glob. Econ. Anal. 4 (1), 1–27. doi:10.21642/jgea.040101af
Hasegawa, T., Fujimori, S., Havlik, P., Valin, H., Bodirsky, B., Doelman, J., et al. (2018). Risk of increased food insecurity under stringent global climate change mitigation policy. Nat. Clim. Chang. 8, 699–703. IF 19.2. doi:10.1038/s41558-018-0230-x
Henrichs, T., Lucas, N., Raudsepp-Hearne, C., Simpson, R. D., Scholes, R., Tomich, T., et al. (2010). Ecosystems and human well-being: A manual for assessment practitioners. Island press. Washington DC: United Nations Environment Programme World Convservation Monitoring Centre. 978-1-59726-711-3.
Hossain, M., Mullally, C., and Asadullah, M. N. (2019). Alternatives to calorie-based indicators of food security: An application of machine learning methods. Food policy 84, 77–91. doi:10.1016/j.foodpol.2019.03.001
IFC (2019). ‘Safety first: Bangladesh garment industry rebounds’. IFC insights. Available at: https://www.ifc.org/wps/wcm/connect/NEWS_EXT_CONTENT/IFC_External_Corporate_Site/News+and+Events/News/Insights/Bangladesh-garment-industry.
IPCC (2021). “Climate change 2021,” in The physical science basis. Contribution of working group I to the sixth assessment report of the intergovernmental panel on climate change[masson-delmotte. Editors P. Zhai, A. Pirani, S. L. Connors, C. Péan, S. Bergeret al. (Cambridge, United Kingdom and New York, NY, USA: Cambridge University Press). In press. doi:10.1017/9781009157896
Kc, S., and Lutz, W. (2015). The human core of the shared socioeconomic pathways: Population scenarios by age, sex and level of education for all countries to 2100. Glob. Environ. Change 42, 181–192. doi:10.1016/j.gloenvcha.2014.06.004
Kok, K., Bärlund, I., Flörke, M., Holman, I., Gramberger, M., Sendzimir, J., et al. (2015). European participatory scenario development: Strengthening the link between stories and models. Clim. Change 128 (3–4), 187–200. doi:10.1007/s10584-014-1143-y
Laborde, David, Martin, Will, Swinnen, Johan, and Vos, Rob (2020). COVID-19 risks to global food security. Science 369 (6503), 500–502. doi:10.1126/science.abc4765
Laborde, David, Martin, Will, and Vos, Rob (2020). Estimating the poverty impact of COVID-19 the MIRAGRODEP and POVANA frameworks 1. Washington DC: IFPRI.
Lele, U., Masters, W. A., Kinabo, J., Meenakshi, J. V., Ramaswami, B., Tagwireyi, J., et al. (2016). Measuring food and nutrition security: An independent technical assessment and user’s guide for existing indicators, 177. Rome: Food Security Information Network, Measuring Food and Nutrition Security Technical Working Group.
Maliszewska, M., Mattoo, A., and van der Mensbrugghe, D. (2020). The potential impact of COVID-19 on GDP and trade: A preliminary assessment, the world bank group. Policy Research Working Paper 9211.
McKibbin, Warwick, and Fernando, Roshen (2020). The global macroeconomic impacts of COVID-19. Washington DC: Brookings Institute. no. March: 1–43. Available at: https://www.brookings.edu/wp-content/uploads/2020/03/20200302_COVID19.pdf.
Nelson, G. C., Rosegrant, M. W., Koo, J., Robertson, R., Sulser, T., Zhu, T., et al. (2009). Climate change: Impact on agriculture and costs of adaptation. Washington, DC: International Food Policy Research Institute.
Nelson, G. C., van der Mensbrugghe, D., Ahammad, H., Blanc, E., Calvin, K., Hasegawa, T., et al. (2014). Agriculture and climate change in global scenarios: Why don't the models agree? Agric. Econ. 45 (1), pp85–101. doi:10.1111/agec.12091
Pradhan, P., Costa, L., Rybski, D., Lucht, W., and Kropp, J. P. (2017). A systematic study of sustainable development goal (SDG) interactions. Earth's. Future 5 (11), 1169–1179. doi:10.1002/2017EF000632
Reggers, A. (2019). Climate change is not gender neutral: Gender inequality, rights and vulnerabilities in Bangladesh. Cham: Springer, 103–118. doi:10.1007/978-3-030-05237-9_8
Robilliard, A. S., and Robinson, S. (2003). Reconciling household surveys and national accounts data using a cross entropy estimation method. Rev. Income Wealth 49 (3), 395–406. doi:10.1111/1475-4991.00094
Robinson, S., Cattaneo, A., and El-Said, M. (2001). Updating and estimating a social accounting matrix using cross entropy methods. Econ. Syst. Res. 13 (1), 47–64. doi:10.1080/09535310120026247
Rosenzweig, C., Mbow, C., Barioni, L. G., Benton, T. G., Herrero, M., Krishnapillai, M., et al. (2020). Climate change responses benefit from a global food system approach. Nat. Food 1, 94–97. doi:10.1038/s43016-020-0031-z
Schmitz, C., van Meijl, H., Kyle, P., Nelson, G. C., Fujimori, S., Gurgel, A., et al. (2014). Land-use change trajectories up to 2050: Insights from a global agro-economic model comparison. Agric. Econ. 45, 69–84. doi:10.1111/agec.12090
Springmann, Marco, Clark, Michael, Mason-D’Croz, Daniel, Keith, Wiebe, Leon Bodirsky, Benjamin, Lassaletta, Luis, et al. (2018). Options for keeping the food system within environmental limits. Nature 562 (7728), 519–525. doi:10.1038/s41586-018-0594-0
Stehfest, E., Van Vuuren, D. P., Kram, T., and Bouwman, L. (2014). Integrated assessment of global environmental change with IMAGE 3.0. Model description and policy applications. The Hague, Netherlands: PBL Netherlands Environmental Assessment Agency.
Swinnen, J., and McDermott, J. (2020). COVID-19 and global food security. 0 ed. Washington, DC: International Food Policy Research Institute. doi:10.2499/p15738coll2.133762
Tesfaye, K., Zaidi, P., Gbegbelegbe, S., Boeber, C., Getaneh, F., Seetharam, K., et al. (2017). Climate change impacts and potential benefits of heat-tolerant maize in South Asia. T heor. Appl. Climatol. 130, 959–970. doi:10.1007/s00704-016-1931-6
UNFCC (2021). Nationally determined contributions 2021. NDC_submission_20210826revised.pdf (unfccc.int).
University of Notre Dame (2021). ND-GAIN country index. South Bend, Indiana: University of Notre Dame. Available at: https://gain.nd.edu/our-work/country-index/.
Valin, H., Hertel, T., Leon Bodirsky, B., Hasegawa, T., and Stehfest, E. (2021). Achieving zero hunger by 2030. A review of quantitative assessments of synergies and tradeoffs amongst the UN sustainable development goals. A paper from the scientific group of the UN food systems summit.
van Meijl, H., Shutes, L., Valin, H., Stehfest, E., van Dijk, M., Kuiper, M., et al. (2020). Modelling alternative futures of global food security: Insights from FOODSECURE. Glob. Food Secur. 25, 100358. doi:10.1016/j.gfs.2020.100358
Van Meijl, H., Tsiropoulos, I., Bartelings, H., Hoefnagels, R., Smeets, E., Tabeau, A., et al. (2018). On the macro-economic impact of bioenergy and biochemicals – introducing advanced bioeconomy sectors into an economic modelling framework with a case study for The Netherlands. Biomass Bioenergy 108, 381–397. doi:10.1016/j.biombioe.2017.10.040
Vervoort, J. M., and Gupta, A. (2018). Anticipating climate futures in a 1.5°C era: The link between foresight and governance. Curr. Opin. Environ. Sustain. 31, 104–111. doi:10.1016/j.cosust.2018.01.004
Von Lampe, M., Willenbockel, D., Ahammad, H., Blanc, E., Cai, Y., Calvin, K., et al. (2014). Why do global long-term scenarios for agriculture differ? An overview of the AgMIP global economic model intercomparison. Agric. Econ. 45 (1), 3–20. doi:10.1111/agec.12086
Waid, J. L., Ali, M., Thilsted, S. H., and Gabrysch, S. (2018). Dietary change in Bangladesh from 1985 to 2010. Glob. food Secur. 17, 221–232. doi:10.1016/j.gfs.2017.09.003
Waid, J. L., Bogard, J. R., Thilsted, S. H., and Gabrysch, S. (2017). Estimates of average energy requirements in Bangladesh: Adult Male Equivalent values for use in analyzing household consumption and expenditure surveys. Data brief 14, 101–106. doi:10.1016/j.dib.2017.07.022
Wang, S. W., Lee, W.-K., and Son, Y. (2017). An assessment of climate change impacts and adaptation in South Asian agriculture. Int. J. Clim. Chang. Strateg. Manag. 9, 517–534. doi:10.1108/ijccsm-05-2016-0069
Welthungerhilfe, and Concern Worldwide (2018). ‘Global hunger index: A closer look at hunger and undernutrition in Bangladesh’. Global hunger index (ghi) - peer-reviewed annual publication designed to comprehensively measure and track hunger at the global, regional, and country levels. Available at: https://www.globalhungerindex.org/case-studies/2018-bangladesh.html.
WMO (2021). The atlas of mortality and economic losses from weather, climate and water extremes (1970–2019). Geneva: World Meteorological Organization.
Woltjer, G. B., Kuiper, M., Kavallari, A., Meijl, H. v., Powell, J. P., Rutten, M. M., et al. (2014). The MAGNET model: Module description. No. 14-57. The Hague: Lei Wageningen.
Yu, W., Alam, M., Hassan, A., Khan, A. S., Ruane, A., Rosenzweig, C., et al. (2010). “Climate change risks and food security in Bangladesh,” in Climate change risks and food security in Bangladesh (Dhaka: Routledge). doi:10.4324/9781849776387
Keywords: food system, CGE (computable general equilibrium), SDGs (6), scenario foresight analysis, climate challenge, evidence-informed decision-making, evidence-to-policy
Citation: Moghayer S, Zurek M, Muzammil M, Mason-D’Croz D, Magrath J, Tabeau A, Vervoort JM and Achterbosch T (2023) A low-carbon and hunger-free future for Bangladesh: An ex- ante assessment of synergies and trade-offs in different transition pathways. Front. Environ. Sci. 10:977760. doi: 10.3389/fenvs.2022.977760
Received: 24 June 2022; Accepted: 25 November 2022;
Published: 04 January 2023.
Edited by:
Pete Falloon, Hadley Centre, United KingdomReviewed by:
Olutosin Ademola Otekunrin, Federal University of Agriculture, NigeriaJeetendra Prakash Aryal, International Maize and Wheat Improvement Center, Mexico
Copyright © 2023 Moghayer, Zurek, Muzammil, Mason-D’Croz, Magrath, Tabeau, Vervoort and Achterbosch. This is an open-access article distributed under the terms of the Creative Commons Attribution License (CC BY). The use, distribution or reproduction in other forums is permitted, provided the original author(s) and the copyright owner(s) are credited and that the original publication in this journal is cited, in accordance with accepted academic practice. No use, distribution or reproduction is permitted which does not comply with these terms.
*Correspondence: Saeed Moghayer, c2FlZWQubW9naGF5ZXJAd3VyLm5s