 Jinhong Bao
 Yin Li*
- School of Economics, South-Central Minzu University, Wuhan, China
As the core of “Rise of Central China” strategy, the regional innovation capacity of the Wuhan Metropolitan Area is the key to enhance the innovation ability of central China and even China. High-tech industries are the key driving force to improving regional innovation. Studying the relationship between high-tech clusters and regional innovation capacity helps optimize the spatial layout of regional high-tech industries, upgrade the industrial structure and enhance regional innovation capacity. Based on the panel data of nine cities in the Wuhan Metropolitan Area from 2010–2019, we measure the regional innovation capacity and the degree of high-tech cluster using the super-SBM and locational quotient. Furthermore, we explore the high-tech cluster’s influence on regional innovation capacity by constructing a non-linear panel threshold model and a spatial econometric model. The results showed: 1) The innovation capability of the Wuhan Metropolitan Area shows a “W” type fluctuation upward trend, and the degree of the high-tech cluster is below the quotient level of 1, showing a continuous “M” type trend; 2) There is a non-linear double-threshold effect between high-tech cluster and innovation capacity, and the overall effect of promotion, but there is a marginal decreasing, probably because of the crowding effect or over-competition of the high-tech cluster in some regions; 3) After considering the spatial effect, the impact of the high-tech cluster on the innovation capacity of both local and neighboring regions shows a “U” curve, but the spillover to the neighboring areas is relatively limited. Therefore, to give full play to the advantages of the high-tech cluster, it is necessary to take a long-term view when formulating relevant industrial policies while considering the differences in regional economic development levels and spatial spillover effects.
1 Introduction
China’s economic development mode is changing from pursuing high-speed growth to high-quality development, from factor- and investment-driven to innovation-driven (Gu et al., 2020). High-quality urban agglomerations are important spatial carriers for China’s economic and social development (Fang and Yu, 2017). The construction of urban agglomerations will also change from the previous scale-expansion type to the efficiency-enhancing type, in which technology-intensive high-tech industries are essential to enhance the innovation capacity of urban agglomerations.
The “Metropolitan Area” is a critical factor in enhancing the innovation capability of the city cluster (Fang and Yu, 2017). The concept of “Wuhan Metropolitan Area” was formally proposed in 2002, which refers to the city cluster consisting of eight large and medium-sized cities around Huangshi, Ezhou, Huanggang, Xiaogan, Xianning, Xiantao, Qianjiang and Tianmen within a radius of 100 km with Wuhan as the center of the national central city, also known as “1 + 8 city circle”. As an essential national high-tech industrial base and the core of the “Rise of Central China” strategy, Wuhan Metropolitan Area is strong in high-tech industries and rich in innovative resources. Since its establishment, the government has been actively promoting the construction of industrial parks to promote industrial clustering and technological innovation.
The policy of the Wuhan metropolitan area to promote the clustering of high-tech industries can trace back to 2006. The Hubei Provincial Government officially issued the “Hubei Province high-tech industry development 11th Five-Year Plan” in 2006 (PGHP, 2006), which points out the general layout of the province’s high-tech industry development in the 11th Five-Year Plan, and tries to promote the development of high-tech industry clustering in the province, especially highlighting the central position of the Wuhan metropolitan area in the development of high-tech industry in the province. In 2021, the Hubei Provincial Government promulgated “Several measures to promote the high-quality development of Hubei High-tech Industrial Development Zone” (PGHP, 2021), and in 2022, “Innovative Industrial Cluster Management in Hubei Province (PGHP, 2021) was drafted, both of them again underlined the clustering development of high-tech in Hubei province.
After nearly 20 years of exploration and development, Wuhan Metropolitan Area has built the Wuhan Economic and Technological Development Zone, Lingang Economic and Technological Development Zone, East Lake High-tech Zone, Huangshi Economic and Technological Development Zone, Gedian Economic and Technological Development Zone, a total of five national economic and technological development zones, each city has also established high-tech open areas such as Huanggang, Xiaogan, Xianning, Xiantao and Qianjiang high-tech development zones, gradually forming high-tech industry The new pattern of regional development of high-tech industry clustering has promoted high-tech industry and regional development. In 2021, Wuhan Metropolitan Area will have a resident population of 32.85 million, and the added value of the high-tech industry will be over RMB 670 billion, which is one-third of the area of Hubei province, concentrating more than half of the province’s population and contributing nearly 70% of the added value of high-tech industry.
The report of the 20th CPC National Congress points out “building a coordinated development pattern of large, medium and small cities based on city clusters and metropolitan areas” and promotes the formation of a new pattern of coordinated regional development with city clusters and metropolitan areas. However, from a general point of view, there are problems of unbalanced and uncoordinated development of innovation level and high-tech industry within the Wuhan Metropolitan Area by 2021. According to the “China City Science and Technology Innovation Development Report 2021”, Wuhan City’s science and technology innovation index score is 0.69, ranking 7th in China, while Xianning City, the lowest-ranked city in the city circle, has a science and technology innovation index score of only 0.279, ranking 155th out of 282 cities. The industry has a significant gap in the distribution of resources and development in the Wuhan Metropolitan Area. Just from the added value of the high-tech industry in 2021 is 408.841 billion yuan in Wuhan and 25.294 billion yuan in Xianning. So, what is the degree of the high-tech cluster in the Wuhan Metropolitan Area in 20 years?
Based on the preliminary analysis of literature and data, this paper raises three questions: 1) What is the degree of the high-tech cluster in the Wuhan Metropolitan Area in 20 years? (2)Moreover, in turn, does it impact regional innovation capacity? (3)What is the impact? Therefore this paper attempts to explain the above three questions by empolying the super-SBM and locational quotient to measure the regional innovation capacity (RIC) and the degree of high-tech cluster respectively. Then constructing a nonlinear panel threshold model and a spatial econometric model including the RIC and the degree of high-tech cluster to fill the literature gap.
In the rest of this study, we briefly review the relevant literature in Section 2, introduce methodology, variable, and data in Section 3, report empirical result in Section 4. Finally we conclude the study and offer useful policy recommendations in Section 5.
2 Literature review
2.1 Regional innovation capacity (RIC)
The study of innovation as an essential factor affecting production began with Schumpeter (Scherer, 1986), who elaborated the idea of innovation theory in his book “Introduction to Economic Development” as early as 1912, considering innovation as a new production function and the regrouping of various factors of production. It was only when scholars such as Freeman (1987) and Cooke (1992) added concepts such as region to innovation and put forward the idea of regional innovation that the regional innovation issue gradually attracted scholars’ attention. At the international level for the study of RIC, there are usually only a few case studies focused on one or a few regions and cities (Fujita and Tabuchi, 1997; Alecke et al., 2006; Maggioni, 2002; Zandiatashbar and Hamidi, 2022). Specifically, research on China’s RIC has focused on RIC’s spatial and temporal heterogeneity. The research on RIC focuses on two factors: First, RIC’s spatial and temporal heterogeneity. For the research on the change of RIC in the time dimension, scholars have deepened their research on China’s RIC shows a fluctuating rise over time (Li, 2009; Wang et al., 2020). However, with the rapid development of China’s economy, the differences in regional innovation performance are getting bigger and bigger, and there are apparent spatial differences in regional innovation capabilities, with the eastern, central and western regions forming a stepwise decreasing trend (Li, 2009; Xu et al., 2019; Irfan et al., 2022). Second, the study of factors influencing RIC. They mainly include regional economic level (Li, 2009), competitive intensity (Li et al., 2016), government intervention (Yu, 2023), economic environment (Yang et al., 2023), knowledge intensity (Guo et al., 2019), geographic location (Fan et al., 2012) and high-tech industry clustering (Wu et al., 2019).
2.2 The relationship between high-tech cluster and RIC
There are three main methods to measure innovation efficiency. First, rely on the results of innovation, often expressed in the number of patents (Jiang et al., 2022). Second, select multiple indicators and measure RIC by principal component analysis (Wang et al., 2020). Third, frontier surface analysis usually measures innovation efficiency, including parametric and non-parametric methods. The commonly used parametric method is Random Frontier Analysis (SFA) (Charoenrat and Harvie, 2014), and the commonly used non-parametric method is Data Envelopment Analysis (DEA) (Li et al., 2018), both of which have advantages and disadvantages. The application of SFA focused mainly on enterprises’ efficiency. The DEA method can construct a minimum set of output possibilities that can be adapted to all individual production patterns and is gradually becoming a standard method for measuring the efficiency of regional innovation.
2.3 The relationship between high-tech cluster and RIC
Industrial clustering (Liu et al., 2017) has become an inevitable trend of economic development driven by the inherent requirements of economies of scale. Industrial agglomeration is the aggregation of many independent and related enterprises and institutions in a geographical space through the division of labour. Industrial agglomeration removes and lowers the barriers to capital, infrastructure and knowledge for firms in the agglomeration area, providing an incentive for innovation (Kumar and Subrahmanya, 2010; Ketels, 2003). Meanwhile, high-tech industry clustering has received wide attention as an important influencing factor of regional innovation capability (Furman et al., 2002; Hu and MAthews, 2008).
Economic development is accompanied by an increase in the demand for innovation, and the high-tech industry has the characteristics of complex technology or innovation (Zhou, 2016) and with this requires the development of linkages or cooperation between enterprises, which naturally promotes the creation of high-tech industry clusters. However, there are contradictions in the conclusions of existing studies about the relationship between industrial clusters and RIC. Some scholars hold the opinion that high-tech clusters can enhance innovation capability. Porter (1998) argues that intense competition within high-tech industrial agglomerations promotes specialized production, enhances innovation efficiency, and ultimately promotes the continuous improvement of the technological innovation capacity of the high-tech industrial agglomeration; Carlino et al. (2007) argue that high-tech industrial agglomeration can enhance the regional patent density by strengthening technology and knowledge spillover among high-tech enterprises in the region, thus promote RIC; Kesidou and Romijn (2008) argue that local knowledge spillover from high-tech industries is the primary driver of regional innovation, whether in developed or less developed countries. Xie et al. (2018) studied the Wuhan Donghu High-Tech Zone. They found a high-tech cluster that helped form an intensive entrepreneurial community that has achieved numerous technological innovations and contributed substantially to the economy of Hubei Province.
In addition, other scholars have a different view. Pouder and St. John (1996) argue that the creation and diffusion of institutional norms create a “macro-culture” of the cluster, which leads to homogeneity and stereotypes among firms in the cluster, which is not conducive to innovation. Beule and Beveren (2010) argue that whether industrial agglomeration promotes technological innovation and product renewal depends on the stage of technological innovation in which the firm is located. Fritsch and Slavtche (2010) argue with the help of German state data from 1996–2000 that there is an inverted “U" shaped curve relationship between industrial agglomeration and innovation efficiency when industrial agglomeration reaches a certain level. Chung et al. (2022) analyzed global data from 90 countries. The ratio of high-tech entrepreneurial activities has an inverted-U-shaped relationship with innovation efficacy.
The studies mentioned above in the literature suggest that the impact of the industrial cluster on RIC is so sophisticated, and there is yet to be a unified conclusion. Firstly, the existing studies on the nonlinear relationship between high-tech clusters and RIC are few and only use a single model to explore the nonlinear relationship between them; Secondly, most of the studies focus on the impact of industry clusters on inter-provincial innovation within the provincial scope. In recent years, the development of China’s urban clusters has received much national attention, and Wuhan Metropolitan Area is an important innovation highland for the “rise of central China”, but the existing studies have not yet covered the research on the RIC of high-tech industrial cluster in Wuhan Metropolitan Area. Based on this, this paper introduces the economic development level as a threshold variable to build a panel threshold model to study its nonlinear effect on RIC and also checks whether there is a crowding effect by establishing a spatial econometric model and using the quadratic term of the high-tech cluster. Combining the spatial effect and nonlinear effect, it can not only profoundly study the spatial spillover effect of the high-tech cluster on the influence of RIC but also further consider the characteristics of the role of the high-tech cluster on RIC and their spatial relationship from a spatial perspective, to provide policy suggestions for the development of high-tech industry in Wuhan Metropolitan Area.
3 Methodology
3.1 Model and method
Firstly, we considered the impact of the spatial cluster of high-tech on technological innovation. Innovation is a process that relies on knowledge production activities, and we reviewed numerous pieces of literature on innovation research to find out that knowledge production function is the primary theoretical model for studying regional innovation activities. In this study, we prefer to use the model constructed from Jaffe et al. (1993) knowledge production function and the model shown below.
A denotes the Hicks-neutral knowledge production function. Influenced by path dependence and cumulative effects, technological innovation output depends mainly on the output level of the previous period, introducing the first-order lag term of innovation efficiency.
Secondly, in the process of industrial cluster development, the industrial cluster effect will reduce the marginal production cost, enhancing the regional production efficiency and improving the RIC. When there is the crowding effect in the industrial cluster, it will increase the regional production factor cost and cost of living (Jiang et al., 2023), reducing the regional production efficiency and hindering the RIC. Therefore, the industrial cluster and the RIC will be a quadratic function relationship. In order to test whether there is a crowding effect, introducing the squared term of the logarithm of the industrial cluster value into the model, and the model is as follows:
Lneffit is for the innovation capability of region i in period t, lqit denotes for the high-tech cluster in region i in period t, Xit is the control variable, α0, α1, α2, α3 and λ are the corresponding coefficients to be estimated, υit and μit denote individual fixed effects and time fixed effects, respectively, and εit is the random disturbance term.
In addition, given that the relationship between the high-tech cluster and innovation capability is not only purely linear, there may also be nonlinear correlation effects, while the traditional linear model is difficult to identify the complex nonlinear relationship. Therefore, in order to explore in detail the effect of the high-tech cluster on innovation capability in different threshold ranges, the panel threshold model proposed by Hansen (1999) is referred to. We try to verify that the role of the high-tech cluster on RIC, as pointed out above, may be influenced by the regional economic development level. A panel threshold model is constructed by using GDP density (Zeng et al., 2017) to measure the economic development level as a threshold variable and the high-tech cluster as the core explanatory variable. The model was set as follows:
Where I (•) is the threshold indicator function that will segment the sample according to the threshold value. The threshold variable is the level of economic development (lngdp), Xit is the control variable, and εit is the random disturbance term.
Finally, in order to further discuss the spatial spillover effect of the high-tech cluster on innovation capability, a dynamic SDM including both temporal and spatial effects (Debarsy et al., 2012; Elhorst, 2012; Ren et al., 2021) is constructed on the basis of Equation 2.
lneffi,t-1 is the time-lagged term of RIC to analyze its inertia effect and dynamic changes. When α1,δ1 = 0 is the static spatial panel data model. ρ represents the spatial autoregressive coefficient, and W is the n×n dimensional spatial weighting matrix. In the selection of the spatial weight matrix, we employ the spatial weight matrix W1 of geographic-economic distance considering the geographic distance and economic factors for estimation (Huang et al., 2021).
Where: dij is the distance between city i and city j. Y in the diagonal element is the annual average value of GDP per capita of region i during the period under examination; Y is the average value of GDP per capita of all regions during the period under examination.
3.2 Variable selection and data sources
3.2.1 Measurement of innovation capability
The quantitative index of innovation capacity is usually expressed by innovation efficiency, which is used in this paper to express innovation capacity (eff). Innovation efficiency is the ratio between the increased regional economic value and innovation input in a certain period of time, and most of the existing literature uses the data envelopment analysis (DEA) method to measure it. This is a non-parametric analysis method for the relative efficiency measurement between multiple factor inputs and outputs, which can solve the problem of inconsistent input and output units. However, it cannot take into account the input-output slackness, making the measure of efficiency values less accurate. Therefore, most studies have started to use the non-radial, non-angular SBM model to reasonably and effectively solve the problem of non-zero slackness between inputs or outputs. However, the efficiency values measured by the SBM model can appear that the efficiency values of multiple DMUs are all shown to be 1, i.e., multiple DMUs are at the same frontier surface optimum. Therefore, this paper uses the super-SBM model proposed by Tone (2002) to measure innovation efficiency to represent innovation capability, which allows the efficiency value of DMUs to exceed 1.
The accuracy of innovation efficiency measurement is mainly affected by the selection of input and output indicators. Based on the existing research studies, this paper takes nine cities in Wuhan Metropolitan Area from 2010 to 2019 as the research objects and sets input indicators as the number of high-tech industries, the number of RandD personnel, internal expenditure of RandD funds and funds from government departments for science and technology activities, and the expected outputs as the number of patents approved, the value added of high-tech industries The expected outputs are the number of patents approved, the value added of high-tech industry, the value of export delivery of high-tech industrial products and the sales revenue of new products.
The research data are obtained from the city statistical yearbook of each city and the national economic and social development report, and some data are passed through the Hubei Provincial Statistical Yearbook, the China Torch Statistical Yearbook, and the statistical bulletin of each city. The missing data of export delivery value and new product sales revenue of high-tech industries in Qianjiang, Xiaogan and Huanggang cities in 2019 were completed using the linear interpolation method.
3.2.2 Core explanatory variables
The studies usually measure The degree of the industrial cluster through location quotient (lq). British academics Haggett (Xu et al., 2018) first developed this method and applied it to regional analysis. It is often used to indicate the degree of concentration of a specific industry in a specific region. The concentration of a specific industry is generally measured by the number of enterprise units, gross industrial product, product sales revenue and other indicators. However, there are micro differences in the scale of operation, business performance and revenue capacity of enterprises. We consider that not all indicators are available, so we chose the new product sales revenue of the high-tech industry in the Wuhan Metropolitan Area as the index of industrial agglomeration, and the calculation formula is:
Where lqi is the clustered index of high-tech industry in the city i, Xi is the new product sales revenue of high-tech industry in city i,
If lqi > 1, it indicates that the high-tech industry is relatively concentrated in city i, and the level of the high-tech cluster exceeds the average level of the region; If lqi < 1, it indicates that the high-tech cluster in city i is lower than the average level of the region. The bigger lq means a higher degree of clustering in the corresponding region, with relative scale advantage and faster industrial development.
3.2.3 Control variables
To improve the accuracy of regression results, this paper adds the level of government intervention (gov), RandD capability (randd), degree of financial development (fi), degree of competitive intensity (comep) and knowledge intensity (kd) as control variables.
① Level of government intervention (gov): For a long time, the government mainly used fiscal expenditure to promote industrial development and economic construction. The proportion of local fiscal expenditure to GDP indicates the degree of local government intervention.
② RandD capability (randd): the improvement of randd capability brings about accelerated technological progress. Using the randd of the Wuhan Metropolitan Area to measure The ratio of the randd of each region.
③ The degree of financial development (fi): financial development brings down the cost of financing, which to a certain extent increases the capital investment for technological improvement and thus promotes technological innovation. The ratio of the deposit balance of financial institutions to GDP at the end of the year measures the degree of financial development.
④ Intense competition (comep): Enterprise competition can promote continuous innovation. On the other hand, excessive competition causes a waste of resources. The regional high-tech industry density is measured as a percentage of industry density in urban areas.
Where qit is the number of high-tech industries, si is the region’s area, and S is the total area of the Wuhan Metropolitan Area.
⑤ Knowledge intensity (kd): A region with higher knowledge intensity implies a stronger sense of innovation and innovation values and the more conducive to improving RandD efficiency. The number of patents granted per 10,000 people is used to measure the regional knowledge intensity.
The data of the study were obtained from the China City Statistical Yearbook, the city statistical yearbooks of each city and the national economic and social development reports, and some data were supplemented by the Hubei Statistical Yearbook, the China Torch Statistical Yearbook, the statistical bulletins of each city and CSMR.
4 Empirical analysis
4.1 Characteristic facts of the RIC
Based on the above analysis in this paper, the innovation capacity and high-tech cluster values of the Wuhan Metropolitan Area from 2010–2019 are measured, and the mean values of these two in the study period are calculated (Figure 1), which reflect the overall cluster level of high-tech industry and RIC of Wuhan Metropolitan Area to some extent through the high and low innovation efficiency values and cluster values.
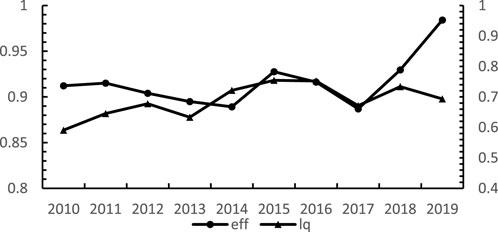
FIGURE 1. Average of RIC and high-tech cluster level in Wuhan Metropolitan Area.
First of all, during the study period, the overall innovation capacity of the Wuhan Metropolitan Area is on an upward trend, with an overall “W”-shaped fluctuation trend of “slow decline-short rise-shortfall-then rapid rise”: from 2011 to 2014, the innovation capacity of Wuhan Metropolitan Area slowly declined from 0.915 to 0.881. From 2011 to 2014, the innovation capacity of the Wuhan Metropolitan Area slowly declined from 0.915 to 0.881, which is an important period of industrial structure upgrading and transformation in Hubei Province during the 12th Five-Year Plan, and the adjustment of industrial structure may be the reason for the slight decline of innovation capacity. From 2016 to 2019, the innovation capacity showed a “V" shape, with a short decline in 2016, when the 13th Five-Year Plan was underway, and the new normal policy continued to focus on structural adjustment and transformation of production methods, which affected the innovation capacity of the industry in that year. However, after 2017, it rose rapidly for three consecutive years to reach 0.98 in 2019.
Secondly, the average industrial cluster level in the decade of 2010–2019 is below 1, showing a continuous “M" type trend, and each time it rises, it will experience a short decline, and the cluster level is in an upward trend before 2016, and tends to rise after experiencing a decline in 2017. Finally, in terms of the relationship between industrial cluster and innovation capacity, the two trends converge, but in 2019 they diverge significantly, which indicates that the influence of high-tech industrial cluster level on innovation capacity in the Wuhan Metropolitan Area is beginning to weaken.
4.2 Spatial characteristics of the RIC
In Figure 2, this paper further draws the spatial distribution of the RIC levels in the Wuhan Metropolitan Area from 2010 to 2019, in order to visually analyze the distribution of RIC levels in various cities. According to the changes in RIC levels, we applied the natural break point method to classify the RIC levels into five types: low, lower, moderate, high, and higher. As can be seen from Figure 2, the RIC of cities in the Wuhan Metropolitan Area from 2010 to 2013 is dominated by moderate, lower and low; the RIC level from 2016 to 2019 is dominated by Higher. Wuhan, as the core city of the Wuhan metropolitan area, is far ahead of the surrounding cities in terms of its level of RIC development, which has a radiation-driven effect on the RIC development of the surrounding cities. But as seen in Figure 2, the RIC of Xiaogan and Huanggang is still low.
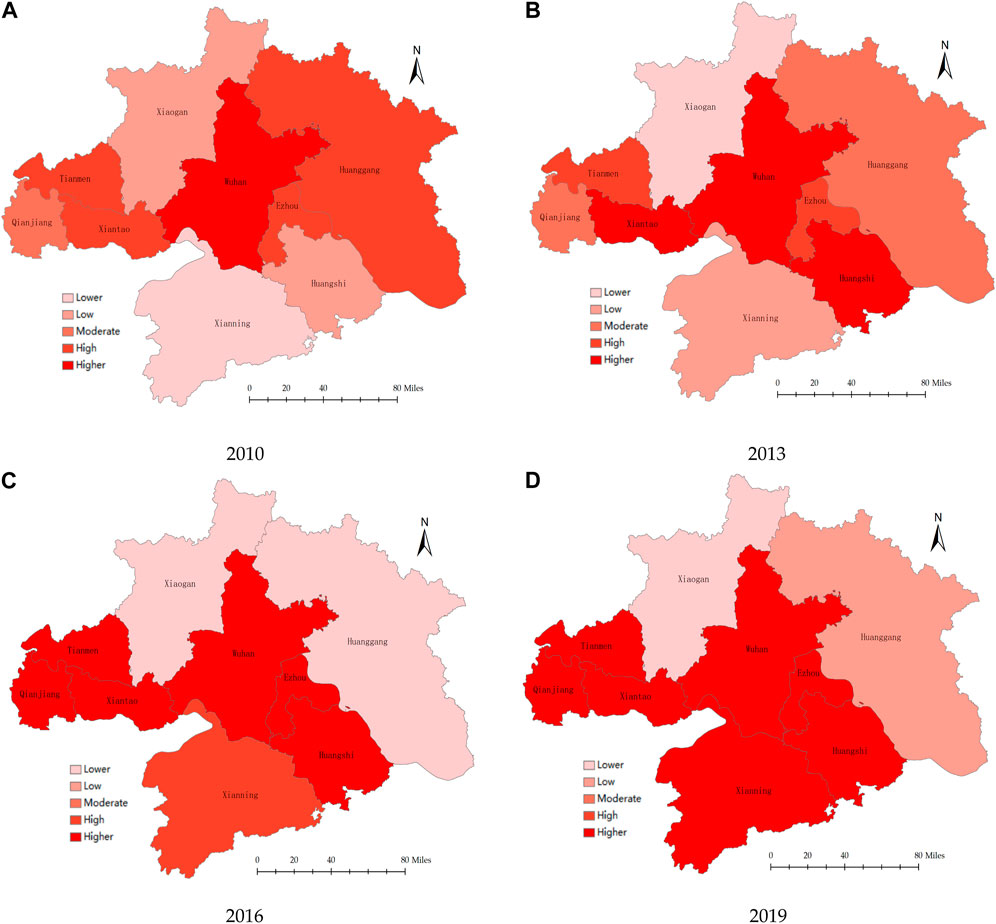
FIGURE 2. Spatial distribution of RIC in the Wuhan Metropolitan Area. (A) 2010. (B) 2013. (C) 2016. (D) 2019.
4.3 Threshold effect analysis
In this part, we use the panel threshold model proposed by Hansen (1999) to test whether there is a non-linear relationship between high-tech industry clustering and RIC under the influence of economic development level? The estimation process is as follows.
4.3.1 Threshold effect test
Table 1 shows the threshold values, F-values and critical values of variables at different significant levels. Table 1 shows that if the level of economic development is used as the threshold variable, the single threshold and the double threshold pass the significance test, the corresponding threshold values are −1.7460 and −1.2437, respectively.
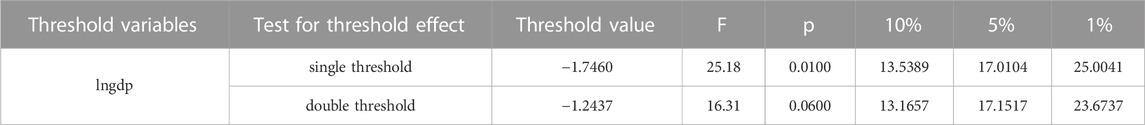
TABLE 1. Results of the threshold effect test.
4.3.2 Estimation of the threshold model
On the basis of the threshold effect significance test passed, this paper empirically tested the non-linear effect of the high-tech cluster on innovation capability based on the panel threshold regression estimation method, and the estimation of relevant parameters is shown in Table 2. When the economic development level is below the lower threshold value of −1.7460, the effect of the high-tech cluster on innovation capacity is positive but not significant. This indicates that there is an aggregation bottleneck at this point, i.e., the role of the high-tech cluster in promoting innovation capability is not significant at low levels. When the economic development level is between −1.7460 and −1.2437, the regression coefficient of the high-tech cluster is 0.276, which plays a significant role in promoting innovation capability, and it is significant at a 1% significant level. When the economic development level crosses −1.2437, the regression coefficient of the high-tech cluster decreases to 0.157.
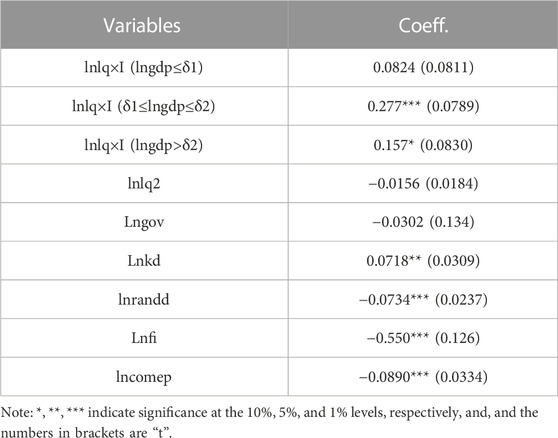
TABLE 2. Estimation results of the parameters of the panel threshold model.
From the regression estimation results, it can be concluded that when the level of economic development is in the first interval, i.e., within the low interval, the impact of the high-tech cluster on innovation capability presents a non-significant positive boosting effect; when the level of economic development is in the second interval, i.e., within the middle interval, the impact of the high-tech cluster on innovation capability presents a significant positive boosting effect; when the level of economic development is in the When the economic development level is in the third interval, i.e., in the higher interval, the impact of the high-tech cluster on innovation capacity still shows a significant positive promotion effect, and this positive effect is weakened compared with the second interval.
Combining the three interval bands, the effect of the high-tech cluster on innovation capability is not linearly distributed from 2010 to 2019, but there is a non-linear double threshold effect based on the level of economic development, and it shows a certain promotion effect overall, but there is a marginal decreasing effect. It may be that with the increase in the level of economic development, the increase in the concentration of high-tech industries gradually produces a crowding effect. In addition, among the control variables, knowledge intensity has a positive promoting effect on RIC, and the degree of competitive intensity, RandD capability, level of government intervention and degree of financial development all have a negative inhibiting effect on RIC, but the negative effect of the level of government intervention is not significant. Among them, the significant suppression of innovation capability by the intensity of competition indicates that there is excessive competition wasting resources in high-tech industries in Wuhan Metropolitan Area. The RandD capability is significantly negative, indicating the weak RandD capability in Wuhan Metropolitan Area. Meanwhile, the degree of financial development and the level of government intervention both show a negative relationship with innovation capability, which is consistent with Guan ad Chen (2010), indicating that for the stronger innovation capability and the greater innovation demand, enterprises are more willing to invest in research, develop new technologies and new products rather than relying on government support and good financial However, the support from the government and financial institutions is especially important for enterprises whose innovation activities are in the initial stage.
4.4 Spatial autocorrelation analysis
Before constructing the spatial econometric model, it is necessary to check whether there is spatial autocorrelation of the explanatory variable innovation ability. According to the Moran’s I index (Anselin, 1988) in Table 3, the years 2010–2014 all failed the significance level test, and the Moran’s I index from 2015–2019 all passed the significance test. It shows that the innovation capability of advanced technology industries in the Wuhan Metropolitan Area was in a spatially random distribution from 2010–2014, which transformed into a significant positive spatial correlation in 2015–2019, which shows a stable spatial autocorrelation with the increase of time in the study period.

TABLE 3. Global Moran’s I index of Innovation Capacity.
In order to more intuitively and in-depth analyze the spatial corre-lation of RIC, this paper draws Moran’ I scatter plot of RIC of 9 cities in the Wuhan Metropolitan Area in partial years. According to the Moran’ I scatter plot in Figure 3, the cities in the Wuhan Metropolitan Area were located in the H-H, L-H and H-L regions at the end of the Plan, i.e., 2010, and mainly in the H-H region in 2019, indicating that the “H-H″ cluster effect is expanding and the high-efficiency cities are driving the improvement of the innovation capacity of neighbouring cities. Xiaogan City and Huanggang City are still in the H-L type region in 2019, probably because they are in the edge structure of the Wuhan Metropolitan Area and have lower intensity of the external connection. In the future, it is an important direction to continue to strengthen the radiation-driven role of high-efficiency cities of high-tech industrial technology innovation in the Wuhan Metropolitan Area to the surrounding low-level areas and accelerate the prominence of spatial spillover effects.
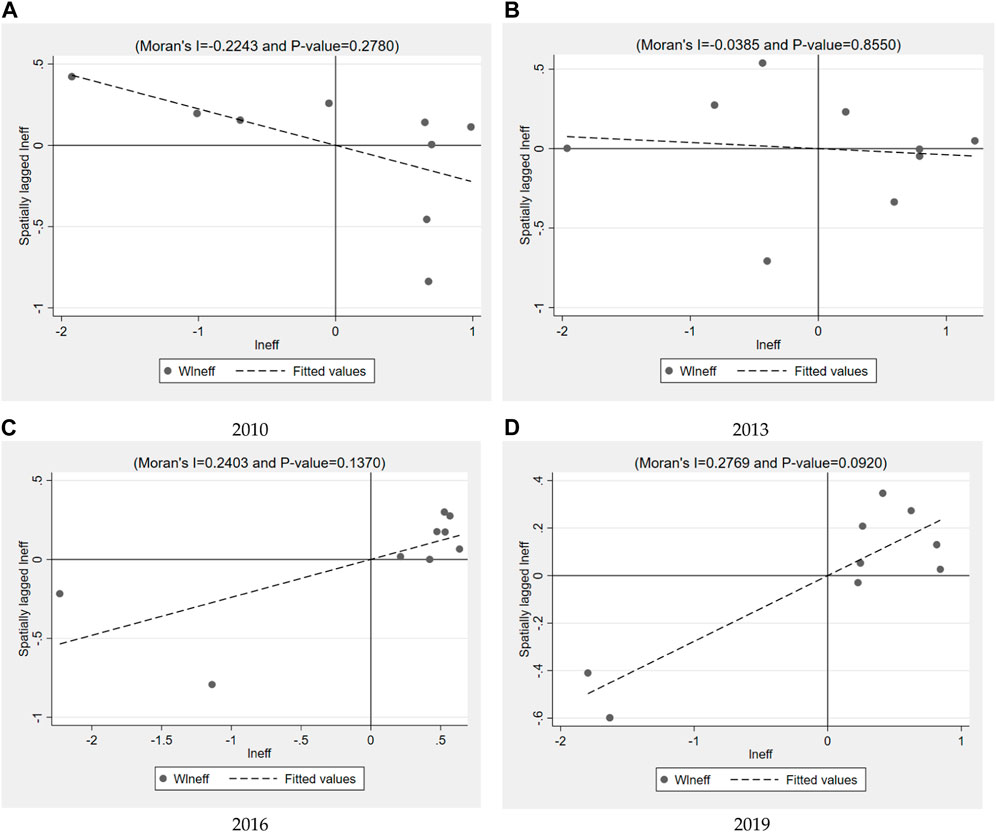
FIGURE 3. Moran scatter plot of lneff in different periods. (A) 2010. (B) 2013. (C) 2016. (D) 2019.
5 Regression results
5.1 Selection of the best model
For comparative analysis, the ordinary dynamic panel model, static spatial panel model, and dynamic spatial panel model are used for estimation. We conduct a series of tests to select the most suitable econometric model. Specifically, we apply the LR test and Wald test to test whether the SDM is appropriate, and use the LM test and its robustness test to judge whether the SDM is a better model.
From the results of the dynamic spatial panel model in Table 4, it can be seen that the coefficients of the time-lagged term and the space-lagged term of innovation capability are 0.243 and −0.233, respectively, where the coefficient of the time-lagged term passes the 1% significance test and the coefficient of the spatial-lagged term fails the significance test. This indicates that innovation capability has a significant circular cumulative time effect, i.e., there is a time-dependent characteristic of innovation capability, and the level of innovation capability in past periods cannot be ignored. The coefficient of the time lag term is positive, which means that the innovation ability will be improved with the progress of its own past periods. With comprehensive theoretical analysis and statistical test results, this paper is mainly based on the regression results of model 3) for interpretation and subsequent analysis.
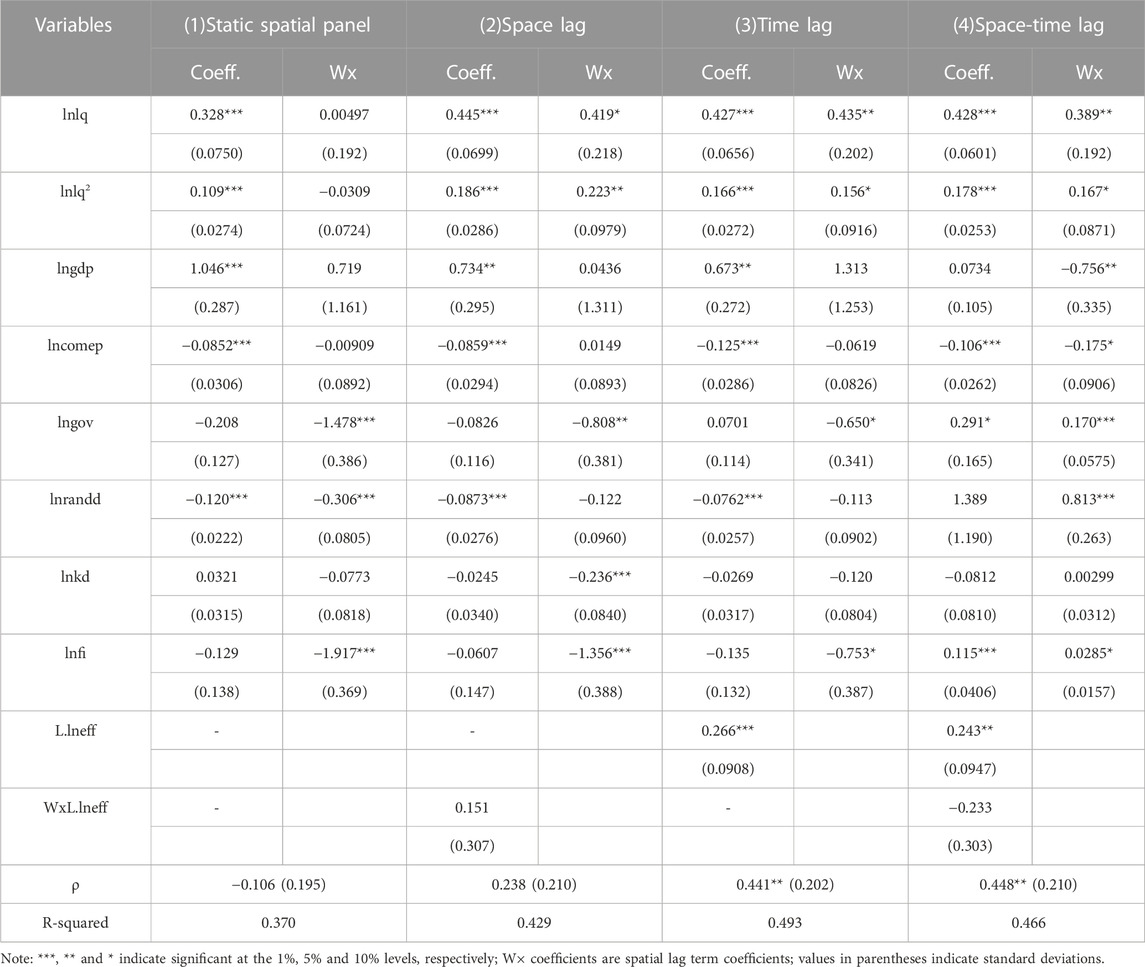
TABLE 4. Spatial econometric model regression estimation results.
From the regression results of model 3), the coefficients of both primary and secondary terms of high-tech cluster values are positive at 1% level, which indicates the “U" curve relationship between the high-tech cluster and RIC. With the help of Lind and Mehlum (2010), the lowest point of the “U" curve is −1.27, and the value of lnlq is in the range of [-2.80, 0.32], and the extreme point is within the data range and can be rejected at the 5% statistical level. The original hypothesis of the “U" type relationship. Combined with the level of the high-tech cluster in each region, by 2013, all study regions were on the right side of the lowest point of the “U" curve, i.e., the high-tech cluster has a significant role in promoting innovation capacity, which indicates that the construction of high-tech industry is vigorously promoted in each region to achieve innovation development so that high-tech cluster does not There is no crowding effect. However, in 2016, Ezhou and Tianmen were on the left side of the lowest point of the “U" curve, and the clustering of high-tech industries in these two places had a crowding effect.
In addition, the coefficients of the spatial lag term of the high-tech cluster value are significantly positive, and the coefficients of the spatial lag term of its square term are significantly positive, which indicates that the spillover effect of the high-tech cluster on the innovation capacity of neighboring regions shows a positive “U"-shaped relationship. Therefore, according to the results of the panel threshold model and the spatial econometric model, there is a certain promotion effect of high-tech industries on innovation capacity, but there is a marginal decreasing effect. Meanwhile, the estimated values of spatial spillover effect coefficients of primary and secondary terms of high-tech industry aggregation are 0.419 and 0.223, indicating that high-tech industry aggregation has a promoting effect on the innovation capacity of neighboring regions, indicating that high-tech industry in Wuhan Metropolitan Area forms industrial linkage and has the advantages of factor aggregation and division of labor cooperation brought by industrial aggregation. As for the control variables, the direction and significance of the influence of each control variable on RIC in the threshold model and spatial panel model test remain basically the same, and the influence coefficients are also close. This makes the estimation results more robust and also makes the research conclusions of this paper more reliable.
5.2 Spatial spillover effects
Notably, it is worth noting that the direct interpretation of the coefficient values of the variables in Table 4 is not rigorous enough. So, to further analyze the spatial impact of high-tech cluster on RIC, this paper breaks down the spatial effect with the help of a partial differential equation. Model 3) has its spatial auto regressive coefficient significant at 1% level, and its coefficient is 0.441, which is positive, indicating that the explanatory variables have positive spatial spillover effects on themselves and the spatial interaction of economic activities of cities in Wuhan Metropolitan Area should be considered. The direct effect, indirect effect and total effect of the model 3) were summarized with reference to Lesage and Pace’s (2009) approach, and the results are shown in Table 5, where the direct effect reflects the degree of the independent variable’s contribution to innovation capability, the indirect effect mainly reflects the spatial spillover effect, and the total effect mainly reflects the degree of the combined effect of the direct and indirect effects on innovation capability. The results indicate that, for both of the squared term of high-tech cluster and agglomeration we adopted in this study, the direct (intra-regional) spillovers and indirect (inter-regional) spillovers present very different spatial increase pattern. They has a significant promoting effect on the innovation development of the Wuhan Metropolitan Area, but the technology spillover effect on the neighboring area cities is limited.
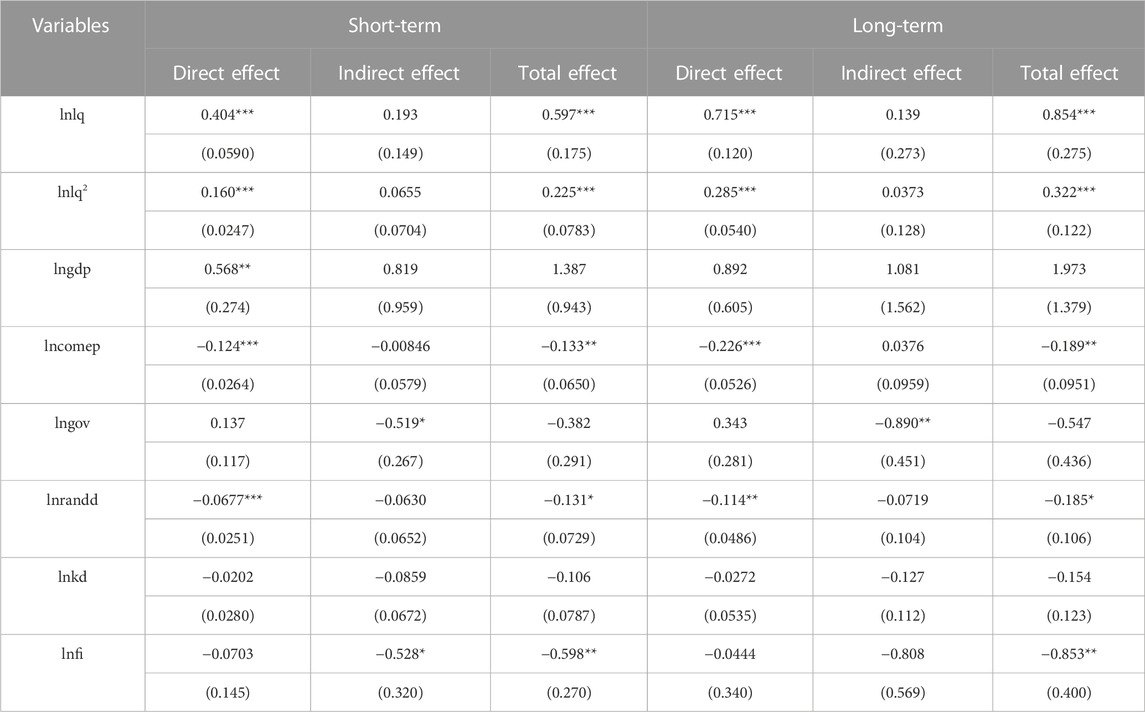
TABLE 5. Total, direct and indirect effects of the spatial econometric model.
We argue that possible explanation is as follows: Many high-tech clusters in the Wuhan Metropolitan Area are mainly carried by high-tech industrial parks or development zones. These high-tech clusters are not formed by the allocation of production factors according to market and economic laws, but are formed by the local government. This so-called high-tech cluster is still a phenomenon of “clustering” does not promote the connection between enterprises in neighbor regional, nor does it give play to the spillover effect of knowledge and technology.
5.3 Robustness test
The above study mainly uses the spatial geographic-economic weight matrix as the spatial weight matrix, and this paper uses the geographical distance spatial weight matrix (W2) and the economic spatial weight matrix (W3) (Huang et al., 2021) for robustness testing. After the LM test, Wald test and LR test, the spatial Durbin model is still applicable, and the results are shown in Table 6. And although the magnitudes of the coefficients of the estimated results differed, their directions and significance levels remained largely unchanged fundamentally. This also indicates that the results of the study are robust and reliable.
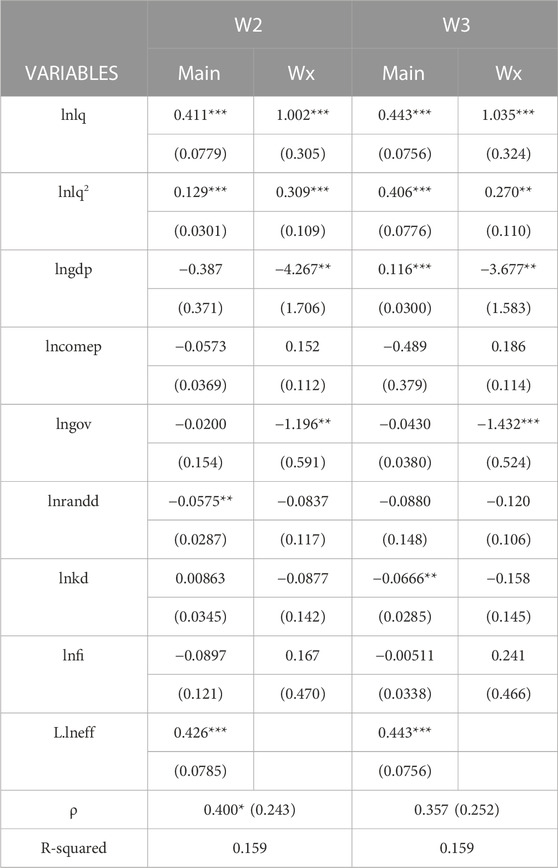
TABLE 6. Robustness test with different matrices.
6 Conclusion, policy recommendations and future research
6.1 Conclusion
The Wuhan Metropolitan Area is one of the earliest comprehensive reform pilot area of high-tech cluster. Authorities have issued a number of plans in recent decades to build the Wuhan Metropolitan Area as a new growth engine for regional innovation, especially in the central China and the Yangtze River Economic Bel. Similar to many other cities, this region transformed its economic strategy from factor- and investment-driven to innovation-driven, which may play an important role in promoting RIC.
Based on the panel data of nine cities in the Wuhan Metropolitan Area from 2010 to 2019, this paper constructs a super-SBM model to measure their RIC, measures the degree of the high-tech cluster by using a location quotient, and constructs a panel threshold model and a spatial econometric model to investigate the effect of the high-tech cluster on RIC.
First, the regional innovation capability of the Wuhan Metropolitan Area shows a rising trend of “W"-shaped fluctuation on the whole. The clustering level of high-tech industries in the Wuhan Metropolitan Area is below 1, which indicates that the distribution of high-tech industries in the Wuhan Metropolitan Area is relatively scattered and should be guided to change to the direction of the scale (Liu et al., 2019).
Second, there is a non-linear double threshold effect between high-tech industry clustering and RIC in the Wuhan Metropolitan Area based on the level of economic development, but there is a marginal decrease. When the economic development level is in the first threshold interval, the high-tech cluster shows a non-significant positive effect on innovation capability, and as the economic development level further increases, the effect of the high-tech cluster on innovation capability is a significant homogeneous promotion effect, and the positive promotion effect of the high-tech cluster on innovation capability weakens when the economic development level crosses the second threshold.
Thirdly, the regional innovation capability of the Wuhan Metropolitan Area has a significant circular accumulation effect and spatial correlation, and the high-tech cluster has a significant positive spatial promotion effect on regional innovation capability, and there is spatial and temporal heterogeneity. After considering the spatial effect, the impact of the high-tech cluster on the innovation capacity of both local and neighboring areas shows a “U" curve, but the technology spillover to neighboring areas is limited.
Finally, there is a marginal decreasing promotion effect of the high-tech cluster on RIC, which may be due to the crowding effect in some regions (Jiang et al., 2023). The expansion of cluster scale causes the crowding effect or undesirable competition effect under the limited environmental resources and certain spatial carrying capacity, and the excessive competition causes the waste of resources and hinders the enhancement of the innovation capacity of the high-tech industry.
6.2 Policy recommendations
In light of the empirical findings, combined with the innovation development background of in China. We propose the following policy recommendations in order to strengthen the positive externalities of the high-tech cluster and thus enhance the RIC, finally provide a constant source of innovative power for the development of Wuhan city circle and even central China.
Firstly, the growth of RIC in the Wuhan Metropolitan Area is highly volatile, and at the same time, the innovation capacity also has a significant circular accumulation effect. Therefore, when formulating policies that affect the high-tech industry, the long-term impact of the policies should be fully considered. We should not be too rigid about the current effect of the policy but grasp and utilize the cyclic cumulative effect of the RIC and make use of the “leverage effect” of the innovation capacity and other influencing factors to achieve the best development of regional innovation in Wuhan Metropolitan Area with the least intervention. At mean time, the government should strengthen the development level of high-tech industry clusters. and we should guide the standardized competition and cooperation among high-tech enterprises, form a mature high-tech industrial cluster gradually. Because the scale and concentration of high-tech clusters can effectively accelerate the speed of knowledge and technology diffusion and transformation, reduce the cost of information transfer and search, make the exchange mode of knowledge and technology more specialized and efficient, and help improve the innovation capacity (Pan et al., 2018; Yum, 2019) and then promote the high-quality development of regional innovation through high-tech industry cluster.
Secondly, the relationship between high-tech industry clustering and RIC should be dealt with scientifically and dynamically, and differentiated response strategies should be implemented according to the different levels of regional economic development. Under different levels of economic development, the high-tech cluster shows different effects on innovation capacity. At the same time, the impact of the high-tech cluster on innovation capacity shows a “U" shaped curve. Local governments should take into account the actual economic development and high-tech industry situation when developing regional innovation and should not blindly copy the unified development model (Liu et al., 2019). Ezhou and Tianmen should actively investigate and analyze the reasons for the negative effects of high-tech industry clustering and reasonably adjust the layout of the high-tech industry. The innovative construction of the Wuhan Metropolitan Area should not simply continue the core-edge development model but should promote the construction of the Wuhan Metropolitan Area innovation synergy development. While the core city of Wuhan “siphons” capital and high-quality labor from neighboring areas, it should also increase the “feeding” efforts to neighboring areas, promote the two-way flow of resources, release the innovation dividend at the right time, and narrow the regional differences.
6.3 Future research
There are at least three aspects that can be further explored in the future. First, the government has issued many policy documents to promote the clustering of high-tech in the Wuhan Metropolitan Area. Future research can consider the impact of regionally relevant policies on high-tech cluster and high-tech innovation capacity. Second, Many cities in China are starting to take advantage of the co-agglomeration effect which is transform their economic strategies from a focus on developing manufacture industries to industrial co-agglomeration (Zheng and He, 2022), especially in the integrated development of producer services and high-tech manufacturing (Peng et al., 2022) Future studies can explore the two industries’ co-agglomeration on RIC. Third, Future research can go deeper in study the relationship between high-tech and high-quality economic development (Zheng and He, 2022), including green innovation (Liu et al., 2019), carbon emission reduction (Edziah et al., 2022), and energy efficiency (Liu et al., 2023).
Data availability statement
The original contributions presented in the study are included in the article/Supplementary Material, further inquiries can be directed to the corresponding author.
Author contributions
JB: Conceptualization, writing-review and editing; YL: Software, methodology, resources data curation, writing. All authors contributed to the article and approved the submitted version.
Conflict of interest
The authors declare that the research was conducted in the absence of any commercial or financial relationships that could be construed as a potential conflict of interest.
Publisher’s note
All claims expressed in this article are solely those of the authors and do not necessarily represent those of their affiliated organizations, or those of the publisher, the editors and the reviewers. Any product that may be evaluated in this article, or claim that may be made by its manufacturer, is not guaranteed or endorsed by the publisher.
Supplementary material
The Supplementary Material for this article can be found online at: https://www.frontiersin.org/articles/10.3389/fenvs.2023.1180781/full#supplementary-material
References
Alecke, B., Alsleben, C., Scharr, F., and Untiedt, G. (2006). Are there really high-tech clusters? The geographic concentration of German manufacturing industries and its determinants. Ann. Regional Sci. 40, 19–42. doi:10.1007/s00168-005-0014-x
Anselin, L. (1988). Spatial econometrics: Methods and models. Berlin, Germany: Springer Science and Business Media. doi:10.1007/978-94-015-7799-1_2
Beule, F. D., and Beveren, I. V. (2010). Does firm agglomeration drive product innovation and renewal? Soc. Sci. Electron. 103 (4), 457–472. doi:10.5465/amr.1996.9704071867
Carlino, G. A., Chatterjee, S., and Hunt, R. M. (2007). Urban density and the rate of invention. J. Urban Econ. 61 (3), 389–419. doi:10.1016/j.jue.2006.08.003
Charoenrat, T., and Harvie, C. (2014). The efficiency of SMEs in Thai manufacturing: A stochastic frontier analysis. Econ. Model. 43, 372–393. doi:10.1016/j.econmod.2014.08.009
Chung, D., Jung, H., and Lee, Y. (2022). Investigating the relationship of high-tech entrepreneurship and innovation efficacy: The moderating role of absorptive capacity. Technovation 111, 102393. doi:10.1016/j.technovation.2021.102393
Cooke, P. (1992). Regional innovation systems: Competitive regulation in the new europe. Geoforum 23 (3), 365–382. doi:10.1016/0016-7185(92)90048-9
Debarsy, N., Ertur, C., and LeSage, J. P. (2012). Interpreting dynamic space-time panel data models. Stat. Methodol. 9 (1-2), 158–171. doi:10.1016/j.stamet.2011.02.002
DSTHP (2022). Department of science and technology of Hubei province (DSTHP), innovative industrial cluster management in Hubei province (for trial implementation). Available at: https://kjt.hubei.gov.cn/zfxxgk_GK2020/zc2020/gfxwjj/202204/t20220412_4079098.shtml.
Edziah, B. K., Sun, H., Adom, P. K., Wang, F., and Agyemang, A. O. (2022). The role of exogenous technological factors and renewable energy in carbon dioxide emission reduction in Sub-Saharan Africa. Renew. Energy 196, 1418–1428. doi:10.1016/j.renene.2022.06.130
Elhorst, J. Paul. (2012). Dynamic spatial panels: Models, methods, and inferences. J. Geogr. Syst., 14.1: 95–119. doi:10.1007/978-3-642-40340-8_4
Fan, P., Wan, G., and Lu, M. (2012). China's regional inequality in innovation capability, 1995–2006. China World Econ. 20 (3), 16–36. doi:10.1111/j.1749-124x.2012.01285.x
Fang, C. L., and Yu, D. L. (2017). Urban agglomeration: An evolving concept of an emerging phenomenon. Landsc. Urban Plan. 162, 126–136. doi:10.1016/j.landurbplan.2017.02.014
Freeman, C. (1987). Technology, policy, and economic performance: Lessons from Japan. London, United Kingdom: Burns and Oates.
Fritsch, M., and Slavtchev, V. (2010). How does industry specialization affect the efficiency of regional innovation systems? Ann. Regional Sci. 45, 87–108. doi:10.1007/s00168-009-0292-9
Fujita, M., and Tabuchi, T. (1997). Regional growth in postwar Japan. Regional Sci. Urban Econ. 27 (6), 643–670. doi:10.1016/s0166-0462(96)02167-9
Furman, J. L., Porter, M. E., and Stern, S. (2002). The determinants of national innovative capacity. Res. policy 31 (6), 899–933. doi:10.1016/s0048-7333(01)00152-4
Gu, W., Wang, J., Hua, X., and Liu, Z. (2020). Entrepreneurship and high-quality economic development: Based on the triple bottom line of sustainable development. Int. Entrepreneursh. Manag. J. 17 (1), 1–27. doi:10.1007/s11365-020-00684-9
Guan, J., and Chen, K. (2010). Measuring the innovation production process: A cross-region empirical study of China's high-tech innovations. Technovation 30 (5-6), 348–358. doi:10.1016/j.technovation.2010.02.001
Guo, R., Cai, L., and Fei, Y. (2019). Knowledge integration methods, product innovation and high-tech new venture performance in China. Technol. analysis strategic Manag. 31 (3), 306–318. doi:10.1080/09537325.2018.1500688
Hansen, B. E. (1999). Threshold effects in non-dynamic panels: Estimation, testing, and inference. J. Econ. 93 (2), 345–368. doi:10.1016/s0304-4076(99)00025-1
Hu, M. C., and Mathews, J. A. (2008). China's national innovative capacity. Res. policy 37 (9), 1465–1479. doi:10.1016/j.respol.2008.07.003
Huang, H., Wang, F., Song, M., Balezentis, T., and Streimikiene, D. (2021). Green innovations for sustainable development of China: Analysis based on the nested spatial panel models. Technol. Soc. 65, 101593. doi:10.1016/j.techsoc.2021.101593
Irfan, M., Razzaq, A., Sharif, A., and Yang, X. (2022). Influence mechanism between green finance and green innovation: Exploring regional policy intervention effects in China. Technol. Forecast. Soc. Change 182, 121882. doi:10.1016/j.techfore.2022.121882
Jaffe, A. B., Trajtenberg, M., and Henderson, R. (1993). Geographic localization of knowledge spillovers as evidenced by patent citations. Q. J. Econ. 108 (3), 577–598. doi:10.2307/2118401
Jiang, H., Chen, Z. H., Zhao, W. C., Wang, F. Y., Xia, J., and Chen, Z. Y. (2023). Toward carbon neutrality: The impact of manufacturing agglomeration on total factor energy efficiency. Front. Environ. Sci. 11. doi:10.3389/fenvs.2023.1132294
Jiang, H., Liang, Y., and Pan, S. (2022). Foreign direct investment and regional innovation: Evidence from China. World Econ. 45 (6), 1876–1909. doi:10.1111/twec.13205
Jin, L., Duan, K., Shi, C., and Ju, X. W. (2017). The impact of technological progress in the energy sector on carbon emissions: An empirical analysis from China. Int. J. Environ. Res. Public Health 14 (12), 1505. doi:10.3390/ijerph14121505
Kesidou, E., and Romijn, H. (2008). Do local knowledge spillovers matter for development? An empirical study of Uruguay's software cluster. World Dev. 36 (10), 2004–2028. doi:10.1016/j.worlddev.2008.01.003
Ketels, C. (2003). “The Development of the cluster concept–present experiences and further developments,” in NRW Conference on Clusters, Duisburg, Germany, 5 Dec 2003.
Kumar, R. S., and Subrahmanya, M. B. (2010). Influence of subcontracting on innovation and economic performance of SMEs in Indian automobile industry. Technovation 30 (11-12), 558–569. doi:10.1016/j.technovation.2010.06.005
LeSage, J., and Pace, R. K. (2009). Introduction to spatial econometrics. Boca Raton: Chapman and Hall/CRC. doi:10.1111/j.1468-0084.2009.00569.x
Li, H., Zhang, J., Wang, C., Wang, Y., and Coffey, V. (2018). An evaluation of the impact of environmental regulation on the efficiency of technology innovation using the combined DEA model: A case study of xi'an, China. Sustain. Cities Soc. 42, 355–369. doi:10.1016/j.scs.2018.07.001
Li, J., Strange, R., Ning, L., and Sutherland, D. (2016). Outward foreign direct investment and domestic innovation performance: Evidence from China. Int. Bus. Rev. 25 (5), 1010–1019. doi:10.1016/j.ibusrev.2016.01.008
Li, X. (2009). China's regional innovation capacity in transition: An empirical approach. Res. policy 38 (2), 338–357. doi:10.1016/j.respol.2008.12.002
Lind, J. T., and Mehlum, H. (2010). With or without U? The appropriate test for a U-shaped relationship. Oxf. Bull. Econ. statistics 72 (1), 109–118. doi:10.1111/j.1468-0084.2009.00569.x
Liu, C., Gao, X., Ma, W., and Chen, X. (2019). Research on regional differences and influencing factors of green technology innovation efficiency of China's high-tech industry. J. Comput. Appl. Math. 369, 112597. doi:10.1016/j.cam.2019.112597
Liu, F., Sim, J. Y., Edziah, B. K., Sun, H., Sarkodie, S. A., and Adom, P. K. (2023). Machinery import, R&D spillover, and energy efficiency. J. Environ. Plan. Manag. 2023, 1–22. doi:10.1080/09640568.2023.2166819
Liu, J., Cheng, Z., and Zhang, H. (2017). Does industrial agglomeration promote the increase of energy efficiency in China? J. Clean. Prod. 164, 30–37. doi:10.1016/j.jclepro.2017.06.179
Maggioni, M. A. (2002). Clustering dynamics and the location of high-tech-firms. Berlin, Germany: Springer Science and Business Media. doi:10.1007/978-3-642-57480-1_2
PanMa, X. L. S., Jing, Z., and Zhou, G. (2018). Innovation network, technological learning and innovation performance of high-tech cluster enterprises. J. Knowl. Manag. 23 (4), 1729–1746. doi:10.1108/JKM-06-2018-0371
Peng, C., Elahi, E., Fan, B. B., and Li, Z. H. (2022). Effect of high-tech manufacturing Co-agglomeration and producer service industry on regional innovation efficiency. Front. Environ. Sci. 10, 942057. doi:10.3389/fenvs.2022.942057
PGHP (2006). The people's government of Hubei province (PGHP), Hubei province high-tech industry development "Eleventh five-year plan. Available at: http://www.hubei.gov.cn/zfwj/ezf/201112/t20111207_1711298.shtml.
PGHP (2021). The people's government of Hubei province (PGHP), several measures to promote the high-quality development of Hubei high-tech industrial development zone. Available at: http://www.hubei.gov.cn/zfwj/ezf/202101/t20210120_3272605.shtml.
Porter, M. E. (1998). Clusters and the new economics of competition. Watert. Harv. Bus. Rev. 76 (6), 77–90.
Pouder, R., and St. John, C. H. (1996). Hot spots and blind spots: Geographical clusters of firms and innovation. Acad. Manag. Rev. 21 (4), 1192–1225. doi:10.5465/amr.1996.9704071867
Ren, X., Cheng, C., Wang, Z., and Yan, C. (2021). Spillover and dynamic effects of energy transition and economic growth on carbon dioxide emissions for the European union: A dynamic spatial panel model. Sustain. Dev. 29 (1), 228–242. doi:10.1002/sd.2144
Scherer, F. M. (1986). Innovation and growth: Schumpeterian perspectives. Cambridge, Massachusetts: MIT Press Books.
Tone, K. (2002). A slacks-based measure of super-efficiency in data envelopment analysis. Eur. J. Operational Res. 143, 32–41. doi:10.1016/s0377-2217(01)00324-1
Wang, X., Ling, W. K., Yang, S., and Li, X. (2020). Regional principal component analysis network with the rolling guidance filter for classifying the hyperspectral images. USA: IEEE Access. doi:10.1109/ACCESS.2020.3016171
Wang, Z., He, Q., Xia, S., Sarpong, D., Xiong, A., and Maas, G. (2020). Capacities of business incubator and regional innovation performance. Technol. Forecast. Soc. Change 158, 120125. doi:10.1016/j.techfore.2020.120125
Wu, K., Wang, Y., Ye, Y., Zhang, H., and Huang, G. (2019). Relationship between the built environment and the location choice of high-tech firms: Evidence from the Pearl River Delta. Sustainability 11 (13), 3689. doi:10.3390/su11133689
Xie, K., Song, Y., Zhang, W., Hao, J., Liu, Z., and Chen, Y. (2018). Technological entrepreneurship in science parks: A case study of wuhan Donghu high-tech zone. Technol. Forecast. Soc. Change 135, 156–168. doi:10.1016/j.techfore.2018.01.021
Xu, K., Bossink, B., and Chen, Q. (2019). Efficiency evaluation of regional sustainable innovation in China: A slack-based measure (SBM) model with undesirable outputs. Sustainability 12 (1), 31. doi:10.3390/su12010031
Xu, N., Cheng, Y., and Xu, X. (2018). Using location quotients to determine public-natural space spatial patterns: A zurich model. Sustainability 10 (10), 3462. doi:10.3390/su10103462
Yang, Q., Huang, Y. S., Guo, F., Zhang, J., and Zhao, X. (2023). Does public policy towards venture capital promote local innovation? Evidence from China's establishment of fund town. Finance Res. Lett. 52, 103578. doi:10.1016/j.frl.2022.103578
Yu, B. (2023). Does innovative city pilot policy stimulate the Chinese regional innovation: An application of DID model. Int. J. Environ. Res. Public Health 20 (2), 1245. doi:10.3390/ijerph20021245
Yum, S. (2019). Empirical analysis of relationship between high-tech industries and us metropolitan statistical areas. J. Urban Plan. Dev. 145 (4), 04019019. doi:10.1061/(asce)up.1943-5444.0000530
Zandiatashbar, A., and Hamidi, S. (2022). Exploring the microgeography and typology of US high-tech clusters. Cities 131, 103973. doi:10.1016/j.cities.2022.103973
Zeng, C., Zhang, A., Liu, L., and Liu, Y. (2017). Administrative restructuring and land-use intensity-A spatial explicit perspective. Land Use Policy 67, 190–199. doi:10.1016/j.landusepol.2017.05.034
Zheng, H., and He, Y. (2022). How does industrial co-agglomeration affect high-quality economic development? Evidence from chengdu-chongqing economic circle in China. J. Clean. Prod. 371, 133485. doi:10.1016/j.jclepro.2022.133485
Keywords: Wuhan metropolitan area, high-tech cluster, regional innovation capacity, panel threshold model, spatial spillover
Citation: Bao J and Li Y (2023) Has high-tech cluster improved regional innovation capacity? evidence from Wuhan metropolitan area in China. Front. Environ. Sci. 11:1180781. doi: 10.3389/fenvs.2023.1180781
Received: 06 March 2023; Accepted: 03 July 2023;
Published: 18 July 2023.
Edited by:
Huaping Sun, Jiangsu University, ChinaCopyright © 2023 Bao and Li. This is an open-access article distributed under the terms of the Creative Commons Attribution License (CC BY). The use, distribution or reproduction in other forums is permitted, provided the original author(s) and the copyright owner(s) are credited and that the original publication in this journal is cited, in accordance with accepted academic practice. No use, distribution or reproduction is permitted which does not comply with these terms.
*Correspondence: Yin Li, MjAyMTExMDEwMEBtYWlsLnNjdWVjLmVkdS5jbg==