 Boaz Kuizenga1†
 Paolo F. Tasseron
 Katrin Wendt-Potthoff
 Tim H. M. van Emmerik
- 1Hydrology and Quantitative Water Management Group, Wageningen University, Wageningen, Netherlands
- 2Helmholtz Centre for Environmental Research (UFZ), Leipzig, Germany
Rivers are pathways and storage zones for plastic pollution. Land-based plastic waste enters river systems through anthropogenic and hydrometeorological processes, after which they are transported and retained. Only a small fraction (
1 Introduction
Over the past decades, the use of plastic has increased. Because plastics are easy to produce, relatively cheap, and highly durable, they are now omnipresent (Andrady and Neal, 2009). As plastic is designed to last, it may take decades or longer before they are degraded (Delorme et al., 2021). This results in an accumulation of plastic in terrestrial and aquatic ecosystems (Barnes et al., 2009; Lebreton et al., 2018; van Emmerik et al., 2022b). Rivers have an important role in transporting land-based plastic waste towards and into the sea (Meijer et al., 2021). Furthermore, plastic pollution also has direct negative effects on river systems (van Emmerik and Schwarz, 2020; Meijer et al., 2021). To better understand plastic transport and accumulation dynamics in rivers, and to identify source and sink locations, catchment-scale monitoring efforts are needed (Windsor et al., 2019). In this paper, we present results from a first effort to quantify floating macroplastic (larger than 2.5 cm) along the Rhine, one of Europe’s largest rivers.
One of the main challenges in understanding and reducing plastic pollution is the harmonization of monitoring strategies (González-Fernández et al., 2021). In recent years, several efforts have been made to provide guidelines for the harmonization of specific methods (González-Fernández and Hanke, 2017), and the development of monitoring strategies (Wendt-Potthoff et al., 2020). However, applications of those guidelines for river-scale assessments are limited. In this study, we demonstrate how the cost-effective visual counting method can be used to quantify floating macroplastic along the Rhine, from Switzerland to the river mouth in Netherlands. For this method, the observer stands on the bridge and counts the floating plastics and other litter (González-Fernández and Hanke, 2017; van Emmerik et al., 2018). Visual counting measurements have been performed all over the world, and have proven to give an accurate estimate of the floating plastic transport in rivers (Castro-Jiménez et al., 2019; van Calcar and van Emmerik, 2019; González-Fernández et al., 2021). Using statistics on the mean and median mass per plastic item, or using hydrological data, the plastic mass transport and emissions into the ocean can be estimated at daily, monthly or annual time scales. (Castro-Jiménez et al., 2019; van Emmerik et al., 2022a; de Lange et al., 2023). To date, such assessments have mainly been done for single locations within rivers. Estimating plastic transport along a river may however provide insights into potential sources and accumulation zones, which is, in turn, crucial for harmonized monitoring, prevention, and reduction strategies.
This study focuses on quantifying the river plastic transport and composition along the Rhine. The Rhine is the largest river in Northwestern Europe and flows through six countries. The Rhine basin is densely populated and industrialized and may therefore be regarded as a ’blueprint’ for other large rivers with considerable anthropogenic influence around the world. Previous work demonstrated the persistent abundance of microplastics along the Rhine (Mani et al., 2015; Mani et al., 2019), but similar assessments have not been made for macroplastics to date. Only around the Dutch part of the Rhine plastic transport has been estimated. Close to the river mouth around Rotterdam previous studies estimated the floating and total plastic transport between 1.3 and 156 kg/d (Vriend et al., 2020; van Emmerik et al., 2022a) and 55–85 kg/d (Blondel and Buschman, 2022), respectively. Around the Dutch-German border, floating mass transport was estimated at 1.6–77 kg/d. Here, we present an assessment of floating plastic pollution along the complete Rhine. Within a time frame of 6 days, we measured floating plastic transport and composition at 20 locations for over 1,100 km between Rotterdam (Netherlands) and Tamins (Switzerland). Longitudinal profiles of river plastic pollution provide insights into the distribution along the river and may identify source and sink locations. Furthermore, it sheds light on the influence of urban areas as potential points of entry for plastic pollution, and the effect of river confluences and tributaries.
With this paper, we aim to contribute to a better understanding of the spatial distribution of plastic in large rivers. Our estimates can be used as a baseline for future comparison and assessing the efficacy of plastic pollution prevention and reduction measures. Finally, our approach can be used as a blueprint for developing similar monitoring strategies for other large and small rivers around the world.
2 Methods
2.1 Study area
In this study, floating plastic was counted from twenty bridges between Rotterdam (Netherlands) and Tamins (Switzerland), covering nearly the entire length of the Rhine River from source to mouth. This river belongs to the largest river systems in Europe, crosses four countries, and is characterized by diverse land use ranging from dense industrial areas to nature reserves. The twenty bridges used as observation points were selected at equidistant intervals, as shown in Figure 1; Table 2. These bridges were selected according to prerequisites for safe, accurate, and reliable measurements, established by (Wadman and van Emmerik, 2022).
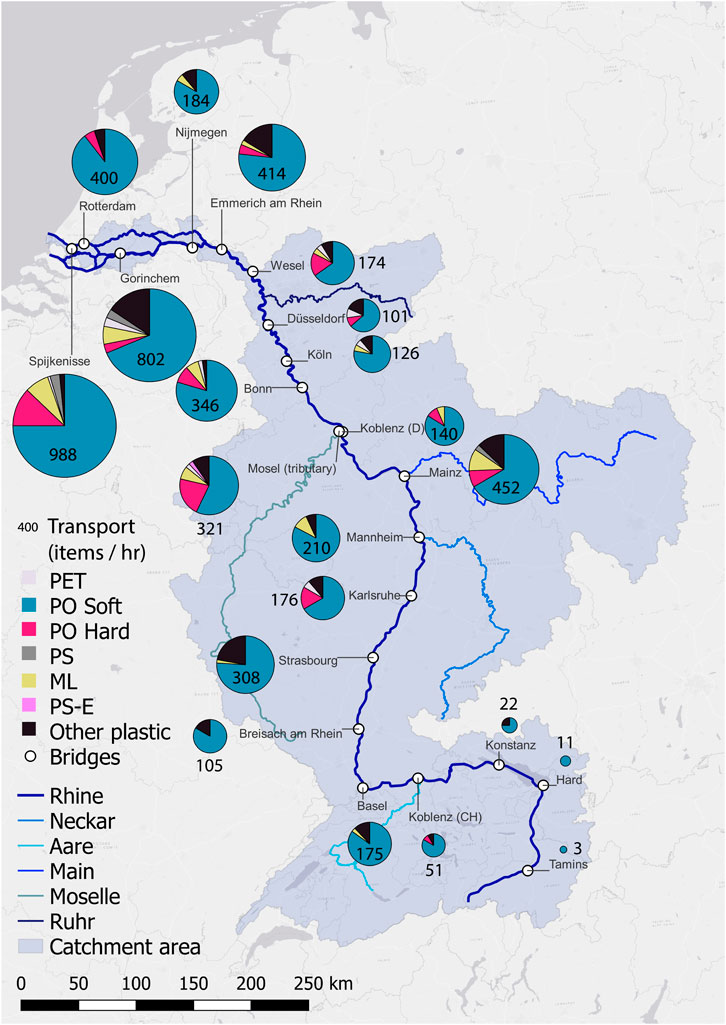
FIGURE 1. Measurement locations with associated plastic transport per hour, divided into seven categories. The Rhine catchment is the area in blue.
2.2 Data collection and analysis
Data collection at the measurement locations was pursued through the visual counting method developed by (González-Fernández and Hanke, 2017), which has been used for floating plastic assessments in rivers worldwide (Castro-Jiménez et al., 2019; van Calcar and van Emmerik, 2019; González-Fernández et al., 2021). The research was done in the last week of March 2022. During this week, the average discharge at Lobith (where the Rhine enters Netherlands) was 1,547 m3/s, which is considered normal discharge according to the Department of Waterways and Public Works of Netherlands. Two observers were trained to use the visual counting method developed by (González-Fernández and Hanke, 2017), and an additional measurement protocol developed by (Wadman and van Emmerik, 2022). Floating plastic items are counted and categorized into one of seven different plastic categories for a predetermined time interval and observation width. Based on the polymer composition of plastics, these categories are PET (Polyethylene Terephthalate), POsoft (soft polyolefins), POhard (hard polyolefins), PS (Polystyrene), Multilayer (ML), PS-E (expanded polystyrene), and Other Plastic. The minimum observation detection limit depends on the height of the bridges but was estimated to be at least 2.5 cm for all observation locations. Each bridge was divided into four to six segments, which were strategically chosen using satellite imagery. The total number of segments per bridge is dependent on the length of the bridge, ensuring each segment covers a part of the river within the field of view of the observer. By default, each segment was measured four times for a period of 5 min, resulting in a total observation time of 80–120 min per bridge. In areas with tidal influence, measurements were done under low tide conditions, in which the water flowed towards the sea.
The floating plastic transport per polymer type Fcat for each bridge was subsequently calculated using Eq. 1. In this equation, Icat is the total observed items per segment per 5 min for each polymer type, R is the river width at the measurement location [m], and O is the observation width [m], which was estimated based on the bridge height and field-of-view of the observer. Taking the sum of all Fcat values results in the total plastic transport per measurement location [items/hr]. In addition, an estimate of the floating plastic mass transport M [kg/day] was made using plastic transport per polymer category Fcat [items/hr] and the mean/median mass statistics per category mcat [g], summarized in Table 1 (Eq. 2. These mass statistics are based on 16,000 weighed macrolitter items collected from Dutch riverbanks (de Lange et al., 2023).
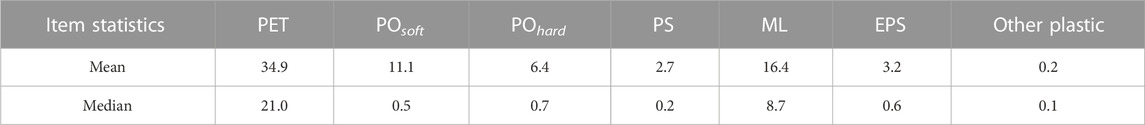
TABLE 1. Mean/Median statistics of the weight per item category in grams (de Lange et al., 2023).
Furthermore, we assessed whether there is a relationship between the abundance of floating plastics and the presence of upstream cities. Using satellite imagery, a categorical classification was made for each measurement location, describing the presence of cities: a city directly present on both banks (B), a city directly present on one bank (O), and no city present (N). This classification was then used in a pairwise Wilcoxon signed-rank test to assess any significant differences between the classes. In addition, a rapid comparison between item counts for B, O, and N was made by averaging the counts for each group and comparing the difference in plastic transport for B and O compared to N.
Additional analyses were performed to assess a potential relationship between discharge [m3/s] and observed item transport values [items/hr], using Spearman’s rank correlation coefficient and Pearson’s correlation coefficient. Historical daily discharge data of the Rhine was downloaded from the Global Runoff Data Centre (Bundesanstalt für Gewässerkunde, available online at https://grdc.bafg.de). An average discharge value for March was calculated using daily discharge data between 2008 and 2018 for sixteen different stations close to the measurement locations. Lastly, we tested whether an observer bias might be present and lead to skewed results. An observer bias might strongly influence the results when the measurements are done by inexperienced or a small number of people (González-Fernández and Hanke, 2017; van Emmerik et al., 2018). The bias was calculated for each measurement location by dividing the total counted items of one observer by the total counted items of the other observer.
3 Results and discussion
3.1 Increased floating plastic transport towards the Rhine’s mouth
A large range in plastic transport (3–988 items/hour) was found between the measured locations (Table 2; Figure 2). The plastic transport close to the river mouth at Spijkenisse was more than three times as much as the plastic transport close to the source at Tamins. The mean plastic transport in Netherlands (593 items/hour) is 11.2 times larger than the plastic transport in Switzerland (53 items/hour). The plastic transport in Germany (239 items/hour) is 4.5 times as large compared to Switzerland. In total, 84% of the counted items were plastic. Furthermore, of all the counted plastic, 76% was POsoft. The category POsoft consists of both PP and PE and is mainly plastic foils and bags. Also in other studies on river debris, it is found that the large majority of found items is plastic: 94% (on riverbanks), 82%, and 84% found by Bruge et al. (2018); González-Fernández et al. (2021); van Emmerik et al. (2022a), respectively.
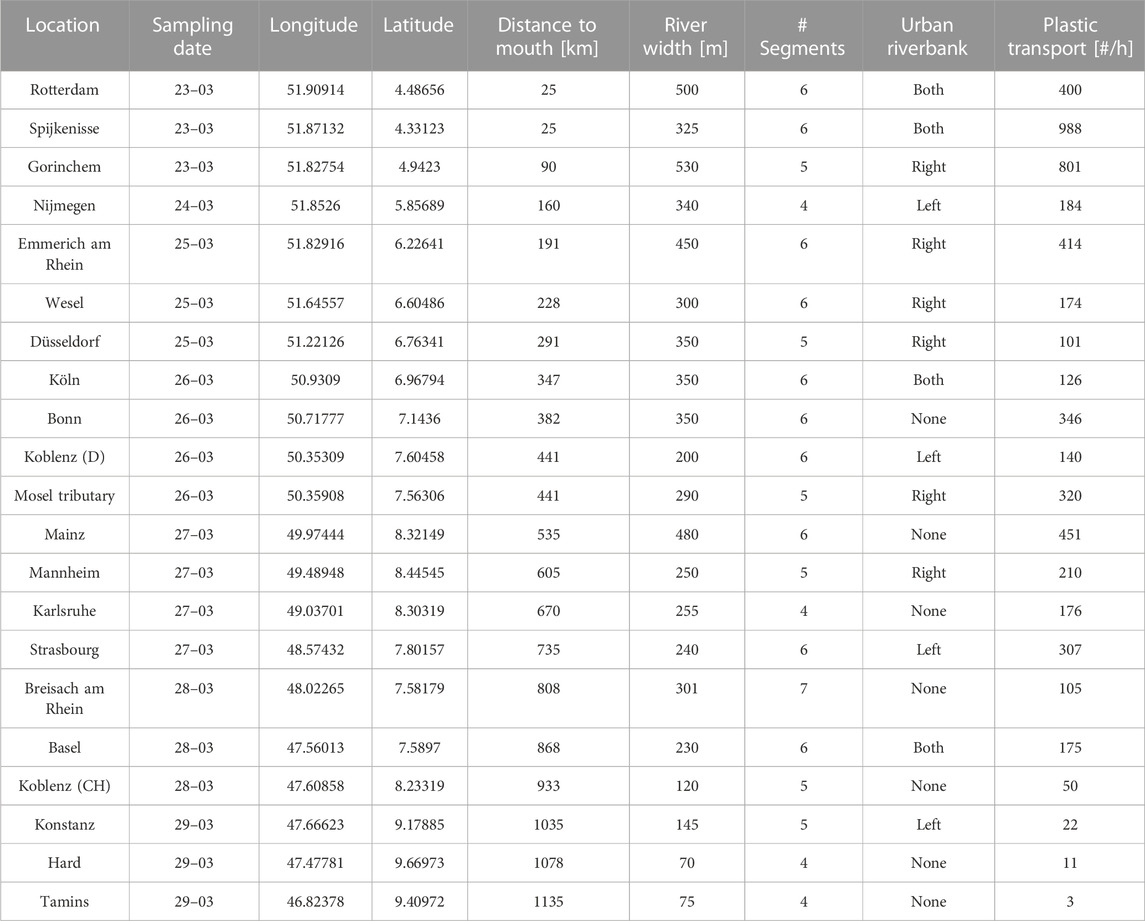
TABLE 2. Overview of the bridges. Location is the name of the closest city to the measurement location. Breisach am Rhein consists of three separate canals of which the larger two were measured. These data were combined into the data shown. In Rotterdam, all segments were measured twice instead of four times due to time constraints and changing tides.
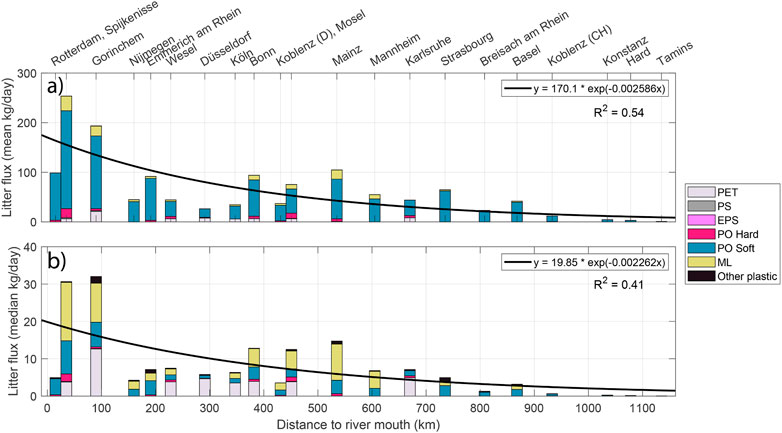
FIGURE 2. Litter transport (kg/day) along the profile of the Rhine river based on (A) mean weight statistics, (B) median weight statistics. Estimates of the transport can be an order of magnitude higher when using mean weight statistics compared to median weight statistics. The increasing plastic transport downstream is explained with an exponential function, similar to (Bruge et al., 2018).
Multiple explanations for these spatial differences exist. For example, urban areas and industrial sites could be important (point-source) contributors to river plastic pollution (Li et al., 2016), of which the presence increases with increasing river length. Although a general increase in plastic river transport is observed towards the river mouth, local differences exist between neighboring measurement locations. For example, the plastic transport measured at Mainz is at least two times higher than the nearby locations up- and downstream (Koblenz (D), and Mannheim, respectively). This difference can have many different explanations. For example, the dilution or input of plastic by nearby tributaries, a temporary peak in plastic transport, or local wind effects. Another explanation could include (temporary) sinks of plastics on riverbanks, which is corroborated in van Emmerik et al. (2022b).
When considering the transport along the entire Rhine profile, a general trend can be derived. An exponential relation was fit (R2 = 0.54) between the distance to the river mouth and the plastic transport expressed in kg/day (Figure 2A). A study in the Adour River in the south of France by Bruge et al. (2018) derived an exponential function of similar nature to describe the increase in plastic item density on riverbanks as a function of distance towards the river mouth. It remains unclear to what extent an exponential function realistically describes the spatial variation in plastic transport or riverbank plastic density. However, such equations may be used for comparative analysis or to account for spatial variability in large-scale modeling efforts (such as (Meijer et al., 2021)).
Another study in the Rhine-Meuse delta shows plastic transport to be higher in downstream locations, compared to upstream locations within the borders of Netherlands (van Emmerik et al., 2022a). Part of the explanation for this can be the tidal influence close to the sea. The river at Spijkenisse and Rotterdam in the Netherlands is influenced by the tide, with a bi-directional flow regime. In such cases, the net transport from the tidal zone is relatively low (Schreyers et al., 2022; Mani et al., 2023). According to Tramoy et al. (2020), tidal influence combined with wind direction is an important factor for plastic accumulation and remobilization in estuaries. This effect can have an influence on the observed plastic transport in Rotterdam, Spijkenisse, and—to a lesser extent—Gorinchem. The estuarine region has been hypothesized to accumulate considerable amounts of plastic from rivers (Harris et al., 2021), which is supported by our findings. Therefore, the increased values of plastic transport in the tidal zone are not representative of the actual export into the ocean.
3.2 The role of urban areas and tributaries floating plastic transport
Plastic transport in the Rhine is 2.3 times higher for highly urbanized areas (urbanized riverbanks on both sides) than in areas that were considered by non-urbanized land use. In case only one riverbank is urbanized, 1.5 times more plastic is found for non-urbanized riverbanks. This is in line with results found by van Emmerik et al. (2022a), who identified an increase of floating plastic downstream of urban areas. The increased abundance of floating plastic in the vicinity of urban areas suggests that urban areas are a source of river plastic pollution, or that plastics are more easily retained around urban infrastructure (Tasseron et al., 2022). For example; Willis et al. (2017) identified stormwater drains as a substantial outflow point of urban litter. In addition, dams and sluices could be clogged and act as temporary sinks of plastic litter (Lechthaler et al., 2020; van Emmerik et al., 2022b). Understanding the role of urban areas and their relation to river plastic pollution is key for optimizing cleanup strategies in various compartments (Hohn et al., 2020; Helinski et al., 2021).
The influence of tributaries and their relative contribution to observed floating plastic transport should be studied in more detail. Quantitative data on plastics in river tributaries and their relation to pollution in downstream freshwater environments is limited and poorly understood (Guerranti et al., 2020). In this research, only one out of five tributaries (Mosel) was measured. Yet, the observed plastic transport at the Mosel tributary was more than twice as high as the plastic transport in the main river branch at Koblenz (D). Tributaries contribute to the total discharge in the main river, which can dilute or increase the plastic concentration in the water depending on the concentration of plastic in the tributary (Wagner et al., 2019). A moderate relationship between discharge and observed item transport for sixteen out of twenty measurement locations (main river) was present (Pearson r = 0.55, p = 0.04, Spearman r = 0.55, p = 0.04). This implies some (unambiguous) factors other than discharge influence the magnitude of plastic transport. Changes in discharge and flow velocity at points where tributaries merge with the main can influence the plastic transport dynamics (Haberstroh et al., 2021). Understanding and quantifying the contribution of individual tributaries may lead to more focused efforts to prevent and reduce plastic pollution in large river basins.
3.3 Observer bias
An observer bias was present, in which observer one structurally counted more items than observer two. In total, observer one observed 21.3% more items than observer two, which could possibly be explained by surface glint and water bubbles being misclassified as floating items. An overview of the observer bias calculation and statistics is summarized in Table 3.
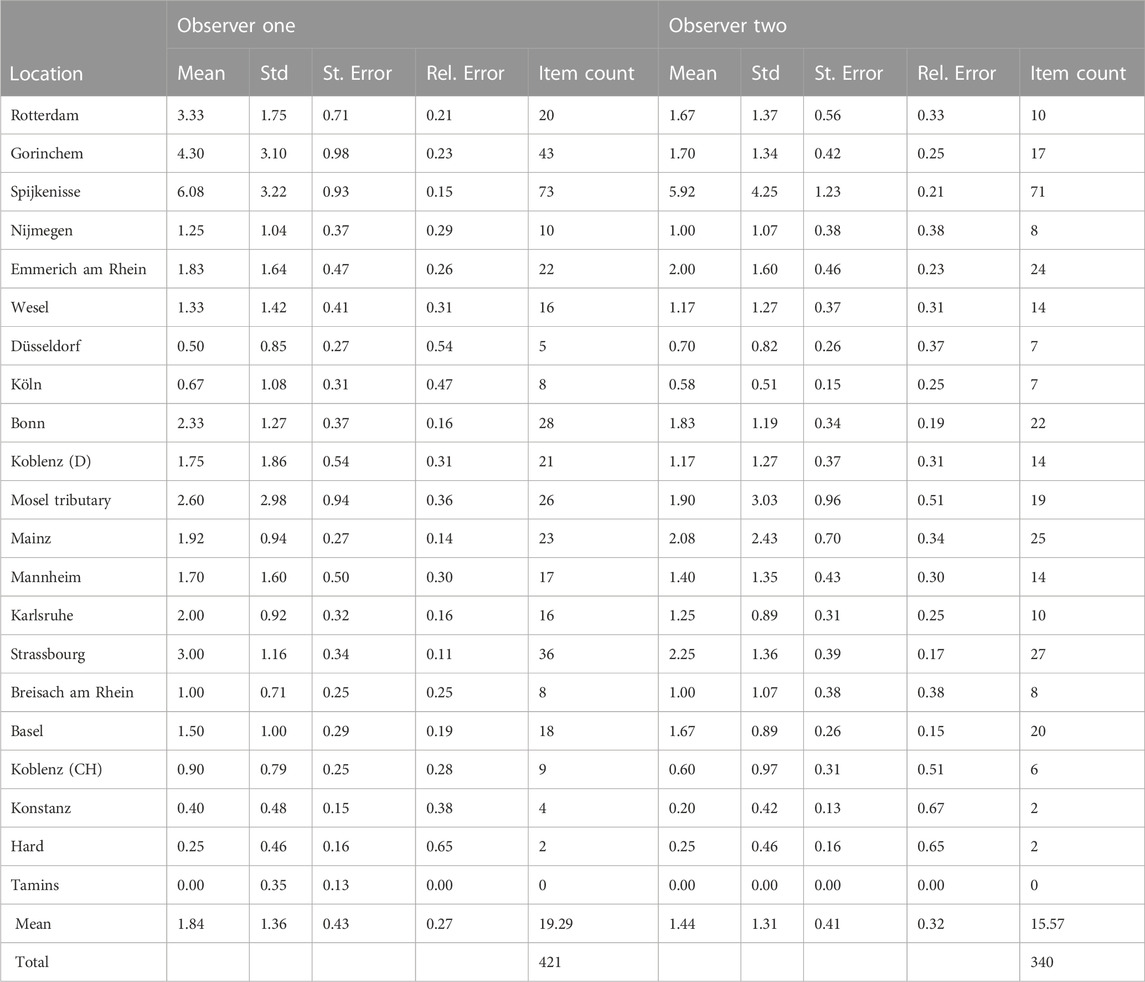
TABLE 3. Overview of the observed items per measurement location, with statistics to compare an observer one with observer two. The difference in the total item count between both observers is 21.3%.
3.4 Recommendations for catchment-scale monitoring
Visual counting measurements from bridges are cost-effective compared to other measurement methods such as the use of cameras. However, there are various drawbacks to the method. Differences in bridge height, water turbidity, Sun glare, and other weather conditions might result in uncertainties of the total floating item counts (van Emmerik and Schwarz, 2020). In this research, a combination of these factors and a difference in experience resulted in observer one counting 21.3% more items than observer two. We believe that there was a systematic bias associated with the observer as each observer measured every location twice and for the same amount of time. Elaboration on these results can be found in the supplementary materials. It is not clear what percentage of plastic transport can be observed by a researcher on a bridge, and how accurate the observations are. If the observer is not trained accurately to distinguish different types of plastic, not paying attention, or is more sensitive to identifying certain types of plastic, the accuracy of the counted items can be affected. Therefore, actual plastic transport in rivers might be different than reported. It will be beneficial to the method to research the percentage of plastic that can be seen by an observer and relate it to turbidity, bridge height, and measurement time. Further research should indicate whether these assumptions need to be changed for an improved measuring method. Systematical research on the method can be a first step: for example, visual observations should be combined with passive or active sampling to see if the observations correspond with the actual transport (for example, combining bridge counting measurements with net sampling to be able to see the total plastic transport).
Contrary to the plastic transport quantified in this research, microplastic transport does not necessarily increase towards the river mouth. In this research, more plastic is found downstream than upstream. Mani et al. (2015) measured floating microplastic concentrations in the Rhine River at eleven locations and found a higher microplastic concentration in densely populated areas, especially the Ruhr area. In a study on the Danube, microplastic concentrations were also found to be higher around wastewater treatment plants and industrial areas (Kittner et al., 2022), with PE (POsoft) dominating the polymer composition. However, in this research, the macroplastic transport is increasing towards the mouth of the river. That means that microplastics and macroplastics may behave differently in a river system and that for both, different estimation and removal strategies have to be developed.
The measurements were not done during a high discharge event. It has been shown that during high discharge, the plastic transport can increase as well (van Emmerik et al., 2022a; Cowger et al., 2022), as the plastic that is retained in the river is partly released. Therefore, the influence of high discharge peaks on the plastic transport in the Rhine River should be researched to get insight into the distribution of plastic at high discharge events and the amount of plastic retained in the river system.
Elements included in this research can form a blueprint for future catchment-scale monitoring of river plastic pollution. Here, a cost-effective approach was applied using a standardized method for quantifying floating plastic, allowing consistent comparisons of plastic pollution along an entire river profile. Future efforts could include repeated measurements at specific intervals to provide insights into temporal patterns, in addition to the spatial pattern studied here. Additional efforts for long-term monitoring can be explored using cameras and automated detection, but these techniques are currently underdeveloped (Jia et al., 2023). Understanding different polymer types and their transport characteristics can provide further insights into the sources, pathways, and sinks of riverine plastic pollution.
4 Conclusion
In this study, we present the first longitudinal profile of floating macroplastic pollution along the Rhine, from Switzerland to Netherlands. We found a significant increase in floating plastic transport from the source to the river mouth. The composition of the plastic items remains relatively similar along the Rhine, with soft plastics (POsoft) as the most abundant plastic type. The high values measured at the river mouth do not necessarily equal export into the ocean, but rather reflect the potential retention capacity of the river estuary due to tidal dynamics (e.g., bidirectional flow). In addition, we observed an alternating pattern of increased and decreased plastic transport between the measurement locations along the profile. This can be explained by (1) an additional entry of plastic at point sources (e.g., tributaries and urban areas), (2) the gradual accumulation of plastics in the water column, and (3) retention on riverbanks and at infrastructures. Lastly, we demonstrate that floating transport along the full extent of one of Europe’s largest rivers can be assessed with cost-effective methods in a relatively short amount of time. This provides (1) a first baseline for macroplastic transport along the Rhine River, and (2) a framework for future assessments of other river systems. With this paper, we aim to contribute to further harmonization of river plastic monitoring and shed new light on the spatial variation of floating macroplastic transport in large river basins.
Data availability statement
The original contributions presented in the study are publicly available. This data can be found here: http://doi.org/10.4121/12c007a2-7ef1-43c4-9d55-948e9c0404eb.
Author contributions
Conceptualization: BK and TV; Methodology: BK, PT, and TV; Formal Analysis: BK, PT, and TV; Investigation—Data collection: BK; Visualization: BK and PT; Data curation: TV; Writing–original draft: BK, PT, and TV; Writing–reviewing and editing: all authors; Supervision: TV; Project administration: TV and KW; Funding acquisition: TV and KW.
Funding
This research was partly funded by the World Water Quality Alliance (WWQA) a programme supported by the UN Environment Programme (UNEP) and the Joint Research Centre (JRC) of the European Commission. The work of PT was supported by the project Solving the Urban Plastic Soup, which is (partly) funded by the SESA programme (Subsidie Economische Structuur en Arbeidsmarktversterking) of the City of Amsterdam, the directie Stadswerken (Programma Plastic Smart City) of the City of Amsterdam, Netherlands Ministry of Infrastructure and Water Management, Directorate-General for Public Works and Water Management (Rijkswaterstaat), and Waternet. The work of TvE was supported by the Veni research program The River Plastic Monitoring Project with project number 18211, which is (partly) funded by the Dutch Research Council (NWO).
Acknowledgments
We thank Daan Aarts for joining the data collection along the Rhine. We thank Christian Schmidt and Sabrina Kirschke for their input during the project and their feedback on an earlier version of the manuscript.
Conflict of interest
The authors declare that the research was conducted in the absence of any commercial or financial relationships that could be construed as a potential conflict of interest.
Publisher’s note
All claims expressed in this article are solely those of the authors and do not necessarily represent those of their affiliated organizations, or those of the publisher, the editors and the reviewers. Any product that may be evaluated in this article, or claim that may be made by its manufacturer, is not guaranteed or endorsed by the publisher.
Supplementary material
The Supplementary Material for this article can be found online at: https://www.frontiersin.org/articles/10.3389/fenvs.2023.1180872/full#supplementary-material
References
Andrady, A. L., and Neal, M. A. (2009). Applications and societal benefits of plastics. Philos. Trans. R. Soc. B Biol. Sci. 364, 1977–1984. doi:10.1098/rstb.2008.0304
Barnes, D. K., Galgani, F., Thompson, R. C., and Barlaz, M. (2009). Accumulation and fragmentation of plastic debris in global environments. Philos. Trans. R. Soc. B Biol. Sci. 364, 1985–1998. doi:10.1098/rstb.2008.0205
Blondel, E., and Buschman, F. A. (2022). Vertical and horizontal plastic litter distribution in a bend of a tidal river. Front. Environ. Sci. 587. doi:10.3389/fenvs.2022.861457
Bruge, A., Barreau, C., Carlot, J., Collin, H., Moreno, C., and Maison, P. (2018). Monitoring litter inputs from the Adour river (southwest France) to the marine environment. J. Mar. Sci. Eng. 6, 24. doi:10.3390/jmse6010024
Castro-Jiménez, J., González-Fernández, D., Fornier, M., Schmidt, N., and Sempéré, R. (2019). Macro-litter in surface waters from the Rhone river: Plastic pollution and loading to the NW mediterranean sea. Mar. Pollut. Bull. 146, 60–66. doi:10.1016/j.marpolbul.2019.05.067
Cowger, W., Gray, A., Brownlee, S., Hapich, H., Deshpande, A., and Waldschläger, K. (2022). Estimating floating macroplastic flux in the Santa Ana river, California. J. Hydrol. Reg. Stud. 44, 101264. doi:10.1016/j.ejrh.2022.101264
de Lange, S. I., Mellink, Y., Vriend, P., Tasseron, P., Begemann, F., Hauk, R., et al. (2023). Sample size requirements for riverbank macrolitter characterization. Front. Water 4, 1085285. doi:10.3389/frwa.2022.1085285
Delorme, A. E., Koumba, G. B., Roussel, E., Delor-Jestin, F., Peiry, J.-L., Voldoire, O., et al. (2021). The life of a plastic butter tub in riverine environments. Environ. Pollut. 287, 117656. doi:10.1016/j.envpol.2021.117656
González-Fernández, D., and Hanke, G. (2017). Toward a harmonized approach for monitoring of riverine floating macro litter inputs to the marine environment. Front. Mar. Sci. 4, 1–7. doi:10.3389/fmars.2017.00086
González-Fernández, D., Cózar, A., Hanke, G., Viejo, J., Morales-Caselles, C., Bakiu, R., et al. (2021). Floating macrolitter leaked from Europe into the ocean. Nat. Sustain. 4, 474–483. doi:10.1038/s41893-021-00722-6
Guerranti, C., Perra, G., Martellini, T., Giari, L., and Cincinelli, A. (2020). Knowledge about microplastic in mediterranean tributary river ecosystems: Lack of data and research needs on such a crucial marine pollution source. J. Mar. Sci. Eng. 8, 216. doi:10.3390/jmse8030216
Haberstroh, C. J., Arias, M. E., Yin, Z., Sok, T., and Wang, M. C. (2021). Plastic transport in a complex confluence of the Mekong river in Cambodia. Environ. Res. Lett. 16, 095009. doi:10.1088/1748-9326/ac2198
Harris, P., Westerveld, L., Nyberg, B., Maes, T., Macmillan-Lawler, M., and Appelquist, L. (2021). Exposure of coastal environments to river-sourced plastic pollution. Sci. Total Environ. 769, 145222. doi:10.1016/j.scitotenv.2021.145222
Helinski, O. K., Poor, C. J., and Wolfand, J. M. (2021). Ridding our rivers of plastic: A framework for plastic pollution capture device selection. Mar. Pollut. Bull. 165, 112095. doi:10.1016/j.marpolbul.2021.112095
Hohn, S., Acevedo-Trejos, E., Abrams, J. F., Fulgencio de Moura, J., Spranz, R., and Merico, A. (2020). The long-term legacy of plastic mass production. Sci. Total Environ. 746, 141115. doi:10.1016/j.scitotenv.2020.141115
Jia, T., Kapelan, Z., de Vries, R., Vriend, P., Peereboom, E. C., Okkerman, I., et al. (2023). Deep learning for detecting macroplastic litter in water bodies: A review. Water Res. 231, 119632. doi:10.1016/j.watres.2023.119632
Kittner, M., Kerndorff, A., Ricking, M., Bednarz, M., Obermaier, N., Lukas, M., et al. (2022). Microplastics in the Danube river basin: A first comprehensive screening with a harmonized analytical approach. ACS ES&T Water 2, 1174–1181. doi:10.1021/acsestwater.1c00439
Lebreton, L., Slat, B., Ferrari, F., Sainte-Rose, B., Aitken, J., Marthouse, R., et al. (2018). Evidence that the great pacific garbage patch is rapidly accumulating plastic. Sci. Rep. 8, 4666–4715. doi:10.1038/s41598-018-22939-w
Lechthaler, S., Waldschläger, K., Stauch, G., and Schüttrumpf, H. (2020). The way of macroplastic through the environment. Environments 7, 73. doi:10.3390/environments7100073
Li, W., Tse, H., and Fok, L. (2016). Plastic waste in the marine environment: A review of sources, occurrence and effects. Sci. Total Environ. 566-567, 333–349. doi:10.1016/j.scitotenv.2016.05.084
Mani, T., Hauk, A., Walter, U., and Burkhardt-Holm, P. (2015). Microplastics profile along the Rhine River. Sci. Rep. 5, 17988–17997. doi:10.1038/srep17988
Mani, T., Blarer, P., Storck, F. R., Pittroff, M., Wernicke, T., and Burkhardt-Holm, P. (2019). Repeated detection of polystyrene microbeads in the lower Rhine river. Environ. Pollut. 245, 634–641. doi:10.1016/j.envpol.2018.11.036
Mani, T., Hawangchu, Y., Khamdahsag, P., Lohwacharin, J., Phihusut, D., Arsiranant, I., et al. (2023). Gaining new insights into macroplastic transport ‘hotlines’ and fine-scale retention-remobilisation using small floating high-resolution satellite drifters in the chao phraya river estuary of bangkok. Environ. Pollut. 320, 121124. doi:10.1016/j.envpol.2023.121124
Meijer, L. J., van Emmerik, T., van der Ent, R., Schmidt, C., and Lebreton, L. (2021). More than 1000 rivers account for 80% of global riverine plastic emissions into the ocean. Sci. Adv. 7, eaaz5803–14. doi:10.1126/sciadv.aaz5803
Schreyers, L., van Emmerik, T., Bui, K., Thi, K. V. L., Vermeulen, B., Nguyen, H. Q., et al. (2022). Tidal dynamics limit river plastic transport. preprint on EGUSphere
Tasseron, P., Begemann, F., Joosse, N., van der Ploeg, M., van Driel, J., and van Emmerik, T. (2022). Urban water systems as entry points for river plastic pollution. preprint on ResearchSquare
Tramoy, R., Gasperi, J., Colasse, L., Silvestre, M., Dubois, P., Noûs, C., et al. (2020). Transfer dynamics of macroplastics in estuaries – new insights from the Seine estuary: Part 2. Short-Term dynamics based on GPS-trackers. Mar. Pollut. Bull. 160, 111566. doi:10.1016/j.marpolbul.2020.111566
van Calcar, C. J., and van Emmerik, T. H. M. (2019). Abundance of plastic debris across European and Asian rivers. Environ. Res. Lett. 14, 124051. doi:10.1088/1748-9326/ab5468
van Emmerik, T., and Schwarz, A. (2020). Plastic debris in rivers. WIREs Water 7. doi:10.1002/wat2.1398
van Emmerik, T., Kieu-Le, T. C., Loozen, M., Oeveren, K. v., Strady, E., Bui, X. T., et al. (2018). A methodology to characterize riverine macroplastic emission into the ocean. Front. Mar. Sci. 5, 1–11. doi:10.3389/fmars.2018.00372
van Emmerik, T., de Lange, S., Frings, R., Schreyers, L., and Aalderink, H. (2022a). Hydrology as driver of floating river plastic transport. Earth's Future 10, e2022EF002811. doi:10.1002/essoar.10510983.1
van Emmerik, T., Mellink, Y., Hauk, R., Waldschläger, K., and Schreyers, L. (2022b). Rivers as plastic reservoirs. Front. Water 3. doi:10.3389/frwa.2021.786936
Vriend, P., van Calcar, C., Kooi, M., Landman, H., Pikaar, R., van Emmerik, T., et al. (2020). Rapid assessment of floating macroplastic transport in the Rhine. Front. Mar. Sci. 7, 1–8. doi:10.3389/fmars.2020.00010
Wadman, M., and van Emmerik, T. (2022). Meetprotocol drijvend zwerfafval en macroplastic in rivieren. Wageningen University & Research.
Wagner, S., Klockner, P., Stier, B., Romer, M., Seiwert, B., Reemtsma, T., et al. (2019). Relationship between discharge and river plastic concentrations in a rural and an urban catchment. Environ. Sci. Technol. 53, 10082–10091. doi:10.1021/acs.est.9b03048
Wendt-Potthoff, K., Avellán, T., van Emmerik, T., Hamester, M., Kirschke, S., Kitover, D., et al. (2020). Monitoring plastics in rivers and lakes: Guidelines for the harmonization of methodologies. United Nations Environment Programme.
Willis, K., Denise Hardesty, B., Kriwoken, L., and Wilcox, C. (2017). Differentiating littering, urban runoff and marine transport as sources of marine debris in coastal and estuarine environments. Sci. Rep. 7, 44479–9. doi:10.1038/srep44479
Keywords: plastic pollution, harmonization, monitoring, marine litter, debris, hydrology, water quality
Citation: Kuizenga B, Tasseron PF, Wendt-Potthoff K and van Emmerik THM (2023) From source to sea: Floating macroplastic transport along the Rhine river. Front. Environ. Sci. 11:1180872. doi: 10.3389/fenvs.2023.1180872
Received: 06 March 2023; Accepted: 10 April 2023;
Published: 02 May 2023.
Edited by:
Irene Gregory-Eaves, McGill University, CanadaReviewed by:
Veerasingam S., Qatar University, QatarMeng Chuan Ong, University of Malaysia Terengganu, Malaysia
Copyright © 2023 Kuizenga, Tasseron, Wendt-Potthoff and van Emmerik. This is an open-access article distributed under the terms of the Creative Commons Attribution License (CC BY). The use, distribution or reproduction in other forums is permitted, provided the original author(s) and the copyright owner(s) are credited and that the original publication in this journal is cited, in accordance with accepted academic practice. No use, distribution or reproduction is permitted which does not comply with these terms.
*Correspondence: Paolo F. Tasseron, cGFvbG8udGFzc2Vyb25Ad3VyLm5s
†These authors have contributed equally to this work and share first authorship