 Martha J. Ledger1,2*
 Chris D. Evans3
 David J. Large4
 Stephanie Evers5,6Chloe Brown7
 A. Jonay Jovani-Sancho1,3Nathan Callaghan3Christopher H. Vane8
 Chris Marshall9Abirami Baskaran5Jing Ye Gan5Andrew Sowter10Keith Morrison11Sofie Sjögersten1
- 1School of Biosciences, University of Nottingham, Loughborough, United Kingdom
- 2School of Biological Sciences, Kadoorie Biological Sciences Building, University of Hong Kong, Pok Fu Lam, Hong Kong SAR, China
- 3UK Centre for Ecology & Hydrology, Environment Centre Wales, Bangor, United Kingdom
- 4Department of Engineering, University Park Campus, University of Nottingham, Nottingham, United Kingdom
- 5School of Geographical and Environmental Sciences, University of Nottingham Malaysia, Semenyih, Selangor Darul Ehsan, Malaysia
- 6School of Biological and Environmental Sciences, Liverpool John Moores University, Liverpool, United Kingdom
- 7School of Geography, University Park Campus, University of Nottingham, Nottingham, United Kingdom
- 8Centre for Environmental Geochemistry, British Geological Survey, Nottingham, United Kingdom
- 9Environmental Research Institute, North Highland College, University of the Highlands and Islands, Thurso, United Kingdom
- 10Terra Motion Limited, Ingenuity Centre, Nottingham, United Kingdom
- 11Department of Meteorology, Brian Hoskins Building, University of Reading, Reading, United Kingdom
Tropical peatland condition across southeast Asia is deteriorating as a result of conversion to agriculture and urban zones. Conversion begins by lowering the water table, which leads to peat decomposition, subsidence and increased risk of large-scale forest fires. Associated changes in mechanical peat properties impact the magnitude and timing of changes in peatland surface motion, making them a potential proxy for peatland condition. However, such a relationship is yet to be observed in a tropical peatland setting. This study aimed to establish whether patterns of tropical peatland surface motion were a function of peat condition at North Selangor Peat Swamp Forest in Selangor, Malaysia. Results showed that subsidence was greatest at fire-affected scrubland sites, whilst the lowest mean water table levels were found at smallholder oil palm sites. Peat condition and magnitude of tropical peat surface oscillation were significantly different between peat condition classes, whilst peat condition differed with depth. More degraded tropical peats with high bulk density throughout the peat profile due to high surface loading and low mean water table levels showed greater surface oscillation magnitudes. The dominant peat surface oscillation mechanisms present at all sites were compression and shrinkage from changes in water table level. Mean water table level and subsidence rate were related to surface oscillation magnitude. However further work towards measuring surface and within-water table range bulk densities and surface loading is required to better understand the controls on surface oscillation magnitudes.
1 Introduction
Tropical ombrotrophic peatlands are biodiverse ecosystems (Posa et al., 2011) and globally-significant carbon stores (Rieley and Page, 2016). In undisturbed conditions, tropical peatland carbon accumulation rates range from 24 to 300 g C m-2 year-1 (Ribeiro et al., 2021), which is overall higher than boreal and temperate peatlands (2–271 g C m-2 year-1: Olefeldt et al., 2012; Renou-Wilson et al., 2019). Tropical peatlands typically form in coastal locations with poor drainage and high precipitation, resulting in high water tables, low pH and high organic matter accumulation. The interaction between biomass (both living and dead) and hydrology maintains the water table at or near the peat surface. This is critical to maintain peat accumulation and peatland resilience in response to varying climatic conditions. The success of this interaction is apparent with the persistence of southeast Asian peat domes through the climate variability of the Late Holocene (Dommain et al., 2011).
Low bulk density and high porosity are characteristic of undisturbed tropical peatland soils, resulting in overall high hydraulic conductivity (Page et al., 1999; Wösten et al., 2008). The water table fluctuates with the balance between high rainfall, high evaporation rates and groundwater flow, leading to higher magnitude and frequency of water table variation and higher hydraulic conductivity than in temperate or boreal peatlands (Kelly et al., 2014; Baird et al., 2017). In response to water inputs and outputs, the tropical peat surface swells and shrinks relative to the height of the water table. Low latitude peatlands are typically subject to biannual seasonal cycles of rainfall; during the dry season, hydraulic conductivity reduces as the peat shrinks due to lack of water inputs, reducing water loss by lateral flow. When the wet season returns, water tables rise, and hydraulic conductivity increases as the peat swells due to water inputs. This mechanism called ‘mire-breathing’ promotes resilience in tropical peatlands from medium-term moisture stresses allowing the peat swamp surface to track the water table limiting oxidation and water loss (Dommain et al., 2010).
Tropical peatlands are at risk from urbanisation, agricultural conversion, fires, and climate change (Page et al., 2002; Cobb et al., 2017; Setiawan et al., 2017; Tonks et al., 2017; Mishra et al., 2021; Page et al., 2022), all of which result in changes in hydrological patterns and therefore surface response. Further, these land use changes lead to degradation of physical peat properties such as increased bulk density, which lowers the hydraulic conductivity of the peat matrix and alters the response of the peat surface to water inputs and outputs (Howie and Hebda, 2018), resulting in poorer peat condition. The example of agricultural conversion to oil palm illustrates this; after deforestation of the peat swamp forest, canals are dug out to drain the peat and lower the water table for planting crops, inducing peat surface subsidence, whereby oxidation, compaction and consolidation of the physical peat structure occurs (Wösten et al., 1997; Hooijer et al., 2012). This reduces peat elasticity through pore shrinkage, compromising hydraulic conductivity and therefore the response of the peat surface to water table changes (Howie and Hebda, 2018). The chemical decomposition of tropical peat is also induced: oxidation due to drainage results in the rapid loss of labile carbon and therefore overall increased thermal stability of the peat due to the greater proportion of recalcitrant carbon remaining in the peat matrix (Tonks et al., 2017; Yule et al., 2018).
In this way, tropical peat surface oscillation patterns could act as a fingerprint for tropical peat condition. This concept has already been explored in recent studies based on raised and blanket peatlands in temperate zones (Howie and Hebda, 2018; Alshammari et al., 2020; Bradley et al., 2022), whereby peat surface oscillation patterns were a function of disturbance, land use and ecology. Such a relationship is yet to have been observed in a tropical peatland setting, limiting the confidence in the use of surface motion as an indicator of peat condition in such environments.
The three main causes of peat surface oscillation in peatlands are: flotation, consolidation/compaction and gas accumulation. Each is driven by the opposing forces of gravity and material stress and result in peat volume change. Flotation of the peat surface occurs when upward forces exceed the tensile stress of the peat, leading the air-filled and less dense saturated peat surface to detach and float at the surface of the water (Kellner et al., 2005). Compaction and consolidation occur when pores collapse: compaction occurs above the water table, whereby pore water pressure above the water table reduces, increasing effective stress on the peat matrix and peat shrinkage; consolidation takes place below the water table, where the peat matrix collapses from the weight of unsaturated peat above the water table. Above-ground biomass surface loading also increases consolidation; the greater mass of secondary forest and established oil palm crops in tropical peatland settings is expected to have a greater consolidation impact than the lower loading of grasses, mosses and sedges in boreal or temperate peatlands. Gas accumulation and release (ebullition) within the peat profile results in surface elevation changes occurring independently of water table level change (Glaser et al., 2004) and is likely more common with higher temperatures in the tropics, although this is yet to have been observed.
This study aimed to quantify seasonal surface oscillation patterns and peat condition across North Selangor Peat Swamp Forest using ground-based methodologies. We define ‘peat condition’ as the extent to which the peat matrix has been degraded due to oxidation, compaction or consolidation. The specific Research Objectives were.
1. To identify differences in peat condition between four different land cover classes (degraded forest, fire-affected scrubland, recovering forest, and smallholder oil palm).
2. To determine the peat surface oscillation mechanisms and magnitudes of different land covers at North Selangor Peat Swamp Forest using subsidence poles and automated cameras.
3. To investigate relationships between peat surface oscillation magnitude and peat condition properties such as bulk density, water table level and thermal stability.
2 Materials and methods
2.1 Study site
North Selangor Peat Swamp Forest (North Selangor) is a large tropical peatland system located in North Selangor, Peninsular Malaysia on a flat coastal plain (Figure 1). It is the largest remaining peatland in Peninsular Malaysia, comparable to the size of Singapore (81,304 ha) (Selangor State Forestry Department, 2014), and is therefore becoming increasingly recognised as a globally-important terrestrial carbon store (Prentice, 2011). Peat formation began about 5,000–7,000 years ago after the saline coastal mangroves were replaced with freshwater peatland vegetation after the last Holocene interglacial marine incursion. This resulted in the deposition of acidic peat up to 5 m deep on top of marine clay (Yule and Gomez, 2009).
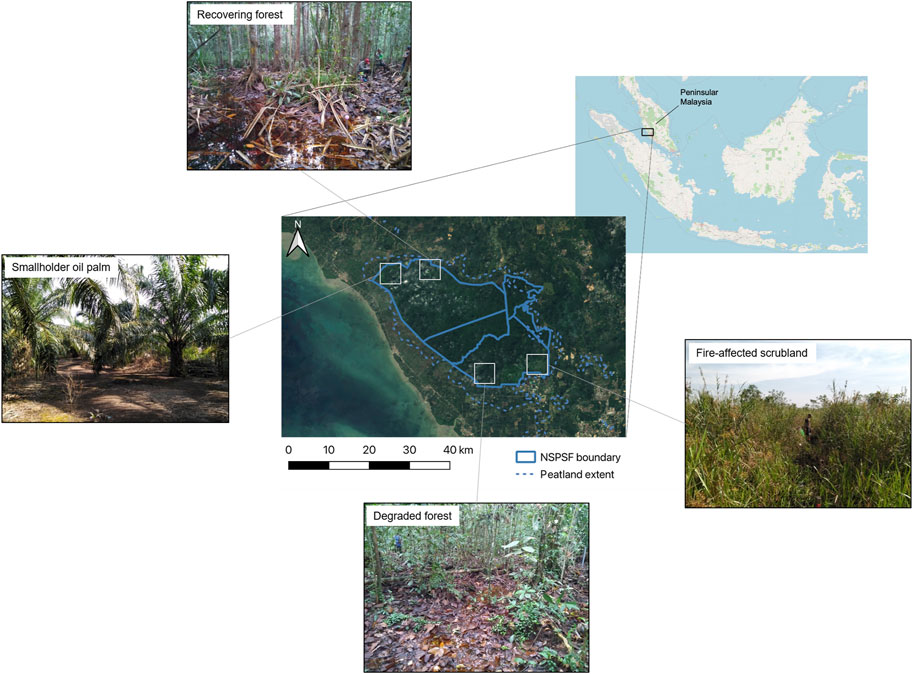
FIGURE 1. A map showing the location of North Selangor Peat Swamp Forest within Malaysia and southeast Asia. Peatland extent and the North Selangor reserve boundary (NSPSF boundary) are also shown. Photographs illustrating the four peat condition classes included in this study are also provided, including degraded forest, fire-affected scrubland, recovering forest, and smallholder oil palm (Photo credits: MJL).
Historically, North Selangor was extensively cleared for agricultural (paddy and oil palm plantation) and industrial (tin mining) developments (Ng et al., 1994). In 1990, North Selangor was designated reserve status, before which it was subject to extensive logging for 30 years (Selangor State Forestry Department, 2014). As a result, vast areas of the peat swamp forest were left severely degraded from selective timber harvesting and associated drainage from digging an extensive canal network. Consequently, the above-ground biomass cover now consists mostly of secondary forest of varying density, height and condition (Brown et al., 2018). Peat swamp waters contribute to the irrigation of neighbouring rice paddies and oil palm plantations, leading to decreased water levels in the already degraded peatland (Selangor State Forestry Department, 2014).
The canal network is slowly being infilled since gaining reserve status in 1990 (Kumari, 1996). In 2007, the Selangor state government declared a 25-year moratorium on timber harvesting for the entire state (Selangor State Forestry Department, 2014). Subsequently, an Integrated Management Plan was put in place at North Selangor until 2023, with the Global Environment Centre at the centre of involvement. Restoration measures included drain blocking to raise water tables, replanting of native tree species in burned and degraded locations and the development of a fire prevention scheme through a forecasting system that is shared with local forestry departments (Selangor State Forestry Department, 2014).
Despite reserve status, North Selangor remains under continuous threat from encroaching agricultural conversion, road construction and forest fires (Tonks et al., 2017). More recently, potential reservoir development bordering the southeast of the reserve was proposed by the federal government who are seeking to increase and secure water supplies for the state of Selangor (Nagarajan Rengasamy, Global Environment Centre, personal communication, April 2018).
North Selangor experiences annual rainfall between 1,359 and 2,480 mm yr⁻1, mean temperature of 27°C and mean relative humidity of 79.3% (Selangor State Forestry Department, 2014). Whilst high temperatures are maintained all year round, rainfall varies seasonally, with dry periods from January to February and May to September, and wet periods between March to May and October to December (Wong et al., 2016). During the dry period, the peat swamp loses more water to evapotranspiration than it receives from rainfall and the atmosphere.
2.2 Field methods
2.2.1 Experimental design
Peat surface oscillations were measured using a total of 288 subsidence poles (manual) and three automated cameras clustered across fourteen sites in North Selangor. The fourteen sites represented four different peat condition classes, including degraded forest (n = 3), fire-affected scrubland (n = 3), recovering forest (n = 3) and smallholder oil palm (n = 5) (Figure 1; Figure 2). Peat condition classes were determined based on expertise on site histories and management from the forest rangers of Raja Musa and Sungai Karang Forestry Departments (personal communication) and information from the Integrated Management Plan produced by the Global Environment Centre (Selangor State Forestry Department, 2014; Table 1).
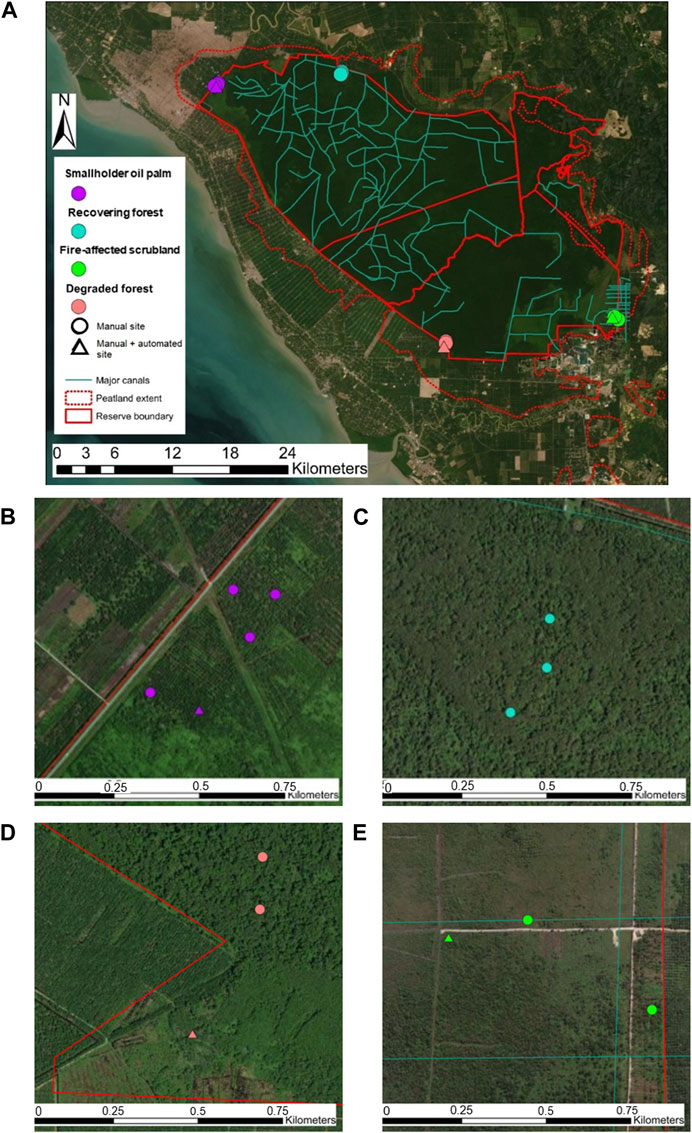
FIGURE 2. Map of North Selangor and location of poles and automated sites (A), including more detailed maps of: (B) smallholder oil palm sites; (C) recovering forest sites; (D) degraded forest sites; and (E) fire-affected scrubland sites.

TABLE 1. Descriptions of each peat condition class.
Figure 3 illustrates the timeline of measurements obtained for the experimental design. Five measurements of all subsidence poles for peat surface level and PVC piezometers for water table level were collected over the course of July 2018 to January 2020, covering three whole seasons. Automated time-lapse camera measurements took place from March 2019 to January 2020, covering approximately one and a half seasons. Automated water table level was also measured over this period. Two peat depth measurements were taken from each site in July 2018 and January 2020 to mark the start and the end of the measurement period for the subsidence poles and piezometers. Peat profile sampling for analysis of degree of peat decomposition at each site was conducted in January 2020.
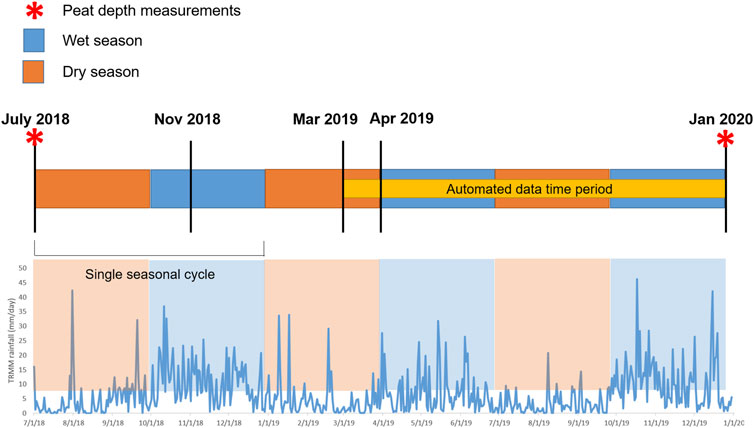
FIGURE 3. A schematic showing timings of manual measurements from July 2018 to January 2020, alongside TRMM 3B42 satellite rainfall estimates for North Selangor (mm day-1; Tropical Rainfall Measuring Mission, 0.25° resolution, from http://giovanni.gsfc.nasa.gov/giovanni/). The black markers represent timings of manual measurements. The yellow bar represents the time span of automated data.
2.2.2 Subsidence poles for detecting surface oscillations
The fourteen sites were originally equipped with 16 aluminium subsidence poles and 1 to 3 piezometers randomly located within an area of 50 m radius (Supplementary Figure S1), with a bias towards peat hollows for piezometer locations. This provided good coverage of measurement for peat surface elevation within the local area and allowed for average characterisation of surface motion at each site given the heterogenous surface of hummocks and hollows at some sites. A bias towards hollows for water table level existed because we experienced problems inserting the width of the corer and piezometer into the peat hummocks that were matted and embedded with thick tree roots.
Peat surface elevation was determined by measuring the distance between the top of each pole and the peat surface. Subsidence poles were inserted vertically into the peat and anchored into the underlying mineral substrate (marine clay) by attaching a bar to the base of each pole. Assuming that the substrate did not experience volume change, this ensured that poles remained static whilst the peat moved vertically with seasonal hydrological changes, therefore any changes in the measurement of the exposed poles was a measure of vertical motion of the peat surface only. Any intact leaf litter was removed from the surface around the subsidence poles for uniformity of surface measurement, as depth of leaf litter is inconsistent. In flooded conditions when the peat surface was more difficult to define due to lack of visibility and greater surface buoyancy, the peat surface was identified by resting the palm of the hand flat on the peat surface without compression and measuring from the bottom of the palm of the hand. Visits were infrequent (shortest time period between visits: 4 months), therefore there was minimal disturbance of measurement sites and limited compaction from footfall. During measurements, localised compaction and trampling around subsidence poles was minimised by not stepping within a 1 m radius of the poles.
Changes in peat elevation over time (surface oscillations) were calculated by subtracting each peat elevation measurement in the time series from the first measurement taken. After a data quality check to discard anomalous readings or poles that were clearly impacted by error during installation, data recording or damage from hunters or wildlife, an average peat surface oscillation time series was derived for each site. Due to the prevalence of damaged poles throughout the measurement period and at particular sites, a study on surface oscillation variability for individual poles within sites was deemed inappropriate due to lack of confidence in the magnitude of measurement for these poles. Instead, deriving averages from remaining unimpacted subsidence poles for each site was decided upon as the most responsible use of the data to minimize the impact of measurement error on results.
Relative water table level was measured at the same time as peat surface using PVC piezometers as the difference between the height of exposed pipe and the distance between the top of the pipe and the surface of the water table. Changes in relative water table level over time were calculated by subtracting each measurement in the time series from the first measurement taken. For the entire measurement period, the water table range was calculated as the difference between the minimum water table level (relative to peat surface) and the maximum water table level. Piezometers were closed off at the bottom end before anchoring into the substrate so that the pipe would not become blocked up by peat, and small holes were drilled into the pipe to allow water to pass in and out of the piezometer freely. Fewer piezometers were installed relative to subsidence poles because installation involved removal of the peat profile and was therefore more destructive.
Peat surface oscillation and water table fluctuations occur within a much shorter time frame than the frequency of measurement carried out in this study, even on a sub-daily basis with diurnal rainfall patterns in the tropics. It is therefore possible that the real maximum and minimum were not captured within this period, particularly with the presence of a weak El Niño period during the time frame of this study, bringing about drier conditions than usual.
2.2.3 Automated cameras for detecting surface oscillations
For higher temporal resolution measurements, three automated cameras were installed at a degraded forest site, a fire affected site and a smallholder oil palm site (automated sites) (Supplementary Figure S2), in line with the methodology outlined by Evans et al. (2021) and Sulaeman et al. (2022). This system used commercially-available and low-cost time lapse cameras (Wingscapes Timelapse Cam Pro WCB-00121, Alabaster, Alabama, United States), which have been successfully implemented in similar environments to monitor wildlife (Cheyne et al., 2016).
Each camera was attached to a metal stool and within a metal casing to provide a stable base for the camera whilst the stool moved vertically with the peat surface. The camera was positioned so that a horizontal strip could be seen within the field of view; this acted as a measurement level within photographs. The camera stool was then placed around a previously inserted subsidence pole anchored into the marine clay substrate, with a 1 m ruler attached to the exposed pole. This was also positioned within the camera field of view and behind the measurement level, so that the change in vertical motion could be measured. The camera focus was set to 18 cm, in accordance with the distance between the camera lens and the ruler. The bottom 10 cm of the camera stool legs had screws attached to anchor the stool to the peat surface. These screws were adjusted until the camera and stool top were horizontal. The complete camera system (Supplementary Figure S2A; Supplementary Figure S2B) therefore moved vertically with peat surface motion, taking pictures of the measurement level, subsidence pole and attached ruler (Supplementary Figure S2C). It also ensured that in flooded conditions, the camera remained anchored to the peat surface and its position was unaffected. Horizonal motion was minimised by imposing a 1 m step-free radius around each camera so that the peat surface was minimally impacted.
Pictures were taken daily at midday. Automated water loggers were set up within PVC pipe dip wells alongside each time-lapse camera (Heron Instruments Dipper Log and Diver® water level loggers) to create a detailed time series of hourly water table levels. Originally, six automated cameras were installed around North Selangor, including within the fourth peat condition class, recovering forest, however three camera systems were either stolen or water damaged, resulting in very limited data collection at these sites which therefore were removed from the data analysis.
2.2.4 Peat depth and sample collection
Peat depth was measured twice at the same randomly selected location at each site using an Eijkelkamp Russian peat corer, from which an average site value was calculated to use in the analysis. The dimensions of the peat corer were 50 cm length and 5.2 cm diameter. Both peat depth measurements were conducted in the dry season, when the peat would have been subject to compaction and consolidation and therefore potentially leading to underestimation of peat depth.
In January 2020, entire peat profiles from the surface to the underlying mineral substrate (marine clay) were sampled in 0.5 m sections (according to peat corer dimensions). Samples were split into 10 cm sections and sealed in plastic bags immediately in the field to avoid any peat mass or moisture loss. Samples were subsequently dried and ball milled at University of Nottingham Malaysia prior to being transported for Rock-Eval 6 pyrolysis at the British Geological Survey, UK.
2.3 GIS-derived variables
The distance of each site from the peat boundary and nearest major canal was measured using the ‘near’ function in ArcMap 10.4.1. Above-ground biomass stocks covering North Selangor were obtained from Brown et al. (2018). This data included ground-based estimates of secondary forest using allometric equations which were extrapolated to the whole reserve using cloud-free Sentinel-2 imagery from 13/02/2018 (Brown, 2020). As such, values derived for sites categorised as degraded forest and recovering forest are likely to be more accurate than those derived for fire-affected scrubland and smallholder oil palm. Above-ground biomass estimates were calculated by taking the average value of all pixels that overlapped with each field site. Wherever modelled above-ground biomass values were not available for sites that were not located within the reserve boundary, sites with comparable land cover were identified nearby and used as an estimation for above-ground biomass stocks at the site of interest.
2.4 Laboratory methods
Descriptors of physical peat properties (gravimetric water content and bulk density) were calculated for entire peat core profiles at 10 cm intervals. Gravimetric water content was determined by oven drying the peat samples at 105°C for 48 h. The peat samples were weighed before and after drying to determine the water mass lost (expressed as a percentage loss). Bulk density was calculated as the oven dried mass divided by total sample volume (g cm-3). Total sample volume in this case was 212.37 cm3, in line with the Eijkelkamp Russian peat corer dimensions.
Rock-Eval 6 pyrolysis was used to derive indices and parameters reflective of peat organic matter composition, thermal stability degree of decomposition (Disnar et al., 2003; Newell et al., 2016). It is an established tool for geochemistry screening in the petroleum sector (Behar et al., 2001) but has increasingly been used for organic geochemical analysis of peat soils (Upton et al., 2018; Cooper et al., 2019; Girkin et al., 2019; Garcin et al., 2022). A range of Rock-Eval parameters was generated in the analysis, but this research specifically used the parameters listed in Supplementary Table S1 for assessing organic geochemistry, including S1 and S2 (measures of the thermal stability of carbon present in the sample), HI (measure of the concentration of plant tissue and other polysaccharide-rich materials) and OI (measure of the oxidative loss of the soil due to aeration).
A subset of samples was brought forward for Rock-Eval analysis and samples were chosen before and after clear changes in bulk density along the peat profile to best capture events with the greatest magnitude of change. Powdered peat samples from ball milling were heated at 200°C for 3 min to determine the S1 parameter. The temperature was then increased at intervals of 25°C per minute up to 650°C in an inert N2 atmosphere to calculate the S2 parameter. After this, residual carbon was oxidised at intervals of 20°C per minute from 300°C to 850°C. A flame ionisation detector was used to measure the number of hydrocarbons released within these two stages of the pyrolysis process. Infrared detectors measured the amount of CO and CO2 released from thermal cracking of the organic matter.
Alongside HI and OI, the immature organic matter index (I-index) and the refractory organic matter index (R-index) are used in this study as measures of the intrinsic organic matter stability of the peat (Sebag et al., 2016). The I-index is calculated using the lower temperature zones representing more labile organic matter compounds. Alternatively, the R-index is calculated used higher temperature zones that reflect more thermally refractory organic matter compounds. These indices are calculated using the following equations:
Whereby A1, A2, A3 and A4 are deconvolutions of S2 pyrograms into temperature nodes of 200°C–340°C (A1), 340°C–400°C (A2), 400°C–460°C (A3) and >460°C (A4). Node A1 corresponds to labile, fresh plant matter, whilst node A2 is representative of lignin and cellulose. A3 and A4 nodes are more thermally stable and are therefore reflective of highly humidified and mature recalcitrant peat soil organic matter (A3) or charcoal (A4) (Saenger et al., 2013; Newell et al., 2016).
2.5 Statistical analysis
Prior to statistical analysis, subsidence rates were calculated by fitting a trendline to the manually measured peat surface elevation values for each subsidence pole (five time points from each), then calculating the difference in the trendline value between the start of the measurement period and the end of the measurement period. The average subsidence rate for each of the fourteen sites was then calculated from individual pole subsidence rates located within each site. This approach reduced the impact of any potential anomalies on subsidence rates. After this, average peat surface elevation values for each of the fourteen sites (five time points) were detrended by subtracting the linear trend from the data before calculating surface oscillation magnitude so that seasonal patterns could be observed without a trended bias of uplift or subsidence. The average surface oscillation magnitude for each site was calculated from the detrended data by subtracting the minimum peat surface elevation value from the maximum peat surface elevation value. Manual peat surface elevation measurements were infrequent and irregular (Figure 3), so surface oscillation magnitude could not be measured for each season individually. Instead, a single maximum and minimum was taken across all three seasonal cycles after detrending the manual peat surface elevation datasets.
Surface oscillation magnitude was also calculated for the three automated peat surface level datasets by fitting a trendline to the peat surface level time series, subtracting this linear trend from the automated peat surface level data, then subtracting the minimum peat surface elevation measurement from the maximum peat surface elevation measurement.
Mean water table level was calculated from manual water table measurements by averaging the values obtained for each piezometer. Water table range was calculated by subtracting the maximum water table level from the minimum water table level for each piezometer. At sites where more than one piezometer was present, an average of the mean water table level and water table range was calculated to produce a site average.
The peat profile was split into the following sections to explore changes in peat decomposition with depth: 0–50 cm, 50–100 cm and >100 cm. After checking both manual and automated water table datasets, depths between 0–50 cm were generally above the water table and therefore represent surface peats, 50–100 cm is within the zone of water table fluctuation, and >100 cm is mostly continuously waterlogged.
R software (version 4.0.2) was used to conduct all statistical analysis using the base package. Non-parametric statistical methods were used in this research because datasets were not normally distributed according to the Kolmogorov-Smirnov test. As such, the median values per peat condition class were reported rather than mean values because they are less affected by skewed datasets.
To address Research Objective 1, the Kruskal-Wallis test (with Bonferroni adjustment to correct for familywise error) was used to determine if statistically significant differences existed for peat condition descriptors between peat condition classes (degraded forest, fire-affected scrubland, recovering forest and smallholder oil palm). Pairwise Wilcoxon tests were run to establish which peat condition classes were significantly different from other classes. Graphs depicting changes in bulk density with depth of the peat profile were also plotted to illustrate whether differences in peat properties with depth and between classes existed. Additionally, correlations between Rock-Eval indices (R-index and I-index) and parameters (HI and OI) were run to observe differences in degradation patterns with depth and between peat condition classes.
Research Objective 2 was fulfilled firstly by establishing statistically significant differences in manual peat surface oscillation magnitudes between peat condition classes using Kruskal-Wallis tests. Linear regressions between time-lapse camera surface measurements and automated water table measurements then established the relationship between water table level and peat surface elevation. Next, scatter plots of the same data were produced to examine hysteresis of the peat surface relative to water table over the course of one seasonal rainfall cycle. Hysteresis plots were used to inform the dominant peat surface oscillation mechanism present in peat, as well as peat condition based on its capacity to retain water. As such, the shape of the hysteresis loop is determined by the pore structure of the peat. This enabled identification of the peat surface oscillation mechanisms present at North Selangor.
Finally, Spearman’s rank correlation tests were performed with Bonferroni adjustment to find significant correlations between peat surface oscillation magnitude and 27 other variables descriptive of peat condition and water content (Supplementary Table S2), satisfying Research Objective 3.
3 Results
3.1 Peat condition at North Selangor
Subsidence rate and mean water table depth were significantly different between peat condition classes (subsidence rate: Kruskal-Wallis chi-squared = 9, d. f. = 3, p = 0.03; mean water table depth: Kruskal-Wallis chi-squared = 10.77, d. f. = 3, p = 0.01). Subsidence rate was greatest at fire-affected scrubland, whilst growth rates were highest at smallholder oil palm. Contrastingly, mean water table depth was deepest at smallholder oil palm and shallowest at fire-affected scrubland (Table 2). Water table range was greatest at degraded forest sites, followed closely by smallholder oil palm. The lowest water table range was found at recovering forest. There were no significant differences between specific peat condition classes for either subsidence rate or mean water table depth using pairwise Wilcoxon tests with Bonferroni adjustments due to a small number of observations within each group.
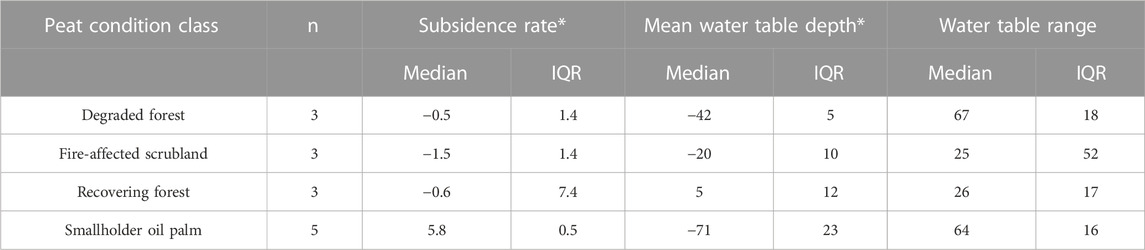
TABLE 2. Median and interquartile range (IQR) of mean subsidence rate (cm yr-1), mean water table depth (cm) and mean water table range (cm) for each site from manual measurements for the four peat condition classes. Significant differences between peat condition classes using Spearman’s rank correlation are denoted with an asterisk (*). Pairwise comparisons between peat condition classes were not possible due to the low number of sites per class (n = 3). Negative values represent surface subsidence; positive values represent surface uplift.
Significant differences in peat condition at different depths were also tested for. Within the 0–50 cm layer, bulk density was significantly different between peat condition classes (bulk density: Kruskal-Wallis chi-squared = 9.72, d. f. = 3, p = 0.02) (Table 3). Smallholder oil palm sites had the highest bulk density, lowest I-index and highest R-index values overall (Table 3).
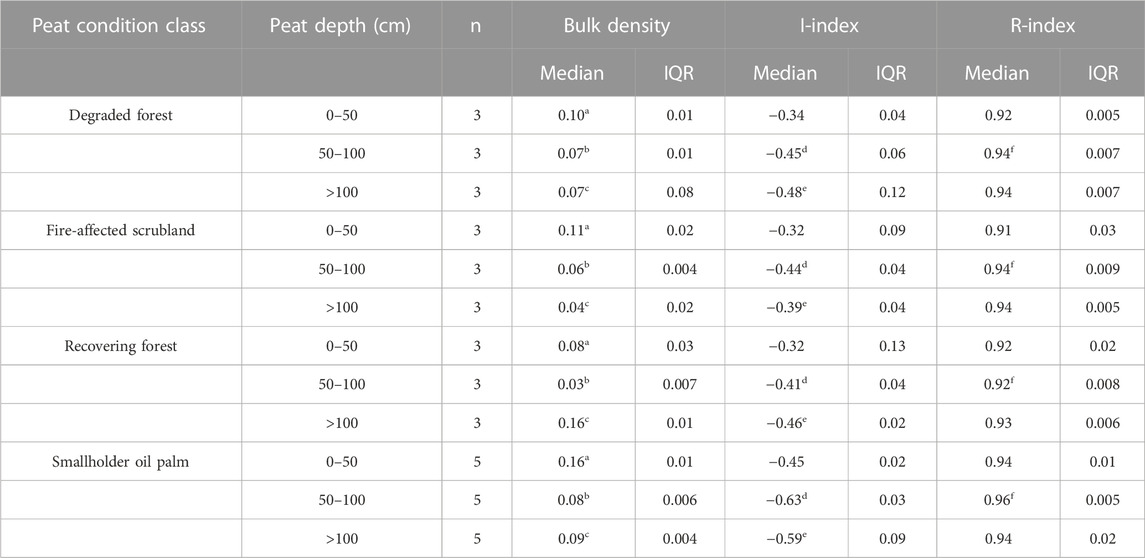
TABLE 3. Median and interquartile range (IQR) of mean bulk density (g cm-3), mean I-index and mean R-index for the 10 cm samples between peat depths of 0–50 cm, 50–100 cm and >100 cm depth for the four peat condition classes. Significant differences between peat condition classes within different depths using Spearman’s rank correlation share the same superscript letter. Pairwise comparisons between peat condition classes were not possible due to the low number of sites per class (n = 3).
At depths between 50–100 cm, bulk density, I-index and R-index were significantly different between peat condition classes (bulk density: Kruskal-Wallis chi-squared = 9.91, d. f. = 3, p = 0.02; I-index: Kruskal-Wallis chi-squared = 9.27, d. f. = 3, p = 0.03; R-index: Kruskal-Wallis chi-squared = 10.15, d. f. = 3, p = 0.02). Like the 0–50 cm layer, smallholder oil palm sites had the highest bulk density, lowest I-index values and highest R-index values overall (Table 3).
For peat deeper than 100 cm, bulk density and I-index were significantly different between peat condition classes (bulk density: Kruskal-Wallis chi-squared = 10.86, d. f. = 3, p = 0.01; I-index: Kruskal-Wallis chi-squared = 7.83, d. f. = 3, p = 0.05) (Table 3). In these deepest peat sections, bulk density was highest at recovering forest sites, I-index values were lowest at smallholder oil palm sites and R-index was equally highest at degraded forest, fire-affected scrubland and smallholder oil palm sites. Results exploring differences at different peat depths should be approached cautiously due to the differing sampling intervals with depth between bulk density (every 10 cm) and Rock-Eval parameters (intermittent maxima and minima in bulk density throughout the depth profile). In this way, mean and median values may not be directly comparable per depth layer.
Bulk density changes with depth of the peat profile showed that smallholder oil palm and recovering forest sites had the highest median bulk density values throughout the peat profile (smallholder oil palm: 0.08 g cm-3; recovering forest: 0.11 g cm-3; Figure 4). Further, all sites showed an overall reduction in bulk density with depth from the peat surface, except for recovering forest sites, which exhibited the highest bulk density values at the bottom of the peat profile (Figure 4). This is likely due to mixing with the clay substrate beneath the peat.
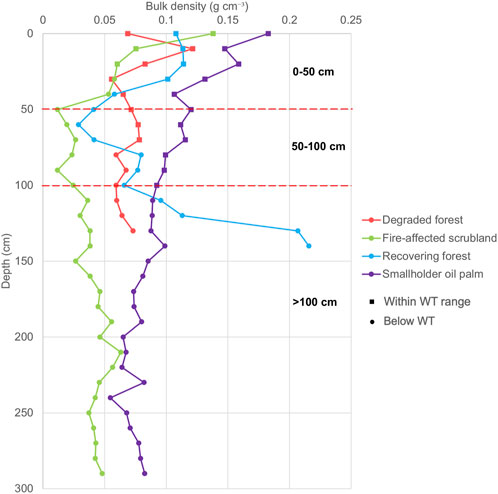
FIGURE 4. Bulk density plotted against depth for exemplar sites representing each peat condition class. Red dotted lines represent boundaries between 0–50 cm layer, 50–100 cm layer and >100 cm layer. Square points represent samples from within the water table (WT) range, circular points represent permanently saturated samples from below the WT range.
Peat decomposition trends can be visualised with an I-index vs. R-index diagram (I/R diagram). Samples from within the peat core profile generally exhibited the expected decomposition trend from surface peat to deeper peat; a decrease in the proportion of immature labile carbon (I-index) and increase in the proportion of refractory carbon (R-index) with depth (Figures 5, 6). For some shallower peat cores there was an overlap of values between samples from the 50–100 cm layer and >100 cm layer (Figure 5).
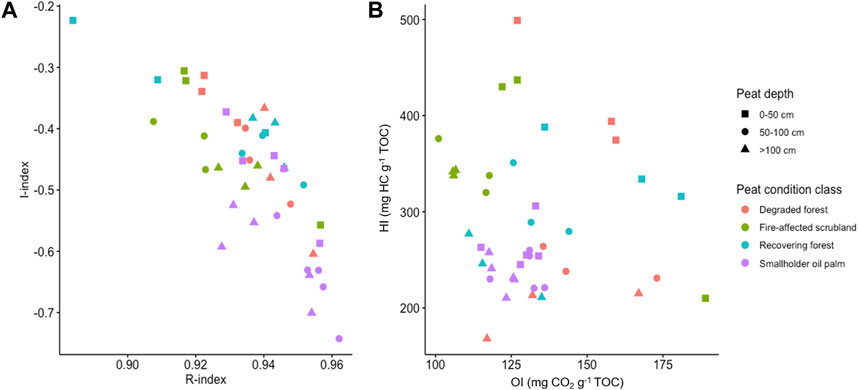
FIGURE 5. (A) I/R diagram for different peat depth categories for all sites. Greater R-index values represent more decomposed samples; more negative I-index values represent more decomposed samples. (B) Van Krevelen diagram. HI represents the concentration of plant tissue and other materials rich in polysaccharides; low values therefore represent more decomposed peat. OI represents the amount of oxygen relative to the amount of organic carbon present in a sample; the lower the value, the higher the oxidative loss of the soil from aeration. Each data point represents the mean value within each depth category for each site.
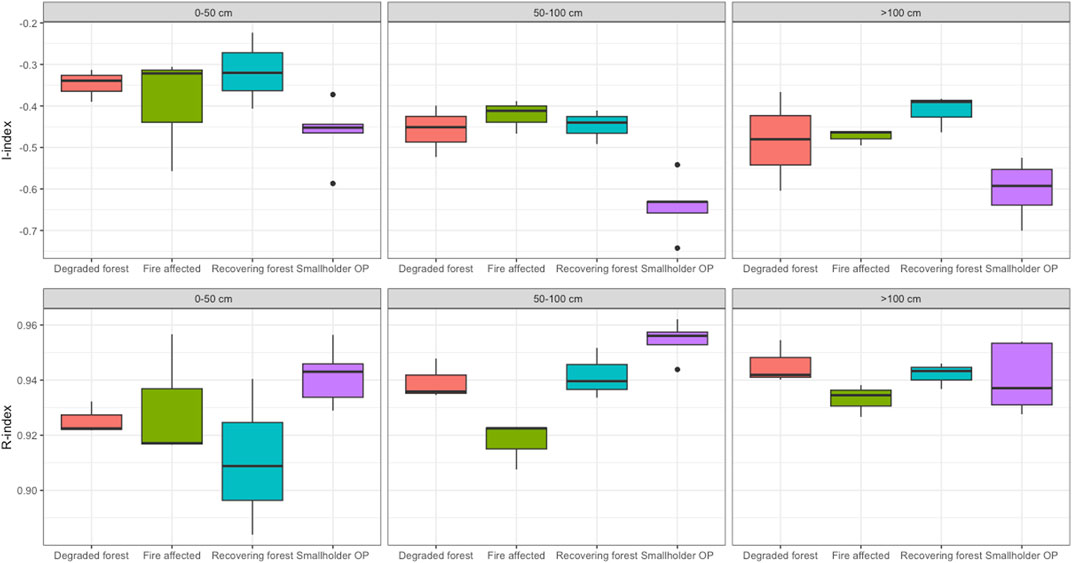
FIGURE 6. Boxplots of mean I-index and mean R-index values for each peat condition class at different depth categories.
Overall, smallholder oil palm sites were most degraded with the highest overall R-index values and lowest overall I-index values (median R-index: 0.95; median I-index: −0.59) and showed progressive decomposition from the surface to the peat base. Further, peat core samples collected from smallholder oil palm sites did not show the same patterns of decomposition with peat depth as fire-affected scrubland, degraded forest or recovering forest sites (Figure 5A). At these peat condition classes, samples from 50–100 cm depth (Table 3) displayed on average the highest R-index values (median: 0.96) and lowest I-index values (median: −0.63) compared to the 0–50 cm and >100 cm and were therefore more thermally stable and more mature. Samples from recovering forest sites also followed this trend in the I-index only, with a median of −0.44 compared to −0.32 at the 0–50 cm depth and −0.39 in the samples deeper than 100 cm.
The HI vs. OI diagram (Van Krevelen diagram) showed moderate to high HI and OI values across all samples (HI: 168–499 mg HC g TOC-1; OI: 101–189 mg CO2 g-1 TOC-1; Figure 5B). Samples from 0–50 cm depth generally displayed higher HI and OI values relative to peat samples from 50–100 cm depth and >100 cm depth. Smallholder oil palm sites exhibited the lowest and least variable HI and OI values for all peat depths overall. This reflected the more degraded plant material and increased humification of soil organic matter at these sites and supported the trends seen in the I/R diagram (Figure 5A).
3.2 Peat surface oscillation magnitudes and mechanisms at North Selangor
The surface oscillation magnitude determined from the subsidence poles differed significantly between peat condition classes (W = 9.27, d. f. = 3, p < 0.05). The largest surface oscillation magnitudes were found within the smallholder oil palm class, which exhibited at least twice the surface oscillation magnitude of other classes (Table 4). Surface oscillation magnitudes derived from subsidence pole data were corroborated by the automated camera magnitude at the fire-affected scrubland site, which fell within the interquartile range of the subsidence pole values. Despite not falling within the interquartile range, the automated camera magnitude for the smallholder oil palm site was highest across all peat condition classes (4.7 cm), in line with median subsidence pole magnitude (6.1 cm). However, at the degraded forest site, the automated camera magnitude was at least twice the magnitude of the median subsidence pole measurements and beyond the interquartile range (Table 4).
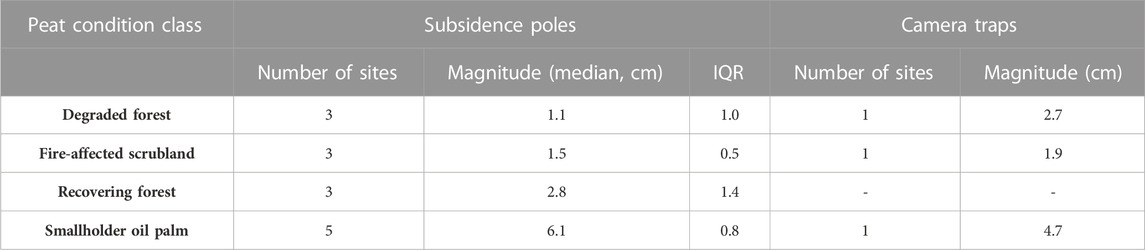
TABLE 4. Median and interquartile range (IQR) for the mean surface oscillation magnitude (cm) within each peat condition class for subsidence poles and automated camera traps. An IQR is not possible for automated camera data because only one camera was available for each peat condition class.
Peat surface oscillation was clearly associated with seasonal changes in water table. Peat surface elevation was highest in the wet season (October to November 2019) when water table levels were closer to the surface of the peat (or above the surface, in the case of the fire-affected scrubland and degraded forest sites) (Figures 7A, C, E). Similarly, peat surface elevation was lowest in the dry season (June to September 2019) when water table levels were at their lowest. Correlations between peat surface elevation and water table level (Figures 7B, D, F) showed strong and statistically significant relationships for all sites (degraded forest: R2 = 0.74, p < 0.001; fire-affected scrubland: R2 = 0.66, p < 0.001; smallholder oil palm: R2 = 0.94, p < 0.001). For an extended period, the water table at the automated degraded forest site was below the peat profile and within the marine clay substrate beneath; these observations are depicted in grey in Figure 7B.
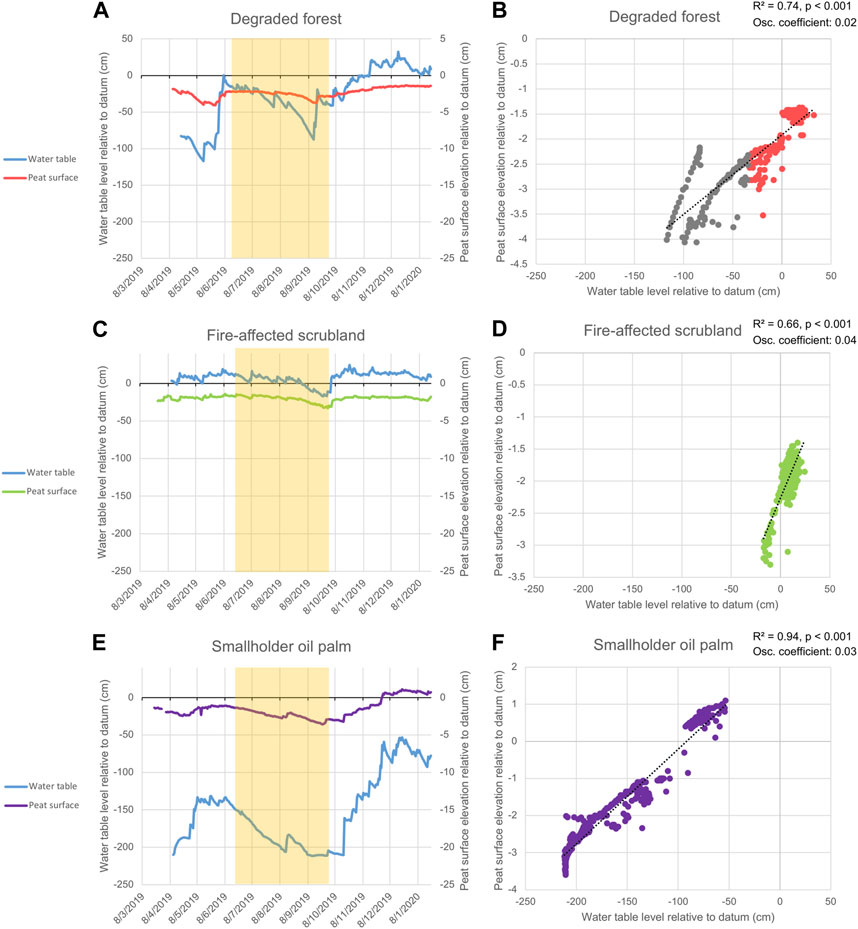
FIGURE 7. Time series plots and linear regressions of peat surface elevation relative to datum (cm) and water table level relative to datum (cm) from automated camera and water logger data from three of the four peat condition classes investigated in this study: degraded forest (A, B)); fire-affected scrubland (C, D)); and smallholder oil palm (E, F)). Blue time series represent water table levels. Grey points in the degraded forest plot (A) represent surface elevation points that took place when the water table was lower than the entire peat profile. Areas shaded yellow in the time series plots represent the dry season from June to September 2019.
Normalised peat surface oscillation is presented as the oscillation coefficient, whereby peat surface oscillation range is divided by water table range. If the relationship between peat surface elevation and water table level is near linear, the oscillation coefficient represents the slope of the relationship. The higher the oscillation coefficient, the greater the magnitude of peat volume change per unit of water table level change. The fire-affected scrubland site had the highest oscillation coefficient (0.04), followed by smallholder oil palm (0.03), followed by degraded forest (0.02) (Figures 7B, D, F). These figures could be indicative of the amount of above-ground biomass loading, where fire-affected scrubland had low density herbs and shrubs (107.1 Mg ha-1; Supplementary Table S3), smallholder oil palm had medium-density oil palm crops (85 Mg ha-1; Supplementary Table S3) and degraded forest had the highest density secondary forest cover (318.9 Mg ha-1; Supplementary Table S3). Greater loading results in suppression of volume change per unit change in water table due to increased mass and compaction at the surface, resulting in a lower oscillation coefficient seen in the degraded forest. A significant positive correlation between above-ground biomass loading and the bulk density of peat >100 cm depth (Spearman’s rho = 0.66, S = 155.34, p = 0.01; Supplementary Figure S3) supported this, showing that higher above-ground biomass loading resulted higher soil bulk density in the deeper peat layers at North Selangor. A significant relationship was not found between bulk density and above-ground biomass loading at other peat depths (0–50 cm and 50–100 cm).
A hysteretic effect was observed for surface elevation relative to water table depth, which was most apparent in the degraded forest site (Figure 8A). For a particular water table depth, the peat surface was higher during the dry period (June 2019 to September 2019) than during the wet period (April 2019 to June 2019) suggesting retention of water in the peat during the dry period at the degraded forest site. Contrastingly, the fire-affected scrubland (Figure 8B) and smallholder oil palm (Figure 8C) sites showed relatively little hysteresis, meaning that water was being lost during the dry period as quickly as it was being gained in the watering up period. At the fire-affected scrubland site, the peat surface remained at approximately the same elevation once the water table was fluctuating above the surface of the peat (Figure 8B). The smallholder oil palm site showed evidence of longer-term consolidation of the peat profile at the end of the drying out period once the water table reached its sustained lowest point (Figure 8A).
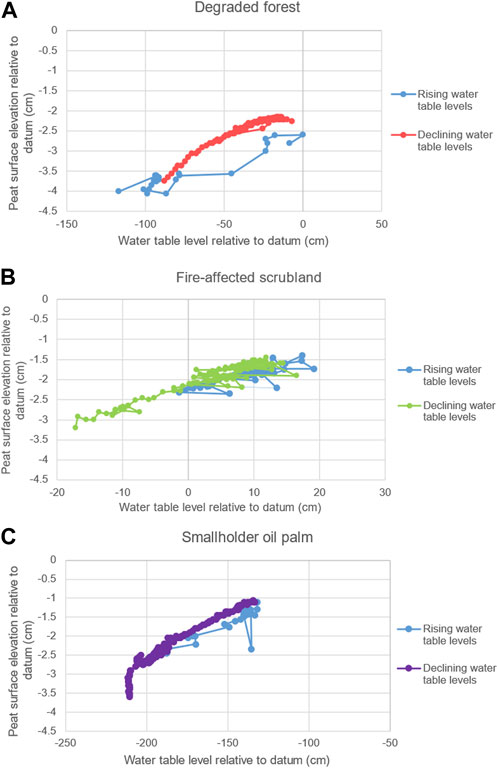
FIGURE 8. Relationship between peat surface elevation and water table elevation in metres relative to datum during one seasonal event from April 2019 to September 2019 for (A) degraded forest, (B) fire-affected scrubland, and (C) smallholder oil palm. Axis scales between plots do not match because these plots aim to display the hysteretic effect (or lack of) clearly at each site.
3.3 Relationship between peat surface oscillation magnitude and peat condition
For the fourteen sites measured, surface oscillation magnitude did not have a significant relationship with most variables descriptive of peat condition after Bonferroni adjustment (peat depth, water table range, Rock-Eval 6 parameters and indices and above-ground biomass), except for mean water table depth (Spearman’s rho = −0.81, S = 658, p = 0.001) and subsidence rate (Spearman’s rho = 0.81, S = 86, p < 0.001) (Figures 9A, C). The lowest mean water table depths were documented in smallholder oil palm sites (Figure 9B). Smallholder oil palm sites also exhibited the largest surface uplift rates (Figure 9D). Overall, smallholder oil palm sites showed the least variability in measurements between sites for mean subsidence rate and surface oscillation magnitude within this peat condition class (Figures 9B, D).
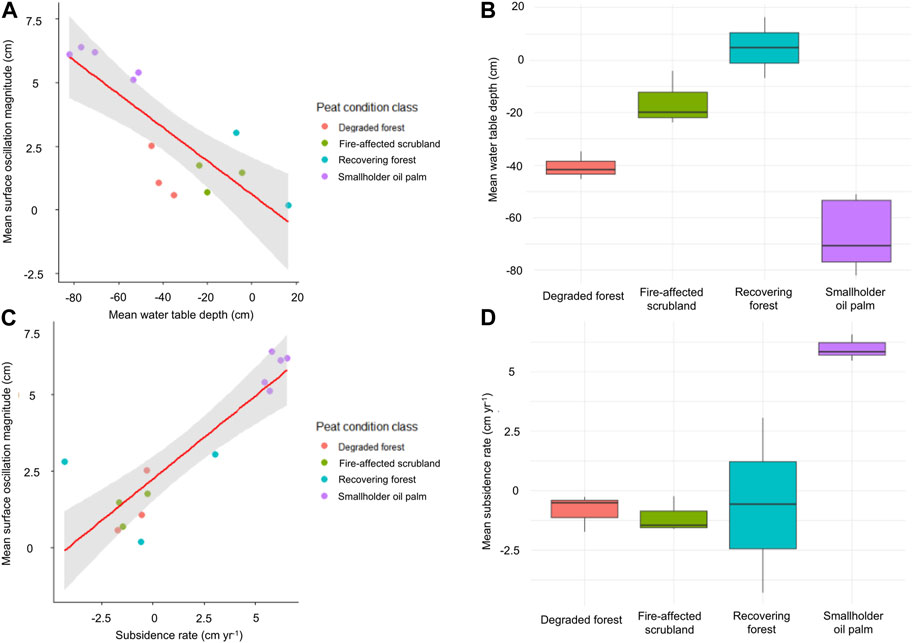
FIGURE 9. Correlations between mean surface oscillation magnitude and variables associated with peat condition, presented as: (A) scatter plot between mean surface oscillation magnitude (m) and mean water table (WT) depth (m); (B) boxplots of mean WT depths within each peat condition class, where median and IQR are displayed; (C) scatter plot between mean surface oscillation magnitude (m) and mean subsidence rate (m yr-1); (D) boxplots of subsidence rates within each peat condition class, where median and IQR are displayed.
4 Discussion
4.1 Peat condition at North Selangor
At North Selangor, decomposition of organic material increased with depth, corresponding with prior findings from Brown et al. (2023) in North Selangor, and by Hoyos-Santillan et al. (2015), Upton et al. (2018) in Panama and Garcin et al. (2022) in the central Congo Basin (excluding a ‘Ghost Interval’ of anomalous high decomposition). High HI values are typical for peats consisting of leaves and other materials that are rich in polysaccharides (Marchand et al., 2008), therefore the moderate to high HI values exhibited at North Selangor reflected large quantities of leaf litter input from the overlying vegetation to the peat surface. The decrease in HI and OI values with depth reflected more degraded plant material and increased humification of soil organic matter (Hetényi et al., 2006; Carrie et al., 2012; Sebag et al., 2016).
Between peat condition classes, significant differences in levels of degradation existed (Tables 2–4). There was greatest thermal stability of surface peat at smallholder oil palm sites compared to degraded forest and recovering forest sites, which corresponded with results from Cooper et al. (2019) at North Selangor. Smallholder oil palm sites were frequently managed, leaving the peat surface largely clear of leaf litter (Figure 1), reducing leaf litter inputs to the peat soil profile. This was reflected in the overall low HI and OI values for smallholder oil palm sites for all depth categories (Figure 5). These sites were also the most heavily drained and compacted for agriculture. Lowering of the water table enhances the diffusion of oxygen into the deeper layer of peat and is responsible for enhanced degradation of organic matter at these depths (Couwenberg et al., 2010). As such, greater proportions of recalcitrant carbon existed at smallholder oil palm sites compared to other peat condition classes. Overall, with the most consistent measurements as the most degraded and with the least variability between sites in the class, smallholder oil palm sites likely contributed to the significant difference in peat condition between peat condition classes.
Smallholder oil palm sites exhibited an anomalous relationship between direction of surface motion and mean water table level in this study, showing overall growth of the peat volume over time despite the lowest average water table level (Figure 9). It is possible that this was due to the particularly intense wet season that occurred in the latter part of the monitoring period (Figure 3), leading to an illusion of overall growth. Sites with relatively deeper peat and lowest water tables have the greatest amount of peat available in the aerated zone with potential for swelling with high rainfall input after the dry season. Therefore, sites such as smallholder oil palm sites in this study are expected to respond with the highest growth rates in response to such an event.
Evidence for restoration impacts was inconclusive. Whilst some recovering forest surface peats displayed the highest I-index and lowest R-index, and therefore least degraded samples in the whole study (Figure 5A), differences in the I- and R-index for surface peats were not statistically significant between peat condition classes. A review of tropical wetland soil bulk densities featuring a variety of peat conditions found that values ranged from 0.03 to 0.57 g cm-3 with a mean of 0.13 g cm-3 (Warren et al., 2012). More recent publications since this review have reported ranges of 0.08–0.16 g cm-3 (Lampela et al., 2014), 0.12–0.22 g cm-3 (Könönen et al., 2015) and 0.01–0.2 g cm-3 (Sinclair et al., 2020). Site average ranges of 0.02–0.23 g cm-3 and a mean of 0.09 g cm-3 at North Selangor corresponded with these ranges, therefore North Selangor exhibited typical bulk densities of tropical wetlands with a range of peat conditions. Overall, progress on restoration could not be concluded upon without measurement of an intact peat site as a benchmark and without understanding of its initial condition. Future work should seek a site with documented lack of disturbance so that the true extent of degradation of peat quality can be quantified.
4.2 Peat surface oscillation magnitudes at North Selangor
Alongside significant differences between peat condition classes for peat degradation, significant differences in surface oscillation magnitude also existed at North Selangor. Smallholder oil palm sites exhibited greatest magnitudes overall (median: 6.1 cm). Therefore, the most degraded sites with the highest bulk densities throughout the peat profile showed the greatest surface oscillation magnitudes.
Surface oscillation magnitudes of tropical peat at North Selangor were within the bounds of those reported for both disturbed and undisturbed temperate peatlands (1–10 cm) (Fritz, 2006). However, oscillation coefficients vary, with North Selangor oscillation coefficients ranging from 0.02 to 0.04, which was lower than the range of 0.04–1 presented in the temperate peatland literature review (Fritz, 2006). This difference in oscillation coefficients between tropical and temperate peat may be due to consolidation from the greater mass and stabilising effect of roots from secondary forest and established oil palm crops. For example, smallholder oil palm peatlands with high surface loads and regular agricultural activity will decrease the storage capacity of the peat. Therefore, the same amount of rainfall will produce a greater change in the water level and hence high amplitude motion, however the amount of motion per unit change will be relatively low, as reflected in the data from North Selangor. Similarly, the least consolidated and compacted fire-affected scrubland showed the largest movement per unit change due to the presence of less stiff material and lack of above-ground biomass loading. The impact of loading is likely a more influential factor for determining bulk density measurements and peat volume change in tropical settings than in temperate settings, which are typically colonised with grasses, mosses and sedges with low above-ground biomass and lower loading on the peat surface.
Water table ranges were more variable across North Selangor than for temperate sites within the same literature review conducted by Fritz (2006), which showed water table ranges of 0.18 m–0.75 m, narrower than the ranges measured at North Selangor (0.09 m–1.25 m; Supplementary Table S3). Peat depths at the sites monitored in North Selangor were shallow (0.34 m–3.25 m; Supplementary Table S3) relative to those documented by Fritz (2006) (0.5 m–12.5 m) and were located near the peat boundary. All of the above would result in oscillation coefficients of smaller magnitude due to less material being subjected to compaction and consolidation (also documented by Howie and Hebda (2018)), as well as greater loading from secondary forest and established oil palm stands compared to herbaceous vegetation that exists on temperate peatlands. A study from Padang Island, Indonesia documented water table ranges of 0.5 m–1.3 m over an equivalent time period and across a range of land uses (Ismail et al., 2021), which mostly overlaps with the ranges found at North Selangor and suggests that water table conditions are typical of tropical peatland settings with a range of peat conditions. Additionally, Ismail et al. (2021) showed that water table range was highest at a site situated closest to plantations, which is also true of smallholder oil palm sites at North Selangor (Table 2), as well as and degraded forest sites which were closely situated to large-scale oil palm plantations (Figure 2D). A review study of peatland geology found that largest peat depths had been reported up to 20 m in Rajang, Sarawak (Omar et al., 2022), with greater peat depths generally found across Borneo and Sumatra compared to the Malay peninsula. This indicates that there is greater potential for large volume change and surface oscillations at other sites in southeast Asia, particularly with the widespread threat of agricultural encroachment resulting in more variable water tables.
Inconsistent measurements over the period of three seasons meant that this study was unable to capture the dynamics of each season individually. This meant that temporal patterns of surface oscillation could not be determined. Spatially, subsidence pole sites and corresponding peat sampling sites ranged from 0.34 m to 3.25 m peat depth (Supplementary Table S3), which was below the average recorded peat depth for North Selangor (3.6 m) (Selangor State Forestry Department, 2014). This was due to the selection of sites close to the peat boundary due to inaccessibility of the dense tropical peatland forest, as well as the practicality of returning to sites on a semi-regular basis for repeated surface displacement measurements. All forest sites were located 0.5–1 km from the forest boundary. As such, there was limited representation of the surface oscillation patterns of the interior of the peatland system at North Selangor, as well as the condition of the deepest peats across the reserve. With the above in mind, future experimental design should incorporate more widespread use of automated cameras and water table loggers to complement manual measurements of peat surface displacement. This will enable characterisation of the temporal dynamics of tropical peat surface oscillation, as well as the magnitude. This overcomes the inconvenience of measuring a large network of subsidence poles on a regular basis, as well as the problem of potential aliasing of surface motion patterns from inconsistent measurement.
4.3 Peat surface oscillation mechanisms at North Selangor
The magnitude of peat surface oscillations is dependent on the dominant peat surface oscillation mechanism (Fritz, 2006). For example, compaction or consolidation of peat results in substantially lower surface level changes than the flotation mechanism for an equivalent change in water table level (Roulet, 1991). Therefore, with relatively smaller surface oscillation magnitudes, peat surface oscillation dynamics at North Selangor were likely dominated by compaction and consolidation mechanisms. This was supported by the significant positive correlation between above-ground biomass loading and bulk density of peat >100 cm deep (Supplementary Figure S3), which illustrated that greater surface loading could result in increased bulk density at deeper peat layers through compaction and consolidation. We anticipated that ebullition would be more likely to occur in tropical peatlands than in boreal and temperate peatlands due to higher temperatures all year round, however we did not observe peat surface level change occurring independently of water table level change during this period at North Selangor that could be attributed to this mechanism.
Change in water table level alters the effective stress (as defined by Terzaghi (1943), whereby pore water pressure and total stress holds the soil particles together), inducing changes in peat volume. However, a delay in the response of peat volume change at the degraded forest site suggested that cause (water table fluctuations) and effect (peat volume change) in this system operated on different time scales. Whilst water tables in ombrotrophic tropical peatlands experience diurnal fluctuations, hysteresis loops showed that it took days until the forces imposed on the peat matrix reached equilibrium through peat volume change. Greater hysteretic response is found in peat that is dominated by compaction and consolidation mechanisms (Fritz, 2006); further evidence that these were the dominant controls of peat surface oscillation at North Selangor.
A hysteretic response of peat surface elevation to water table level change was found seasonally and episodically with daily automated monitoring at the degraded forest site; as the water table rose from the within the marine clay substrate to reach the peat profile (34 cm water table depth), the peat surface uplifted accordingly after a lag period of about 4 days. When the water table dropped below the peat profile and into the substrate, the peat surface level also dropped. In contrast, almost no hysteretic effect was detected at the fire-affected scrubland site (Figure 8B). Peat flotation is attributed as the main peat surface oscillation mechanism when no hysteresis is present because the peat surface moves correspondingly with water table level change without lag (Fechner-Levy and Hemond, 1996; Fritz, 2006). However, this is not believed to be the case at the fire-affected scrubland site, where no breaks in the peat profile were detected when the peat profile was sampled. Instead, this is attributed to surface water, which was present for the majority of the monitored period at the fire-affected scrubland site, and no peat surface uplift was detected when the water table was fluctuating above the peat surface due to full saturation of the peat profile (Figure 7C; Figure 8B).
It is important to determine whether the peat surface oscillations measured are purely a product of volume change within the peat profile alone. There was evidence from the automated results at the degraded forest site that volume changes in the marine clay layer below the peat profile may also have contributed to surface oscillation patterns. The water table logger data at this site showed that as the water table level dipped below the peat profile (only 35 cm deep) and into the marine clay substrate, more rapid subsidence of the peat surface occurred compared to when the water table level was within the peat profile (Figure 7B). Whilst this could be lagged shrinkage of the peat, the underlying marine clay may have also swelled and shrank in response to water inputs and outputs. This could result in the documentation of greater magnitudes of peat surface oscillation at sites where the water table dropped below the bottom of the peat profile than was truly occurring. As such it is important to establish whether the water table is fluctuating within the peat profile when interpreting surface oscillation magnitude as an indicator for peat condition.
4.4 Relationship between peat surface oscillation magnitude and peat condition
Results from this study indicate that water table measurements, monitoring presence of surface water or subsidence measurements could be used to infer peat surface oscillation magnitudes in tropical peatlands (Figure 9). Whilst degradation indices differed between peat condition classes and at different depths, they were not significant for determining peat surface oscillation magnitude because all sites were still highly degraded. In such circumstances, only mean water table depth and subsidence rate had a relationship with peat surface oscillation magnitude, whereby the higher the water table, the less variable the surface, and the greater the subsidence rate, the less variable the surface. These outcomes were anticipated, since high water tables reduce the amount of peat subject to compaction, and the degradation of organic matter results in reduced elasticity, resulting in reduced surface oscillation magnitudes.
Further evidence of water table levels dictating surface oscillation magnitude was the significant relationship between water table elevation and peat surface height from the automated data (Figure 7). Over the course of three seasonal cycles of study, the peat surface at all sites was highest during the wet season and lowest at the end of the dry season. Despite this relationship, water table range did not have a strong relationship with surface oscillation magnitude. This is likely due the impact of flooding on some sites whereby the peat remains fully saturated independently of how deep the water is on top of the peat. It could also be due to the influence of volume change in the underlying marine clay compounding peat volume change at sites with very shallow peat where the water table dipped below the peat profile. This phenomenon will have resulted an inflation in the surface oscillation magnitudes of the degraded forest sites in the results. Future work should collect marine clay samples for analysis to determine the structure of the clay and whether it is capable of volume change with water inputs. This will determine whether surface oscillation patterns can be attributed to peat volume change alone.
Almendinger et al. (1986) hypothesised a positive relationship between peat depth and surface oscillation magnitude. This is because there is more peat available to be subject to compaction and consolidation, compounding peat volume change. Whilst this was evident at the smallholder oil palm sites, this study also suggests that additional processes may be at play in degraded tropical peatlands, where the depth relationship with surface motion was not observed, mainly because fire-affected scrubland sites exhibited small peat surface oscillation magnitudes despite having the deepest peat profiles. This relationship was likely masked by sustained high water tables with low fluctuations at the fire-affected scrubland sites, resulting in peat that was permanently wet with limited oscillations. Where peat depth did not vary where significant degradation had occurred (as was the case for sites selected in North Selangor), then the control of peat depth on surface oscillation magnitude may have been overtaken by other tropical peatland variables such as mean water table or subsidence rate.
5 Conclusion
Results from this study showed that peat condition and surface oscillation magnitudes were significantly different between peat condition classes and within classes at different depths at North Selangor. Links between peat condition and surface oscillation magnitude were made, whereby the most degraded tropical peats with the highest bulk densities throughout the peat profile from high surface loading and low average water tables had greater surface oscillation magnitudes, however this was attributed to anomalously large water table level rises at these sites. The dominant peat surface oscillation mechanisms present at all sites were compaction and consolidation. Mean water table level and subsidence rate were the significant variables that controlled surface oscillation magnitude, however this study recommends further investigation towards surface and within-water table range bulk density measurements and surface loading to explore the full range of controls on compaction and consolidation in tropical peatland environments. Overall, the impacts of disturbance across North Selangor were clearly documented with analysis of peat condition, however, evidence for restoration was inconclusive. Nevertheless, tropical peatland restoration is important in the face of climate change, where increased variability in seasonality is projected (Feng et al., 2013). Methods should focus on ways to promote water retention by improving water storage capacity by raising water tables, the planting and maintenance of native species that promote peat growth, and fire prevention. A peat profile in good condition with large depth facilitates greater peat surface oscillation, whereby peat compaction and consolidation move the peat surface slightly closer to the water table level during moisture stress periods. This in turn decreases the saturated hydraulic conductivity of the peat, reducing water loss by lateral flow (Price, 2003). This function is fundamental for increased water storage capacity in anticipation of changing seasonality at low latitudes (Feng et al., 2013).
Data availability statement
The original contributions presented in the study are included in the article/Supplementary Material, further inquiries can be directed to the corresponding author.
Author contributions
ML conceived and executed the research under the supervision of SS, CE, DL, SE, AJ-S, and KM. Field experimental design setup, data collection, laboratory work, data processing, analysis and manuscript writing by ML. Field experimental design setup and data collection by ML, CB, AJ-S, NC, CM, AB, and JG. Rock-Eval laboratory analysis by CV. Manuscript editing by ML, SS, CE, DL, CB, AJ-S, and CM. All authors contributed to the article and approved the submitted version.
Funding
This work was supported by: a Natural Environment Research Council (NERC) and Biotechnology and Biological Sciences Research Council (BBSRC) PhD studentship as part of the STARS Doctoral Training Partnership [NE/M009106/1]; a United Kingdom Space Agency (UKSA) funded project named Peatland Assessment in SE Asia by Satellite (PASSES) [06459-01]; a BBSRC Research Grant with SUSTAINPEAT [BB/P023533/1]; funding from the University of Nottingham Asia Research Institute.
Acknowledgments
Special thanks to the Global Environment Centre and Selangor State Forestry Department for sharing their expert knowledge on peat condition and subsidence patterns at North Selangor Peat Swamp Forest. Thanks also to Kovin Sivanasvaran, Justin Yoh and the PASSES team for fieldwork assistance, to Professor Chris Gibbins for facilitating the fieldwork, and to Beth Malley for sharing her geotechnical engineering expertise on the behaviour of underlying marine clay substrate.
Conflict of interest
Author AS was employed by the Terra Motion Limited.
The remaining authors declare that the research was conducted in the absence of any commercial or financial relationships that could be construed as a potential conflict of interest.
Publisher’s note
All claims expressed in this article are solely those of the authors and do not necessarily represent those of their affiliated organizations, or those of the publisher, the editors and the reviewers. Any product that may be evaluated in this article, or claim that may be made by its manufacturer, is not guaranteed or endorsed by the publisher.
Supplementary material
The Supplementary Material for this article can be found online at: https://www.frontiersin.org/articles/10.3389/fenvs.2023.1182100/full#supplementary-material
References
Ainuddin, N., and Goh, K. (2010). Effect of forest fire on stand structure in Raja Musa peat swamp forest reserve, Selangor, Malaysia. J. Environ. Sci. Technol. 3 (1), 56–62. doi:10.3923/jest.2010.56.62
Almendinger, J. C., Almendinger, J. E., and Glaser, P. H. (1986). Topographic fluctuations across a spring fen and raised bog in the Lost River Peatland, Northern Minnesota. J. Ecol. 74, 393–401. doi:10.2307/2260263
Alshammari, L., Boyd, D. S., Sowter, A., Marshall, C., Andersen, R., Gilbert, P., et al. (2020). Use of surface motion characteristics determined by InSAR to assess peatland condition. J. Geophys. Res. Biogeosciences 125, e2018JG004953. doi:10.1029/2018jg004953
Baird, A. J., Low, R., Young, D., Swindles, G. T., Lopez, O. R., and Page, S. (2017). High permeability explains the vulnerability of the carbon store in drained tropical peatlands. Geophys. Res. Lett. 44, 1333–1339. doi:10.1002/2016gl072245
Behar, F., Beaumont, V., and Penteado, H. D. B. (2001). Rock-eval 6 technology: Performances and developments. Oil Gas Sci. Technol. 56, 111–134. doi:10.2516/ogst:2001013
Bradley, A. V., Andersen, R., Marshall, C., Sowter, A., and Large, D. J. (2022). Identification of typical ecohydrological behaviours using InSAR allows landscape-scale mapping of peatland condition. Earth Surf. Dyn. 10, 261–277. doi:10.5194/esurf-10-261-2022
Brown, C., Boyd, D. S., Sjögersten, S., Clewley, D., Evers, S. L., and Aplin, P. (2018). Tropical peatland vegetation structure and biomass: Optimal exploitation of airborne laser scanning. Remote Sens. 10, 671. doi:10.3390/rs10050671
Brown, C., Boyd, D. S., Sjögersten, S., and Vane, C. H. (2023). Detecting tropical peatland degradation: Combining remote sensing and organic geochemistry. PLoS ONE 18 (3), e0280187. doi:10.1371/journal.pone.0280187
Brown, C. (2020). Remote sensing investigation of tropical peat swamp forest degradation. PhD thesis. UK: University of Nottingham.
Carrie, J., Sanei, H., and Stern, G. (2012). Standardisation of Rock–Eval pyrolysis for the analysis of recent sediments and soils. Org. Geochem. 46, 38–53. doi:10.1016/j.orggeochem.2012.01.011
Cheyne, S. M., Sastramidjaja, W. J., Rayadin, Y., and Macdonald, D. W. (2016). Mammalian communities as indicators of disturbance across Indonesian Borneo. Glob. Ecol. conservation 7, 157–173. doi:10.1016/j.gecco.2016.06.002
Cobb, A. R., Hoyt, A. M., Gandois, L., Eri, J., Dommain, R., Salim, K. A., et al. (2017). How temporal patterns in rainfall determine the geomorphology and carbon fluxes of tropical peatlands. Proc. Natl. Acad. Sci. 114, E5187–E5196. doi:10.1073/pnas.1701090114
Cooper, H. V., Vane, C. H., Evers, S., Aplin, P., Girkin, N. T., and Sjögersten, S. (2019). From peat swamp forest to oil palm plantations: The stability of tropical peatland carbon. Geoderma 342, 109–117. doi:10.1016/j.geoderma.2019.02.021
Couwenberg, J., Dommain, R., and Joosten, H. (2010). Greenhouse gas fluxes from tropical peatlands in south-east Asia. Glob. Change Biol. 16, 1715–1732. doi:10.1111/j.1365-2486.2009.02016.x
Disnar, J. R., Guillet, B., Kéravis, D., Di-Giovanni, C., and Sebag, D. (2003). Soil organic matter (SOM) characterization by rock-eval pyrolysis: Scope and limitations. Org. Geochem. 34, 327–343. doi:10.1016/s0146-6380(02)00239-5
Dommain, R., Couwenberg, J., and Joosten, H. (2010). Hydrological self-regulation of domed peatlands in south-east Asia and consequences for conservation and restoration. Mires & Peat 6.
Dommain, R., Couwenberg, J., and Joosten, H. (2011). Development and carbon sequestration of tropical peat domes in south-east Asia: Links to post-glacial sea-level changes and Holocene climate variability. Quat. Sci. Rev. 30, 999–1010. doi:10.1016/j.quascirev.2011.01.018
Evans, C. D., Callaghan, N., Jaya, A., Grinham, A., Sjogersten, S., Page, S. E., et al. (2021). A novel low-cost, high-resolution camera system for measuring peat subsidence and water table dynamics. Front. Environ. Sci. 9, 630752. doi:10.3389/fenvs.2021.630752
Fechner-Levy, E. J., and Hemond, H. F. (1996). Trapped methane volume and potential effects on methane ebullition in a northern peatland. Limnol. Oceanogr. 41, 1375–1383. doi:10.4319/lo.1996.41.7.1375
Feng, X., Porporato, A., and Rodriguez-Iturbe, I. (2013). Changes in rainfall seasonality in the tropics. Nat. Clim. Change 3, 811–815. doi:10.1038/nclimate1907
Fritz, C. (2006). Surface oscillation in peatlands: How variable and important is it? MPhil thesis. New Zealand: The University of Waikato.
Garcin, Y., Schefuß, E., Dargiehawthorne, G. C. D., Lawson, I. T., Sebag, D., Biddulph, G. E., et al. (2022). Hydroclimatic vulnerability of peat carbon in the central Congo Basin. Nature 612, 277–282. doi:10.1038/s41586-022-05389-3
Girkin, N., Vane, C., Cooper, H., Moss-Hayes, V., Craigon, J., Turner, B., et al. (2019). Spatial variability of organic matter properties determines methane fluxes in a tropical forested peatland. Biogeochemistry 142, 231–245. doi:10.1007/s10533-018-0531-1
Glaser, P. H., Chanton, J., Morin, P., Rosenberry, D., Siegel, D., Ruud, O., et al. (2004). Surface deformations as indicators of deep ebullition fluxes in a large northern peatland. Glob. Biogeochem. Cycles 18, 2069. doi:10.1029/2003gb002069
Hetényi, M., Nyilas, T., Sajgó, C., and Brukner-Wein, A. (2006). Heterogeneous organic matter from the surface horizon of a temperate zone marsh. Org. Geochem. 37, 1931–1942. doi:10.1016/j.orggeochem.2006.07.019
Hooijer, A., Page, S., Jauhiainen, J., Lee, W., Lu, X., Idris, A., et al. (2012). Subsidence and carbon loss in drained tropical peatlands. Biogeosciences 9, 1053–1071. doi:10.5194/bg-9-1053-2012
Howie, S. A., and Hebda, R. J. (2018). Bog surface oscillation (mire breathing): A useful measure in raised bog restoration. Hydrol. Process. 32, 1518–1530. doi:10.1002/hyp.11622
Hoyos-Santillan, J., Lomax, B. H., Large, D., Turner, B. L., Boom, A., Lopez, O. R., et al. (2015). Getting to the root of the problem: Litter decomposition and peat formation in lowland neotropical peatlands. Biogeochemistry 126, 115–129. doi:10.1007/s10533-015-0147-7
Ismail, I., Haghighi, A. T., Marttila, H., Kurniawan, U., Karyanto, O., and Kløve, B. (2021). Water table variations on different land use units in a drained tropical peatland island of Indonesia. Hydrology Res. 52 (6), 1372–1388. doi:10.2166/nh.2021.062
Kellner, E., Waddington, J., and Price, J. (2005). Dynamics of biogenic gas bubbles in peat: Potential effects on water storage and peat deformation. Water Resour. Res. 41, 3732. doi:10.1029/2004wr003732
Kelly, T. J., Baird, A. J., Roucoux, K. H., Baker, T. R., Honorio Coronado, E. N., Ríos, M., et al. (2014). The high hydraulic conductivity of three wooded tropical peat swamps in northeast Peru: Measurements and implications for hydrological function. Hydrol. Process. 28, 3373–3387. doi:10.1002/hyp.9884
Könönen, M., Jauhiainen, J., Laiho, R., Kusin, K., and Vasander, H. (2015). Physical and chemical properties of tropical peat under stabilised land uses. Mires peat 16 (8), 1–13.
Kumari, K. (1996). An application of the incremental cost framework to biodiversity conservation: A wetland case study in Malaysia. London: Centre for Social and Economic Research on the Global Environment.
Lampela, M., Jauhiainen, J., and Vasander, H. (2014). Surface peat structure and chemistry in a tropical peat swamp forest. Plant Soil 382, 329–347. doi:10.1007/s11104-014-2187-5
Marchand, C., Lallier-Vergès, E., Disnar, J. R., and Kéravis, D. (2008). Organic carbon sources and transformations in mangrove sediments: A rock-eval pyrolysis approach. Org. Geochem. 39, 408–421. doi:10.1016/j.orggeochem.2008.01.018
Mishra, S., Page, S. E., Cobb, A. R., Lee, J. S. H., Jovani-Sancho, A. J., Sjögersten, S., et al. (2021). Degradation of Southeast Asian tropical peatlands and integrated strategies for their better management and restoration. J. Appl. Ecol. 58, 1365–1387. doi:10.1111/1365-2664.13905
Newell, A. J., Vane, C. H., Sorensen, J. P., Moss-Hayes, V., and Gooddy, D. C. (2016). Long-term Holocene groundwater fluctuations in a chalk catchment: Evidence from rock-eval pyrolysis of riparian peats. Hydrol. Process. 30, 4556–4567. doi:10.1002/hyp.10903
Ng, P. K., Tay, J., and Lim, K. K. (1994). Diversity and conservation of blackwater fishes in Peninsular Malaysia, particularly in the North Selangor peat swamp forest. Hydrobiologia 285, 203–218. doi:10.1007/bf00005667
Olefeldt, D., Roulet, N. T., Bergeron, O., Crill, P., Bäckstrand, K., and Christensen, T. R. (2012). Net carbon accumulation of a high-latitude permafrost palsa mire similar to permafrost-free peatlands. Geophys. Res. Lett. 39 (3), 355. doi:10.1029/2011gl050355
Omar, M. S., Ifandi, E., Sukri, R. S., Kalaitzidis, S., Christanis, K., Lai, D. T. C., et al. (2022). Peatlands in southeast Asia: A comprehensive geological review. Earth-Science Rev. 232, 104149. doi:10.1016/j.earscirev.2022.104149
Page, S. E., Rieley, J. O., Shotyk, Ø. W., and Weiss, D. (1999). Interdependence of peat and vegetation in a tropical peat swamp forest. Philosophical Trans. R. Soc. Lond. Ser. B Biol. Sci. 354 (1391), 1885–1897. doi:10.1098/rstb.1999.0529
Page, S. E., Siegert, F., Rieley, J. O., Boehm, H. D. V., Jaya, A., and Limin, S. (2002). The amount of carbon released from peat and forest fires in Indonesia during 1997. Nature 420, 61–65. doi:10.1038/nature01131
Page, S., Mishra, S., Agus, F., Anshari, G., Dargie, G., Evers, S., et al. (2022). Anthropogenic impacts on lowland tropical peatland biogeochemistry. Nat. Rev. Earth Environ. 3, 426–443. doi:10.1038/s43017-022-00289-6
Posa, M. R. C., Wijedasa, L. S., and Corlett, R. T. (2011). Biodiversity and conservation of tropical peat swamp forests. BioScience 61, 49–57. doi:10.1525/bio.2011.61.1.10
Prentice, R. (2011). “The peatland biodiversity management toolbox: A handbook for the conservation and management of peatland biodiversity in southeast Asia,” in A Compilation. ASEAN Peatland Forests Project–Rehabilitation and Sustainable Use of Peatland Forests in Southeast Asia (ASEAN Secretariat and the Global Environment Centre). Copyright © Association of Southeast Asian Nations (ASEAN) and the Global Environment Centre 2011.
Price, J. S. (2003). Role and character of seasonal peat soil deformation on the hydrology of undisturbed and cutover peatlands. Water Resour. Res. 39, 1302. doi:10.1029/2002wr001302
Renou-Wilson, F., Moser, G., Fallon, D., Farrell, C. A., Müller, C., and Wilson, D. (2019). Rewetting degraded peatlands for climate and biodiversity benefits: Results from two raised bogs. Ecol. Eng. 127, 547–560. doi:10.1016/j.ecoleng.2018.02.014
Ribeiro, K., Pacheco, F. S., Ferreira, J. W., De Sousa-Neto, E. R., Hastie, A., Krieger Filho, G. C., et al. (2021). Tropical peatlands and their contribution to the global carbon cycle and climate change. Glob. change Biol. 27 (3), 489–505. doi:10.1111/gcb.15408
Roulet, N. (1991). Water table and peat surface level fluctuations in a subarctic fen. Arct. Alp. Res. 23, 1986.
Saenger, A., Cécillon, L., Sebag, D., and Brun, J. J. (2013). Soil organic carbon quantity, chemistry and thermal stability in a mountainous landscape: A rock–eval pyrolysis survey. Org. Geochem. 54, 101–114. doi:10.1016/j.orggeochem.2012.10.008
Sebag, D., Verrecchia, E., Cécillon, L., Adatte, T., Albrecht, R., Aubert, M., et al. (2016). Dynamics of soil organic matter based on new Rock-Eval indices. Geoderma 284, 185–203. doi:10.1016/j.geoderma.2016.08.025
Selangor State Forestry Department (2014). Integrated management plan for North Selangor peat swamp forest 2014–2023. Avaliable At: http://www.gec.org.my/index.cfm?&menuid=287.
Setiawan, Y., Pawitan, H., Prasetyo, L., and Permatasari, P. (2017). “Monitoring tropical peatland ecosystem in regional scale using multi-temporal MODIS data: Present possibilities and future challenges,” in IOP Conference Series: Earth and Environmental Science (Bristol: IOP Publishing), 012052.
Sinclair, A. L., Graham, L. L., Putra, E. I., Saharjo, B. H., Applegate, G., Grover, S. P., et al. (2020). Effects of distance from canal and degradation history on peat bulk density in a degraded tropical peatland. Sci. Total Environ. 699, 134199. doi:10.1016/j.scitotenv.2019.134199
Sulaeman, D., Hafiyyan, I., Hamzah, H., Evans, C. D., Jovani-Sancho, A. J., and Jaya, A. (2022). Measuring peat motion and water table dynamics on tropical peatlands using high-resolution time-lapse camera in four different land cover types across South Sumatra and Central Kalimantan. IOP Conf. Ser. Earth Environ. Sci. 1025, 012011. doi:10.1088/1755-1315/1025/1/012011
Tonks, A. J., Aplin, P., Beriro, D. J., Cooper, H., Evers, S., Vane, C. H., et al. (2017). Impacts of conversion of tropical peat swamp forest to oil palm plantation on peat organic chemistry, physical properties and carbon stocks. Geoderma 289, 36–45. doi:10.1016/j.geoderma.2016.11.018
Upton, A., Vane, C. H., Girkin, N., Turner, B. L., and Sjögersten, S. (2018). Does litter input determine carbon storage and peat organic chemistry in tropical peatlands? Geoderma 326, 76–87. doi:10.1016/j.geoderma.2018.03.030
Warren, M., Kauffman, J., Murdiyarso, D., Anshari, G., Hergoualc'H, K., Kurnianto, S., et al. (2012). A cost-efficient method to assess carbon stocks in tropical peat soil. Biogeosciences 9, 4477–4485. doi:10.5194/bg-9-4477-2012
Wong, C. L., Liew, J., Yusop, Z., Ismail, T., Venneker, R., and Uhlenbrook, S. (2016). Rainfall characteristics and regionalization in Peninsular Malaysia based on a high resolution gridded data set. Water 8, 500. doi:10.3390/w8110500
Wösten, J. H. M., Clymans, E., Page, S. E., Rieley, J. O., and Limin, S. H. (2008). Peat-water interrelationships in a tropical peatland ecosystem in Southeast Asia. Catena 73 (2), 212–224. doi:10.1016/j.catena.2007.07.010
Wösten, J., Ismail, A., and Van Wijk, A. (1997). Peat subsidence and its practical implications: A case study in Malaysia. Geoderma 78, 25–36. doi:10.1016/s0016-7061(97)00013-x
Yule, C. M., and Gomez, L. N. (2009). Leaf litter decomposition in a tropical peat swamp forest in Peninsular Malaysia. Wetl. Ecol. Manag. 17, 231–241. doi:10.1007/s11273-008-9103-9
Keywords: tropical peat, water table, peat condition, subsidence, hydraulic conductivity, volume change, surface oscillation, peat elasticity
Citation: Ledger MJ, Evans CD, Large DJ, Evers S, Brown C, Jovani-Sancho AJ, Callaghan N, Vane CH, Marshall C, Baskaran A, Gan JY, Sowter A, Morrison K and Sjögersten S (2023) Tropical peat surface oscillations are a function of peat condition at North Selangor peat swamp forest, Malaysia. Front. Environ. Sci. 11:1182100. doi: 10.3389/fenvs.2023.1182100
Received: 08 March 2023; Accepted: 31 July 2023;
Published: 08 August 2023.
Edited by:
Krishnaswamy Jayachandran, Florida International University, United StatesReviewed by:
Saraswati Saraswati, University of Waterloo, CanadaMaija Lampela, Geological Survey of Finland, Finland
Tim Rixen, Leibniz Centre for Tropical Marine Research (LG), Germany
Copyright © 2023 Ledger, Evans, Large, Evers, Brown, Jovani-Sancho, Callaghan, Vane, Marshall, Baskaran, Gan, Sowter, Morrison and Sjögersten. This is an open-access article distributed under the terms of the Creative Commons Attribution License (CC BY). The use, distribution or reproduction in other forums is permitted, provided the original author(s) and the copyright owner(s) are credited and that the original publication in this journal is cited, in accordance with accepted academic practice. No use, distribution or reproduction is permitted which does not comply with these terms.
*Correspondence: Martha J. Ledger, bWxlZGdlckBoa3UuaGs=