 Léon Serre-Fredj1,2
 Léo Chasselin
 Pascal Claquin
- 1Normandie Université, Université de Caen Normandie, Centre de Recherches en Environnement Côtier (CREC)—Station Marine, Luc-sur-Mer, France
- 2Laboratoire Biologie des ORganismes et Ecosystèmes Aquatiques (BOREA, UMR CNRS 8067), Muséum National d’Histoire Naturelle, Sorbonne Université, Université de Caen Normandie, Université des Antilles, CREC—Station Marine, Luc-sur-Mer, France
The Seine estuary is a typical model of a system in which phosphorus (P) inputs have been considerably reduced to reduce past eutrophication, with a parallel decrease in phytoplankton biomass. However, reducing P alone while concentrations of nitrate (N) remains high led to a dystrophic nutrient balance in the estuary (high N/P and N/Si). To identify the drivers of primary production and phytoplankton communities in the highly anthropised Seine estuary, sampling was performed along a 110-km stretch over a period of 3 years. Photosynthetic parameters were measured with a single turnover active fluorimeter and the phytoplankton community was assessed using a fluoroprobe and flow cytometry. The results revealed an annual primary production of 33 g C.m−2.y−1 which was largely controlled by light availability (turbidity) but also by nutrients in late spring and summer period. Massive blooms, not seen since 2002, were observed in a specific area of the estuary. None of the nutrients measured explained the particular location of the blooms but phytoplankton production and productivity indicators were higher in this specific zone excluding a biomass accumulation phenomenon. The local effect of tide slowdown increasing water residence time in this exact part of the estuary could explain the bloom area. The question thus arises: does phosphate play a role as a limiting nutrient? The diatom bloom led to total depletion of Si, but no clear limitation of P was observed. Nevertheless, the decrease in Si appears to have played a key role by triggering a succession from diatoms (microphytoplankton) to chlorophytes (nanophytoplankton) and hence affecting phytoplankton composition. The N/P balance appeared to be more important than the absolute concentration of P to explain the phytoplankton dynamics and the biomass decrease observed the last decades.
1 Introduction
Estuaries are highly dynamic systems at the interface of freshwater and marine systems. They provide important ecosystem services including supplying and cycling nutrients (Basset et al., 2013), recreational facilities, water purification (Daniell et al., 2020), fisheries (O’Higgins et al., 2010), estuaries also play a role in carbon cycling (Chen and Borges, 2009), and the environmental degradation of these ecosystems will affect these services (Barbier et al., 2011). A major cause of the observed environmental problem in estuaries is “cultural eutrophication” (referred later as eutrophication) (Rabalais et al., 2009; Smith and Schindler, 2009), defined as a syndrome in aquatic ecosystem associated with overproduction of organic matter induced by uncontrolled growth of primary producer due to human-induced inputs of nitrogen (N) and phosphorus (P) (Nixon, 2009; Pannard et al., 2017; Le Moal et al., 2019). These inputs affect both the concentration of nutrients and their stoichiometry (Martin et al., 2008; Watanabe et al., 2017). Nutrient concentrations and the stoichiometry ratio are two of the main drivers of the phytoplankton community in estuaries (Kocum et al., 2002; Chu et al., 2014). As phytoplankton sustain all higher trophic levels through primary production there is a need to deepen our knowledge of the factors that control the phytoplankton community and primary production. In addition to nutrients, many other divers affect primary production in estuaries: river flow and residence time (Kristiana et al., 2012; Maier et al., 2012; Raimonet et al., 2018; Stumpner et al., 2020) which influence turbidity and therefore light availability (Kromkamp et al., 1995; Kocum et al., 2002; Liu et al., 2018), temperature (Kristiana et al., 2012), and grazing (Sautour et al., 2000; Quinlan et al., 2009; Kimmerer and Thompson, 2014). Beside production and biomass, changes in nutrient concentrations affect the phytoplankton community composition (Larsson et al., 2017; Van Meerssche and Pinckney, 2019) and can lead to community shift (Sieracki et al., 1993; Rocha et al., 2002). Recently, due to management policies, most European rivers/estuaries have reversed eutrophication by reducing P and thus increased the N/P ratio (Peñuelas et al., 2013; Ibáñez and Peñuelas, 2019; Westphal et al., 2020).
The Seine estuary is a typical example of human-affected ecosystems where nutrient inputs from the watershed increased drastically over several decades led to eutrophication and reducing the ecological quality status of the estuary (Dauvin et al., 2007) before management policies were applied (Billen et al., 2007). Efforts to reduce eutrophication partly succeeded by reducing phosphorus inputs (Romero et al., 2016), but consequently led to high N/P and Si/P ratios in the estuary (Figure 1) increasing the unbalanced stoichiometry which result in significant change toward silica and phosphorus limitations (Garnier et al., 1995; Garnier et al., 2010). Although environmental concerns focus on the management of this estuary, and even though this ecosystem compartment is important for ecological and eutrophication assessment (Pinckney et al., 2001; Garnier and Billen, 2007), the dynamics of the phytoplankton community and primary production are poorly documented (Garnier et al., 1995; Garnier et al., 2001; Morelle et al., 2018). Nevertheless nutrient light availability has already been point out as primary production main limitations downstream part of the estuary (Morelle et al., 2018). A succession of diatoms bloom triggered by a decrease of river flow in early spring linked with a depletion of silica shifting to Chlorophycees around May (Garnier et al., 1995).
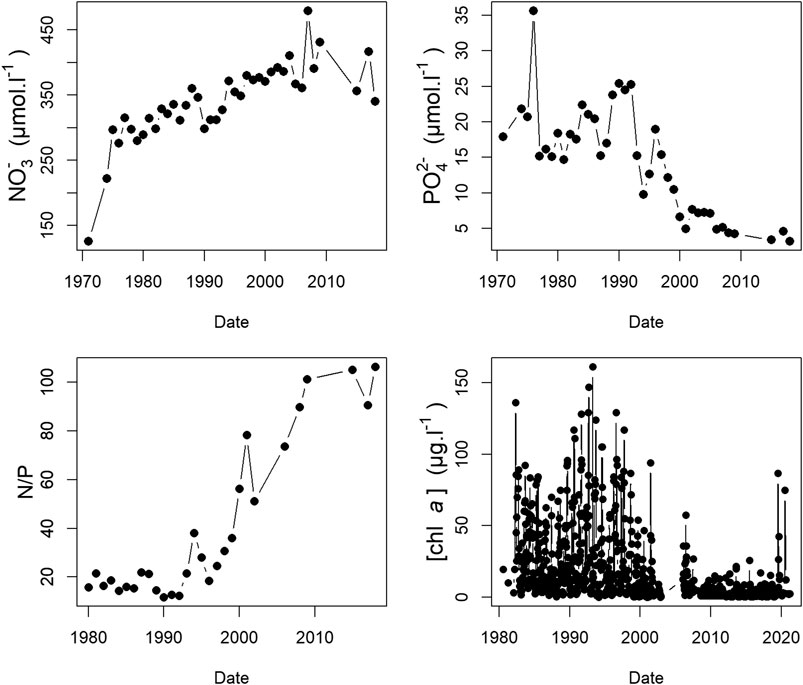
FIGURE 1. Historical variations in the Seine estuary measured at Duclair (Kp: 278): Nitrates (µmol.L−1), Phosphates (µmol.L−1), N/P ratio, chl a concentration (µg.L−1). Source: banque hydro (https://www.hydro.eaufrance.fr/) and this study.
Primary production needs to be measured to characterise the functioning and eutrophication of a given system (Nixon, 1995; Cloern et al., 2014). Fluorimetry methods including single turnover active chlorophyll fluorimetry (Kromkamp and Forster, 2003; Boatman et al., 2019), which allows high frequency (one measure each 10 min) measurement of photosynthetic parameters, are better suited to estimate the primary production of such dynamic systems than traditional carbon isotope (14C or 13C) methods (Marcel et al., 1994) which require longer incubation times and are less easy to deploy. Morelle et al. (2018) combined active fluorimetry measurements and carbon incorporation in the downstream part of the Seine estuary and found a good correlation between estimations made with both methods, thereby supporting the use of active fluorimetry. To study the impact of changes in nutrient inputs on primary production in the Seine estuary, sampling campaigns were conducted along a 110- km transect over a period of 3 years. High frequency (one measure each 10 min) measurements of photosynthetic parameters and environmental parameters were performed to improve our knowledge of the estuary at the spatial scale. We combined this approach with discrete sampling along the transect of phytoplankton community structure using flow cytometry and nutrient to assess potential changes in the phytoplankton community and limitation patterns.
The specific objectives of our study were to:
1) Investigate the effect of the unbalanced stoichiometry on the phytoplankton community;
2) Assess potential spatial variability in primary production;
3) Identify the drivers of primary production and estimate the annual autochthone primary production in this highly anthropized estuary.
2 Materials and methods
2.1 Site description
The macrotidal Seine Estuary, located on the French coast of the English Channel is characterized by a semidiurnal tidal range reaching 8 m in the downstream part (Kp: 355, Figure 2). It is one of the largest estuaries on the Northwestern European continental shelf, with a catchment area of more than 79,000 km2. Kilometric points (Kp) are used to measure the distance along the Seine estuary from Paris following the path of the river. The estuary stretches from the Bay of Seine near Honfleur (Kp: 355) open to the English Channel to the weir of Poses upstream (Kp: 202), limit of the tidal influence (Grasso et al., 2018). The water is brackish from Honfleur (Kp: 355) to Vieux-Port (Kp: 324), then there is freshwater upstream (See Supplementary Figure S1). The maximum turbidity zone is located Between Honfleur (Kp: 355) and Tancarville (Kp: 337) depending on the tide and river outflow. Seine river flow ranges from 100 to 2,300 m3 s−1 in low and high river flow periods, respectively, with a mean annual flow around 450 m3 s−1 computed over the last 20 years (Grasso et al., 2018). Regarding the vertical structure of the water column, with the exception of the brackish area (Kp: 324—355) there is no saline or thermal stratification in the estuary (Data not shown), therefor surface sampled value are mostly relevant for the whole water column.
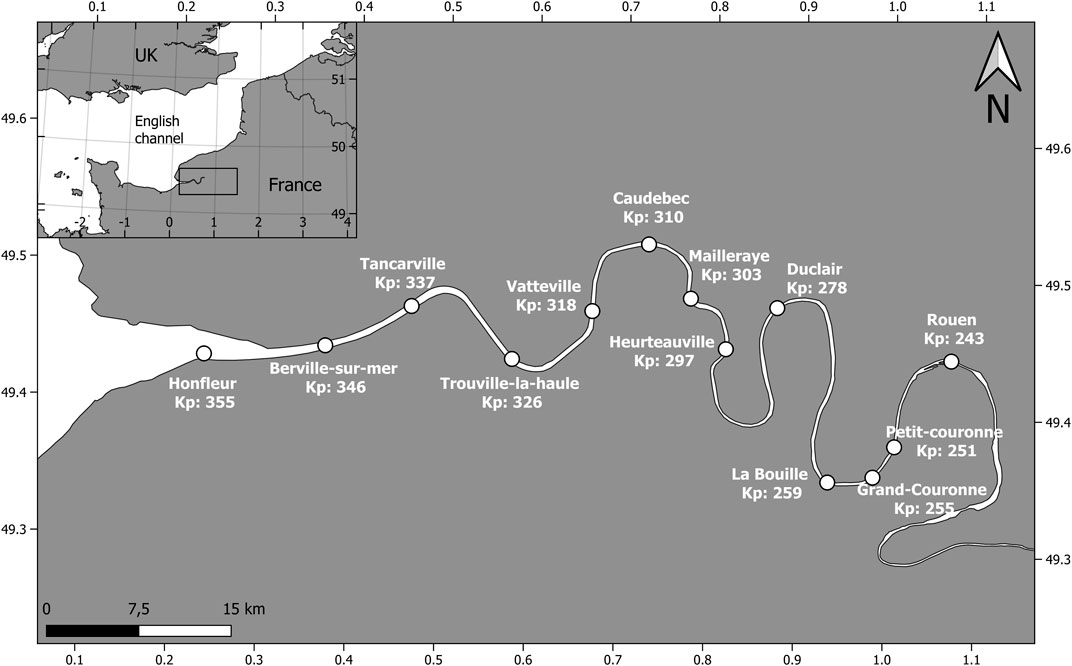
FIGURE 2. Seine Estuary map: White point display the 13 sampling stations and their kilometre point (Kp).
2.2 Estuary transect and sampling strategy
Measurements were made on cruises lasting 1 day between Honfleur (49°25’45” N 0°13’50.00” E− Kp: 355) and Rouen (49°26’33” N 1°4’15.00”—Kp: 246), a 110-km transect (Figure 2) for a total of 13 cruises (12/02/2019—12/07/2021). The cruise was scheduled to follow the rising tide to avoid a bias due to changes in water masses. For measurements, a diaphragm pump (UF0812—Whale®, United Kingdom) pumping at 1 m depth was used continuously along the cruising path. At 8-min intervals, measurements were made of physical parameters (temperature, salinity, oxygen, turbidity) with a multi-parameter probe (YSI 6600, YSI, United States), of multispectral fluorescence with a fluoroprobe (BBE–Moldaenke), NO3− with a OPUS (TriOS Mess- and Datentechnik GmbH Germany), PAR (RBR solo3 PAR), and of photosynthetic parameters with a FRRf-ACT2 (Chelsea Technologies, United Kingdom) until March 2020 and a LabSTAF. (Chelsea Technologies, United Kingdom) from June 2020. Discrete samples were also taken at 13 sites along the transect (Figure 2). On these fixed points water sampling were taken for the analysis of Chl a, inorganic nutrients (NO3−, PO43−, Si(OH)4), phytoplankton community (using flow cytometry), and alkaline phosphatase activity. All transect date and measurements are summarized in the Supplementary Table S1.
2.3 Fixed point high frequency data: flow, oxygen, turbidity and temperature
Flow measurements for the River Seine made at Vernon, a station located upstream from our study area, were taken from the HYDRO database (https://www.hydro.eaufrance.fr). High frequency (one measure each 10 min) oxygen and turbidity data monitored at four stations (Kp: 245, 265, 337, 355) and temperature data monitored at one station (Kp: 355) were provided by the Synapses monitoring network (https://www.seine-aval.fr/synapses/).
2.3.1 High frequency photosynthetic measurements
In order to assess phytoplankton primary production and photosynthetic parameters the variable fluorimetry methods were used during the cruise. This non-invasive method base on biophysical occurring in the photosystem II (PSII) is fast and robust to estimate primary production (Hughes et al., 2018a; Morelle et al., 2018). Fluorescent light curves (FLCs) were performed using FRRf-ACT2 or LabSTAF (see fluorimeter type used on the Supplementary Table S1). The samples were analysed after a 3-min period of dark incubation for oxidation of quinone A (QA). At the end of the dark period Fo (minimum fluorescence) was measured using weak non-actinic light.
For the ACT2-FRRF measurements, a single turnover (ST) saturation phase was delivered with one hundred 1-µs flashlets at 2-µs intervals to measure minimum (Fo) and maximum (Fm) fluorescence (452 nm) using the biophysical model of Kolber et al. (1998).
For the LabSTAF measurements, a single turnover (ST) saturation phase was delivered with a 100-µs solid excitation pulse (450 nm) to measure minimum and maximum fluorescence, as described in Boatman et al. (2019). The maximum quantum efficiency of PSII (Fv/Fm) was calculated as (Genty et al., 1989) (Eq. 1):
Samples were then exposed to 10 light steps of increasing PAR (from 0 to 2,000 µmol photon.s−1.m−2) for 30-s each step. The effective quantum efficiency of PSII (Fq’/Fm’) was measured at each light step as (Genty et al., 1989) (Eq. 2):
where Fm’ is the maximum fluorescence under light and F’ is the steady state fluorescence under light.
The relative electron transport rate (rETR, relative unit) was calculated for each irradiance (E) as (Eq. 3):
The maximum relative electron transport rate (rETRmax) was estimated by fitting the FLC data to the model of Webb et al. (1974) modified by Boatman et al. (2019) using ACT2RUN and RunSTAF (Chelsea Technologies, United Kingdom) software to estimate α and Ek with α, the initial slope of the FLC, and Ek the light saturation index (Eq. 4):
rETRmax was calculated as:
Using the absorption algorithm of Oxborough et al. (2012), the PSII electrons flux per unit volume was calculated as follows:
where Ka is an inherent constant of the FRRf. The maximum PSII flux per unit volume (JVPIImax) which account for the phytoplankton production was calculated as:
where JVPIImax is expressed in mmol e−.m-3.h−1
The electron transport rate (ETRIImax) which account for the phytoplankton productivity (e.g., production by units of biomass) was calculated as:
where [chl a]F is the concentration of chl a (µg.L−1) estimated from a calibrated value of Fo. At each cruise a linear relationship ([chl a]ext = xFo + b) was established between extracted chl a measured at each of the 13 discrete sampling sites (see below). The relationships were always significant with mostly high R2 (between 0.33 and 0.92, mean = 0.65), the low values correspond to the low chl a transect in winter. The ETRIImax is expressed in mmol e−.mg chla−1.h−1
2.3.2 Integration of primary production
Phytoplankton primary production (PPP) was incorporated according to time (t), depth (z) and area (s) to calculate phytoplankton gross primary production along the estuary. Incorporation covered the period from the 12th of March 2019 to the 16th of March 2021 (735 days ≈ 2 years) to avoid seasonal bias:
Ez (PAR at depth z) was calculated using the Beer-Lambert law to a euphotic depth (Zeu, depth where only 1% of surface PAR remains) was reached:
where E0 is the surface PAR, and kd the light attenuation coefficient calculated from a regression using turbidity from Morelle et al. (2018). Light data were provided by the nearest weather station (located 45 km from the study area). Water column stratification was not considered in the calculation (see 2.1).
To convert PSII flux par unit volume JVII(E) into carbon production, an electron requirement for carbon fixation (Фe,c) of 8 was used (Morelle et al., 2018).
2.3.3 Flow cytometry
Unfixed samples were analysed in the evening of the day the samples were collected with the CytoSense (Cytobuoy b.v., Netherland). The CytoSense is designed to measured large cells (1–800 μm width, few mm in length) (Thyssen et al., 2014), it is equipped with a blue laser (488 nm, 50 mW) and a green laser (552 nm, 50 mW). This produces pulse shapes based on the inherent optical properties of the particle when they cross the laser: sideward angle scatter (SWS), forward scatter (FWS), red (FLR, 668–734 nm), orange (FLO, 601–668 nm) and yellow fluorescence (FLY, 536–601 nm). The threshold was set at 16 mV to reduce acquisition of data on non-photosynthetic particles triggered on FLR, for each sample, 380 µL were analysed with a speed of 2.0 μL s−1. The CytoSense can analyse chains, cells, or colonies between 1 and 800 µm in diameter, microspheres of 1.0 µm yellow-green fluorescent, FluoSpheres®) and 1.6 µm (non-fluorescent, provided by Cytobuoy) and 2 μm, 6 μm, 10 μm, 20 µm (Fluoresbrite® YG microsphere, Polyscience) were used to calibrate size recording.
To distinguish the phytoplankton, five clusters were determined using the cells’ optical properties and attributed to picocyanobacteria (corresponding to Synechococcus-like), picoeukaryotes, nanoeukaryotes, microphytoplankton and Cryptophytes. The picocyanobacteria cluster has the smallest FWS signal and a high orange fluorescence (FLO) signal, which matches very small cells with a high concentration of phycoerythrin. Nano-eukaryotes and microphytoplankton cells were differentiated from pico-eukaryote cells using the amplitude of the FLR signal and the bead signal. Cryptophyte clusters have higher FLO than picocyanobacteria due to the high concentrations of phycoerythrin in their cells and an FWS equivalent to nano-eukaryotes and microphytoplankton cells (Olson et al., 1989; Thyssen et al., 2014). The CytoSense is also equipped with a camera which is able to take picture of cells, allowing in some transect after visual analysis to roughly identify some microphytoplankton genus. For technical reasons, cytometric analyses were only performed after the 9th of June 2020 transect.
2.3.4 Measurement of inorganic nutrients (NO3−, PO43-, Si(OH)4)
Water samples were collected and filtered through a cellulose acetate filter (ClearLine, CA, 33 mm, 0.45 µm) in 50-mL falcon tubes and immediately frozen (−20°C), with the exception of Si(OH)4 which was stored at 4°C. Analyses were conducted using a Seal Analytical AA-3 system (Aminot and Kérouel, 2007). The limits of quantifications were 0.02 μmol L−1 for PO43− and 0.05 μmol L−1 for NO3−, NO2−, Si(OH)4. The OPUS UV is a spectral sensor equipped with a xenon flash lamp as light source and a high-end miniature spectrometer (MMS, Zeiss, Germany) with 256 channels covering the spectral range from 200 to 360 nm as detector. This sensor measures NO3− at high frequency with low energy consumption. A 20-mm optical path allowed measurements from 1 to 357 μmol L−1 with a precision of 0.18 μmol L−1.
2.3.5 Extracted chlorophyll-a measurements
Water samples (100–250 mL, depending on the turbidity) were filtered through a glass-fibre filter (Whatman, GF/F, 47 mm) and immediately frozen (−20°C) until analysis. Ten ml of 90% acetone (v/v) were added to extract the pigment and the samples were then left in the dark at 4°C for 12 h. After being centrifuged twice for 5 min at 1,700 g, the chl a concentration of the extracts [chl a]ext was measured using a Trilogy fluorimeter (Turner Designs, Sunnyvale, United States) according to the method of Strickland and Parsons (1972). As mentioned before, the relationship between the concentration of chl a and Fo was established, thereby allowing the Fo value to be converted into chl a concentration [chl a]F. Phytoplankton indicator based on chl a concentration used to classified eutrophic condition in estuaries was calculated depending on the Kp according to Garmendia et al. (2012) and Lemley et al. (2015).
2.4 Statistical and data analysis
Analyses were conducted using R software (R-project, CRAN) version 3.6.1. Partial triadic analysis (PTA) was performed using the PTA function in the “ade4” package to study a set of sub-matrices depicting the parameters measured. The PTA allows to handle three-way matrix as a sequence of two-way table (sub matrix) forming a data cube such as parameters x station x times where each sub-matrix is a parameter. A compromise will be established by rewriting the initial matrices row by row in a single column displaying the common structure of all parameters sub-matrices. The inter-structure is a rearrangement of the factorial coordinates of the Partial Component Analysis (PCA) obtained with the compromise, it will display the common structure of sub-matrix and station and temporal pattern (Gourdol et al., 2013). The inter-structure displaying the variation of parameter in space and over time is shown under the form of a PCA, the compromise resuming the information of parameter is used to cluster measurement stations. Clustering was performed using the “FactoMineR” (Lê et al., 2008) package. The number of clusters for the k-means cluster analysis was chosen using silhouette analysis. The optimal number of clusters displaying poor complexity is two, but three clusters are shown to provide more information.
3 Results
3.1 Environmental parameters
High frequency measurements of river flow and oxygen taken by the monitoring network throughout the estuary allow us to replace our discrete sampling into a more complete temporal dynamic of the estuary (Figure 3). The river flow has a typical seasonal pattern with higher flow in winter and lower flow in spring/summer. A minimum of 114 m3 s−1 was measured in September 2019, and a maximum of 1,940 m3 s−1 in February 2021 (Figure 3A). The same general trend was found for dissolved oxygen, but at a smaller scale, some discrepancy was found among the monitoring stations. The lowest value of dissolved oxygen recorded was 0.7 mg L−1 (10/07/2019) at Fatouville (lower estuarine, Kp: 344) a downstream station where the maximum turbidity zone (MTZ) was found (Figure 3B).
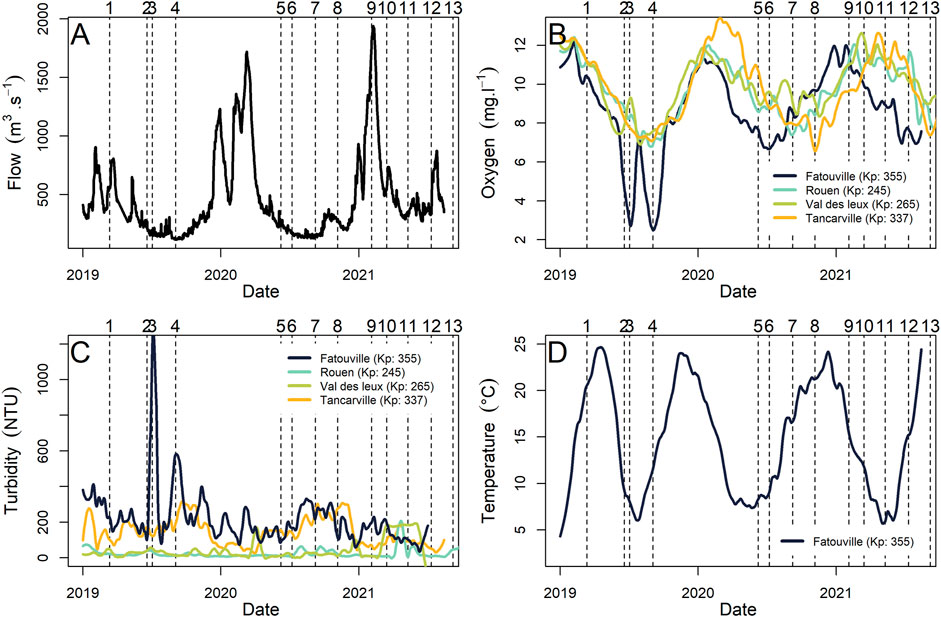
FIGURE 3. Seine estuary high frequency temporal data: River flow (m3.s−1) (A), Dissolved oxygen (mg.L−1) (B), Turbidity (NTU) (C), and temperature (°C) (D), dotted vertical lines display the date of each campaign. Kp (kilometre point) (https://www.seine-aval.fr/synapses/).
The temperatures measured during the sampling campaigns followed seasonal pattern and ranged from 7.7°C on the 4th of February, 2021, to 24.0°C on the 4th of July, 2019) with almost no spatial variation along each transect (Supplementary Figure S3). Turbidity showed high spatial variability, ranging from 2.3 to 200 NTU with high values generally concentred in the lower estuarine area of the estuary (from Kp 355 to 326) except in the February 2021 transect, when a mean of 60.4 ± 10.7 NTU was measured (Figure 4A). Chl a concentrations also showed seasonal variations with a maximum value of 89.2 µg chl a L−1 in July 2020 in Duclair (upper estuary, Kp: 278). Other significantly high values were observed along the gradient, with, for example, >60 µg chl a in the middle estuary (Kp 326–297) in July 2019 and 46 µg chl a L−1 in the lower area (Kp 346) in June 2020 (Figure 4B).
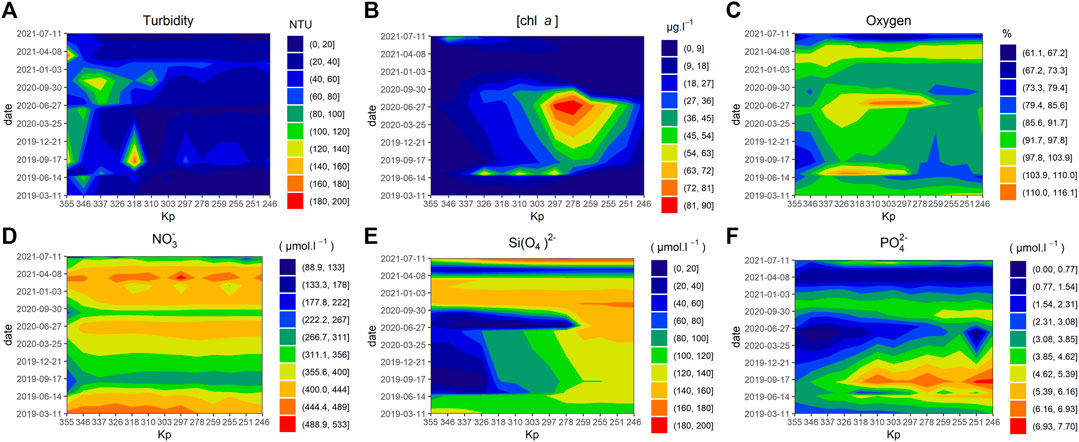
FIGURE 4. Spatiotemporal environmental parameter patterns measured in the Seine estuary between March 2019 and July 2021: Turbidity (NTU) (A), chl a concentration (µg.L−1) (B), oxygen saturation (%) (C), Nitrate (µmol.L−1) (D), Silicate (µmol.L−1) (E), Phosphate (µmol.L−1) (F), Kp (kilometre point).
3.2 Nutrients and stoichiometry variability
All inorganic nutrients measured along the transect (Figure 4) reflected seasonal variations due to variations in flow and repletion from the watershed in autumn and winter. Nitrate values never fell below 88.9 μmol L−1 and reached a maximum value of 516 μmol L−1 (Figure 4D) with an overall mean value of 380.5 ± 67 μmol L−1. Silica content reached 200 μmol L−1 with a mean of 111 ± 49 μmol L−1 but three events with very low values were recorded: in September 2019, values under 9 μmol L−1 in the middle and upper area (Kp > 326) (i), in July 2020 in the lower and middle estuary (Kp 278–355) with a minimum of 0.2 μmol L−1 (ii), and along the entire transect in May 2021, with a mean of 43.6 ± 10.9 μmol L−1 (Max: 56 μmol L−1; Min: 27 μmol L−1) (iii) (Figure 4E). Phosphate values ranged from 0.02 to 7.70 μmol L−1 and only reached critical levels in the upper and lower part of the estuary in September 2020 after the Kp 320 with < 0.5 μmol L−1 at Kp 251 and 330 (Figure 4F). In spring 2021, P concentrations are low from upstream to downstream in contrast to 2019 and 2020. To summarise, only silicate and phosphate displayed depletion values while nitrate did not come close to depletion. Also, for phosphate the annual average concentrations were significantly higher (ANOVA, Tukey test p < 0.05) in the estuary in 2019 and 2020 in comparison with 2021 with respectively 4.37 μmol L−1 ± 1.4, 3.04 μmol L−1 ± 1.4, 2.38 μmol L−1 ± 1.14. The annual average concentration for Silicate was significantly higher (ANOVA, Tukey test p < 0.05) in the estuary in 2021 in comparison with 2020 and 2019 with respectively 129.34 μmol L−1 ± 46.53, 102.37 μmol L−1 ± 57.09, 97.81 μmol L−1 ± 36.48. The mean Si/P and Si/N ratios for all our data were respectively 40.8 ± 26.3 (Max: 164; Min: 0.09) and 0.31 ± 0.18 (Max: 1.41; Min: 5.10−4), respectively, while the mean N/P ratio is 162 ± 121 (Max: 626; Min: 39.8), whereas the Redfield balanced ratio is 16. The annual values of the Si/P ratios (24,29 ± 11.78 in 2019, 32,33 ± 19.44 in 2020, 60.41 ± 26.97 in 2021) show that the year 2021 has significantly higher ratios (ANOVA, Tukey test p < 0.05) than the years 2019 and 2020.
3.3 Phytoplankton community structure
Phytoplankton diversity was assessed using two types of indicators: cytometric population and multispectral groups. For cytometric groups: Cryptophytes content reached high values (>1.0 × 10³ cells.cm-3) in May 2021 at multiple sampling points, but with a drop in concentration near the bay compared with a maximum value of 641 cells.cm-3 in the upper area (Kp 251) on the 8th of July 2020 (Figure 5A). The concentration of picoeukaryotes reached 6.1 × 10⁴ in July 2021 (Kp 251) and 1.6 × 10⁴ in July 2020 (Kp: 246), there was a general trend with higher values between Kp 265 and 246 (Figure 5B). High concentrations of nanoeukaryotes were spatially rarer with the highest values measured in the upper (Kp 265) and middle (Kp 318) estuary with, respectively, 4.9 × 10³ and 4.4 × 10³, in September 2020 and July 2021 (Figure 5C). Maximum microphytoplankton values were measured in the middle and upper area (Kp 297 and 259), with respective values of 7.0 × 10² and 6.9 × 10² in July 2020 and May 2021 (Figure 5D). This match to the highest value of chl a measured along our transect. A population belonging to the Cyclotella genus was identified in the picture taken by the flow cytometer in July 2020. Picocyanobacteria were present at very low concentrations (e.g., less than 400 cells.cm-3) except for the June 2021 and July 2021 transects, when values reached respectively, 3,000 and 4,921 cells.cm-3 in the upper part of the estuary (data not shown).
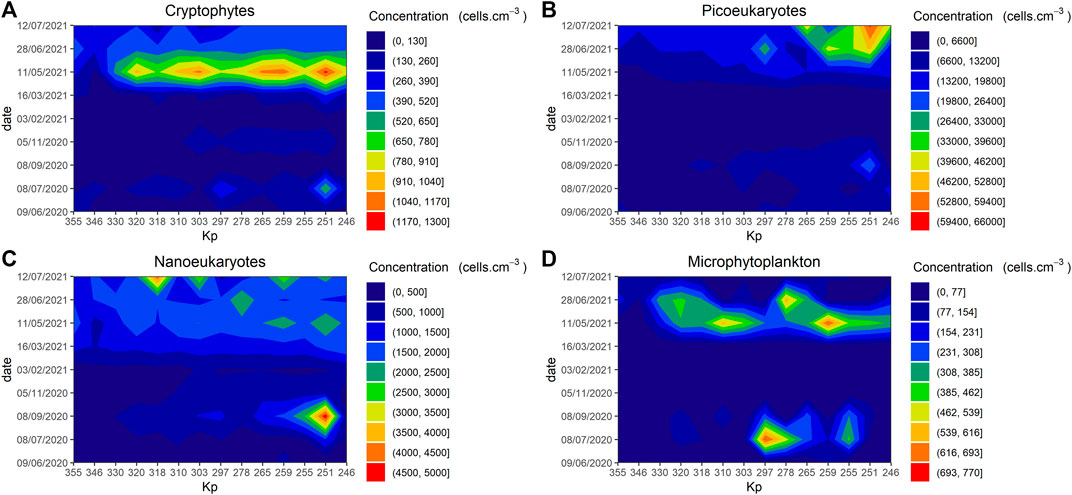
FIGURE 5. Spatiotemporal structure patterns of phytoplankton communities measured by flow cytometry in the Seine estuary between June 2020 and July 2021: Cryptophytes concentration (cells.cm−3) (A), Picoeukaryotes concentration (cells.cm−3) (B), Nanoeukaryotes concentration (cells.cm−3) (C), Microphytoplankton concentration (cells.cm−3) (D). Kp (kilometre point).
In multispectral groups, the phytoplankton community was dominated by two major pigment groups: chromophytes and phycocyanin. Chromophytes dominated the community during the productive period (spring and summer) especially during July 2020 with value between 80% and 90% which also match the highest value of chl a measured during the bloom (Figure 6B), while the phycocyanin group dominated during the unproductive period (winter and autumn) (Figure 6C) and both displayed a clear spatial pattern. Lastly, dominance by the chlorophyte and phycoerythrin groups displayed both temporal and spatial patchiness (Figures 6A,D). The upper area (Kp 259–246) presented a particular shifting dominance pattern. In this zone, each of the four pigments groups achieved dominance for a short period: June 2021 for chlorophytes, July 2019 chromophytes, November 2020 for the phycocyanin group, and June 2019 for the phycoerythrin group, whereas other areas displayed less diversity and were mainly dominated by phycocyanin and chromophytes.
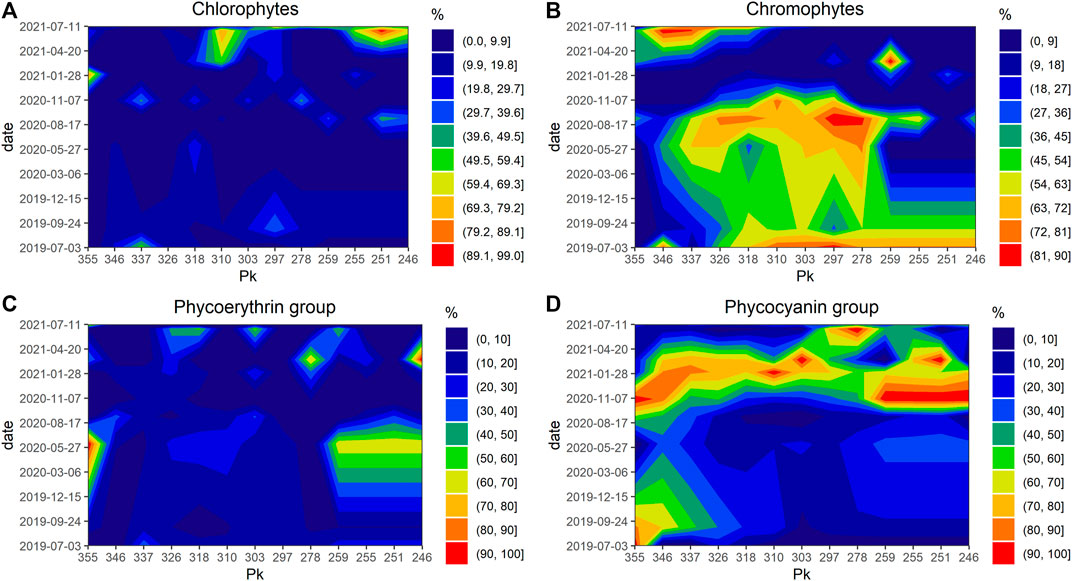
FIGURE 6. Spatiotemporal structure patterns of phytoplankton communities measured by multispectral fluorometer in the Seine estuary between July 2019 and July 2021: Chlorophytes (%) (A), Chromophytes concentration (%) (B), Phycoerythrin group (%) (C), Phycocyanin group (D).
3.4 Photosynthetic parameters and primary production pattern
The maximum quantum yield of PSII (Fv/Fm) ranged from 0.05 to 0.6, values under 0.2 indicated the presence of dead cells or cells whose physiological status was poor. Variations of this parameter followed a seasonal pattern with maximum values recorded in July and minimum values in winter (Figure 7A). Variation in the αII parameter showed the same annual variation as the Fv/Fm, but with more spatial variation (Figure 7B).
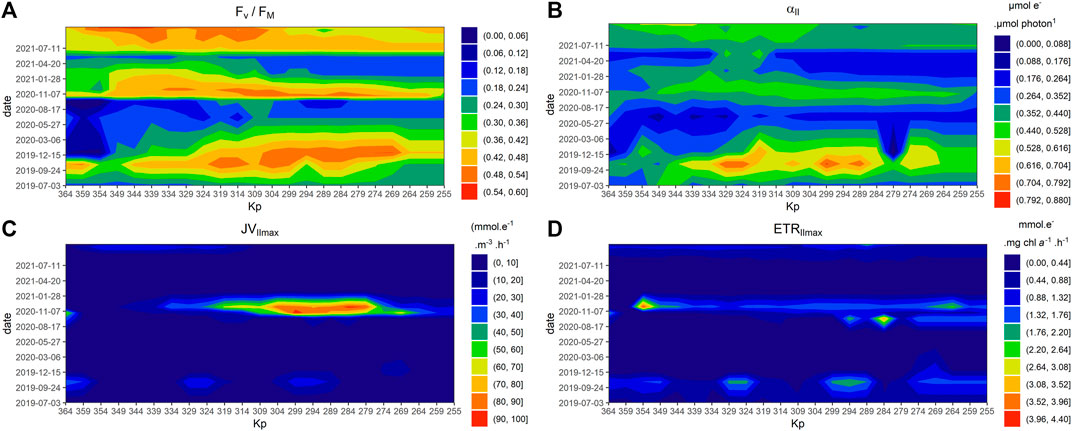
FIGURE 7. Spatiotemporal patterns of photosynthetic parameters measured in the Seine estuary between July 2019 and July 2021: Fv/Fm (A), α (µmol e−. µmol photon−1) (B), JVPIImax (mmol e−.m-3.h−1) (C), ETRIImax (mmol e−.mg chla−1.h−1) (D), JVIImax and ETRIImax, values have been logged for visual display, unlogged value are display by the scale. Kp (kilometre point).
The primary production indicator (JVIImax) was highest values in summer were respectively, 36.96 mmol e−.m-3.h−1 in July 2020, 95.43 in July 2020 and 30.34 in June 2021. In July 2021 the highest value reached only 15.67 mmol e−.m-3.h−1. The highest values were mainly observed between the lower estuary (around Kp 304) and of Duclair (upper estuary, Kp 269) (Figure 7C). As biomass is a component of production (JVIImax) the high production values are consequently associated with similarly high biomass values. This type of pattern was also found in other areas, such as the lower estuary, with a mean of 8.25 mmol e−.m-3.h−1 in June 2021. However, with the exception of the area between Kp 304 and Kp 279 between the 9th of June, 2020 and the 9th of September, 2020, when both productivity (ETRIImax) and production were high, with a mean value of 1.7 mmol e−.mg chla−1.h−1 in the middle estuary (Kp 309–274) (Figure 7D), we observed decoupling between production and productivity. Indeed, on the whole data set, the JVIImax is significantly related to ETRIImax but poorly correlated to (R2 = 0.25).
PTA analysis highlighted a particular pattern in which all the photosynthetic parameters (alpha, Ek, JVPIImax, ETRIImax) and the biomass indicator (chl a) were highly correlated and formed a group that displayed a low correlation with most of the other variables with the exception of the nutrient ratio (N/P, N/Si) (Figure 8A). The clustering of the compromise displays a spatial gradient in which the three groups represent the upstream, center and low stream zone of the estuary. One of the clusters (in blue) matches the high productivity area. One of the clusters (in blue) corresponds to the upper productivity zone between Heurteauville/Duclair and La Bouille, confirming the particular functioning of this zone, which marks an interruption in the upstream/downstream gradient represented by the pink cluster (Figure 8B).
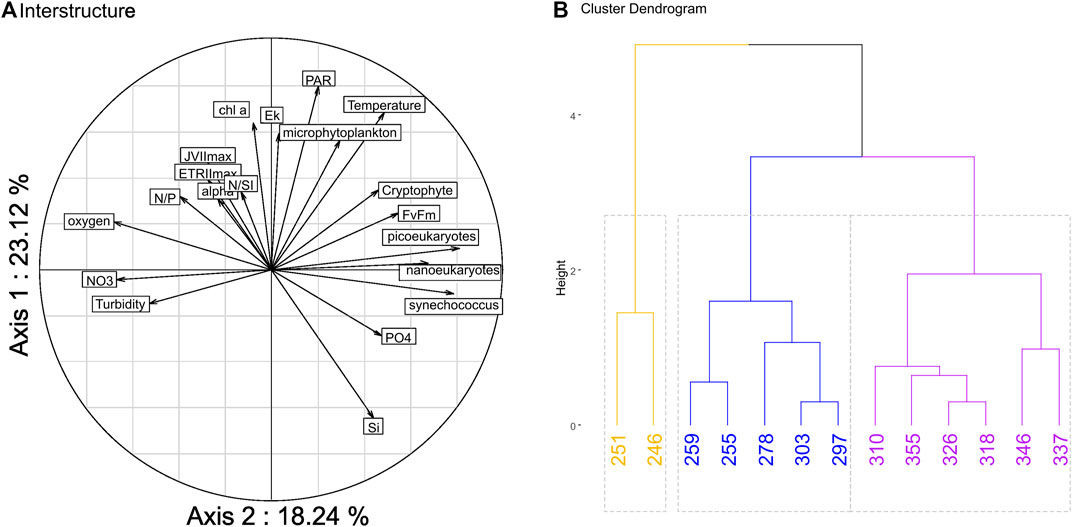
FIGURE 8. Multivariate analysis: Inter-structure of the Partial Triadic Analysis (PTA) with a total of 41.4% of variance expressed with the two axes (A), cluster plot based on the compromise of the PTA, the optimal number of cluster was 2 we choose to display 3 to show more complexity (B).
Finally, using light and turbidity and the photosynthetic parameter estimated with variable fluorimetry, we integrated daily mean production in the water column at a yearly scale to estimate the annual primary production.
The annual primary production values increase slightly in the lower estuary between Honfleur and Trouville-la-Haule (Kp 355 and 326.6) and then rise sharply to a maximum over 50 g C.m−2.y−1 in the middle estuary (Kp 289–297.7) (Figure 9). There is then a zone from Duclair (Kp: 278) to downstream of La Bouille (Kp: 260) where a 56% drop in production is observed. The values then rise as far as Rouen. This annual production drop at Kp 269, downstream of Rouen, between La Bouille and Duclair, is linked to both a decrease in biomass and productivity. The mean PPP in the estuary was 33 g C.m-2.y−1. While the yearly global integrated primary production for the whole estuary transect (Kp 355–246) has been estimated at 1.32 Mg C.y−1.
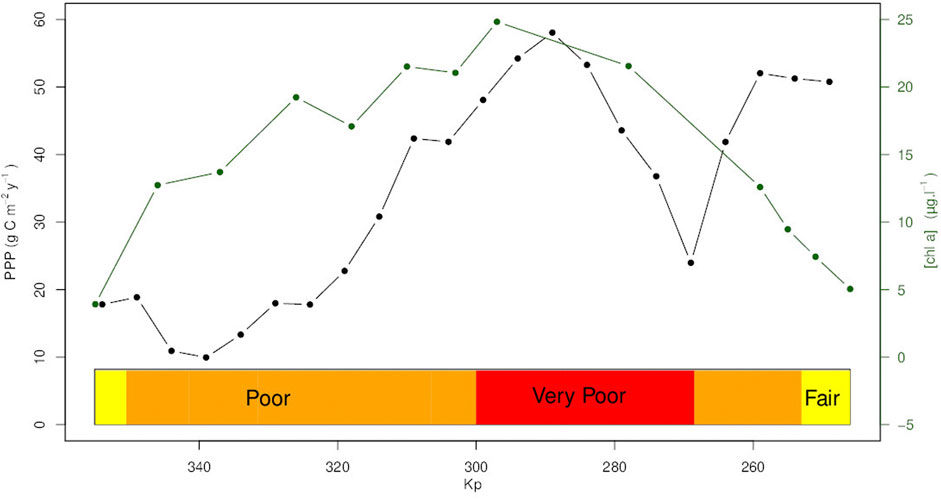
FIGURE 9. Annual Phytoplankton Primary Production (PPP) (g C m−2 y−1). estimated along the Seine estuary Kp (kilometre point) (black dot line). Mean value of chl a concentration (µg.L−1) by Kp (green line/dot). The colored boxes at the bottom displayed the WFD phytoplankton biomass classification (yellow = fair, orange = poor, red = very poor).
4 Discussion
4.1 Eutrophication effect?
Despite environmental policies and the resulting reduction in nutrients in the Seine Estuary, several values higher than 60 µg chl a.l−1 were identified in this study in the summer in 2019 and in 2020 with a maximum value of 89.2 µg chl a.l−1 in July 2020. Such a high values, due to massive blooms, have been unusual since the change in nutrient regime due to the reduction in phosphate inputs in this part of the estuary since 2000, the last report of such a value dates back to June 2001 (Némery and Garnier, 2007; Passy et al., 2016). Reducing P to limit eutrophication has been a general decision in Europe (Artioli et al., 2008; Burson et al., 2016) but Ménesguen et al. (2018) already pointed out that reducing P was not enough to limit phytoplankton production. Based on the nutrient levels measured in the present study, a limitation pattern was identified, and, not surprisingly, excess nitrate was measured all along the transect, resulting in high dystrophic N/P and N/Si ratios. The question thus arises: does phosphate play a role as a limiting nutrient? With a few exceptions, for example, in the June 2021 transect, where in the lower part (Kp > 318) values dropped below 0.5 μmol L−1, there was no sign of complete depletion of phosphate. No clear relationships between low P concentrations due to high concentrations of phytoplankton was observed over the course of the present study. The decrease in P in the lower estuary mainly appeared to be correlated with dilution in the bay. In opposite, Silicate was the only nutrient displaying depletion (e.g., value close to detection limit) in the upper estuary especially during the July 2020 cruise at Kp 278. This low value (0.24 μmol L−1) matched the maximum biomass reached during a massive phytoplankton bloom which indicate a consumption. A drop in silica correlated with a massive diatom bloom has already been reported in the Seine estuary but that was before the change in the phosphorus policy (Garnier et al., 1995).
Diatoms in freshwater and marine systems have different stoichiometric ratios (Conley et al., 1989), for marine species, the Si/N is 2.08 ± 0.64 and Si/P is 13.78 ± 4.24 (Brzezinski, 1985) confirmed by (Sarthou et al., 2005). The stoichiometric ratio of diatoms in freshwater is Si/N is 12.64 ± 6.68 and Si/P is 83.74 ± 45.58 (Sicko-Goad et al., 1984). This difference in ratio exacerbates the need for silica in freshwater systems, whereas the level in the Seine estuary is only linked to natural rock weathering processes and thus river flow with no long-term variations yet (Romero et al., 2016). As shown by our data, N is clearly in excess (Si/N mean = 0.3; N/P median = 112) while, considering the Si/P ratio (Si/P mean = 40.81) it is more complex to conclude on either Si or P limitation. We observed a clear Si limitation during the diatom bloom, but a small stock of P was always measured. However, annual Si/P ratio values were higher in 2021 than in 2019 and 2020. Thus, the year 2021, which did not show a bloom, appears more limited in P than in Si. Nevertheless, it is difficult to link annual trends to blooming events of a few days, but this issue deserves to be explored. The interannual variability of P inputs could thus be a determining factor in the chlorophyll concentrations observed in the Seine estuary. The historical data set showed a significant relationship between a decrease in phosphate and a decrease in chl a in the estuary, in contrast to the lack of a clear P limitation in our data. Beside the stock of P remaining in the productive period, the unbalanced stoichiometry between P and N (with N/P > 300), limits phytoplankton growth. We hypothesise that nitrophilic communities may be associated with low affinity for P and thus less effective with decreasing P concentration; the N/P balance appeared to be more important than the absolute concentration of P (Aubriot and Bonilla, 2018). As already reported in the literature, ratios between nutrients may be more informative than concentrations on limitations (Guildford and Hecky, 2000; Burson et al., 2018).
This study shows that, despite the reduction in P inputs, further efforts are needed to reduce nitrogen, phosphorus or both (Even et al., 2007), in order to limit extreme events such as massive blooms that persist in the upper estuary.
4.2 Phytoplankton community structure and shift
Concerning the phytoplankton community in estuaries in general, diatoms compromise the major number of species in the temperate zones and contribute the most to the biomass (Rojo et al., 1994), dominance can vary from nanophytoplankton dominance or Cryptophytes (Sin et al., 2013) to Cyanobacteria (Paerl et al., 2020). The Seine estuary contains various community groups with dominance of groups of different size and with different pigments. The diatoms bloom in the Seine estuary are typical (Garnier et al., 1995), in spring, the pattern perfectly matched the microphytoplankton bloom of July, 2020. Two months later, on September, 2020, dominance appeared to switch from microphytoplankton to nanoeukaryotes and picoeukaryotes, while no Picocyanobacteria appeared to account for a significant part of the phytoplankton population. The dominance of Thalassiosirophycidae in diatom blooms has already been described in estuaries (Sin et al., 2012), and thanks to high photoacclimation flexibility, diatoms can display optimal photosynthetic capacity in turbulent water with highly variable light (Lavaud et al., 2007) and independently of their size, can attain high carbon fixation rates (López-Sandoval et al., 2014). These elements could explain their priority in the community succession and their ability to produce high biomass. The change in the community itself is probably linked to the nutrient pattern. After the depletion of silica, which may have triggered the phytoplankton succession, there was a shift in community composition to smaller cells (picoeukaryotes and nanoeukaryotes) corresponding to chlorophytes (Garnier et al., 1995). These shifts linked with silica depletion have already been described in coastal system (McNair et al., 2018) and in estuary (Rocha et al., 2002) Despite smaller cells, this population is able to reach a level of production as high as that recorded during the diatom bloom in the same particular zone, even though chlorophytes do not have a higher photosynthetic capacity than diatoms (Dijkman and Kromkamp, 2006).
4.3 Drivers of primary production
The spatial pattern of primary production is quite complex. First, from the downstream at Honfleur to upstream at Kp 289 near Heurteauville (Kp: 297.7) the biomass and the primary production increase showing due to the dilution effect of the estuary. There is then a zone from Duclair (Kp: 278) to downstream of La Bouille (Kp: 260) where a drop of the production and of the biomass is observed associated to low productivity. After La Bouille the production and the productivity increase while the biomass remains low. The drop observed at the upstream of the estuary around La Bouille is quite surprising as no measured variable seems to explain why no bloom occurred in this part, and no environmental parameter that could influence production seems to explain this: temperature, light and turbidity are stable along the transect while nutrient levels could allow bloom trigger upward (Kp 274—Kp 255). Different phytoplankton communities (e.g., diatoms and chlorophytes) can support the same high photosynthetic parameters. Many hypotheses can explain the spatial lag in phytoplankton development as top-down control (Lionard et al., 2005) or the presence of contaminants near the metropolis of Rouen (Kp: 255) (Blanchard et al., 1999) that would limit phytoplankton development before reaching a certain point. A sturdier hypothesis could be the effect of the tide on water residence time. At the location of the bloom there is a slowdown of the rising tide in spring that could increase the water residence time (Guézennec et al., 1999). As described in literature, water residence time is a major driver of production and can trigger blooms (Bledsoe et al., 2004; Kristiana et al., 2012; Stumpner et al., 2020) in estuaries. The increase of water residence time could favour a better acclimation of the phytoplankton leading to higher photosynthetic capacities. Here, the production period is linked with the dry period with low flow, longer residence time, and higher light intensity on a temporal scale, the hypothesis of residence time driving primary production is largely described in literature (Eyre, 1998; Raimonet et al., 2018; Stumpner et al., 2020). This hypothesis is supported by our results as the decrease in oxygen and the triggering of massive blooms coupled with a decrease in silica (Raimonet et al., 2018) during the dry period. However, the bloom could explain the change in the nutrient ratio (Gardner-Dale et al., 2017) as could the location of the maximum concentration of chl a (Lionard et al., 2008) even in high turbidity. In terms of productivity, the estuary can be divided into a highly productive part up to Kp 318 and a less productivity area after this station. Nevertheless, low productivity due to high turbidity leading to light limitation can be offset by the increasing surface area after Kp 320 as the estuary expands. Moreover, even in the most productive station, the mean depth of the euphotic zone is 1.5 m, revealing the role of turbidity in reducing the eutrophication effect. This combination of parameters explains why this part of the estuary with a mean value of production of 33 g C.m−2.y−1 is classified as oligotrophic according to Nixon (1995) classification despite the high nutrient levels (Cloern et al., 2014) while phytoplankton indicator based on chl a concentration used to classified eutrophic condition in estuaries (Garmendia et al., 2012); Lemley et al. (2015) showed a “Poor” status on all the estuary and a “Very Poor” status in the most productive area. The yearly primary production value depending on Kp (10—50 g C.m−2.y−1, with a mean of 33 g C.m−2.y−1) fall within the range of values measured in the same estuary, but in a more downstream area (64.75 g C.m−2.y−1) (Morelle et al., 2018) and from the Ria de Aveiro estuary (49.9 g C.m−2.y−1) (Frankenbach et al., 2020), while the values are lower than those in most recorded eutrophic estuary systems: Scheldt estuary (153 g C.m−2.y−1), Port hacking estuary (237 g C.m−2.y−1), Lynher estuary (82 g C.m−2.y−1), Peconic Bay Estuary (177 g C.m−2.y−1) (Cloern et al., 2014), Tagus estuary (77 g C.m−2.y−1) (Gameiro et al., 2011). The fixed value of electron requirement for carbon fixation (Фe,c) used to transform electron flux to carbon could induce a bias this as nutrient value or phytoplankton composition could affect this parameter (Napoléon and Claquin, 2012; Lawrenz et al., 2013; Hughes et al., 2018b; Hughes et al., 2020; Ko et al., 2019) but the Фe,c used is a mean annual value estimated recently on the same area (Morelle et al., 2018) which limit the bias. The uncoupling between primary production and biomass eutrophication assessment showed the limit of simple indicators which do not consider the ecosystems functioning.
5 Conclusion
While the Seine estuary cannot be classified as an eutrophic system according to the Nixon classification (Nixon, 1995), this work highlights the persistence of extreme events in a few specific areas despite a reduction in the phosphate concentration in the Seine Estuary. Beside light limitation, nutrients allows massive blooms of most likely diverse communities, as diatoms or nanophytoplankton can dominate the blooms. The unbalanced of stoichiometry induced by the reduction of only one nutrient (P) may have reduced the biomass by changing the community composition and lead to interannual variability. The reason for the spatial discrepancy of the bloom appear to be complex as no single nutrient or light availability (turbidity) pattern could explain the spatial variation. The effect of the tide lowering the water residence time in this area appeared to favour blooms. The reduction of the waterflow in the Seine predicted by local model in the context of climate change could therefore lead an increase of bloom occurrences in the future.
Data availability statement
The raw data supporting the conclusion of this article will be made available by the authors, without undue reservation.
Author contributions
LS-F: Methodology, resources, investigation, formal analysis, writing—original draft preparation, visualization LC: Resources, investigation OJ: Resources, PC: Conceptualization, investigation, resources, project administration, funding acquisition, writing-original draft preparation PC contributed to conception and design of the study and to funding aquisition. LS-F and PC contributed to methodology, resources, field investigation and writing-original draft preparation. LS-F organized the database. LC and OJ contributed to field investigation and lab analyses. All authors contributed to the article and approved the submitted version.
Funding
This project was funded by the GIP Seine-Aval (SARTRE Programme). The project was also supported by La Région Normandie and l’Agence de l’Eau Seine Normandie which funded the phD grant of LS-F. Field campaigns were supported by l’Agence de l’Eau Seine Normandie and performed by Normandie Navigation in 2019 and 2020 and by STO logistique and CSLN in 2021. Cytosense and Labstaf were co-funded by the European Union and La Région Normandie (FEDER/FSE 2014–2020 Manche 2021 project).
Acknowledgments
The authors thank Cédric Fisson (GIP Seine-Aval), Jean Philippe-Lemoine (GIP Seine Aval), Robert Lafite (Rouen university) and Olivier Cantat (University of Caen Normandie) for providing data, and Guillaume Izabel (University of Caen Normandie) for providing the map. The authors thank Micky Tackx (CNRS, Toulouse) for the coordination of the SARTRE programme.
Conflict of interest
The authors declare that the research was conducted in the absence of any commercial or financial relationships that could be construed as a potential conflict of interest.
Publisher’s note
All claims expressed in this article are solely those of the authors and do not necessarily represent those of their affiliated organizations, or those of the publisher, the editors and the reviewers. Any product that may be evaluated in this article, or claim that may be made by its manufacturer, is not guaranteed or endorsed by the publisher.
Supplementary material
The Supplementary Material for this article can be found online at: https://www.frontiersin.org/articles/10.3389/fenvs.2023.1216732/full#supplementary-material
References
Aminot, A., and Kérouel, R. (2007). Dosage automatique des nutriments dans les eaux marines - Méthodes en flux continu.
Artioli, Y., Friedrich, J., Gilbert, A. J., McQuatters-Gollop, A., Mee, L. D., Vermaat, J. E., et al. (2008). Nutrient budgets for European seas: A measure of the effectiveness of nutrient reduction policies. Mar. Pollut. Bull. 56, 1609–1617. doi:10.1016/j.marpolbul.2008.05.027
Aubriot, L., and Bonilla, S. (2018). Regulation of phosphate uptake reveals cyanobacterial bloom resilience to shifting N:P ratios. Freshw. Biol. 63, 318–329. doi:10.1111/fwb.13066
Barbier, E. B., Hacker, S. D., Kennedy, C., Koch, E. W., Stier, A. C., and Silliman, B. R. (2011). The value of estuarine and coastal ecosystem services. Ecol. Monogr. 81, 169–193. doi:10.1890/10-1510.1
Basset, A., Elliott, M., West, R. J., and Wilson, J. G. (2013). Estuarine and lagoon biodiversity and their natural goods and services. Estuar. Coast. Shelf Sci., Estuar. lagoon Biodivers. their Nat. goods Serv. 132, 1–4. doi:10.1016/j.ecss.2013.05.018
Billen, G., Garnier, J., Némery, J., Sebilo, M., Sferratore, A., Barles, S., et al. (2007). A long-term view of nutrient transfers through the Seine river continuum. Sci. Total Environ., Hum. activity material fluxes a regional river basin Seine River watershed 375, 80–97. doi:10.1016/j.scitotenv.2006.12.005
Blanchard, M., Teil, M. J., Carru, A. M., Garban, B., Ollivon, D., Chesterikoff, A., et al. (1999). Biota contamination by PCBs and trace metals in the freshwater estuary of the River Seine (France). Hydrobiologia 400, 149–154. doi:10.1023/A:1003715131607
Bledsoe, E. L., Phlips, E. J., Jett, C. E., and Donnelly, K. A. (2004). The relationships among phytoplankton biomass, nutrient loading and hydrodynamics in an inner-shelf estuary. Ophelia 58, 29–47. doi:10.1080/00785236.2004.10410211
Boatman, T. G., Geider, R. J., and Oxborough, K. (2019). Improving the accuracy of single turnover active fluorometry (STAF) for the estimation of phytoplankton primary productivity (PhytoPP). Front. Mar. Sci. 6. doi:10.3389/fmars.2019.00319
Brzezinski, M. A. (1985). THE Si:C:N RATIO OF MARINE DIATOMS: Interspecific variability and the effect of some environmental VARIABLES1. J. Phycol. 21, 347–357. doi:10.1111/j.0022-3646.1985.00347.x
Burson, A., Stomp, M., Akil, L., Brussaard, C. P. D., and Huisman, J. (2016). Unbalanced reduction of nutrient loads has created an offshore gradient from phosphorus to nitrogen limitation in the North Sea. Limnol. Oceanogr. 61, 869–888. doi:10.1002/lno.10257
Burson, A., Stomp, M., Greenwell, E., Grosse, J., and Huisman, J. (2018). Competition for nutrients and light: Testing advances in resource competition with a natural phytoplankton community. Ecology 99, 1108–1118. doi:10.1002/ecy.2187
Chen, C. T. A., and Borges, A. V. (2009). Reconciling opposing views on carbon cycling in the coastal ocean: Continental shelves as sinks and near-shore ecosystems as sources of atmospheric CO2. Deep Sea Res. Part II Top. Stud. Oceanogr., Surf. Ocean CO2 Var. Vulnerabilities 56, 578–590. doi:10.1016/j.dsr2.2009.01.001
Chu, T. V., Torréton, J. P., Mari, X., Nguyen, H. M. T., Pham, K. T., Pham, T. T., et al. (2014). Nutrient ratios and the complex structure of phytoplankton communities in a highly turbid estuary of Southeast Asia. Environ. Monit. Assess. 186, 8555–8572. doi:10.1007/s10661-014-4024-y
Cloern, J. E., Foster, S. Q., and Kleckner, A. E. (2014). Phytoplankton primary production in the world’s estuarine-coastal ecosystems. Biogeosciences 11, 2477–2501. doi:10.5194/bg-11-2477-2014
Conley, D. J., Kilham, S. S., and Theriot, E. (1989). Differences in silica content between marine and freshwater diatoms. Limnol. Oceanogr. 34, 205–212. doi:10.4319/lo.1989.34.1.0205
Daniell, K. A., Plant, R., Pilbeam, V., Sabinot, C., Paget, N., Astles, K., et al. (2020). Evolutions in estuary governance? Reflections and lessons from Australia, France and New Caledonia. Mar. Policy 112, 103704. doi:10.1016/j.marpol.2019.103704
Dauvin, J. C., Ruellet, T., Desroy, N., and Janson, A. L. (2007). The ecological quality status of the Bay of Seine and the Seine estuary: Use of biotic indices. Mar. Pollut. Bull., Implement. Water Framew. Dir. Eur. Mar. waters 55, 241–257. doi:10.1016/j.marpolbul.2006.04.010
Dijkman, N. A., and Kromkamp, J. C. (2006). Photosynthetic characteristics of the phytoplankton in the Scheldt estuary: Community and single-cell fluorescence measurements. Eur. J. Phycol. 41, 425–434. doi:10.1080/09670260600937791
Even, S., Thouvenin, B., Bacq, N., Billen, G., Garnier, J., Guezennec, L., et al. (2007). An integrated modelling approach to forecast the impact of human pressure in the Seine estuary. Hydrobiologia 588, 13–29. doi:10.1007/s10750-007-0649-y
Eyre, B. (1998). Transport, retention and transformation of material in Australian estuaries. Estuaries 21, 540–551. doi:10.2307/1353293
Frankenbach, S., Ezequiel, J., Plecha, S., Goessling, J. W., Vaz, L., Kühl, M., et al. (2020). Synoptic spatio-temporal variability of the photosynthetic productivity of microphytobenthos and phytoplankton in a tidal estuary. Front. Mar. Sci. 7. doi:10.3389/fmars.2020.00170
Gameiro, C., Zwolinski, J., and Brotas, V. (2011). Light control on phytoplankton production in a shallow and turbid estuarine system. Hydrobiologia 669, 249–263. doi:10.1007/s10750-011-0695-3
Gardner-Dale, D. A., Bradley, I. M., and Guest, J. S. (2017). Influence of solids residence time and carbon storage on nitrogen and phosphorus recovery by microalgae across diel cycles. Water Res. 121, 231–239. doi:10.1016/j.watres.2017.05.033
Garmendia, M., Bricker, S., Revilla, M., Borja, Á., Franco, J., Bald, J., et al. (2012). Eutrophication assessment in Basque estuaries: Comparing a north American and a European method. Estuaries Coasts 35, 991–1006. doi:10.1007/s12237-012-9489-8
Garnier, J., Billen, G., and Coste, M. (1995). Seasonal succession of diatoms and Chlorophyceae in the drainage network of the Seine River: Observation and modeling. Limnol. Oceanogr. 40, 750–765. doi:10.4319/lo.1995.40.4.0750
Garnier, J., Billen, G., Némery, J., and Sebilo, M. (2010). Transformations of nutrients (N, P, Si) in the turbidity maximum zone of the Seine estuary and export to the sea. Estuar. Coast. Shelf Sci. 90, 129–141. doi:10.1016/j.ecss.2010.07.012
Garnier, J., and Billen, G. (2007). Production vs. Respiration in river systems: An indicator of an ecological status. Sci. Total Environ. 375, 110–124. doi:10.1016/j.scitotenv.2006.12.006
Garnier, J., Servais, P., Billen, G., Akopian, M., and Brion, N. (2001). Lower Seine River and estuary (France) carbon and oxygen budgets during low flow. Estuaries 24, 964–976. doi:10.2307/1353010
Genty, B., Briantais, J. M., and Baker, N. R. (1989). The relationship between the quantum yield of photosynthetic electron transport and quenching of chlorophyll fluorescence. Biochim. Biophys. Acta BBA - Gen. Subj. 990, 87–92. doi:10.1016/S0304-4165(89)80016-9
Gourdol, L., Hissler, C., Hoffmann, L., and Pfister, L. (2013). On the potential for the Partial Triadic Analysis to grasp the spatio-temporal variability of groundwater hydrochemistry. Appl. Geochem. 39, 93–107. doi:10.1016/j.apgeochem.2013.10.002
Grasso, F., Verney, R., Hir, P. L., Thouvenin, B., Schulz, E., Kervella, Y., et al. (2018). Suspended sediment dynamics in the macrotidal seine estuary (France): 1. Numerical modeling of turbidity maximum dynamics. J. Geophys. Res. Oceans 123, 558–577. doi:10.1002/2017JC013185
Guézennec, L., Lafite, R., Dupont, J. P., Meyer, R., Boust, D., and Guezennec, L. (1999). Hydrodynamics of suspended particulate matter in the tidal freshwater zone of a macrotidal estuary (the Seine Estuary, France). Estuaries 22, 717–727. doi:10.2307/1353058
Guildford, S. J., and Hecky, R. E. (2000). Total nitrogen, total phosphorus, and nutrient limitation in lakes and oceans: Is there a common relationship? Limnol. Oceanogr. 45, 1213–1223. doi:10.4319/lo.2000.45.6.1213
Hughes, D. J., Campbell, D. A., Doblin, M. A., Kromkamp, J. C., Lawrenz, E., Moore, C. M., et al. (2018a). Roadmaps and detours: Active chlorophyll-a assessments of primary productivity across marine and freshwater systems. Environ. Sci. Technol. 52, 12039–12054. doi:10.1021/acs.est.8b03488
Hughes, D. J., Crosswell, J. R., Doblin, M. A., Oxborough, K., Ralph, P. J., Varkey, D., et al. (2020). Dynamic variability of the phytoplankton electron requirement for carbon fixation in eastern Australian waters. J. Mar. Syst. 202, 103252. doi:10.1016/j.jmarsys.2019.103252
Hughes, D. J., Varkey, D., Doblin, M. A., Ingleton, T., Mcinnes, A., Ralph, P. J., et al. (2018b). Impact of nitrogen availability upon the electron requirement for carbon fixation in Australian coastal phytoplankton communities. Limnol. Oceanogr. 63, 1891–1910. doi:10.1002/lno.10814
Ibáñez, C., and Peñuelas, J. (2019). Changing nutrients, changing rivers. Science 365, 637–638. doi:10.1126/science.aay2723
Kimmerer, W. J., and Thompson, J. K. (2014). Phytoplankton growth balanced by clam and zooplankton grazing and net transport into the low-salinity zone of the san francisco estuary. Estuaries Coasts 37, 1202–1218. doi:10.1007/s12237-013-9753-6
Ko, E., Park, J., Gorbunov, M. Y., and Yoo, S. (2019). Uncertainties in variable fluorescence and 14C methods to estimate primary production: A case study in the coastal waters off the Korean peninsula. Mar. Ecol. Prog. Ser. 627, 13–31. doi:10.3354/meps13083
Kocum, E., Underwood, G. J. C., and Nedwell, D. B. (2002). Simultaneous measurement of phytoplanktonic primary production, nutrient and light availability along a turbid, eutrophic UK East Coast estuary (the Colne Estuary). Mar. Ecol. Prog. Ser. 231, 1–12. doi:10.3354/meps231001
Kolber, Z. S., Prášil, O., and Falkowski, P. G. (1998). Measurements of variable chlorophyll fluorescence using fast repetition rate techniques: Defining methodology and experimental protocols. Biochim. Biophys. Acta BBA - Bioenerg. 1367, 88–106. doi:10.1016/S0005-2728(98)00135-2
Kristiana, R., Antenucci, J. P., and Imberger, J. (2012). Using a multi-component indicator toward reducing phytoplankton bloom occurrences in the swan river estuary. Environ. Manage. 50, 237–256. doi:10.1007/s00267-012-9870-1
Kromkamp, J. C., and Forster, R. M. (2003). The use of variable fluorescence measurements in aquatic ecosystems: Differences between multiple and single turnover measuring protocols and suggested terminology. Eur. J. Phycol. 38, 103–112. doi:10.1080/0967026031000094094
Kromkamp, J., Peene, J., van Rijswijk, P., Sandee, A., and Goosen, N. (1995). Nutrients, light and primary production by phytoplankton and microphytobenthos in the eutrophic, turbid Westerschelde estuary (The Netherlands). Hydrobiologia 311, 9–19. doi:10.1007/BF00008567
Larsson, M. E., Ajani, P. A., Rubio, A. M., Guise, K., McPherson, R. G., Brett, S. J., et al. (2017). Long-term perspective on the relationship between phytoplankton and nutrient concentrations in a southeastern Australian estuary. Mar. Pollut. Bull. 114, 227–238. doi:10.1016/j.marpolbul.2016.09.011
Lavaud, J., Strzepek, R. F., and Kroth, P. G. (2007). Photoprotection capacity differs among diatoms: Possible consequences on the spatial distribution of diatoms related to fluctuations in the underwater light climate. Limnol. Oceanogr. 52, 1188–1194. doi:10.4319/lo.2007.52.3.1188
Lawrenz, E., Silsbe, G., Capuzzo, E., Ylöstalo, P., Forster, R. M., Simis, S. G. H., et al. (2013). Predicting the electron requirement for carbon fixation in seas and oceans. PLOS ONE 8, 58137. doi:10.1371/journal.pone.0058137
Le Moal, M., Gascuel-Odoux, C., Ménesguen, A., Souchon, Y., Étrillard, C., Levain, A., et al. (2019). Eutrophication: A new wine in an old bottle? Sci. Total Environ. 651, 1–11. doi:10.1016/j.scitotenv.2018.09.139
Lê, S., Josse, J., and Husson, F. (2008). FactoMineR: An R package for multivariate analysis. J. Stat. Softw. 25, 1–18. doi:10.18637/jss.v025.i01
Lemley, D. A., Adams, J. B., Taljaard, S., and Strydom, N. A. (2015). Towards the classification of eutrophic condition in estuaries. Estuar. Coast. Shelf Sci. 164, 221–232. doi:10.1016/j.ecss.2015.07.033
Lionard, M., Azémar, F., Boulêtreau, S., Muylaert, K., Tackx, M., and Vyverman, W. (2005). Grazing by meso- and microzooplankton on phytoplankton in the upper reaches of the Schelde estuary (Belgium/The Netherlands). Estuar. Coast. Shelf Sci. 64, 764–774. doi:10.1016/j.ecss.2005.04.011
Lionard, M., Muylaert, K., Hanoutti, A., Maris, T., Tackx, M., and Vyverman, W. (2008). Inter-annual variability in phytoplankton summer blooms in the freshwater tidal reaches of the Schelde estuary (Belgium). Estuar. Coast. Shelf Sci. 79, 694–700. doi:10.1016/j.ecss.2008.06.013
Liu, B., de Swart, H. E., and de Jonge, V. N. (2018). Phytoplankton bloom dynamics in turbid, well-mixed estuaries: A model study. Estuar. Coast. Shelf Sci., ECSA 56 Coast. Syst. Transition - a “natural” “anthropogenically-modified” state 211, 137–151. doi:10.1016/j.ecss.2018.01.010
López-Sandoval, D. C., Rodríguez-Ramos, T., Cermeño, P., Sobrino, C., and Marañón, E. (2014). Photosynthesis and respiration in marine phytoplankton: Relationship with cell size, taxonomic affiliation, and growth phase. J. Exp. Mar. Biol. Ecol. 457, 151–159. doi:10.1016/j.jembe.2014.04.013
Maier, G., Glegg, G. A., Tappin, A. D., and Worsfold, P. J. (2012). A high resolution temporal study of phytoplankton bloom dynamics in the eutrophic Taw Estuary (SW England). Sci. Total Environ., Clim. Change Macronutr. Cycl. along Atmos. Terr. Freshw. Estuar. Continuum - A Special Issue Dedic. Professor Colin Neal 434, 228–239. doi:10.1016/j.scitotenv.2011.08.044
Marcel, B., Morel, A., and Gagnon, R. (1994). An incubator designed for extensive and sensitive measurements of phytoplankton photosynthetic parameters. Limnol. Oceanogr. 39, 694–702. doi:10.4319/lo.1994.39.3.0694
Martin, G. D., Vijay, J. G., Laluraj, C. M., Madhu, N. V., Joseph, T., Nair, M., et al. (2008). Fresh water influence on nutrient stoichiometry in a tropical estuary, Southwest coast of India. Appl. Ecol. Environ. Res. 6, 1. doi:10.15666/aeer/0601_057064
McNair, H. M., Brzezinski, M. A., and Krause, J. W. (2018). Diatom populations in an upwelling environment decrease silica content to avoid growth limitation. Environ. Microbiol. 20, 4184–4193. doi:10.1111/1462-2920.14431
Ménesguen, A., Dussauze, M., and Dumas, F. (2018). Designing optimal scenarios of nutrient loading reduction in a WFD/MSFD perspective by using passive tracers in a biogeochemical-3D model of the English Channel/Bay of Biscay area. Ocean. Coast. Manag. 163, 37–53. doi:10.1016/j.ocecoaman.2018.06.005
Morelle, J., Schapira, M., Orvain, F., Riou, P., Lopez, P. J., Pierre-Duplessix, O., et al. (2018). Annual phytoplankton primary production estimation in a temperate estuary by coupling PAM and carbon incorporation methods. Estuaries Coasts 41, 1337–1355. doi:10.1007/s12237-018-0369-8
Napoléon, C., and Claquin, P. (2012). Multi-parametric relationships between PAM measurements and carbon incorporation, an in situ approach. PLOS ONE 7, 40284. doi:10.1371/journal.pone.0040284
Némery, J., and Garnier, J. (2007). Origin and fate of phosphorus in the Seine watershed (France): Agricultural and hydrographic P budgets. J. Geophys. Res. Biogeosciences 112. doi:10.1029/2006JG000331
Nixon, S. W. (1995). Coastal marine eutrophication: A definition, social causes, and future concerns. Ophelia 41, 199–219. doi:10.1080/00785236.1995.10422044
Nixon, S. W. (2009). Eutrophication and the macroscope. Hydrobiologia 629, 5–19. doi:10.1007/s10750-009-9759-z
O’Higgins, T., Ferraro, S., Dantin, D., Jordan, S., and Chintala, M. (2010). Habitat scale mapping of fisheries ecosystem service values in estuaries. Ecol. Soc. 15, 7. doi:10.5751/ES-03585-150407
Olson, R. J., Zettler, E. R., and Anderson, O. K. (1989). Discrimination of eukaryotic phytoplankton cell types from light scatter and autofluorescence properties measured by flow cytometry. Cytometry 10, 636–643. doi:10.1002/cyto.990100520
Oxborough, K., Moore, C. M., Suggett, D. J., Lawson, T., Chan, H. G., and Geider, R. J. (2012). Direct estimation of functional PSII reaction center concentration and PSII electron flux on a volume basis: A new approach to the analysis of Fast Repetition Rate fluorometry (FRRf) data. Limnol. Oceanogr. Methods 10, 142–154. doi:10.4319/lom.2012.10.142
Paerl, R. W., Venezia, R. E., Sanchez, J. J., and Paerl, H. W. (2020). Picophytoplankton dynamics in a large temperate estuary and impacts of extreme storm events. Sci. Rep. 10, 22026. doi:10.1038/s41598-020-79157-6
Pannard, A., Souchu, P., Chauvin, C., and Gross, E. (2017). Définition scientifique de l’eutrophisation. L’eutrophisation Manifestations, Causes, Conséquences Prédictibilité. Rapport d’Expertise Sci. Collect. 1283, 14–81. doi:10.15454/tzr1-6m97
Passy, P., Gendre, R. L., Garnier, J., Cugier, P., Callens, J., Paris, F., et al. (2016). Eutrophication modelling chain for improved management strategies to prevent algal blooms in the Bay of Seine. Mar. Ecol. Prog. Ser. 543, 107–125. doi:10.3354/meps11533
Peñuelas, J., Poulter, B., Sardans, J., Ciais, P., van der Velde, M., Bopp, L., et al. (2013). Human-induced nitrogen–phosphorus imbalances alter natural and managed ecosystems across the globe. Nat. Commun. 4, 2934. doi:10.1038/ncomms3934
Pinckney, J. L., Paerl, H. W., Tester, P., and Richardson, T. L. (2001). The role of nutrient loading and eutrophication in estuarine ecology. Environ. Health Perspect. 109, 699–706. doi:10.1289/ehp.01109s5699
Quinlan, E. L., Jett, C. H., and Phlips, E. J. (2009). Microzooplankton grazing and the control of phytoplankton biomass in the Suwannee River estuary, USA. Hydrobiologia 632, 127–137. doi:10.1007/s10750-009-9833-6
Rabalais, N. N., Turner, R. E., Díaz, R. J., and Justić, D. (2009). Global change and eutrophication of coastal waters. ICES J. Mar. Sci. 66, 1528–1537. doi:10.1093/icesjms/fsp047
Raimonet, M., Thieu, V., Silvestre, M., Oudin, L., Rabouille, C., Vautard, R., et al. (2018). Landward perspective of coastal eutrophication potential under future climate change: The seine river case (France). Front. Mar. Sci. 5, 136. doi:10.3389/fmars.2018.00136
Rocha, C., Galvão, H., and Barbosa, A. (2002). Role of transient silicon limitation in the development of cyanobacteria blooms in the Guadiana estuary, south-western Iberia. Mar. Ecol. Prog. Ser. 228, 35–45. doi:10.3354/meps228035
Rojo, C., Cobelas, M. A., and Arauzo, M. (1994). An elementary, structural analysis of river phytoplankton. Hydrobiologia 289, 43–55. doi:10.1007/BF00007407
Romero, E., Le Gendre, R., Garnier, J., Billen, G., Fisson, C., Silvestre, M., et al. (2016). Long-term water quality in the lower Seine: Lessons learned over 4 decades of monitoring. Environ. Sci. Policy 58, 141–154. doi:10.1016/j.envsci.2016.01.016
Sarthou, G., Timmermans, K. R., Blain, S., and Tréguer, P. (2005). Growth physiology and fate of diatoms in the ocean: A review. J. Sea Res., Iron Resour. Ocean. Nutrients - Adv. Glob. Environ. Simulations 53, 25–42. doi:10.1016/j.seares.2004.01.007
Sautour, B., Artigas, L. F., Delmas, D., Herbland, A., and Laborde, P. (2000). Grazing impact of micro- and mesozooplankton during a spring situation in coastal waters off the Gironde estuary. J. Plankton Res. 22, 531–552. doi:10.1093/plankt/22.3.531
Sicko-Goad, L. M., Schelske, C. L., and Stoermer, E. F. (1984). Estimation of intracellular carbon and silica content of diatoms from natural assemblages using morphometric techniques1. Limnol. Oceanogr. 29, 1170–1178. doi:10.4319/lo.1984.29.6.1170
Sieracki, M. E., Verity, P. G., and Stoecker, D. K. (1993). Plankton community response to sequential silicate and nitrate depletion during the 1989 North Atlantic spring bloom. Deep Sea Res. Part II Top. Stud. Oceanogr. 40, 213–225. doi:10.1016/0967-0645(93)90014-E
Sin, Y., Hyun, B., Bach, Q. D., Yang, S., and Park, C. (2012). Phytoplankton size and taxonomic composition in a temperate estuary influenced by monsoon. Estuaries Coasts 35, 839–852. doi:10.1007/s12237-011-9470-y
Sin, Y., Hyun, B., Jeong, B., and Soh, H. Y. (2013). Impacts of eutrophic freshwater inputs on water quality and phytoplankton size structure in a temperate estuary altered by a sea dike. Mar. Environ. Res. 85, 54–63. doi:10.1016/j.marenvres.2013.01.001
Smith, V. H., and Schindler, D. W. (2009). Eutrophication science: Where do we go from here? Trends Ecol. Evol. 24, 201–207. doi:10.1016/j.tree.2008.11.009
Strickland, J. D. H., and Parsons, T. R. (1972). A practical handbook of seawater analysis Bull. Fish. Res. Board Can. 310.
Stumpner, E. B., Bergamaschi, B. A., Kraus, T. E. C., Parker, A. E., Wilkerson, F. P., Downing, B. D., et al. (2020). Spatial variability of phytoplankton in a shallow tidal freshwater system reveals complex controls on abundance and community structure. Sci. Total Environ. 700, 134392. doi:10.1016/j.scitotenv.2019.134392
Thyssen, M., Grégori, G. J., Grisoni, J. M., Pedrotti, M. L., Mousseau, L., Artigas, L. F., et al. (2014). Onset of the spring bloom in the northwestern mediterranean sea: Influence of environmental pulse events on the in situ hourly-scale dynamics of the phytoplankton community structure. Front. Microbiol. 5, 387. doi:10.3389/fmicb.2014.00387
Van Meerssche, E., and Pinckney, J. L. (2019). Nutrient loading impacts on estuarine phytoplankton size and community composition: Community-based indicators of eutrophication. Estuaries Coasts 42, 504–512. doi:10.1007/s12237-018-0470-z
Watanabe, K., Kasai, A., Fukuzaki, K., Ueno, M., and Yamashita, Y. (2017). Estuarine circulation-driven entrainment of oceanic nutrients fuels coastal phytoplankton in an open coastal system in Japan. Estuar. Coast. Shelf Sci. 184, 126–137. doi:10.1016/j.ecss.2016.10.031
Webb, W. L., Newton, M., and Starr, D. (1974). Carbon dioxide exchange of Alnus rubra: A mathematical model. Oecologia 17, 281–291. doi:10.1007/BF00345747
Keywords: flow cytometry, variable fluorimetry, phytoplankton communities, multispectral fluorimetry, eutrophication
Citation: Serre-Fredj L, Chasselin L, Jolly O and Claquin P (2023) Complex drivers of primary production along an anthropised estuary (Seine estuary—France). Front. Environ. Sci. 11:1216732. doi: 10.3389/fenvs.2023.1216732
Received: 04 May 2023; Accepted: 19 June 2023;
Published: 29 June 2023.
Edited by:
Wei He, China University of Geosciences, ChinaReviewed by:
Yuqiu Wei, Chinese Academy of Fishery Sciences (CAFS), ChinaRita B. Domingues, University of Algarve, Portugal
Miki Hondzo, University of Minnesota Twin Cities, United States
Copyright © 2023 Serre-Fredj, Chasselin, Jolly and Claquin. This is an open-access article distributed under the terms of the Creative Commons Attribution License (CC BY). The use, distribution or reproduction in other forums is permitted, provided the original author(s) and the copyright owner(s) are credited and that the original publication in this journal is cited, in accordance with accepted academic practice. No use, distribution or reproduction is permitted which does not comply with these terms.
*Correspondence: Pascal Claquin, cGFzY2FsLmNsYXF1aW5AdW5pY2Flbi5mcg==