 Kang Wang1,2
 Jining Zhang
- 1Zhejiang University-Shanghai Tunnel Engineering Co., Ltd. (ZJU-STEC), Urban Development and Planning Innovation Joint Research Center, Zhejiang University, Hangzhou, China
- 2China Eco-city Academy Co., Ltd., Tianjin, China
- 3College of Architecture and Urban Planning, Tongji University, Shanghai, China
- 4College of Transportation, Tongji University, Shanghai, China
Beyond traditional carbon reduction approaches, vegetation carbon sinks play a critical role in advancing carbon-neutral urban development. This study refines the evaluation framework for land use efficiency (LUE) by incorporating regional carbon balance, and applies a global super-efficiency epsilon-based measure (EBM) model to assess LUE in 69 cities across the urban agglomerations of the Yangtze River Economic Belt (YREB) from 2005 to 2020. To examine regional disparities, the Dagum Gini coefficient and kernel density estimation are utilized, while spatial convergence models are employed to explore the dynamic evolution of LUE. The results reveal a U-shaped temporal trend in LUE across the YREB, alongside significant spatial heterogeneity among agglomerations. Inter-regional disparities and transvariation intensity are the main contributors to spatial differences, whereas intra-regional disparities have narrowed over time, particularly in the middle reaches of the Yangtze River—with the exception of the Chengdu-Chongqing region. Spatial convergence analysis further indicates significant absolute and conditional convergence within each agglomeration. These findings suggest that policy efforts to enhance LUE in the YREB should be tailored to the specific regional contexts of economic development, industrial structure, fiscal capacity, and business environment.
1 Introduction
The World Cities Report 2022 by the United Nations Human Settlements Programme highlights that the global urban population has surged from 25% in 1950 to nearly 50% in 2020. Historically, land use by humans has significantly altered and fragmented ecosystems (Hong et al., 2021). Urban expansion into low-density agricultural and forested areas has notably reduced ecological reserves, diminished carbon sequestration capacity, and increased both energy consumption and carbon emissions (Burchfield et al., 2006; Zhang and Xu, 2017; DeFries et al., 2022). Native vegetation and soils store substantial carbon, and their loss—driven by agricultural expansion and emissions from agricultural practices—accounts for approximately 20%–25% of total global greenhouse gas (GHG) emissions (Searchinger et al., 2018).
Urban densification has been proposed to counteract the negative environmental impacts of sprawl by promoting more efficient land use and reducing ecological degradation (Haaland and van den Bosch, 2015). Intensive land use plays a crucial role in reducing GHG emissions and supporting low-carbon economic transitions (Xie et al., 2018; Ling et al., 2023). However, increased efficiency can paradoxically lead to further development and resource use—an outcome known as the Jevons paradox—which may exacerbate ecological degradation and carbon emissions (Alcott, 2005; Heiskanen, 2021; Ceddia and Zepharovich, 2017).
Urbanization and rural abandonment also disrupt the supply and demand of ecosystem services (Hasan et al., 2020) and contribute to increased biodiversity loss (Marques et al., 2019). Take China, for example, In recent decades, the Yangtze River Delta Urban Agglomeration has experienced concentrated expansion of construction land, leading to significant scale effects and the accelerated loss of previously undisturbed farmland and forest ecosystems (Zhai et al., 2024). To achieve carbon neutrality, regional carbon balance objectives must be integrated into land-use planning—especially at regional scales—given that ecosystem service flows often transcend municipal boundaries (González-García et al., 2020). Moreover, climate strategies in the land sector must be region-specific. Uniform approaches can exacerbate inequality and inflict economic harm, particularly in developing regions such as China, India, and African countries (Yu et al., 2023). Thus, measuring land use efficiency (LUE) under regional carbon balance constraints—while accounting for spatial disparities and convergence trends—is critical for sustainable land governance and equitable carbon neutrality.
Optimizing land management is a promising strategy for mitigating climate change (Sha et al., 2022). As the world’s largest carbon emitter, China plays a pivotal role in global carbon neutrality efforts. The Yangtze River Economic Belt (YREB), one of China’s most important economic zones, contributed 46.7% of national GDP in 2023. However, rapid urbanization in the YREB has intensified tensions between environmental sustainability and economic development. Excessive land expansion and inefficient industrial structures have led to declining LUE and increased ecological vulnerability, posing serious challenges to sustainable development. These challenges are further complicated by significant regional disparities (Yang et al., 2022).
In response, this study refines the LUE evaluation framework by explicitly incorporating regional carbon balance constraints. Using data from 69 cities across the three major urban agglomerations in the YREB from 2005 to 2020, a global super-efficiency epsilon-based measure (EBM) model is employed to assess LUE. To analyze regional disparities, we apply the Dagum Gini coefficient and kernel density estimation. Furthermore, spatial convergence models are introduced to investigate convergence patterns and identify the driving forces of LUE dynamics—offering empirical insights for land-use policymaking aligned with regional and carbon goals.
Extensive research has examined the interrelationship between land use and carbon emissions. Key topics include the measurement of carbon emissions and sinks from land use (Zhou et al., 2021; Luo et al., 2022), the drivers of land-based carbon emissions (Barati et al., 2023; Hong et al., 2021; Yang et al., 2023), low-carbon land-use strategies (Wartenberg et al., 2021; Chuai et al., 2015; Huang et al., 2021), and LUE accounting for carbon emissions (Prisley and Hall, 2024; Kuang et al., 2020; Wu et al., 2022). These studies highlight the dual role of land use in both carbon mitigation and carbon sequestration. Influencing factors include economic development, population growth, energy use, technological advancement, institutional frameworks, land policies, and openness.
At multiple spatial scales—provincial (Luo et al., 2020) and municipal (Liu et al., 2024; Chen et al., 2022)—LUE has been evaluated using diverse methodologies, including stochastic frontier analysis (Liu et al., 2020), slack-based measures (Tan et al., 2021; Xiao et al., 2022), and predictive modeling based on InVEST (Zafar et al., 2024).
Building upon this evaluative foundation, researchers have explored the spatiotemporal evolution and influencing mechanisms of LUE under carbon constraints (Zhou and Lu, 2023; Yang and Liu, 2023). Due to variations in geography, resource endowment, and socioeconomic factors, spatial imbalances in LUE persist (Liu et al., 2019). Several methods—such as the Gini coefficient (Zheng et al., 2013), Theil index (Xue et al., 2022), concentration index (Song et al., 2013; Wang et al., 2022), Hirschman–Herfindahl index (Song et al., 2013), and Moran’s I (Wu et al., 2022)—have been used to characterize these disparities. Even without accounting for carbon sinks, substantial LUE imbalances have been identified within the YREB (Liu et al., 2021; Luo et al., 2020).
Despite the breadth of existing studies, several research gaps remain. First, the integration of carbon balance into LUE assessment remains insufficient. Second, current studies pay limited attention to urban agglomerations as focal units. Third, the spatial convergence of LUE has not been adequately explored using spatial econometric models.
This study aims to address these gaps with three main contributions:
(1) It refines the LUE assessment by integrating carbon emissions and sequestration to construct a more comprehensive carbon balance framework—responding to the global call for carbon-neutral land-use strategies.
(2) It focuses on urban agglomerations within the YREB rather than national or provincial levels, offering insights into the core engines of China’s urban and economic transformation.
(3) It employs spatial convergence models to uncover dynamic patterns in regional LUE and enhance understanding of spatial inequalities over time.
The remainder of this paper is organized as follows: Section 2 presents the materials and methodology. Section 3 reports empirical results. Section 4 provides discussion and policy implications. Section 4.2 concludes the study and discusses limitations.
2 Materials and methods
2.1 Study area
We focus on the YREB’s three main urban agglomerations: the Yangtze River Delta (YRD) with Shanghai at its heart, incorporating 26 cities across Jiangsu, Zhejiang, and Anhui provinces; the middle reaches of the Yangtze River (MRYR) with Wuhan at its heart, which encompasses 31 cities in Hubei, Hunan, and Jiangxi provinces; and Chengdu–Chongqing, including 16 cities such as Deyang and Mianyang, as the economic and cultural center in western China. Notably, Xiantao, Qianjiang, Tianmen, and Xiangyang were excluded from this analysis due to the absence of relevant statistics. In the end, we obtained 69 prefecture-level and above cities in the YREB and used them as the research objects of this study. A visualization of the study area is shown in Figure 1. The scope of this study excludes rural areas for two main reasons. First, the primary objective is to examine LUE dynamics within urban agglomerations of the YREB, which serve as the core drivers of regional economic transformation and carbon reduction strategies. Second, rural areas typically exhibit relatively homogeneous land use patterns, such as agricultural and ecological land, with limited variation in intensity and structure. As a result, changes in LUE within these areas are comparatively marginal and less relevant to the analytical framework adopted in this study.
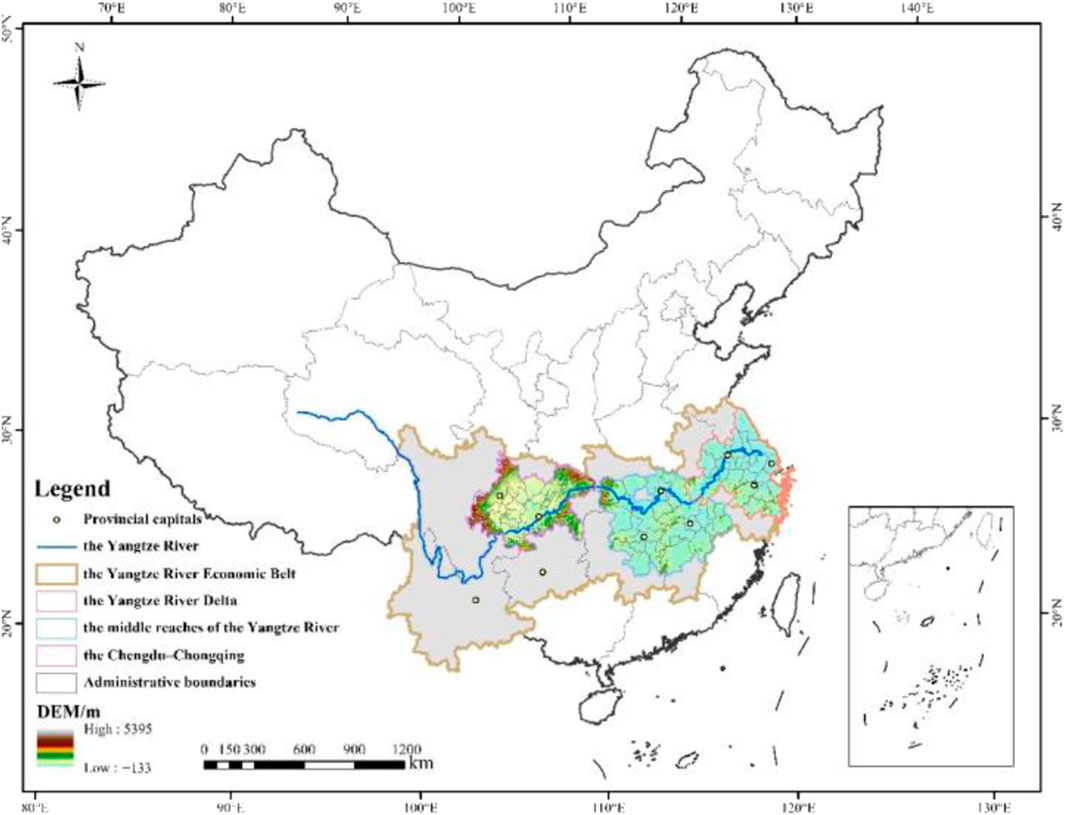
Figure 1. Study area.
2.2 Variable selection and data description
2.2.1 Index system of LUE towards carbon neutrality
Aligning urban LUE with carbon neutrality goals requires balancing economic growth with sustainable resource use and regional carbon balance. In a carbon-neutral city, urban carbon emissions are offset by equivalent carbon removals. Therefore, net carbon emissions serve as a critical indicator of urban carbon neutrality. When considering land use as a dynamic process of “input and output,” the concept of land use toward carbon neutrality can be defined as a systematic approach that aims to steadily increase desired outputs, such as GDP, while managing production inputs efficiently and minimizing undesired outputs, particularly net carbon emissions (Figure 2). This framework focuses specifically on land use and its role in achieving carbon neutrality, without addressing other environmental pollutants. Table 1 shows the variable descriptions of inputs and outputs.
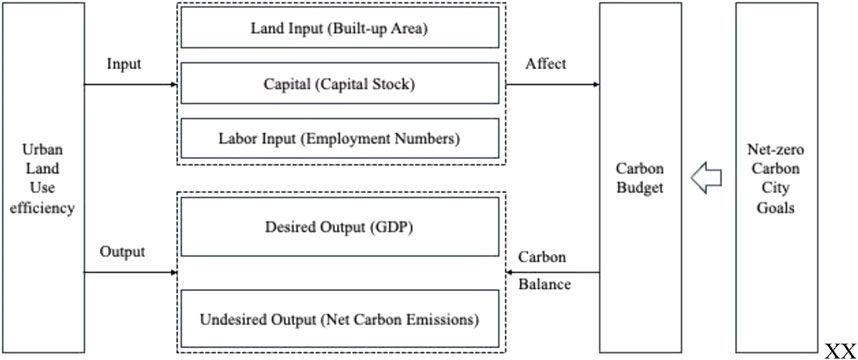
Figure 2. Theoretical framework for LUE under net-zero carbon city goals.
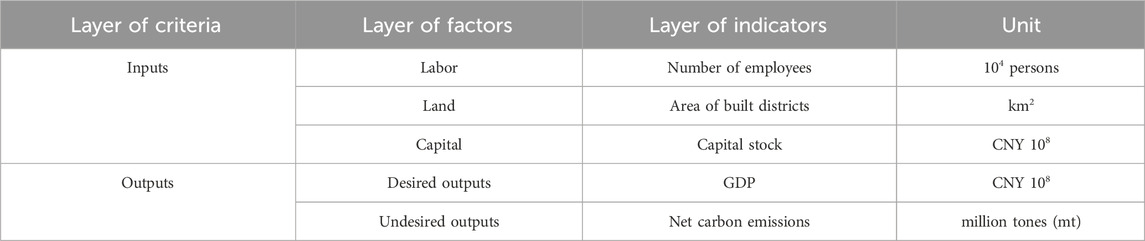
Table 1. Evaluation index system of urban LUE towards carbon neutrality.
2.2.2 Influencing factors of LUE towards carbon neutrality
The influencing factors of LUE towards carbon neutrality include financial deepening (Loan), fiscal gap (Gap), industrial structure (Indus), economic development (Pgdp), and foreign direct investment (Fdi). Table 2 shows the specific definitions of control variables.
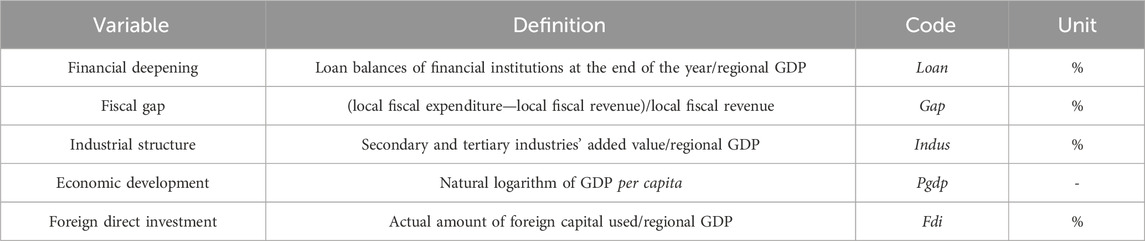
Table 2. Description of influencing factors.
2.2.3 Data description
This study’s period spans from 2005 to 2020. Due to the monopoly power of local governments in China over land (Gyourko et al., 2022), we had to carefully consider the possible discontinuities caused by planning and policy changes when clarifying the temporal border of the study. Based on the 11th Five-Year Plan (2006–2010) and incremental calculations in the spatial convergence analysis, we set the starting time point as 2005. To mitigate the discontinuous impact of the COVID-19 epidemic, we set the end-time point as 2020. Data on provincial carbon emissions were derived from the China Energy Statistical Yearbook. Nighttime light observations, including DMSP/OLS and NPP/VIIRS, were procured from the EOG. The original data of urban carbon sinks come from the MODIS NPP product (MOD17A3) released by NASA and the Landsat-derived annual land cover product of China (CLCD) data provided by Yang and Huang (2021). The urban built-up area data originated from the China Urban Construction Statistical Yearbook. Additional statistics were sourced from the China City Statistical Yearbook and the National Bureau of Statistics. To address the missing values, linear interpolation was employed. Furthermore, all price variables were recalibrated to the 2005 metric to reflect actual changes. Table A1 in Supplementary Appendix SA1 shows the specific data description.
2.3 Methods
2.3.1 Carbon budget accounting
Carbon budget accounting requires accurate calculations of both carbon emissions and carbon sinks. We calculated carbon sinks using two key data sources: NASA’s MOD17A3 net primary productivity (NPP) data and the CLCD data (Chen et al., 2020; Yang and Huang, 2021). First, we processed the MOD17A3 data by extracting relevant bands and merging the images using the HEGTool. Then, we applied coordinate transformation, mask extraction, and zonal statistics to both the MOD17A3 and CLCD datasets using ArcGIS 10.8. This enabled us to calculate the NPP for different land use types across various cities, providing annual estimates for each. For every Gram of dry biomass produced, approximately 1.62 g of CO2 are sequestered, with this biomass constituting roughly 45% of the total NPP. Thus, carbon sinks are calculated using the formula: Carbon Sinks = (NPP/0.45) × 1.62.
Carbon emissions are calculated using the PSO-BP algorithm, which integrates DMSP/OLS and NPP/VIIRS nighttime light data with provincial carbon emission statistics (Chen et al., 2020). First, a relationship is established between provincial carbon emissions and nighttime light intensity, represented by the sum of DN values. Urban carbon emissions are then estimated by applying a weighted average to these DN values. Provincial carbon emissions follow the IPCC’s inventory guidelines, using energy consumption data sourced from the energy balance sheets (Shan et al., 2020).
The net carbon emissions are calculated by subtracting carbon sinks from total carbon emissions, using the following formula: Net Carbon Emissions = Carbon Emissions - Carbon Sinks.
2.3.2 Global super-efficiency epsilon-based measure model
Following the research of Tone and Tsutsui (2010) and Wang et al. (2023), we consider k = (1, 2 … K) Decision-Making Units (DMUs) and construct a global technology production possibility set. For each DMUk, J types of inputs, denoted as xj (j = 1, 2 … J), generate M desired outputs, represented by ym (m = 1, 2 … M), and N undesired outputs, denoted as bn (n = 1, 2 … N). The resulting production possibility set is defined:
where
The global super-efficiency epsilon-based measure model is:
where γ* indicates the optimal efficiency under constant returns to scale.
2.3.3 Dagum gini coefficient decomposition
According to Formulas 5–8, spatial differences (intra-regional and inter-regional Gini coefficients) are decomposed and analyzed. This method segments spatial differences into three components, intra-regional differences, inter-regional differences, and transvariation intensity (overlap between regions), thereby enabling a more precise identification of the sources of spatial differences (Dagum, 1997). A larger Gini coefficient indicates more pronounced spatial imbalances in LUE, whereas a smaller coefficient suggests narrower spatial gaps. The Dagum Gini coefficient is defined as follows:
where G represents the aggregate Gini coefficient,
where Gw is computed based on the intra-group Gini coefficient Gjj, while Gnb and Gt are calculated using the inter-group Gini coefficient Gjh.
The respective expressions for Gjj and Gjh are presented below:
where
2.3.4 Kernel density estimation
This study used kernel density estimation to describe the dynamic evolution of the distribution of urban LUE. As an important nonparametric method, kernel density estimation is now widely used in the study of imbalanced distributions (Tan et al., 2021; Zhao et al., 2023). It is mainly used to estimate the probability density of random variables and describe the distribution shape of random variables through a smooth and continuous density curve. Kernel density estimation expression is as follows:
where f(x) denotes the probability density function of the random variable x, K(∙) represents the Gaussian kernel function, N is the total number of observations, and X refers to the observed value; h signifies the bandwidth parameter for the kernel function. Its value can affect the smoothness of the kernel function distribution curve. Since the kernel density function is sensitive to the choice of bandwidth, a smaller bandwidth is usually used to improve the estimation accuracy (Silverman, 1986). The bandwidth size h used in this study was 0.1.
2.3.5 Spatial convergence model
The neoclassical growth model uses technological progress to explain the gap in economic growth levels between countries. It believes that due to the diminishing marginal returns to capital, economic development will eventually reach a stable state. Economic growth theory calls this the convergence of economic growth (Quah, 1996). Widely recognized convergence models encompass σ-convergence and β-convergence models, which enable the statistical examination of the evolving trends in spatial differences. σ-Convergence was quantified using the coefficient of variation, indicative of a diminishing disparity in LUE over time. Disregarding the determinants of LUE, lower-efficiency cities within a region tend to grow at accelerated rates, ultimately achieving parity with higher-efficiency cities; this process is termed absolute β-convergence. Given that intensified interactions and mobility of elements between cities engender spatial effects, in this study, we constructed the spatial convergence model Durbin model (SDM), spatial autoregressive model (SAM), and spatial error model (SEM) for analyzing β-convergence, respectively. Conditional β-convergence was assessed by incorporating a set of control variables into the absolute β-convergence model to analyze the con-vergence tendency of LUE. Formulas 11–14 (Spatial α/β-convergence models) are applied to analyze LUE convergence, confirming absolute and conditional convergence with spatial spillover effects. The σ-convergence’s formula is presented below:
where yij signifies the LUE of city i within urban agglomeration j. Similarly,
The β-convergence’s formula is presented below:
where yi,t+1 denotes the LUE of the city i in period t + 1, while yit represents the same for period t. The coefficient β, indicative of convergence when negative, informs the rate of convergence, expressed as v = −ln(1− |β|)/T. The parameters ρ, θ, μi, ηt, and εit correspond to the spatial autoregressive coefficient, spatial spillover effect, city-specific fixed effect, time-specific fixed effect, and the stochastic disturbance term, respectively.
3 Results
3.1 Measurement results of LUE towards carbon neutrality
According to Formulas 2–4, the global super-efficiency EBM model is applied to measure LUE across urban agglomerations, with robustness checks confirming the results. Figure 3 depicts the evolution of average net carbon emissions within the YREB. Between 2005 and 2020, the net carbon emissions within the YREB as a whole exhibited an increase trend until 2011 but then changed to a slight downward trend. Figure 4 depicts the evolution of the average LUE within the YREB. Between 2005 and 2020, the urban LUE within the YREB exhibited a decrease, followed by an increase since 2013. In a subregional comparison, the Chengdu–Chongqing demonstrated the highest LUE with a value of 0.793, followed by the MRYR and the YRD, with efficiencies of 0.715 and 0.676, respectively. The LUE of both the YRD and the MRYR increased rapidly after 2013, and the former was more significant, surpassing the overall level in 2019. By 2020, the YRD emerged as the most efficient agglomeration within the YREB. However, although Chengdu–Chongqing also rose rapidly after 2013, it experienced a decline after 2017.
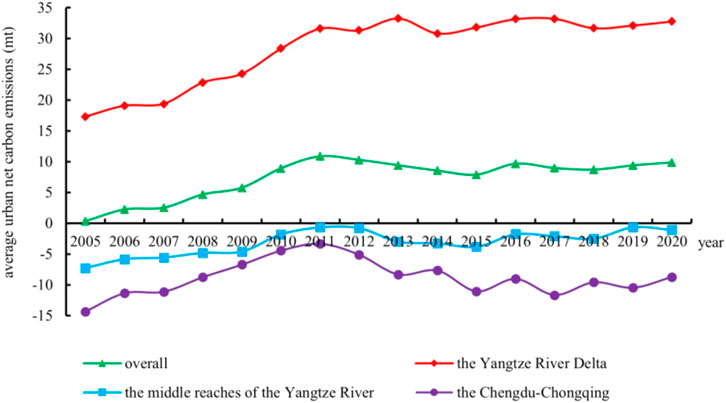
Figure 3. Trends of urban net carbon emissions in the YREB from 2005 to 2020.

Figure 4. Trends of urban LUE in the YREB from 2005 to 2020.
The inaugural urbanization conference in Beijing emphasized the need to heighten urban LUE and optimize urbanization patterns and structures. In the subsequent year, the National New Urbanization Plan (2014–2020) was released. As these policies progressed, LUE showed year-on-year enhancement. Chengdu–Chongqing’s leading efficiency is predominantly due to its extensive forest cover. Yet, recent urban sprawl, characterized by extensive land use and short-term technological stagnation, impeded improvements in efficiency since 2017. The more significant rise in the LUE after 2013 in the YRD is largely due to its success in industrial transformation and institutional innovation (Zhang and Chen, 2021).
To ensure the validity of the results, we verified them from the perspective of net carbon emissions and LUE respectively. Referring to the research of Chen et al. (2020) and Shan et al. (2020), from the perspective of carbon emissions and carbon sinks, we fit the data calculated in this study with the data calculated by them (Supplementary Appendix Figure A1). The fitting results show that our measurement results are relatively close to the existing literature, which illustrates the validity of our results to a certain extent. To ensure the validity of the global super-efficiency EBM model, we replaced the model settings of the distance function and returns to scale (RTS) for further tests (Supplementary Appendix Figure A2). The fitting results show that our results are still valid even if the model specification is changed. Supplementary Appendix Figures A2a,b, respectively, show the fitting results after the setting of the RTS is changed to CRS, and the setting of the distance function is changed to the SBM. It is worth noting that although the fitting effect of Supplementary Appendix Figure A2a is slightly worse than that of Supplementary Appendix Figure A2b, the R-squared value still reaches 0.991, and most of the observation points are on the diagonal line, which also illustrates the validity of the research results.
3.2 Spatial differences and source decomposition
3.2.1 Intra-regional differences
According to Model 7 analysis, Figure 5 depicts the intra-regional differences of the LUE across the YREB. During the sample period, the differences within the YREB demonstrated a general downward trend. When comparing urban agglomerations, the MRYR had the highest average Gini coefficient of 0.134, followed by the YRD at 0.130 and Chengdu–Chongqing at 0.118. Notably, the middle reaches experienced a significant reduction. Differences were pronounced before 2008, followed by an M-shaped pattern that mirrored the overall trend. In the YRD, two distinct phases were observed, namely, a stage of high variability around a Gini coefficient of 0.137 until 2013 and a subsequent decrease to 0.119 post-2014, likely influenced by the YRD Regional Plan, which facilitated a more uniform development pace. The Chengdu–Chongqing maintained lower intra-regional differences than the overall area, with a brief rise before 2007 and a stabilization around 0.116 thereafter.
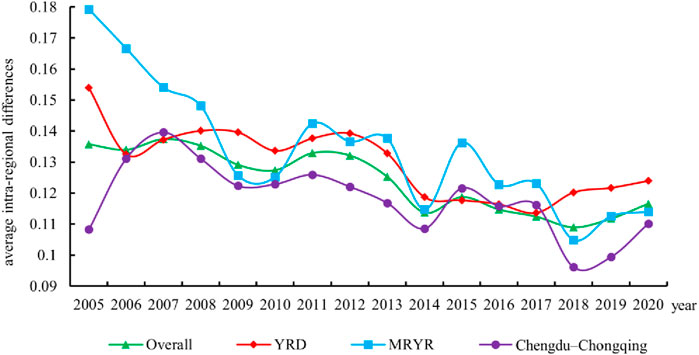
Figure 5. Intra-regional differences of urban LUE in the YREB from 2005 to 2020.
Waterway transportation has played an increasingly important role in the context of trade globalization due to its advantages of strong transportation capacity and low cost. As an important global Golden Inland Waterway, the Yangtze River’s transportation demand and carrying capacity have increased significantly since China’s accession to the WTO in 2001 (Wang et al., 2020). China’s trade expansion has greatly promoted the development of the three urban agglomerations in the YREB. As urban agglomerations continue to develop, urban specialization will undergo a transformation from sectoral to functional specialization (Duranton and Puga, 2005). The spatial-functional urban specialization is reflected in the specialization and collaboration between cities and the spatial layout of different industries to achieve optimal efficiency, promoting coordinated development. Also, as conditions of transportation to central cities continue to improve and transportation costs continue to decrease (Sun et al., 2019), the attractiveness of peripheral cities will significantly increase for manufacturing companies that are more sensitive to cost increases. Therefore, the intra-regional differences are generally shrinking.
3.2.2 Inter-regional differences
According to Model 8 analysis, Figure 6 reveals a pattern of expansion–contraction–expansion, signifying a trend of deterioration–improvement–deterioration in the inter-regional differences among the three urban agglomerations. The most minimal differences were observed between the MRYR and Chengdu–Chongqing, with a modest mean index of 0.096. In contrast, the YRD exhibited a considerable variance from the other two agglomerations, with mean differences of 0.123 and 0.121 when compared to the MRYR and Chengdu–Chongqing, respectively. The YRD’s unique status as a globally recognized urban agglomeration has been bolstered by its rapid advancements in urbanization, industrial upgrading, and successful adoption of green technologies to mitigate pollution and carbon emissions. This progressive path has led to pronounced differences with other agglomerations. Over the sample period, there was an annual decrease of 1.14% in the differences between the YRD and the MRYR, suggesting a gradual convergence in the LUE. The 2015 Development Planning of Urban Agglomeration in the MRYR aimed at fostering a new type of urbanization in central and western China and, together with the Special Plan for Reform and Innovation of Science and Technology Finance in Wuhan Metropolitan Areas, has significantly impacted technological innovation within the agglomeration. Conversely, the differences between the YRD and Chengdu–Chongqing saw a marginal annual rise of 0.9%, which is due to a downward trend in the latter’s LUE in recent years. The relative stability in the differences between the MRYR and Chengdu–Chongqing, with a growth rate of just 0.21%, indicates a synchronous improvement.

Figure 6. Inter-regional differences of urban LUE in the YREB from 2005 to 2020. Note: 1, 2, and three represent the YRD, the MRYR, and Chengdu–Chongqing, respectively.
3.2.3 Source decomposition
According to Models 5, 6 analysis, the temporal dynamics of the magnitude and shares of contributions to regional differences—decomposed into intra-regional difference contribution, inter-regional difference contribution and transvariation intensity contribution—are presented in Figure 7. Initially, the intra-regional difference within the YREB remained relatively stable throughout the observed period, commencing at 0.039 and concluding at 0.040. Its proportional share varied between 29.13% and 34.57%. Conversely, the inter-regional difference contribution demonstrated a general decline, initiating at 0.068, descending sharply to 0.026 by 2010, and thereafter exhibiting a fluctuating yet downward trend, ending at 0.016. Its share of the total contribution started at 50.1%, dropped significantly to 20.29% in 2010, and subsequently wavered, finishing at 13.79% in 2020, with an average rate of 27.77% across the sample period. Lastly, the magnitude of the transvariation intensity’s contribution traced an N-shaped pattern over time, starting at 0.028, peaking at 0.061 in 2012, declining to 0.038 in 2017, and rising again to 0.060 by the end. Correspondingly, its share exhibited a fluctuation from 20.86% to 51.78%, averaging 39.46% throughout the time period of the study.
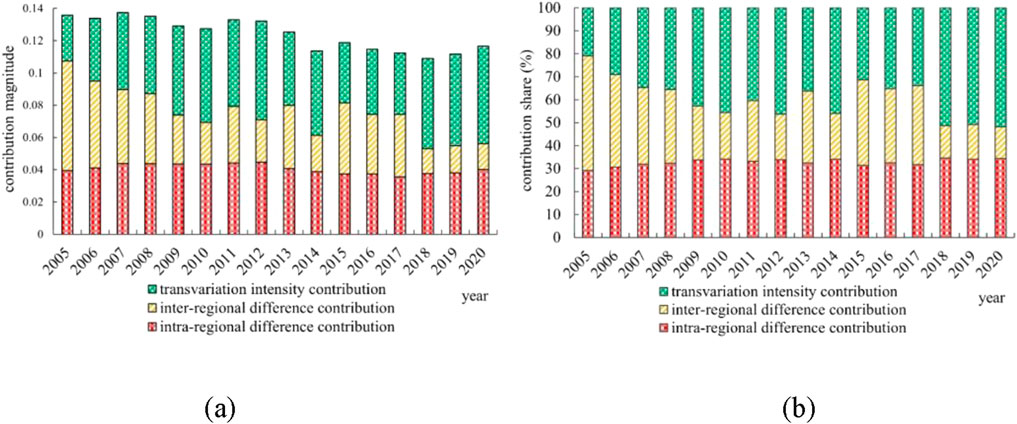
Figure 7. Source decomposition of regional LUE differences in the YREB from 2005 to 2020. Note: (a,b) depict the contribution magnitude and contribution share, respectively.
To conclude, the analysis reveals that inter-regional differences and transvariation intensity accounted for an average contribution rate of 67.23%. This underscores inter-regional differences and transvariation intensity as the primary contributor. While the inter-regional difference contribution decreased, the contribution from transvariation intensity demonstrated an increasing trend, with the latter being the most impactful at an average rate of 39.46%. These data suggest that the overlapping problem of LUE across agglomerations is chiefly responsible for the imbalanced development in the belt.
3.3 Distribution dynamics
Formulas 9, 10 (Kernel density estimation) are applied to analyze LUE distribution dynamics, revealing shifts, polarization trends, and extreme values. Table 3 summarizes the key features of the kernel density curves, and Figure 8 illustrates the specific curves.
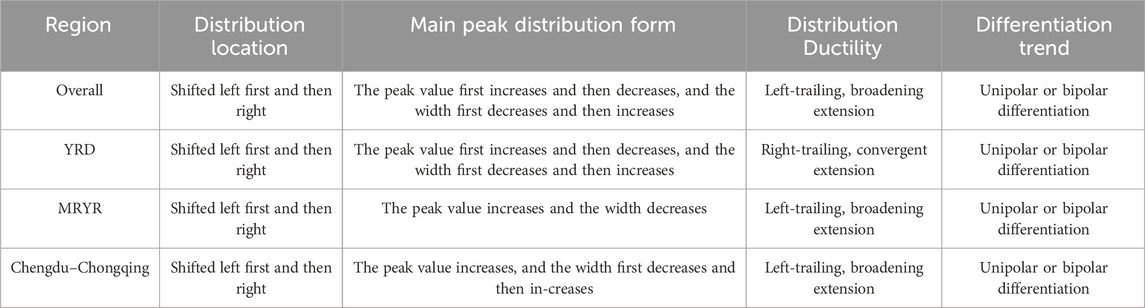
Table 3. Distribution dynamic characteristics of LUE in the YREB.
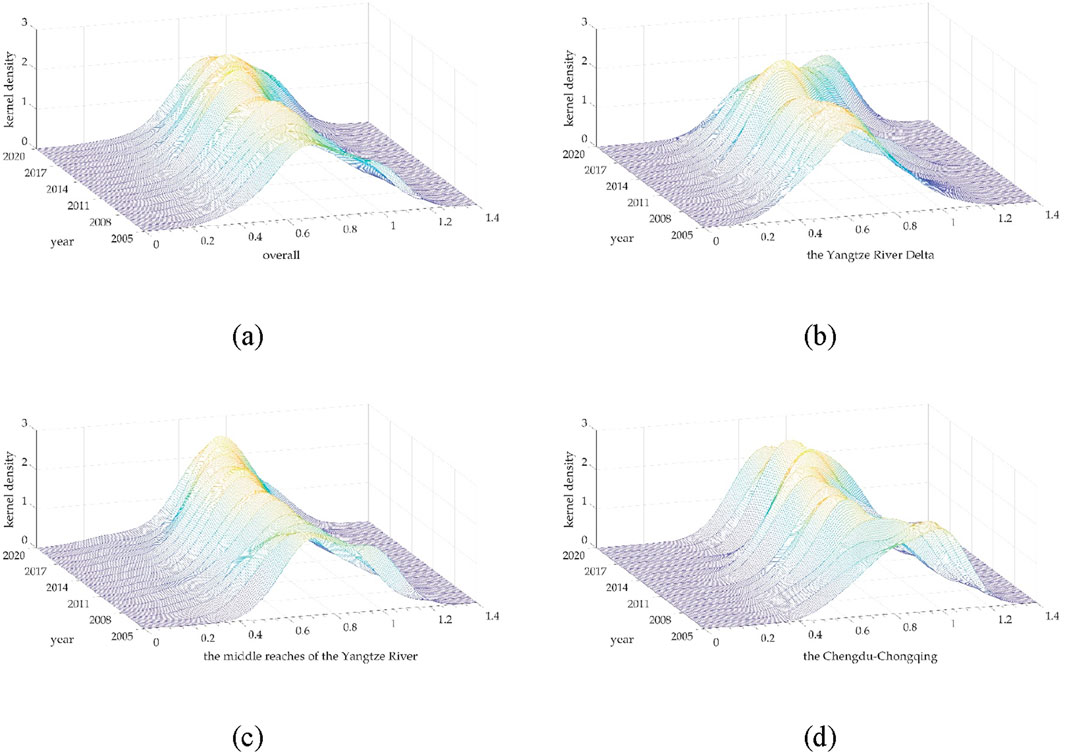
Figure 8. Distribution dynamics of LUE in the YREB from 2005 to 2020. Note: (a–d) depict the kernel density plot of the overall region, the YRD, the MRYR and Chengdu–Chongqing, respectively.
Considering the distribution location, the overall and three urban agglomerations all showed a trend characterized by an initial leftward shift until 2013 and a subsequent rightward shift from 2013 to 2020. This pattern suggests a decrease in the LUE from 2005 to 2013, with a subsequent increase from 2013 to 2020, corroborating the findings previously discussed in this paper. Prior to 2013, the YREB, a hub for industrial development, experienced a contraction in green space owing to intensive urbanization, industrialization, and an energy structure dependent on high consumption and emissions, leading to a surge in urban carbon emissions (Wang and Wang, 2022). Post-2013, in response to national policies on emission reduction and environmental protection, a new urbanization strategy emphasizing LUE and urban configuration began to yield positive results, as evidenced by the increasing efficiency in land use.
Upon considering the main peak distribution, it is evident that the overall peak value initially rises and then declines, while the bandwidth transitions from narrow to wide. This pattern demonstrates that the spatial differences first contract and subsequently expand. In the early sample period, economic development among cities appeared to converge toward a state of stability. Subsequent to the development of national carbon emission reduction and new urbanization policies, differing industrial structures across cities have led to variable challenges in the green transition, resulting in the divergence of LUE. From a subregional perspective, the main peak distribution pattern in the YRD was similar to the overall trend, with LUE differences initially narrowing and later widening. Chengdu–Chongqing and the MRYR both exhibited an upward trend in peak value, yet their bandwidth evolution diverged. The MRYR’s decreasing bandwidth indicates a reduction in spatial differences, whereas Chengdu–Chongqing’s increasing bandwidth at the sample period’s end suggests expanding differences.
When examining the distribution ductility, it can be observed that the overall region and the three urban agglomerations exhibited a left-trailing pattern. This suggests that some cities have LUEs significantly lower than others within urban agglomerations. The distribution curves broaden, indicating the presence of extremely low values, with certain cities such as Ezhou and Huangshi in the MRYR and Suining in Chengdu–Chongqing consistently at low-efficiency levels. Conversely, the YRD’s distribution curve exhibits a right-trailing pattern, reflecting high-efficiency outliers in cities like Shanghai, Jinhua, and Suzhou, among others. Shanghai’s notable efficiency is attributed to its robust scientific infrastructure and comprehensive green industry. The converging pattern of the YRD’s distribution curve suggests a reduction in extreme values, potentially due to a “trickle-down” or “radiation” effect (Qiu and Yu, 2024).
Upon examining the differentiation trend, it becomes apparent that the overall region and the three urban agglomerations exhibited bipolarity in urban LUE. These agglomerations initially displayed a dual-peak distribution but gradually converged to a single peak, suggesting a diminishing trend in polarization. Specifically, in the YRD, bipolarity emerged in 2018, with the left peak being less pronounced than the right peak. The separation between the peaks widened, indicating an increasing trend in bipolarity. These data indicate that while most cities in the YRD sustained high-efficiency levels, a few cities maintained moderate levels.
3.4 Spatial convergence analysis
3.4.1 σ-Convergence analysis
According to Model 11 analysis, Figure 9 demonstrates the σ-convergence results, revealing a contraction in the overall coefficient of variation from 0.238 to 0.207 during the study period. This change represents an average annual reduction of 0.93%, suggesting a steady harmonization of new urbanization and industrial upgrading among cities. Focusing on specific urban agglomerations, the YRD exhibited a decrease in LUE variation from 0.248 to 0.208, indicative of systematic convergence. Conversely, neither the MRYR nor Chengdu–Chongqing displayed significant σ-convergence, with final variation coefficients surpassing initial figures. However, in the medium term, the two showed obvious convergence trends. Particularly, Chengdu–Chongqing maintained a lower level of variation, presumably due to the uniformity in its industrial and energy profiles (Zhang et al., 2022).
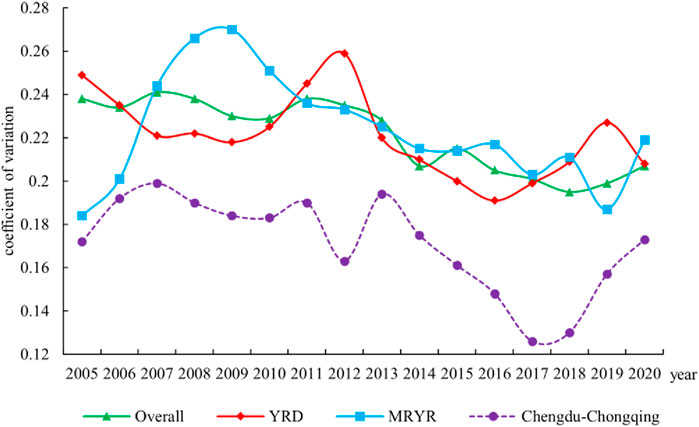
Figure 9. σ-Convergence results of LUE in the YREB from 2005 to 2020.
3.4.2 β-Convergence analysis
According to Models 12-14 analysis, Table 4 presents the results of the absolute β-convergence. Firstly, the coefficient of β was significantly negative at the 1% level for both the overall region and the three urban agglomerations, suggesting the presence of absolute β-convergence. This implies that cities with initially lower LUE experience faster growth rates than their counterparts with initially higher efficiency, regardless of economic and social factors. Secondly, the speed of convergence varied among the agglomerations analyzed. The overall convergence rate was 0.022, with the MRYR exceeding the overall rate at 0.035, indicating that spatial interactions within this agglomeration fostered a more rapid convergence. Conversely, the YRD’s convergence rate was below the overall rate at 0.018, and Chengdu–Chongqing exhibited the slowest rate at 0.011. Thirdly, spatial effects also differed across the overall sample and the three urban agglomerations. In the overall region and the YRD, both the dependent and independent variables showed spatial lags. This means that there were positive spatial spillover effects that affected the rate of change in LUE. A spatial error correlation was present in the MRYR, while Chengdu–Chongqing exhibited a spatial lag in the dependent variable. Given that absolute β-convergence analysis omits several key determinants of LUE, a subsequent conditional β-convergence analysis is warranted.
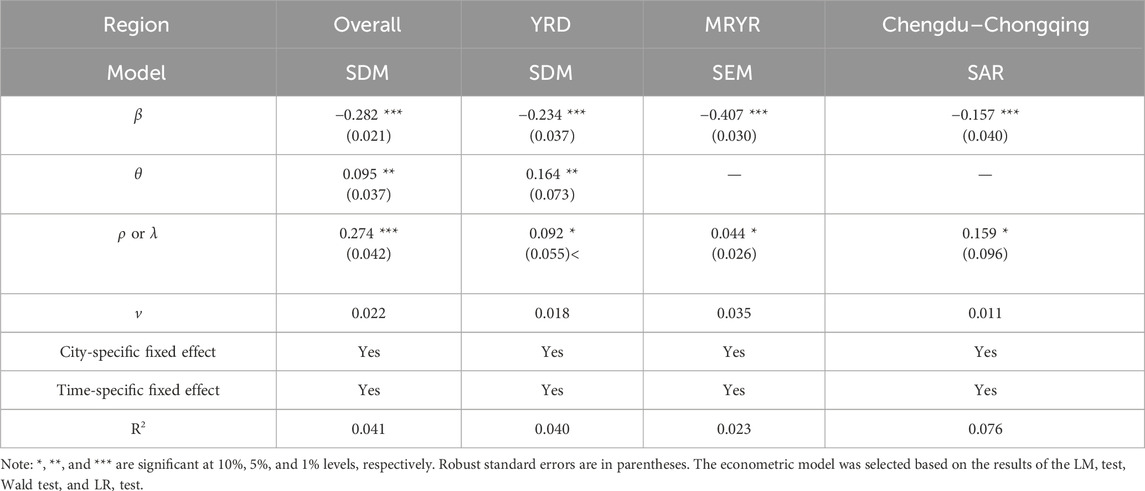
Table 4. Absolute β-convergence results.
Table 5 presents the findings of the conditional β-convergence analysis.
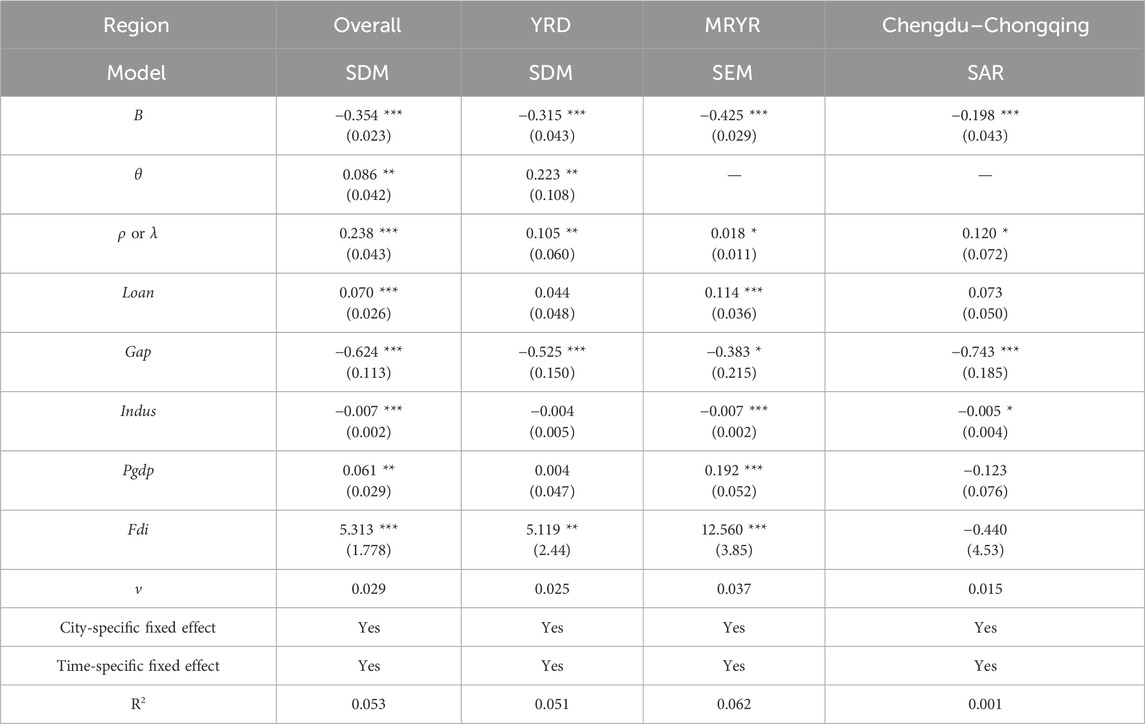
Table 5. Conditional β-convergence results.
Firstly, the conditional β-convergence coefficient is significantly negative at the 1% level for the overall region and the three urban agglomerations, suggesting that LUE converges toward its steady-state level even when accounting for a range of economic and social factors. Specifically, convergence rates were highest in the MRYR, followed by the YRD, with the Chengdu–Chongqing region exhibiting the lowest rate. Second, the conditional β-convergence coefficients were higher than the absolute β-convergence coefficients for the overall region and each urban agglomeration. They increased the speed of convergence by 0.007, 0.007, 0.002, and 0.004, in that order. This indicates a more rapid reduction in LUE differences when controlling for additional factors, affirming the appropriateness of the selected control variables. Lastly, spatial effects varied across the overall sample and each urban agglomeration, yet they aligned with the spatial patterns identified in the absolute β-convergence analysis.
Economic and social factors demonstrated considerable heterogeneity. Generally, an active financial sector, higher per capita GDP, and the adoption of new management methods and low-carbon technologies driven by foreign direct investment markedly promote the convergence of LUE toward superior values. In contrast, an increased fiscal gap and a higher proportion of secondary and tertiary industries are associated with convergence toward inferior efficiency levels. In analyzing specific urban agglomerations, the intensity of foreign direct investment in the YRD fostered the convergence of LUE toward higher values, while a widening fiscal gap led to convergence at lower values. Meanwhile, the effects of financial deepening, industrial structure, and economic development on this convergence were statistically insignificant. All factors under consideration influenced the rate of change in LUE in the MRYR, which was consistent with the overall trend. In Chengdu–Chongqing, a notable fiscal gap and industrial structure configuration had a significant detrimental effect on the rate of change in LUE, but other variables were found to be statistically insignificant.
4 Conclusion and discussion
4.1 Conclusion
Based on the proposed analytical framework and empirical findings, the main conclusions and implications of this study are summarized as follows:
(1) A comprehensive framework was developed to assess land use efficiency (LUE) under carbon neutrality goals. This framework integrates spatial analysis with convergence modeling, offering a practical approach to evaluate urban LUE in the Yangtze River Economic Belt (YREB) in the context of sustainable land management and dual carbon targets.
(2) LUE across the YREB exhibited a U-shaped temporal pattern with significant regional disparities. The Middle Reaches of the Yangtze River (MRYR) showed a steady narrowing of disparities, while Chengdu-Chongqing experienced increasing inequality in the later stages. In contrast, the Yangtze River Delta (YRD) revealed a clear trend of polarization.
(3) Inter-regional differences and transvariation intensity were key drivers of spatial inequality in LUE. The largest gaps existed between the YRD and MRYR, with the MRYR–Chengdu-Chongqing gap being the smallest. Internally, the MRYR showed the most severe imbalance, though it improved over time, while Chengdu-Chongqing remained relatively balanced throughout.
(4) Evidence of convergence was observed among the three urban agglomerations, albeit at different rates. The MRYR demonstrated the fastest convergence in LUE, followed by the YRD and then Chengdu-Chongqing. The heterogeneity in convergence dynamics reflects the influence of regional factors such as financial deepening, fiscal imbalance, industrial restructuring, and foreign direct investment.
(5) Future research should explore the causal mechanisms behind spatial LUE convergence. Investigating the role of specific policy instruments, institutional environments, and technological innovations could offer deeper insights. Moreover, extending the analysis to the county or municipal level could further support differentiated policy-making for carbon-neutral land governance.
4.2 Discussion
4.2.1 Key findings and contributions
This study presents a novel framework for evaluating urban land use efficiency (LUE) under carbon neutrality constraints by incorporating carbon sinks into the carbon accounting system. Unlike many previous studies that focused solely on carbon emissions and reported a “high in the east, low in the west” pattern (Zhang et al., 2022; Zhang et al., 2024), our results reveal a reversal of this trend. By integrating the carbon sequestration capacity of native vegetation into the LUE evaluation, we observed that from 2005 to 2020, the western regions of the Yangtze River Economic Belt (YREB) outperformed the eastern regions in average LUE. This finding highlights the critical role of vegetation carbon sinks in shaping low-carbon land use dynamics—an element often underrepresented in traditional LUE studies.
Our study further contributes to the literature by shifting the analytical scale from national and provincial levels to urban agglomerations, which serve as the primary engines of China’s economic activity and carbon emissions. This focus allows for a more granular understanding of the spatial heterogeneity of LUE within the YREB. We identified that the Yangtze River Delta (YRD) has experienced the most substantial improvement in LUE over the study period, primarily due to intensified environmental governance initiatives such as the national “Action Plans” targeting pollution control between 2013 and 2016. Simultaneously, favorable land supply policies for the central and western regions (Lu et al., 2015; Lu and Wang, 2020) contributed to the LUE improvements observed in the Middle Reaches of the Yangtze River (MRYR) and Chengdu-Chongqing areas.
From a spatial perspective, our results indicate a general decline in regional disparities in LUE, with convergence occurring across the three urban agglomerations. However, by the end of the study period, the YRD exhibited the highest degree of internal polarization, characterized by multipolar differentiation. The persistent gap between the YRD and the other two regions suggests that inter-regional disparities and transvariation intensity remain dominant sources of inefficiency. These findings resonate with prior research indicating spatial imbalances in LUE caused by differences in location, resource endowment, and development stage (Liu et al., 2019; Ge et al., 2021).
More importantly, this study introduces the application of spatial convergence models into LUE analysis—an area that has been underexplored in the current literature. Our convergence analysis reveals that although all three urban agglomerations show signs of LUE convergence, the pace varies significantly. The MRYR exhibits the fastest rate of convergence, followed by the YRD, while Chengdu-Chongqing lags behind. The determinants of these convergence patterns include financial development, fiscal decentralization, industrial structure, economic growth, and foreign direct investment—factors widely acknowledged as critical in shaping land use and carbon emissions trajectories (Barati et al., 2023; Yang et al., 2023).
4.2.2 Research innovations and advancements
Compared to the existing literature, this study advances the field in three main aspects:
(1) Conceptual innovation: We establish a comprehensive carbon accounting-based LUE evaluation framework that balances emissions and sinks. This approach responds directly to recent academic calls for integrating carbon neutrality into sustainable land use metrics (Sha et al., 2022; Searchinger et al., 2018).
(2) Analytical scale refinement: By concentrating on urban agglomerations within the YREB, this research captures the micro-dynamics of spatial inequality that are obscured at broader geographic scales. The urban scale is particularly relevant for policymaking, considering cities are both the primary carbon emitters and the frontlines of low-carbon innovation.
(3) Methodological extension: The incorporation of the Dagum Gini coefficient, kernel density analysis, and spatial convergence models enables a multidimensional examination of spatiotemporal trends and policy implications. This expands the empirical tools available for regional land use-carbon efficiency studies.
4.2.3 Policy implications and future research directions
The empirical findings underscore the importance of regionalized strategies for improving LUE under carbon neutrality goals. To accelerate convergence and promote efficient, low-carbon land use, the MRYR should continue strengthening financial infrastructure and economic vitality. In contrast, the YRD and Chengdu-Chongqing should prioritize reforms in fiscal governance and industrial upgrading. Coordinated land-use planning across municipalities is also essential, as ecosystem service flows and carbon balances often transcend administrative boundaries (González-García et al., 2020).
Nonetheless, several limitations warrant attention. While our study incorporates carbon sinks into LUE assessments, further research should explore the integration of multidimensional objectives such as biodiversity conservation, socioeconomic equity, and green innovation. Future work should also employ dynamic simulation models and causal inference techniques to forecast LUE trajectories under various policy scenarios. Additionally, the impact of climate adaptation policies and international market dynamics on regional land use practices deserves further exploration.
Data availability statement
The raw data supporting the conclusions of this article will be made available by the authors, without undue reservation.
Author contributions
KW: Writing – original draft, Writing – review and editing, Conceptualization, Funding acquisition, Investigation, Project administration, Resources, Supervision, Validation. YW: Writing – review and editing, Conceptualization, Supervision. JZ: Data curation, Writing – review and editing, Formal Analysis, Methodology, Software, Visualization, Writing – original draft.
Funding
The author(s) declare that financial support was received for the research and/or publication of this article. This research was supported by the ZJU-STEC Urban Development and Planning Innovation Joint Research Center Project (Grant No. 513000-I5220A/001).
Conflict of interest
Author KW was employed by China Eco-city Academy Co., Ltd. and Zhejiang University-Shanghai Tunnel Engineering Co., Ltd.
The remaining authors declare that the research was conducted in the absence of any commercial or financial relationships that could be construed as a potential conflict of interest.
Generative AI statement
The author(s) declare that no Generative AI was used in the creation of this manuscript.
Publisher’s note
All claims expressed in this article are solely those of the authors and do not necessarily represent those of their affiliated organizations, or those of the publisher, the editors and the reviewers. Any product that may be evaluated in this article, or claim that may be made by its manufacturer, is not guaranteed or endorsed by the publisher.
Supplementary material
The Supplementary Material for this article can be found online at: https://www.frontiersin.org/articles/10.3389/fenvs.2025.1577863/full#supplementary-material
References
Barati, A. A., Zhoolideh, M., Azadi, H., Lee, J.-H., and Jürgen, S. (2023). Interactions of land-use cover and climate change at global level: how to mitigate the environmental risks and warming effects. Ecol. Indic. 146, 109829. doi:10.1016/j.ecolind.2022.109829
Brooks, L., and Lutz, B. (2016). From today’s city to tomorrow’s city: an empirical investigation of urban land assembly. Am. Econ. J. Econ. Policy 8 (3), 69–105. doi:10.1257/pol.20130399
Burchfield, M., Overman, H. G., Puga, D., and Turner, M. A. (2006). Causes of sprawl: a portrait from space. Q. J. Econ. 121 (2), 587–633. doi:10.1162/qjec.2006.121.2.587
Ceddia, M. G., and Zepharovich, E. (2017). Jevons paradox and the loss of natural habitat in the Argentinean Chaco: the impact of the indigenous communities’ land titling and the Forest Law in the province of Salta. Land use policy 69, 608–617. doi:10.1016/j.landusepol.2017.09.044
Chen, H., Meng, C., and Cao, Q. (2022). Measurement and Influencing factors of low carbon urban land use efficiency—based on non-radial directional distance function. Land 11 (7), 1052. doi:10.3390/land11071052
Chen, J., Gao, M., Cheng, S., Hou, W., Song, M., Liu, X., et al. (2020). County-level CO2 emissions and sequestration in China during 1997–2017. Sci. Data 7 (1), 391. doi:10.1038/s41597-020-00736-3
Chuai, X., Huang, X., Wang, W., Zhao, R., Zhang, M., and Wu, C. (2015). Land use, total carbon emissions change and low carbon land management in Coastal Jiangsu, China. J. Clean. Prod. 103, 77–86. doi:10.1016/j.jclepro.2014.03.046
Dagum, C. (1997). Decomposition and interpretation of Gini and the generalized entropy inequality measures. Statistica 57 (3), 295–308. doi:10.6092/issn.1973-2201/1060
DeFries, R., Ahuja, R., Friedman, J., Gordon, D. R., Hamburg, S. P., Kerr, S., et al. (2022). Land management can contribute to net zero. Science 376 (6598), 1163–1165. doi:10.1126/science.abo0613
Duranton, G., and Puga, D. (2005). From sectoral to functional urban specialisation. J. Urban Econ. 57 (2), 343–370. doi:10.1016/j.jue.2004.12.002
Ge, K., Zou, S., Chen, D., Lu, X., and Ke, S. (2021). Research on the spatial differences and convergence mechanism of urban land use efficiency under the background of regional integration: a case study of the Yangtze River economic zone, China. Land 10 (10), 1100. doi:10.3390/land10101100
González-García, A., Palomo, I., González, J. A., López, C. A., and Montes, C. (2020). Quantifying spatial supply-demand mismatches in ecosystem services provides insights for land-use planning. Land Use Policy94 94, 104493. doi:10.1016/j.landusepol.2020.104493
Gyourko, J., Shen, Y., Wu, J., and Zhang, R. (2022). Land finance in China: analysis and review. China Econ. Rev. 76, 101868. doi:10.1016/j.chieco.2022.101868
Haaland, C., and van den Bosch, C. K. (2015). Challenges and strategies for urban green-space planning in cities undergoing densification: a review. Urban For. and Urban Green. 14 (4), 760–771. doi:10.1016/j.ufug.2015.07.009
Hasan, S. S., Lin, Z., Miah, Md. G., Ahamed, T., and Samie, A. (2020). Impact of land use change on ecosystem services: a review. Environ. Dev. 34, 100527. doi:10.1016/j.envdev.2020.100527
Heiskanen, J., and Coauthors, J. (2021). The integrated carbon observation system in europe. Bull. Am. Meteorological Soc. 103, E855–E872. doi:10.1175/BAMS-D-19-0364.1
Hong, C., Burney, J. A., Pongratz, J., Nabel, J. E., Mueller, N. D., Jackson, R. B., et al. (2021). Global and regional drivers of land-use emissions in 1961–2017. Nature 589 (7843), 554–561. doi:10.1038/s41586-020-03138-y
Huang, S., Xi, F., Chen, Y., Gao, M., Pan, X., and Ren, C. (2021). Land use optimization and simulation of low-carbon-oriented—a case study of Jinhua, China. Land 10 (10), 1020. doi:10.3390/land10101020
Kuang, B., Lu, X., Zhou, M., and Chen, D. (2020). Provincial cultivated land use efficiency in China: empirical analysis based on the SBM-DEA model with carbon emissions considered. Technol. Forecast Soc. Change 151, 119874. doi:10.1016/j.techfore.2019.119874
Ling, X., Gao, Y., and Wu, G. (2023). How does intensive land use affect low-carbon transition in China? New evidence from the spatial econometric analysis. Land 12 (8), 1578. doi:10.3390/land12081578
Liu, C., Wang, X., and Li, H. (2024). County-level land use carbon budget in the Yangtze River Economic belt, China: spatiotemporal differentiation and coordination zoning. Land 13 (2), 215. doi:10.3390/land13020215
Liu, J., Jin, X., Xu, W., Fan, Y., Ren, J., Zhang, X., et al. (2019). Spatial coupling differentiation and development zoning trade-off of land space utilization efficiency in eastern China. Land Use Policy 85, 310–327. doi:10.1016/j.landusepol.2019.03.034
Liu, S., Xiao, W., Li, L., Ye, Y., and Song, X. (2020). Urban land use efficiency and improvement potential in China: a stochastic frontier analysis. Land Use Policy 99, 105046. doi:10.1016/j.landusepol.2020.105046
Liu, S. C., Lin, Y. B., Ye, Y. M., and Xiao, W. (2021). Spatial-temporal characteristics of industrial land use efficiency in provincial China based on a stochastic frontier production function approach. J. Clean. Prod. 295, 126432. doi:10.1016/j.jclepro.2021.126432
Lu, M., Zhang, H., and Liang, W. (2015). How the bias toward central/western land supplies boosts wages in the east. Soc. Sci. China 5, 59–83. Available online at: https://kns.cnki.net/kcms2/article/abstract?v=YUZAqE0WVu503gbjDTnbWW3nHNS3fOpUMYt0n82PHGSpYxs2ZVxAVBTgfkQVn9JFi0xMUgMfLDSacuYj78H__frj93a5tQfuyw6an-OHh9ygxQjXkW-L8uNaElBTy3VXKd04XpMX46BRIgHdMZWLLwkncSeXNURrQ090a1vc83nNnuJ1cfv7RZnFi7ecorZHoC1uJ6xQZio=&uniplatform=NZKPT&language=CHS
Lu, S., and Wang, H. (2020). Distributive politics in China: regional favouritism and expansion of construction land. Urban Stud. 57 (8), 1600–1619. doi:10.1177/0042098019835677
Luo, K., Wang, H., Ma, C., Wu, C., Zheng, X., and Xie, L. (2022). Carbon sinks and carbon emissions balance of land use transition in Xinjiang, China: differences and compensation. Sci. Rep. 12 (1), 22456. doi:10.1038/s41598-022-27095-w
Luo, X., Ao, X., Zhang, Z., Wan, Q., and Liu, X. (2020). Spatiotemporal variations of cultivated land use efficiency in the Yangtze River Economic Belt based on carbon emission constraints. J. Geogr. Sci. 30, 535–552. doi:10.1007/s11442-020-1741-8
Marques, A., Martins, I. S., Kastner, T., Plutzar, C., Theurl, M. C., Eisenmenger, N., et al. (2019). Increasing impacts of land use on biodiversity and carbon sequestration driven by population and economic growth. Nat. Ecol. and Evol. 3 (4), 628–637. doi:10.1038/s41559-019-0824-3
Prisley, S. P., and Hall, E. S. (2024). Calculating a land carbon accounting factor in the United States: an example and implications. J. For. 122 (1), 1–12. doi:10.1093/jofore/fvad037
Qiu, R., and Yu, L. (2024). Solidarity or self-interest? Carbon footprint pressure measurement and spatial correlation in the Yangtze River Delta region. J. Clean. Prod. 441, 140919. doi:10.1016/j.jclepro.2024.140919
Quah, D. T. (1996). Empirics for economic growth and convergence. Eur. Econ. Rev. 40 (6), 1353–1375. doi:10.1016/0014-2921(95)00051-8
Searchinger, T. D., Wirsenius, S., Beringer, T., and Dumas, P. (2018). Assessing the efficiency of changes in land use for mitigating climate change. Nature 564, 249–253. doi:10.1038/s41586-018-0757-z
Sha, Z., Bai, Y., Li, R., Lan, H., Zhang, X., Li, J., et al. (2022). The global carbon sink potential of terrestrial vegetation can Be increased substantially by optimal land management. Commun. Earth and Environ. 3, 8. doi:10.1038/s43247-021-00333-1
Shan, Y., Huang, Q., Guan, D., and Hubacek, K. (2020). China CO2 emission accounts 2016–2017. Sci. Data 7 (1), 54. doi:10.1038/s41597-020-0393-y
Silverman, B. W. (1986). Density estimation for statistics and data analysis. London, UK: Chapman & Hall.
Song, Y., Merlin, L., and Rodriguez, D. (2013). Comparing measures of urban land use mix. Comput. Environ. Urban Syst. 42, 1–13. doi:10.1016/j.compenvurbsys.2013.08.001
Sun, C., Zhang, W., Luo, Y., and Xu, Y. (2019). The improvement and substitution effect of transportation infrastructure on air quality: an empirical evidence from China's rail transit construction. Energy Policy 129, 949–957. doi:10.1016/j.enpol.2019.03.005
Tan, S., Hu, B., Kuang, B., and Zhou, M. (2021). Regional differences and dynamic evolution of urban land green use efficiency within the Yangtze River Delta, China. Land Use Policy 106, 105449. doi:10.1016/j.landusepol.2021.105449
Tone, K., and Tsutsui, M. (2010). An epsilon-based measure of efficiency in DEA–a third pole of technical efficiency. Eur. J. Oper. Res. 207 (3), 1554–1563. doi:10.1016/j.ejor.2010.07.014
Wang, M., Wang, Y., Wu, Y., Yue, X., Wang, M., and Hu, P. (2022). Identifying the spatial heterogeneity in the effects of the construction land scale on carbon emissions: case study of the Yangtze River Economic Belt, China. Environ. Res. 212, 113397. doi:10.1016/j.envres.2022.113397
Wang, Q., and Wang, H. (2022). An integrated approach of logistic-MCE-CA-Markov to predict the land use structure and their micro-spatial characteristics analysis in Wuhan metropolitan area, Central China. Environ. Sci. Pollut. Res. 29, 30030–30053. doi:10.1007/s11356-021-17750-6
Wang, X., Zhang, T., Luo, S., and Abedin, M. Z. (2023). Pathways to improve energy efficiency under carbon emission constraints in iron and steel industry: using EBM, NCA and QCA approaches. J. Environ. Manage. 348, 119206. doi:10.1016/j.jenvman.2023.119206
Wang, Y., Chen, X., Borthwick, A. G., Li, T., Liu, H., Yang, S., et al. (2020). Sustainability of global golden inland waterways. Nat. Commun. 11 (1), 1553. doi:10.1038/s41467-020-15354-1
Wartenberg, A. C., Moanga, D., Potts, M. D., and Butsic, V. (2021). Limited economic-ecological trade-offs in a shifting agricultural landscape: a case study from kern county, California. Front. Sustain. Food Syst. 5, 650727. doi:10.3389/fsufs.2021.650727
Wu, H., Fang, S., Zhang, C., Hu, S., Nan, D., and Yang, Y. (2022). Exploring the impact of urban form on urban land use efficiency under low-carbon emission constraints: a case study in China's Yellow River Basin. J. Environ. Manage. 311, 114866. doi:10.1016/j.jenvman.2022.114866
Xiao, G., Pan, L., and Lai, F. (2025). Application, opportunities, and challenges of digital technologies in the decarbonizing shipping industry: a bibliometric analysis. Front. Mar. Sci. 12, 1523267. doi:10.3389/fmars.2025.1523267
Xiao, P., Xu, J., Yu, Z., Qian, P., Lu, M., and Ma, C. (2022). Spatiotemporal pattern differentiation and influencing factors of cultivated land use efficiency in Hubei Province under carbon emission constraints. Sustainability 14 (12), 7042. doi:10.3390/su14127042
Xie, H., Zhai, Q., Wang, W., Yu, J., Lu, F., and Chen, Q. (2018). Does intensive land use promote a reduction in carbon emissions? Evidence from the Chinese industrial sector. Resour. Conservation Recycl. 137, 167–176. doi:10.1016/j.resconrec.2018.06.009
Xue, D., Yue, L., Ahmad, F., Draz, M. U., Chandio, A. A., Ahmad, M., et al. (2022). Empirical investigation of urban land use efficiency and influencing factors of the Yellow River basin Chinese cities. Land Use Policy 117, 106117. doi:10.1016/j.landusepol.2022.106117
Yang, J., and Huang, X. (2021). 30 m annual land cover and its dynamics in China from 1990 to 2019. Earth Syst. Sci. Data Discuss. 2021, 1–29. doi:10.5194/essd-13-3907-2021
Yang, Q., Pu, L., Jiang, C., Gong, G., Tan, H., Wang, X., et al. (2023). Unveiling the spatial-temporal variation of urban land use efficiency of Yangtze River Economic Belt in China under carbon emission constraints. Front. Environ. Sci. 10, 1096087. doi:10.3389/fenvs.2022.1096087
Yang, S., Fu, W., Hu, S., and Ran, P. (2022). Watershed carbon compensation based on land use change: evidence from the Yangtze River Economic Belt. Habitat Int. 126, 102613. doi:10.1016/j.habitatint.2022.102613
Yang, X., and Liu, X. (2023). Path analysis and mediating effects of influencing factors of land use carbon emissions in Chang-Zhu-Tan urban agglomeration. Technol. Forecast Soc. Change 188, 122268. doi:10.1016/j.techfore.2022.122268
Yu, B., Zhao, Z., Wei, Y. M., Liu, L. C., Zhao, Q., Xu, S., et al. (2023). Approaching national climate targets in China considering the challenge of regional inequality. Nat. Commun. 14 (1), 8342. doi:10.1038/s41467-023-44122-0
Zafar, Z., Zubair, M., Zha, Y., Mehmood, M. S., Rehman, A., Fahd, S., et al. (2024). Predictive modeling of regional carbon storage dynamics in response to land use/land cover changes: an InVEST-based analysis. Ecol. Inf. 82, 102701. doi:10.1016/j.ecoinf.2024.102701
Zhai, D., Zhang, X., Zhuo, J., and Mao, Y. (2024). Driving the evolution of land use patterns: the impact of urban agglomeration construction land in the Yangtze River Delta, China. China Land 13 (9), 1514. doi:10.3390/land13091514
Zhang, C., and Chen, P. (2021). Industrialization, urbanization, and carbon emission efficiency of Yangtze River Economic belt—empirical analysis based on stochastic frontier model. Environ. Sci. Pollut. Res. 28 (47), 66914–66929. doi:10.1007/s11356-021-15309-z
Zhang, L., Huang, L., Xia, J., and Duan, K. (2022). Spatial-temporal evolution and its influencing factors on urban land use efficiency in China’s Yangtze River economic belt. Land 12 (1), 76. doi:10.3390/land12010076
Zhang, N., Sun, F., and Hu, Y. (2024). Carbon emission efficiency of land use in urban agglomerations of Yangtze River Economic Belt, China: based on three-stage SBM-DEA model. Ecol. Indic. 160, 111922. doi:10.1016/j.ecolind.2024.111922
Zhang, W., and Xu, H. (2017). Effects of land urbanization and land finance on carbon emissions: a panel data analysis for Chinese provinces. Land Use Policy 63, 493–500. doi:10.1016/j.landusepol.2017.02.006
Zhang, X., Jie, X., Ning, S., Wang, K., and Li, X. (2022). Coupling and coordinated development of urban land use economic efficiency and green manufacturing systems in the Chengdu-Chongqing Economic Circle. Sustain. Cities Soc. 85, 104012. doi:10.1016/j.scs.2022.104012
Zhao, P., Lu, Z., Kou, J., and Du, J. (2023). Regional differences and convergence of green innovation efficiency in China. J. Environ. Manage. 325, 116618. doi:10.1016/j.jenvman.2022.116618
Zheng, X., Xia, T., Yang, X., Yuan, T., and Hu, Y. (2013). The land Gini coefficient and its application for land use structure analysis in China. PLoS One 8 (10), 76165. doi:10.1371/journal.pone.0076165
Zhou, Y., Chen, M., Tang, Z., and Mei, Z. (2021). Urbanization, land use change, and carbon emissions: quantitative assessments for city-level carbon emissions in Beijing-Tianjin-Hebei region. Sustain. Cities Soc. 66, 102701. doi:10.1016/j.scs.2020.102701
Keywords: land use efficiency, carbon neutrality, carbon sinks, regional differences, spatial convergence
Citation: Wang K, Wang Y and Zhang J (2025) Regional differences and convergence of land use efficiency towards carbon neutrality in China’s Yangtze river economic belt. Front. Environ. Sci. 13:1577863. doi: 10.3389/fenvs.2025.1577863
Received: 16 February 2025; Accepted: 21 May 2025;
Published: 23 June 2025.
Edited by:
Lingli Qing, Guangzhou College of Commerce, ChinaReviewed by:
Yixiong He, Zhejiang Ocean University, ChinaGuangnian Xiao, Shanghai Maritime University, China
Copyright © 2025 Wang, Wang and Zhang. This is an open-access article distributed under the terms of the Creative Commons Attribution License (CC BY). The use, distribution or reproduction in other forums is permitted, provided the original author(s) and the copyright owner(s) are credited and that the original publication in this journal is cited, in accordance with accepted academic practice. No use, distribution or reproduction is permitted which does not comply with these terms.
*Correspondence: Jining Zhang, emhhbmdqbjEyM0B0b25namkuZWR1LmNu