 Qi Chen
 Huaqiang Su
 Weixin Gao1
- 1School of Economics Guangdong Ocean University, Zhanjiang, Guangdong, China
- 2Department of International Trade, Chonnam National University, Gwangju, Republic of Korea
Introduction:: This study investigates the nonlinear dynamics between environmental regulation (ER) and the development speed of New Quality Productive Forces (NQPF) by integrating compliance cost effects and innovation compensation effects into a unified framework.
Introduction:: Using panel data from Chinese A-share listed firms (2012–2022), we apply fixed-effects model and nonlinear mediation analysis (via the SPSS Medcurve program) to quantify the inverted U-shaped ER-NQPF relationship, incorporating robustness checks for endogeneity and heterogeneity across industries, regions, and ownership types.
Results and Discussion:: We identify a robust inverted U-shaped relationship, with moderate ER intensity stimulating productivity gains through innovation incentives, while excessive stringency suppresses growth due to escalating compliance costs. Mechanism analyses reveal that compliance costs mediate this relationship nonlinearly, whereas innovation investment—particularly R&D expenditures—exerts a negative mediating effect, reflecting resource diversion toward short-term compliance over transformative innovation. Heterogeneity tests underscore critical disparities across industries, regions, and firm ownerships, challenging the universality of the Porter Hypothesis in transitional economies. Practically, the findings advocate for spatially and sectorally differentiated environmental policies, emphasizing institutional readiness and localized innovation ecosystems. This study redefines the ER-productivity debate by integrating institutional context and firm-level adaptability, offering actionable insights for sustainable governance in emerging economies.
1 Introduction
Since September 2023, when Xi Jinping, the General Secretary of the Central Committee of the Communist Party of China (CPC), visited Heilongjiang Province and introduced the concept of “new quality productive forces” (NQPF), the term has garnered significant scholarly and public attention. NQPF refers to advanced productive forces characterized by innovation as the primary driver, a departure from traditional economic growth models and productivity development trajectories, which exhibit high-tech, high-efficiency, and high-quality attributes consistent with the new development philosophy (Xinhua News Agency, 2024). As a concrete manifestation of advanced productive forces, NQPF represents a distinct Chinese innovation and practical application of Marxist theory for productive forces. This theoretical framework inherits the essence of Marxist theory by highlighting the decisive role of productive force development in propelling economic progress. Moreover, it enriches the scope and connotation of the Marxist productive force theory, furthering its development by deepening our understanding of productive forces and their inherent developmental laws through a methodological approach that organically integrates qualitative and quantitative dimensions.
Human society has experienced tremendous productivity leaps brought about by the first and subsequent technological revolutions. Based on traditional productivity theories, China has undergone rapid growth for over 3 decades through a development mode characterized by substantial resource investment and high energy consumption. Currently, a new round of scientific and technological revolution and industrial transformation is in full swing, and China has entered an era of intelligence and digitalization. The Chinese economy is confronting issues such as transforming from traditional to high-tech industries, adjusting and upgrading of industrial structures, and facing sustainable development challenges, including resource shortages and environmental pollution. Traditional productivity theories cannot sufficiently address these contemporary challenges and to provide adequate guidance for China’s future economic development. Although traditional productivity theories still hold value and significance, they must to be integrated with new theories to adapt better to China’s current development needs. Against this backdrop, NQPF theory proposed by Xi Jinping provides precise theoretical guidance for the current development of the Chinese economy. The concept of NQPF extends Marx’s classical theory of productive forces (labor, means of labor and objects of labor) to encapsulate the dynamic interplay of innovation, technological upgrading, and institutional adaptation in modern economies. Unlike conventional productivity metrics (e.g., Total Factor Productivity) that prioritize static efficiency, NQPF quantifies the synergistic transition from labor-intensive to technology-driven production systems—a shift exemplified by intelligent machinery adoption (materialized labor) and management-process innovations (soft technology). By constructing a multidimensional index for strategic emerging industries (Song et al., 2024), NQPF provides a granular lens to assess how firms reconcile environmental compliance with productivity transformation, particularly under China’s dual policy goals of green transition and innovation-led growth. This operationalization not only grounds the concept in measurable dimensions but also addresses the critical gap in existing literature: disentangling the nonlinear effects of ERon quality (vs quantity) of productivity growth.
NQPF is grounded in the novel perspective that ecology is a resource and equates to productivity and characterized by its green and low-carbon attributes. This aligns well with the international focus on carbon emissions that has persisted over time. As the country with the largest increase in carbon emissions, and soon to become the largest in cumulative emissions, China faces significant international pressure to reduce its carbon footprint. In response to this challenge, at the 75th Session of the United Nations General Assembly, China committed to reaching peak carbon by 2030 and carbon neutrality by 2060. To achieve these goals, the Chinese government has continuously intensified its ER in recent years. Confronted with escalating environmental constraints, enterprises have adopted various strategies to meet carbon emission standards, such as hiring highly skilled personnel (new quality labor), adopting more advanced production tools (new quality means of labor), and utilizing cleaner raw materials or energy (new quality objects of labor). However, this raises several critical questions that warrant further investigation: Does heightened ER accelerate the development speed of firms’ NQPF? Is the relationship between the two linear or nonlinear? What are the mechanisms underlying the effects of ER on the development speed of NQPF? Does the impact vary across firms and provinces?
This study aims to investigate the nonlinear relationship between ER and NQPF development speed. Employing data from non-financial A-share listed firms in China from 2010 to 2022, this study uses the ratio of completed investment in industrial pollution abatement to the value-added of the secondary industry as a proxy for the stringency of ER at the provincial level. Drawing on extant literature, this study constructs an index system for corporate NQPF and uses the entropy method to quantify each firm’s NQPF level. Based on this, we calculate the development speed of NQPF for each firm. Subsequently, we conduct an in-depth analysis of the causal link between ER and the development speed of NQPF, as well as the underlying transmission mechanisms.
This study contributes to the existing literature in several key ways. (1) It examines the nonlinear relationship between ER and NQPF, offering a novel theoretical perspective on both ER and NQPF. (2) This study prioritizes the development speed of NQPF over static NQPF levels to evaluate the dynamic interplay between ER and sustainable transitions. Our choice for this variable mainly grounded in three critical considerations. First, static NQPF levels reflect cumulative outcomes but obscure the adaptation velocity at which firms respond to regulatory pressures. For instance, firms with identical NQPF levels may exhibit divergent trajectories—one stagnating under compliance costs and another advancing rapidly through green innovation—a distinction SNQPF quantifies by aligning with dynamic capability theory (Teece et al., 1997), which emphasizes resource reconfiguration under external shocks. Second, growth rates provide policymakers with temporally sensitive insights into whether ER drives short-to-medium-term progress toward sustainability goals, revealing incremental improvements or stagnation masked by level-based analyses. Third, SNQPF mitigates baseline heterogeneity by isolating the marginal effect of ER on innovation velocity, reducing confounding from path dependency (e.g., diminishing returns in high-NQPF firms) and selection bias (e.g., overrepresentation of resource-rich firms in level-based metrics). By focusing on development speed, this study captures ER’s role in accelerating or impeding firms’ adaptive capabilities, offering actionable insights for iterative policy design and sustainable transition strategies. (3) This study empirically reveals an inverted U-shaped relationship between ER stringency and NQPF development speed at the firm level. This finding offers a scientific basis for policymakers to devise differentiated environmental policies that can facilitate technological innovation and productivity upgrades while simultaneously protecting the environment. This can help firms achieve a win-win scenario for sustainable development and economic growth.
The remainder of this paper is organized as follows. Section 2 provides a theoretical foundation, reviewing the evolution of productivity theory. Section 3 presents a literature review summarizing relevant prior research. Section 4 details the methodology and outlines the research design, data sources, and models used. Section 5 presents the empirical analysis and results. Section 6 discusses the results. Finally, Section 7 provides conclusions and policy recommendations.
2 Theoretical evolution of productive forces: from classical foundations to New quality dynamics
Since introducing the concept of NQPF, Xi Jinping has repeatedly elaborated on its connotations. He has emphasized that revolutionary technological breakthroughs, innovative allocation of production factors, and deep industrial transformation and upgrading catalyze NQPF. The fundamental essence lies in the significant upgrading of workers, means of labor, and objects of labor, as well as their optimized combinations. A substantial increase in total factor productivity serves as a core indicator. Characterized by innovation, with quality as the key factor, the essence of NQPF is that it represents advanced productive forces. This original concept of NQPF has become a pivotal point of focus in China’s efforts to advance high-quality development, attracting significant attention both domestically and internationally.
Productive forces decisively drive human progress and economic growth, and the study of the development of productive forces and how this relates to societal advancement has been the central focus of economists. The development of productive forces has traversed a historical trajectory from “old” to “new,” from “low-quality” to “high-quality,” and from “traditional” to “modern,” with its constituent elements constantly evolving alongside societal changes. Traditional theories of productive forces can be traced back to the era of Classical Political Economy. During this period, theories of productive forces emphasized the labor theory of value (initially proposed by British economist Petty (1662) and significantly developed by Smith and Strahan (1776); Ricardo (2009)], role of production factors [labor, land, and capital, delineated by Say (1836), and impact of division of labor and specialization (Smith and Strahan, 1776) on productive forces. List (1856) further expanded the concept to encompass “material productive forces” (agriculture, industry and commerce) and “spiritual productive forces” (science, education, culture, and institutions).
During the Neoclassical Economics period, productive forces theory shifted in focus towards measuring economic growth. Several scholars have employed mathematical tools to explore the impact of production factors on economic growth from both macro and micro perspectives, such as the “three engines” of economic growth (consumption, investment, and exports) described by Keynes (1937), Cobb-Douglas production function (Cobb and Douglas, 1928), Harrod-Domar Growth Model (Harrod, 1939; Domar, 1946), and Solow Growth Model (Solow, 1956; Solow, 1957). However, the traditional theory of productive forces centers on the optimal allocation of traditional production factors, such as labor, capital, and land, overlooking the significant contributions of knowledge, technology, and human capital to economic growth. Schultz (1964) asserted that the role of human capital in economic growth might be more crucial than that of physical capital, whereas Romer (1986) argued that knowledge is a production factor that influences economic growth. Building upon Schultz’s theory, Lucas Jr (1988) incorporated human capital into endogenous growth models to explain the intrinsic drivers of economic growth.
A key concept in the Marxist theoretical framework is that of “productive forces,” which refers to the “mode of cooperation” that people create when they produce substances (Xie et al., 2024). Marx identified productivity as the human capacity to transform and utilize nature, characterizing it as a dynamic and revolutionary force that drives societal progress (Marx, 2024). Productivity undergoes continuous development and transformation involving both quantitative shifts and qualitative transformations in collaborative methods (Xie et al., 2024). Marx emphasized that labor productivity advances with continuous scientific and technological progress, but that productivity enhancement depends not only on material and technological progress but also crucially on improvements in labor quality, enhancements in the quality and efficiency of the means of production, and the expansion of the scope of objects of labor (Marx, 2000). From an economic perspective, NQPF represents a qualitative leap in productivity. The transition from traditional productive forces to NQPF fundamentally signifies a qualitative change in the constituent elements of productivity. However, the aim of NQPF development is not to reach a fixed level, but rather to manifest as a dynamic process of continuous optimization and enhancement driven by technological advancements.
NQPF development is not driven by the advancement of a single factor alone but by the synergistic effect of multiple factors. Labor factor, as a fundamental element of productive forces, the requirements for labor experience and skills were relatively low when the level of productivity development was less advanced. However, with technological progress and the development of digitalization, the increasing complexity of the production process places higher requirements on workforce quality. This has driven a transformation in the workforce, from traditional manual and mental labors to innovative creators, creating “new quality labor.” Unlike traditional skilled workers who primarily engaged in simple repetitive tasks, new quality laborers are strategic talent capable of creating new productive forces and applied talents proficient in utilizing new production methods and tools. They have typically attained higher levels of education and stronger learning capabilities, representing the most active and dynamic component of the NQPF (CPPCC News, 2024).
As another crucial component of productive forces, the means of labor are the physical entities or systems (material tools) on which laborers rely during the processing of labor objects. They provide the material means necessary for transforming labor objects, acting as a link between labor and objects of labor. The means of labor assist workers in processing and transforming labor objects more efficiently, and in the process of utilizing these means, laborers continually optimize and innovate them, thereby enhancing their functional capacity and efficiency within the production process. The emergence of new means of labor across historical periods reflects the level of social productivity development at that time, and their innovation and application have directly promoted rapid advancements in productivity. The evolution of labor means has progressed from handmade tools in early societies, to energy conversion tools during the Industrial Revolution (e.g., steam engines, internal combustion engines, and generators), to intelligent tools in the information and big data era of the 21st century. New-quality labor means serve as important NQPF manifestations and carriers. They alter the form and function of labor means, reshape traditional production paradigms, and liberate laborers from repetitive and routine work. The application of intelligent tools enables laborers to operate and control more labor means and act on a broader range of labor objects, thereby achieving a significant leap in productivity and accelerating NQPF formation and development.
Objects of labor are vital components of productive forces and refer to the entities processed, transformed, or serviced during the production process. These can be physical (raw materials, components, and parts) or intangible (data, knowledge, and certain services). With technological advancements and industrial upgrading, the physical objects of labor have transitioned from traditional natural resources to more advanced forms, such as environmentally friendly renewable energy. Furthermore, the development of information technology has facilitated the emergence of data resources as a new object of labor. These new objects of labor provide abundant “raw materials” for NQPF development and drive the evolution of new production technologies. The application of these new labor objects facilitates the optimal allocation of resource elements, significantly enhancing production efficiency.
In summary, new quality laborers, objects of labor, and means of labor are the core elements of NQPF, whose dynamic interplay drives a qualitative leap in productivity. While rooted in Marx’s theory of productive forces—labor and means of production—this framework redefines their roles through technological and organizational modernization. First, labor evolves from traditional manual input to innovative human capital, where skilled workers and R&D talent actively engage in technology-driven value creation. Second, objects of labor transition from passive raw materials to materialized labor (e.g., intelligent machinery and automated systems), embedding value through human-machine collaboration and blurring the boundaries between labor and capital. Finally, means of labor expand beyond Marx’s physical tools to encompass hard and soft technologies—high-precision equipment, intangible assets, and adaptive management practices—that optimize production efficiency and risk control. The synergy among these upgraded dimensions—innovative labor, value-embedded objects, and technology-augmented tools—enables a structural shift from labor-intensive to knowledge-driven production modes, fostering transformative upgrades in both productivity and social production relations. This tripartite linkage positions NQPF as a pivotal engine for high-quality economic development, grounded in the dialectical integration of human, technological, and material forces.
While NQPF provides a cohesive framework to align productivity growth with China’s national development goals (e.g., innovation-driven growth, green transition), its policy-driven origin necessitates cautious interpretation. As a concept embedded in state-led modernization agendas, NQPF’s normative emphasis on technological sovereignty and industrial upgrading may implicitly prioritize certain sectors (e.g., strategic emerging industries) over others. To mitigate potential bias, our empirical analysis focuses on measurable dimensions of NQPF (e.g., materialized labor, hard/soft technology), allowing data-driven validation independent of policy narratives.
While the term “NQPF” was formally proposed in 2023, its theoretical foundations are deeply rooted in the Marxian framework of productive forces, which emphasizes the evolutionary transformation of labor, means of labor, and objects of labor across historical stages. The core elements of NQPF—such as the shift toward intelligent tools (e.g., IoT-enabled production systems), data-driven labor objects (e.g., renewable energy adoption), and high-skilled labor—reflect structural transformations in China’s production systems that have been empirically observable since the early 2010s, particularly during its rapid digitalization and green transition. By retroactively applying the NQPF lens, we systematically quantify these pre-existing but theoretically underexamined shifts, aligning with established practices in economic history where contemporary frameworks reinterpret historical processes (Robinson and Acemoglu, 2012; North, 1991).
3 Environmental regulation and productivity growth: dual mechanisms of compliance costs versus innovation compensation
To bridge the theoretical gap between ER and NQPF framework, this study integrates Marxian productive forces theory with modern innovation dynamics. Rooted in Marx’s theory of productivity forces, NQPF emphasizes the synergistic evolution of workers, tools, and objects of labor through technological and institutional modernization. ER, as an external institutional force, interacts with these core elements by reshaping labor skills, production tools, and resource allocation. For instance, ER pressures accelerate the transition from traditional labor to “new quality labor” by mandating upskilling for green technologies (e.g., operating intelligent pollution control systems), while simultaneously driving firms to adopt advanced means of labor (e.g., IoT-enabled monitoring tools) and sustainable objects of labor (e.g., renewable energy inputs). This alignment with NQPF’s tripartite structure positions ER as both a catalyst for innovation-driven productivity and a constraint via compliance costs, offering a cohesive lens to reconcile the Porter Hypothesis and compliance cost effect within China’s transitional economy.
Against this theoretical backdrop, the relationship between ER and productivity growth has been extensively debated in the literature. Scholars have primarily focused on two contrasting mechanisms—compliance costs versus innovation compensation—with divergent perspectives on linear and nonlinear dynamics.
Currently, the academic literature presents two contrasting viewpoints on this relationship. The first posits a linear relationship between ER and productivity. This perspective suggests that the impact of ER on productivity is linear, meaning that as the ER intensifies, productivity changes exhibit a singular upward or downward trend. Scholars who support a positive linear relationship argue that appropriate ER can incentivize enterprises to engage in technological innovation and production process optimization, thereby enhancing production efficiency and productivity. Porter and Linde (1995) initially proposed the “innovation compensation effect,” known as “Porter Hypothesis” contending that ER, as a form of external pressure, can stimulate firm innovation, thereby prompting the adoption of more environmentally friendly and efficient production methods. This will partially or fully offset compliance costs to ultimately achieve a win-win scenario for both productivity and environmental performance (Zhang, 2021; Rubashkina et al., 2015). Hille and Möbius (2019) and De Santis et al. (2021) analyzed the impact of ER on the productivity growth rate in OCED countries, with both studies finding an indirect and positive effect of environmental policies on productivity growth through fostering innovation (or capital accumulation). Similarly, Feng et al. (2021) found that while stricter environmental policies may increase overall production costs in OECD countries, further strengthening policies in countries already implementing strict regulations appears to enhance their productivity growth rates in the long run. Albrizio et al. (2014) indicated that, at the macroeconomic level, policy changes negatively impact productivity growth in OECD countries in the year preceding the policy change (the “announcement effect”), but this effect is offset within 3 years of policy implementation. At the industry level, tightening environmental policies promotes short-term productivity growth in technologically advanced countries. However, this effect diminishes with increasing distance from the industry’s global productivity frontier and eventually becomes insignificant at greater distances. At the firm level, only the most technologically advanced firms benefited from tightened environmental policies, whereas less-productive firms experience a slowdown in productivity growth.
However, some scholars have argued that ER directly increases a firm’s operating costs, including the purchase of pollution control equipment and the payment of pollutions fees. These costs may crowd out funds otherwise allocated for technological upgrades and productivity growth, leading to a slowdown in productivity growth (Liu et al., 2021). This negative impact may be more significant when regulations are overly stringent or improperly enforced. This phenomenon is referred to as the “compliance cost effect” (Christainsen and Haveman, 1981; Haveman and Christainsen, 1981; List et al., 2003). Benatti et al. (2024) found that tightened environmental policies have a negative impact on productivity growth among heavily polluting firms, with this effect being more significant than that on lightly polluting firms. However, this negative impact is mitigated in large firms, potentially because they have easier access to financing and stronger innovation capabilities.
An alternative perspective posits a nonlinear relationship between ER and productivity growth. Contrary to a linear relationship, a nonlinear relationship suggests that the impact of ER on productivity does not monotonically increase or decrease but displays a more intricate pattern, such as a “U-shaped,” and “inverted U-shaped,” or other nonlinear curves. Some scholars advocate for the existence of a U-shaped relationship between the two, contending that in the initial stages of ER, firms may experience a temporary decline in productivity due to the substantial investment of funds and resources necessary to adapt to new environmental protection requirements. However, with advancements in technological innovation, firms have gradually mastered more efficient environmental technologies and production methods, leading to significant improvements in productivity. Therefore, the relationship between ER and productivity growth exhibits a U-shaped curve, with productivity first decreasing and then increasing. Yang et al. (2023) discovered a significant U-shaped relationship between ER and total factor productivity in listed Chinese firms, with credit allocation playing a significant mediating role.
Conversely, proponents of an inverted U-shaped relationship argue that firms can achieve the greatest productivity improvements under moderately intense ER. This is because moderate regulation stimulates innovation while avoiding excessive resource constraints. However, when ER intensity becomes excessively high, firms may face undue environmental burdens, suppressing technological innovation and productivity improvements (Wang et al., 2019). Beyond the “U-shaped” and “inverted U-shaped” relationships, some scholars have proposed other forms of nonlinear relationships, such as “S-shaped” and “N-shaped” curves. These perspectives all emphasize the complexity and diversity of the relationship between ER and productivity. Shen et al. (2019) found that industry heterogeneity results in different types of ER having varying impacts on productivity across different sectors. In heavily polluting industries, excessively stringent regulations weaken firms’ technological innovation. In moderately polluting industries, a moderate level of ER, coupled with a coordinated approach of command-and-control and market-based instruments, was observed. In lightly polluting industries, a significant N-shaped relationship between market-based ER and productivity is evident.
Existing studies on the relationship between ER and productivity growth reveal significant heterogeneity across countries with different development levels. In developed economies, mature market mechanisms and robust innovation ecosystems facilitate the manifestation of ER’s “innovation compensation effect.” For instance, multi-level studies on OECD countries demonstrate that stricter environmental policies promote short-term productivity growth in technology- and capital-intensive industries (e.g., chemicals, power generation) (Albrizio et al., 2014). Market-based instruments (e.g., carbon pricing) further enhance long-term total factor productivity (TFP) by optimizing resource allocation. However, these positive effects exhibit firm-level heterogeneity: only technologically advanced firms can offset compliance costs through innovation, while less efficient firms face productivity stagnation (Albrizio et al., 2014; Kozluk and Zipperer, 2014). Notably, studies in developed economies often rely on panel data and composite policy indices (e.g., Environmental Policy Stringency Index, EPS), yet their conclusions are constrained by endogenous policy design and cross-country data comparability issues (Kozluk and Zipperer, 2014).
In contrast, developing countries, constrained by institutional deficiencies and technological gaps, exhibit more complex nonlinear dynamics in the ER-productivity relationship. China’s case is particularly illustrative. Early studies using provincial panel data (Zhang et al., 2011) found that stringent ER boosted TFP through forced technological upgrades. However, subsequent empirical analyses reveal threshold-dependent effects. For example, research on Chinese listed firms (Benatti et al., 2024) identifies a U-shaped relationship between ER and TFP: initial compliance costs suppress productivity, while long-term credit reallocation drives innovation compensation. Similarly, a 2021 study on China’s industrial green TFP (GTFP) highlights regional variations in U-shaped inflection points, with eastern regions more likely to surpass thresholds due to FDI-driven technology spillovers (Qiu et al., 2021). Mexico’s food processing industry, under rising environmental standards, outperformed its U.S. counterpart in productivity growth (Alpay et al., 2002), underscoring institutional adaptability as a critical enabler of the Porter Hypothesis. Nevertheless, developing countries face systemic challenges, including data quality inconsistencies and policy enforcement fragmentation (Zhang et al., 2011), while excessive regulation risks triggering unintended “compliance cost dominance,” particularly among SMEs and heavy-polluting industries (Albrizio et al., 2017).
The “innovation-efficiency” transmission mechanism observed in developed economies may weaken in developing contexts due to institutional frictions (e.g., weak intellectual property rights, green financing barriers), transforming the ER-productivity relationship from linear to inverted U-shaped or N-shaped (Albrizio et al., 2014; Albrizio et al., 2017). This divergence underscores the need for context-specific policy frameworks that account for nonlinear thresholds and institutional readiness.
While prior studies have extensively debated the linear and nonlinear impacts of ER on productivity, few explicitly link the dual mechanisms of compliance costs and innovation compensation to the dynamic development of NQPF. Existing literature predominantly examines static productivity levels or generic growth rates, leaving a critical gap in understanding how ER shapes the speed of NQPF advancement—a metric central to sustainable transitions. Crucially, this omission overlooks the interplay between institutional contexts and firm-level adaptive capacities, which may asymmetrically mediate ER’s effects over time.
This study bridges this gap by integrating the compliance cost effect and innovation compensation effect into a unified framework that explains the inverted U-shaped relationship between ER intensity and NQPF development speed. The use of a nonlinear econometric model is justified by two interrelated factors. First, the Porter Hypothesis—which assumes a linear link between ER and productivity via innovation—fails to account for institutional gaps in developing economies like China, where weak green technology markets, intellectual property systems, and financing mechanisms create threshold-dependent effects. Empirical studies (e.g., Rubashkina et al., 2015) reveal an inverted U-shaped relationship: moderate ER fosters incremental innovation, but excessive stringency raises compliance costs that outweigh benefits, particularly for smaller firms. Second, diminishing marginal returns to innovation imply that early regulatory pressures drive cost-effective improvements (Aghion et al., 2016), while higher ER intensity demands disproportionately expensive upgrades, eroding productivity. Together, macro-level institutional constraints and micro-level scale inefficiencies necessitate nonlinear modeling to identify critical ER thresholds and heterogeneous firm responses, addressing gaps in understanding how NQPF evolves dynamically under varying regulatory intensities.
ER’s role in NQPF development is inherently dualistic, reflecting its capacity to simultaneously accelerate and constrain productivity transitions—a tension mirrored in the literature’s competing narratives of compliance costs versus innovation compensation. On one hand, stringent ER forces firms to adopt green technologies (e.g., carbon capture systems) and digital infrastructure, aligning with NQPF’s emphasis on technological sovereignty and industrial upgrading. This “creative destruction” process echoes the Porter Hypothesis’ prediction of innovation-driven transitions (Porter Linde, 1995), yet its realization hinges on institutional readiness. For instance, advanced firms in eastern China—endowed with mature innovation ecosystems akin to OECD economies (Albrizio et al., 2014)—leverage ER-induced innovation to achieve productivity leaps, as observed in their inverted U-shaped NQPF trajectories. On the other hand, compliance costs disproportionately burden SMEs and heavy-polluting industries, exacerbating resource misallocation and delaying systemic upgrades—a phenomenon consistent with Benatti et al.’s (2024) findings on China’s U-shaped TFP patterns. Lagging firms in central regions, constrained by fragmented green financing and institutional voids (Zhang et al., 2011), face technological lock-ins that mirror the “compliance cost dominance” observed in developing contexts (Albrizio et al., 2017). This duality underscores the need for adaptive policies that balance ER’s innovation incentives with targeted support for vulnerable sectors, ensuring that regulatory pressures translate into equitable NQPF advancement rather than reinforcing existing disparities—a gap our empirical analysis seeks to address through nonlinear threshold modeling and heterogeneous subsample tests.
4 Methods
4.1 Sample and data
This study focuses on Chinese A-share listed firms between 2012 and 2022. To ensure the robustness of our results, two specific subsets of firms are excluded: (1) firms experiencing financial or operational distress, such as those under special treatment (ST) or delisting risk warnings (*ST), ensuring the financial health and operational stability of our sample; and (2) firms in the financial sector, focusing instead on non-financial firms to avoid potential interference from the unique characteristics of the financial sector on the research outcomes. To calculate the development speed of NQPF, we first constructed a panel dataset spanning 2011–2022. Since some firms were listed after 2012, the dataset is unbalanced. Based on the NQPF index, we derived the development speed of NQPF. However, the calculation method inherently results in missing values for the first year of each firm’s observation period. Therefore, we removed the first-year data for all firms. Descriptive analysis reveals that the missing value proportion is only 2.44% (below 5%), implying minimal risk of estimation bias due to missing data; thus, no further imputation was performed. Additionally, to mitigate the influence of outliers, we winsorized all continuous variables at the 1st and 99th percentiles. The final sample comprises 4,055 firms with 30,962 observations. We used a flowchart to detail the entire data processing procedure, as shown in Figure 1. Micro-level firm data are primarily sourced from the China Stock Market and Accounting Research Database (CSMAR), whereas macroeconomic data are sourced from the National Bureau of Statistics of China and provincial statistical yearbooks.
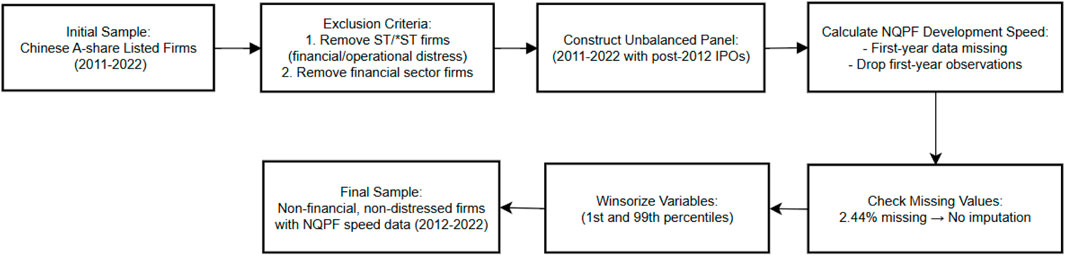
Figure 1. Data Screening process.
4.2 Variable definition and measurement
4.2.1 Explained variable
The explained variable in this study is the development speed of NQPF, measured by its annual growth rate (SNQPF). Grounded in Marx’s two-element theory of productive forces (labor and means of production), we extend this framework to reflect the dynamic synergy of innovation-driven economies. Specifically, labor is decomposed into living labor (human innovation capacity) and materialized labor (value-embedded tools), while means of production are categorized into hard technology (tangible/intangible R&D infrastructure) and soft technology (management efficiency). Following Song et al. (2024), we employ the entropy method to aggregate these dimensions into a composite NQPF index for firm (Supplementary Appendix Table A.1), with SNQPF capturing its growth trajectory. Distinct from conventional productivity metrics like Total Factor Productivity (TFP), which focus on static input-output efficiency, NQPF emphasizes the interplay between technological advancement, human capital upgrading, and institutional innovation—exemplified by metrics such as manufacturing cost ratios that quantify the shift from labor-intensive to machine-driven production modes. Subsequently, based on the calculated NQPF index, the NQPF growth rate is derived using traditional growth rate calculation methods (Equation 1) as follows:
where SNQPFi,t represents the NQPF growth rate of firm i in year t.
4.2.2 Explanatory variables
The explanatory variable is the intensity of ER (ERI), which represents the stringency of ER in each province. The measurement of ER is multifaceted in the existing literature and uses various approaches, including the pollution abatement costs (Kathuria, 2018; Berman and Bui, 2001), pollutant emissions (Cole and Elliott, 2003), pollutant emission reduction (Levinson, 1996), and environmental expenditure (Brunel and Levinson, 2013; Friedman et al., 1992; Albrecht, 1998).
Following the methodologies of Jiang et al. (2025), this study uses the ratio of completed investment in industrial pollution control to the added value of the secondary industry per thousand yuan as a proxy for ER intensity at the provincial level. The formula is expressed as: ERI = (completed investment in industrial pollution treatment/added value of the secondary industry) × 1,000.
4.2.3 Control variables
Drawing on extant literature, this study employs several variables to control for firm-level characteristics, including firm age (Age), which captures a firm’s accumulated experience and potential learning curve (D'Angelo et al., 2013; Xie, 2017); total assets (Asset), which reflects a firm’s overall size and resources (Liu et al., 2022); return on equity (ROE), which indicates a firm’s profitability (Yu et al., 2021),; asset-liability ratio (ALR), which measures a firm’s financial leverage (Wang et al., 2022); and current ratio (CUR), which assesses a firm’s short-term liquidity (Alarussi and Alhaderi, 2018).
This study also controls for macroeconomic conditions at the provincial level using the following variables: per capita gross domestic product (GPC), representing the overall level of economic development; level of industrialization (INDS), measured as the share of secondary industry added value in GDP, indicating the extent of industrial development (Wang et al., 2013); level of technological advancement (TECHE), proxied by local government expenditure on science and technology, reflecting the level of technological innovation (Wang and Kang, 2024); and degree of openness (OPEN), measured by the ratio of total imports and exports to GDP, indicating the extent of integration into the global economy (Rathnayaka Mudiyanselage et al., 2021).
4.2.4 Mediating variables
To examine whether compliance cost and innovation compensation effects mediate the relationship between ER and NQPF development speed, this study introduces compliance cost (COST) and research and development (R&D) investment (RD) as mediating variables. Compliance costs are measured by firms’ total operating costs (Jiang et al., 2025; Liu et al., 2022). Total operating costs capture both direct compliance expenditures (e.g., pollution control) and indirect adjustments (e.g., process redesign) driven by ER. As indirect costs are inseparable from general operations in financial data, total costs holistically reflect ER’s systemic impact on firms. And R&D investment is measured by the amount of R&D expenditure.
4.3 Research model
To investigate the relationship between ERI and SNQPF, the following model is constructed:
where SNQPFit denotes the NQPF growth rate for firm i in year t. ERI is the core explanatory variable representing ER intensity. The other variables are control variables. ɛ denotes the random disturbance term.
5 Empirical analysis
5.1 Basic estimation
5.1.1 Descriptive analysis and correlation analysis
Table 1 presents descriptive statistics that reveal critical distributional characteristics and policy implications of core variables. First, the negative fluctuation (min = −0.47) and positive peak (max = 1.56) of the explained variable SNQPF reflect the uneven development pattern of NQPF. While some firms experienced productivity regression due to failed technological upgrades (e.g., ineffective intelligent equipment adoption) or policy implementation volatility (e.g., environmental production restrictions), a minority achieved leapfrog advancements through green technology breakthroughs or digital transformation. However, the low mean value (0.06) suggests that ER has yet to systematically activate the innovation compensation effect across most firms, implying potential threshold constraints in the “weak regulation-low incentive” linkage. Second, the weak regulatory intensity (ERI mean = 1.66) and substantial heterogeneity (0.05–7.65) highlight spatial and sectoral enforcement disparities in China’s environmental governance. This imbalance may simultaneously drive passive innovation among firms in high-regulation regions (e.g., eastern China) and reinforce path dependence in low-regulation areas (e.g., central-western China).
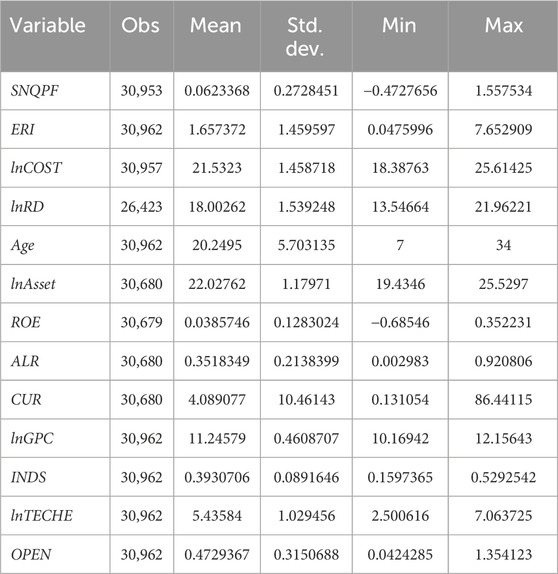
Table 1. Descriptive analysis.
Furthermore, the distribution of mediator lnCOST (mean = 21.53, max = 25.61) underscores the double-edged sword of compliance costs: high-cost firms face survival pressures that suppress innovation, while low-cost firms lack upgrading motivation under lax regulation. Concurrently, the polarized distribution of lnRD (13.55–21.96) reveals structural imbalances in R&D investment, where leading firms establish green technology barriers while lagging firms remain locked in low-end development due to resource constraints.
In summary, these patterns depict a complex landscape of ER-driven productivity upgrading: weak regulation universally constrains innovation motivation, yet heterogeneous regulatory pressures shape asymmetric responses through cost transmission and R&D stratification. These findings provide prior empirical clues for subsequent nonlinear relationship testing and mechanism analysis.
Table 2 presents the results of correlations among the variables. The findings indicate that the correlations between the variables are relatively low. Additionally, the results of the collinearity test show that the variance inflation factor (VIF) values are less than 3.22 for all variables, with a mean of 1.70, suggesting no multicollinearity issues among the variables.
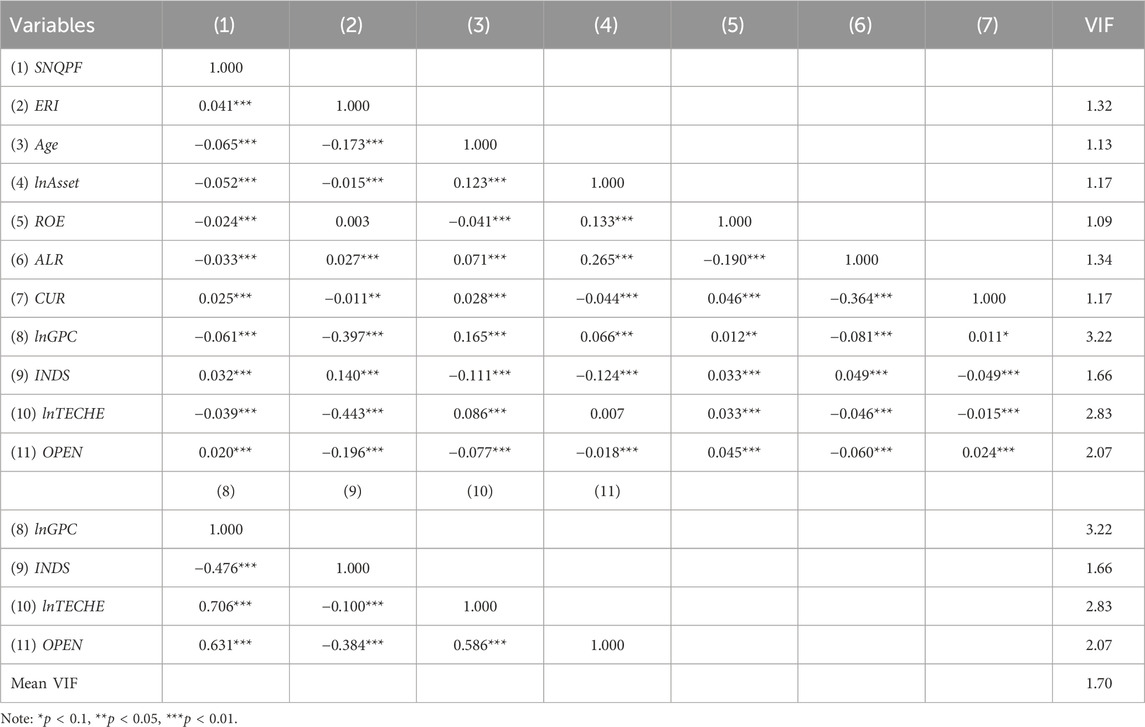
Table 2. Correlation analysis.
5.1.2 Benchmark regression
Before conducting the regression analysis based on the research model (Equation 2) established above, the Hausman test is performed to determine the appropriate model. When the linear term of ERI is included in the model for the Hausman test, the results showed a chi2 value of 145.21 and a p-value of 0.0000, supporting a fixed-effects model. Then, the quadratic term is added to the model, yielding a chi2 value of 127.34 and a p-value of 0.000, which again favors a fixed-effects model. Therefore, this study adopts a fixed-effects model for the subsequent analysis. In the baseline regression, the core explanatory variable ERI, followed by micro- and macro-level control variables, are subsequently added to the model to examine the linear relationship between ERI and SNQPF. The results are presented in columns (1)–(3) of Table 3. In the baseline regression analysis, the impact of ERI on SNQPF exhibits a significant reversal (from positive to negative) after incorporating control variables. We attribute this reversal primarily to the correction of omitted variable bias, which alters the true effect of ERI on SNQPF.
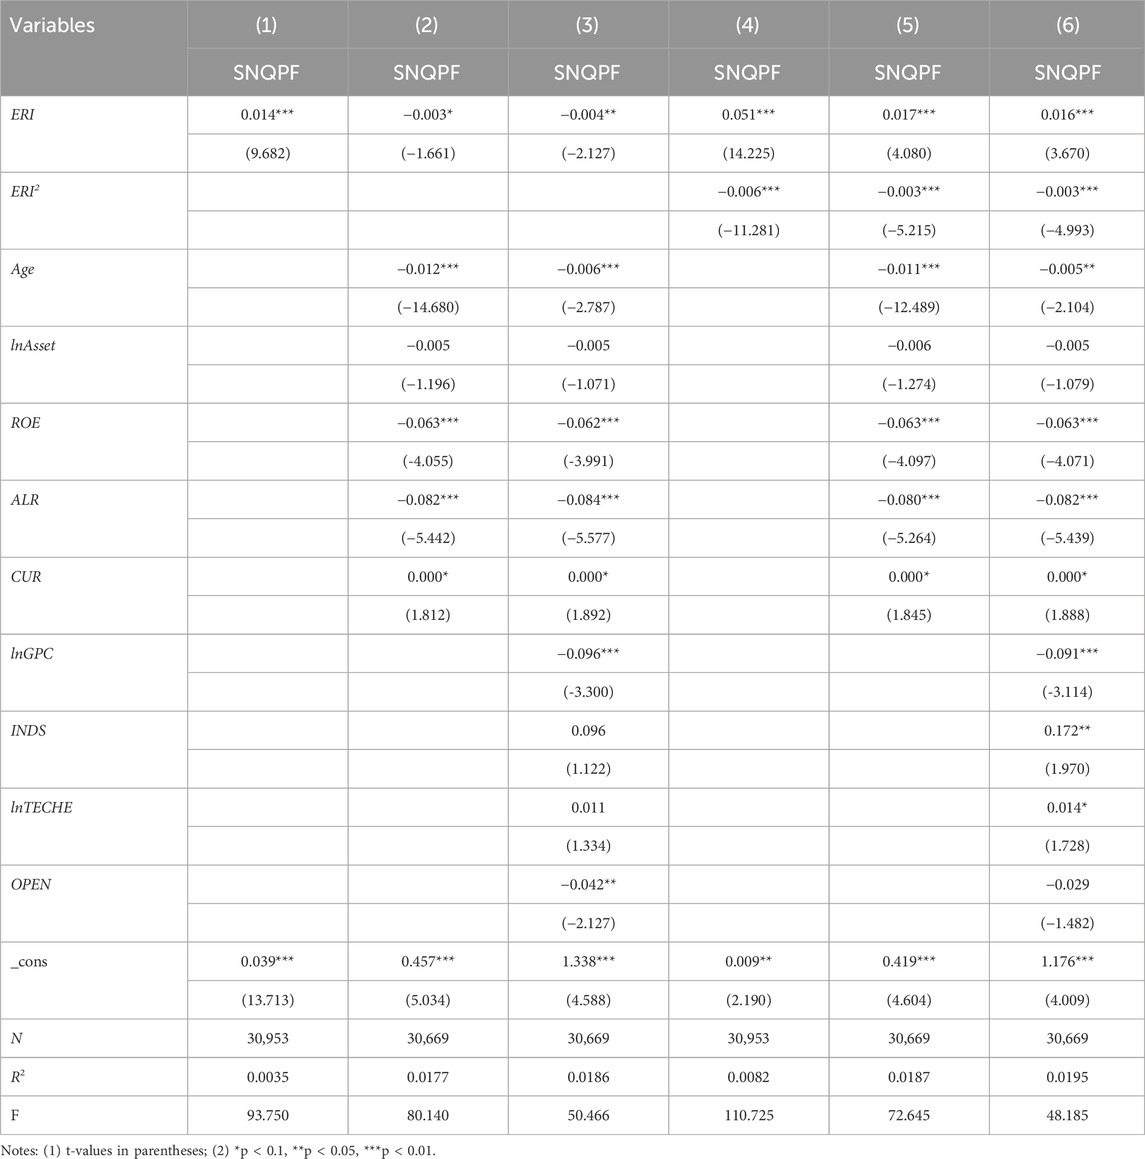
Table 3. Benchmark regression results.
First, the spurious positive association observed in uncontrolled models (Column 1 of Table 3). When enterprise- and provincial-level controls are excluded, ERI demonstrates a significantly positive coefficient, likely attributed to confounding factors between selective regulation and regional economic vitality. Provinces with stringent ER typically exhibit higher economic development (high GPC) and industrialization levels (high INDS). Enterprises in these regions generally possess superior innovation capabilities and resource endowments (e.g., technological reserves, financing channels), creating an illusory positive correlation between ERI and SNQPF through selective regulation bias.
Second, the emergence of net effects after controlling for covariates (Column 3 of Table 3). The ERI coefficient becomes significantly negative upon introducing enterprise characteristics and provincial economic variables, revealing crowding-out effects from compliance costs. ERI suppresses SNQPF dynamics through dual channels: directly increasing operational costs (e.g., pollution control investments) and indirectly displacing innovation resources (e.g., R&D funding, human capital allocation). Moreover, controlling for per capita GDP eliminates the confounding influence of regional heterogeneity, where economically advanced areas benefit from both stricter environmental standards and technology spillover effects. This adjustment exposes the net inhibitory effect of ERI on enterprise productivity.
We next add the quadratic term of ERI to the model and conduct a sequential test. The results presented in columns (4)–(6) of Table 3 indicate that, both before and after the control variables are included, ERI exhibits a significant positive effect on SNQPF, whereas ERI2 demonstrates a significant negative impact on SNQPF. The opposite signs of ERI and ERI2 suggest an inverted U-shaped relationship between ERI and SNQPF. To further validate this relationship, we conduct a U-test. The results presented in Table 4 show that the overall test of presence of an inverse U shape is statistically significant at the 1% level, indicating an inverted U-shaped relationship between ERI and SNQPF. Furthermore, Figure 2 visually confirms this relationship.
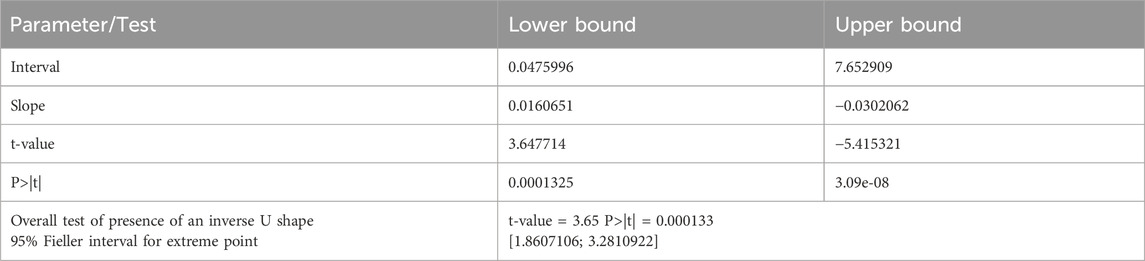
Table 4. U-test results.
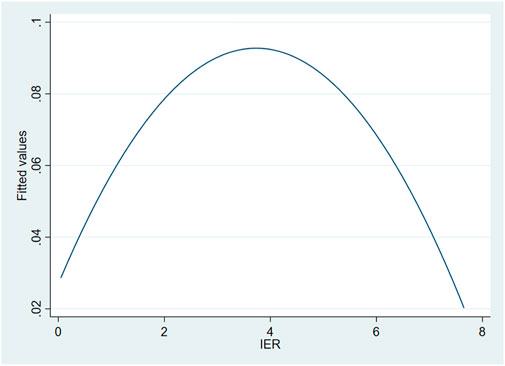
Figure 2. U-test curve.
The above method is commonly used to test for inverted U-shaped relationships. This approach involves first conducting a regression between the core explanatory and explained variables, followed by an ordinary linear regression. The quadratic term of the core explanatory variable is then added to the model for quadratic regression. Based on the significance and signs of the coefficients of the linear and quadratic terms of the core explanatory variable, a U-shaped relationship is subsequently identified. If the signs are the same, a U-shaped relationship exists. If the signs differ, it indicates an inverted U-shaped relationship. Finally, graphical analysis is conducted for supplementary verification. However, this method has certain limitations. Relying solely on the quadratic term of the core explanatory variable to determine the existence of a U-shaped relationship is problematic, because U-shaped relationships can be observed ubiquitously, even when they do not genuinely exist.
To address this issue, this study adopts an improved method proposed by Simonsohn (2018) to confirm the presence of an inverted U-shaped relationship. The fundamental idea of this method is that the explained variable Y initially increases along with core explanatory variable X; however, after reaching a peak, Y decreases as X increases. Based on Simonsohn’s (2018) method, the analysis in this study proceeds as follows. (1) Construct a quadratic regression model of X with Y = aX + bX2, conduct regression analysis, and determine whether the coefficients of the linear and quadratic terms of X are significant and have opposite signs. (2) If step (1) holds, identify the turning point (i.e., the value of X at which the U-shape reaches its peak), denoted as Xmax (calculated as -a/2b). (3) Generate the new variables Xlow, Xhigh, and high, using the following calculation methods:
(4) Establish a new model for breakpoint regression: Y = cXlow + dXhigh + ehigh. If coefficients c and d are significant and have opposite signs, this confirms the existence of an inverted U-shaped relationship between X and Y.
Following the above steps, we first calculate ERImax at the peak of the inverted U-shaped curve, which is 2.6881146. Subsequently, ERIlow and ERIhigh are derived using Equations 3, 4, respectively. Furthermore, the binary variable high is obtained following Equation 5. Finally, these three variables are included along with the control variables in breakpoint regression model. The results in Table 5 indicate that the slope of the ERIlow curve on the left side of the peak is positive, whereas the slope of the ERIhigh curve on the right side is negative, further validating the inverted U-shaped relationship between ERI and SNQPF.
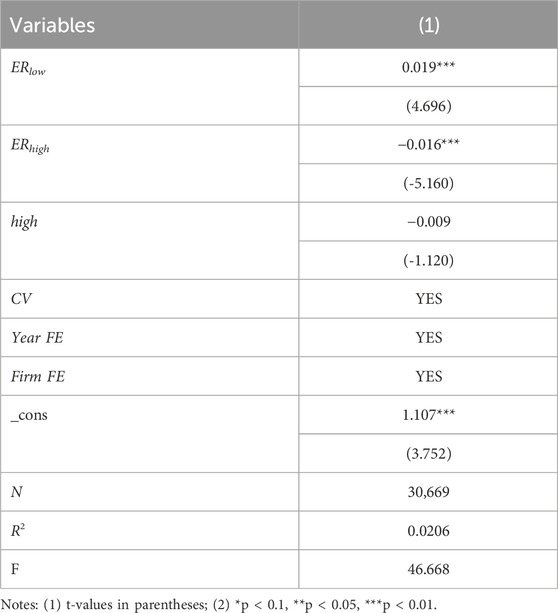
Table 5. Inverted U-shape test.
To further examine the potential existence of other non-linear relationships, we conducted a cubic regression test, the results of which once again supported the inverted U-shaped relationship (for specific analysis and results, see the Supplementary Analysis in the appendix).
5.1.3 Robustness check
To test the robustness of the above results, this study adopts several methods. To examine the lagged effects of ER, we firstly introduced a one-period lag to the core explanatory variable (ERI). As shown in Column 1 of Table 6, the lagged ERI retains a statistically significant inverted U-shaped relationship with SNQPF, confirming the robustness of the baseline regression results and demonstrating the presence of time-lagged regulatory impacts. This finding underscores the persistence of ER’s nonlinear influence on productivity dynamics, even when accounting for temporal delays in policy implementation and firm adaptation.
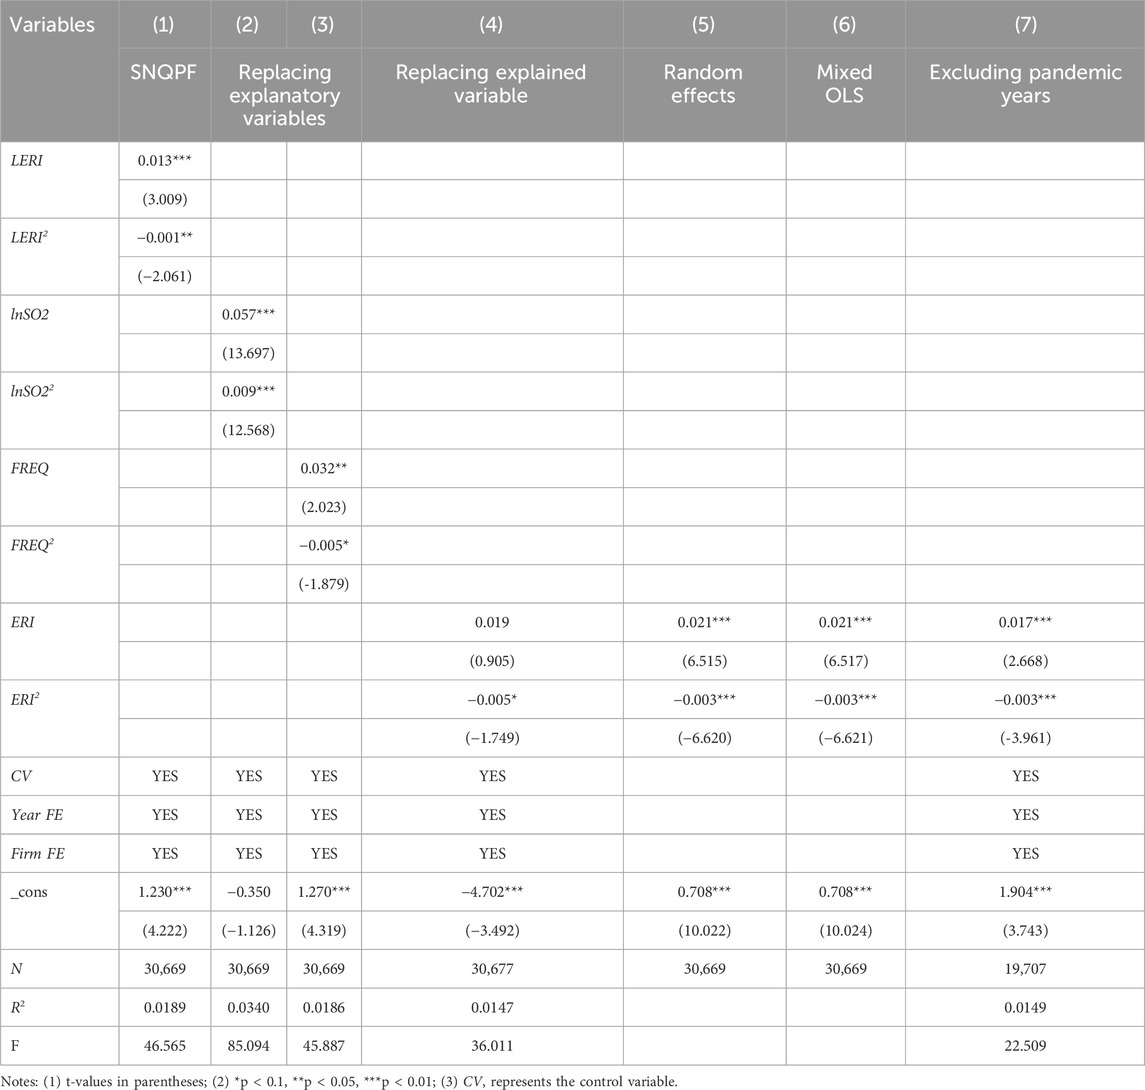
Table 6. Robustness test results.
The second method involves replacing the core explanatory variables. ER can be measured using various methods, and this study uses two alternative variables to verify the baseline results. (1) One common approach is to use sulfur dioxide emissions (lnSO2) as a proxy for ER (Xing and Kolstad, 2002; Cai et al., 2016). Looser ER leads to higher sulfur dioxide emissions, whereas stricter ER results in lower emissions. Therefore, this indicator is inversely related to ER intensity. Columns (2) of Table 6 show that both the linear and quadratic terms of lnSO2 are significantly positive, indicating a U-shaped relationship between lnSO2 and SNQPF. That is, as sulfur dioxide emissions increase, the NQPF development speed first declines and then rises. This indicator is inversely related to ER intensity, indicating that as ER becomes stricter, the NQPF development speed first increases and then declines, verifying an inverted U-shaped relationship. This validates the previously observed inverted U-shaped relationship between ERI and SNQPF.
(2) Another widely used approach is to measure ER levels by calculating the ratio of the frequency of environmental terms in government work reports to the total word count of the reports (Chen et al., 2018). This indicator not only indirectly reflects the government’s attention and efforts towards environmental governance but also helps mitigate endogeneity issues to a certain extent. Therefore, following the method of we use the proportion of environmental term frequency per 1,000 words in government work reports (FREQ) as a substitute for the core explanatory variable. Columns (3) of Table 6 indicate that both the linear and quadratic terms of FREQ are significant but have opposite signs, suggesting an inverted U-shaped relationship between FREQ and SNQPF. These findings further support the baseline results.
To further validate our findings, we employ a third robustness check by substituting the dependent variable SNQPF with the growth rate of green patent applications. The essence of NQPF lies in achieving synergies between production efficiency and sustainable development goals through technological leapfrogging. Green patents, which focus on clean technologies, energy-saving processes, and circular economy practices, directly reflect a firm’s capability to reconfigure production functions via technological breakthroughs. The growth rate of patent applications quantifies the pace of technological iteration, aligning with the “disruptive innovation-driven” characteristic of NQPF. Therefore, this study adopts this metric as a substitute for SNQPF. As shown in column (4) of Table 6, the linear term of the explanatory variable ERI exerts no significantly effect on SNQPF, while the quadratic term exhibits a significantly negative impact. Subsequently, we calculated the vertex and found that its ERI value is 2.526, which lies within the range of ERI values [0.0476, 7.6529]. Although the coefficient of the linear term is not statistically significant, its sign is consistent with theoretical expectations, and the quadratic effect is significant. Therefore, we consider the inverted U-shaped relationship to be valid.
The fourth method we adopted was to change the regression model. We conducted regressions using Random-effects GLS and Mixed OLS respectively. The results in columns (5) and (6) of Table 6 show that the results obtained from the two models are very close to each other and highly consistent with the results of the benchmark regression, further validating the robustness of the results.
The last method excludes abnormal years. Given that the sample period spans from 2011 to 2022, which encompasses the COVID-19 pandemic that began in 2020, this study excludes data from 2020 to 2022 to mitigate the effects of the pandemic. Columns (7) of Table 6 show that, after removing the impact of the pandemic, the inverted U-shaped relationship between ERI and SNQPF holds, indicating the robustness of the above findings.
5.1.4 Endogeneity test
Three methods are used to test for potential endogeneity between the explanatory and explained variables (Table 7). First, PM2.5 (lnHAZE) was selected as an instrumental variable (IV-1). This variable is strongly correlated with ER but plausibly uncorrelated with the development speed of firms’ NQPF, thereby satisfying the requirements of a valid instrument. The validity of PM2.5 as an instrumental variable (IV) for ER is grounded in its exogenous determinants and empirical robustness. Regional PM2.5 levels are primarily driven by natural and historical factors, such as atmospheric dispersion capacity and legacy coal-dependent energy policies (e.g., centralized heating systems in northern China), which are unrelated to contemporary firm behavior or unobserved economic confounders (Chen et al., 2018; Almond et al., 2009). These exogenous drivers create spatial discontinuities in pollution exposure that correlate with local governments’ urgency to implement stringent ER, satisfying the IV relevance condition. While no IV is perfectly exogenous, our design aligns with established methodologies in environmental economics (Greenstone et al., 2012; Jiang et al., 2025) and rigorously addresses potential confounders through geographic and temporal controls, ensuring credible causal inference. Given that this study focuses on firm-level data, a high-dimensional fixed-effects model is utilized, which is better suited to panel data and allows for better control of individual effects. The results in Table 7 indicate that the instrumental variable confirm the inverted U-shaped relationship between ERI and SNQPF. The results of the under-identification tests are significant, thus rejecting the null hypothesis that the instruments are under-identified. Furthermore, the weak identification test results show that the Cragg-Donald Wald F-values are greater than 10, demonstrating that both instrumental variables pass the weak instrument test.
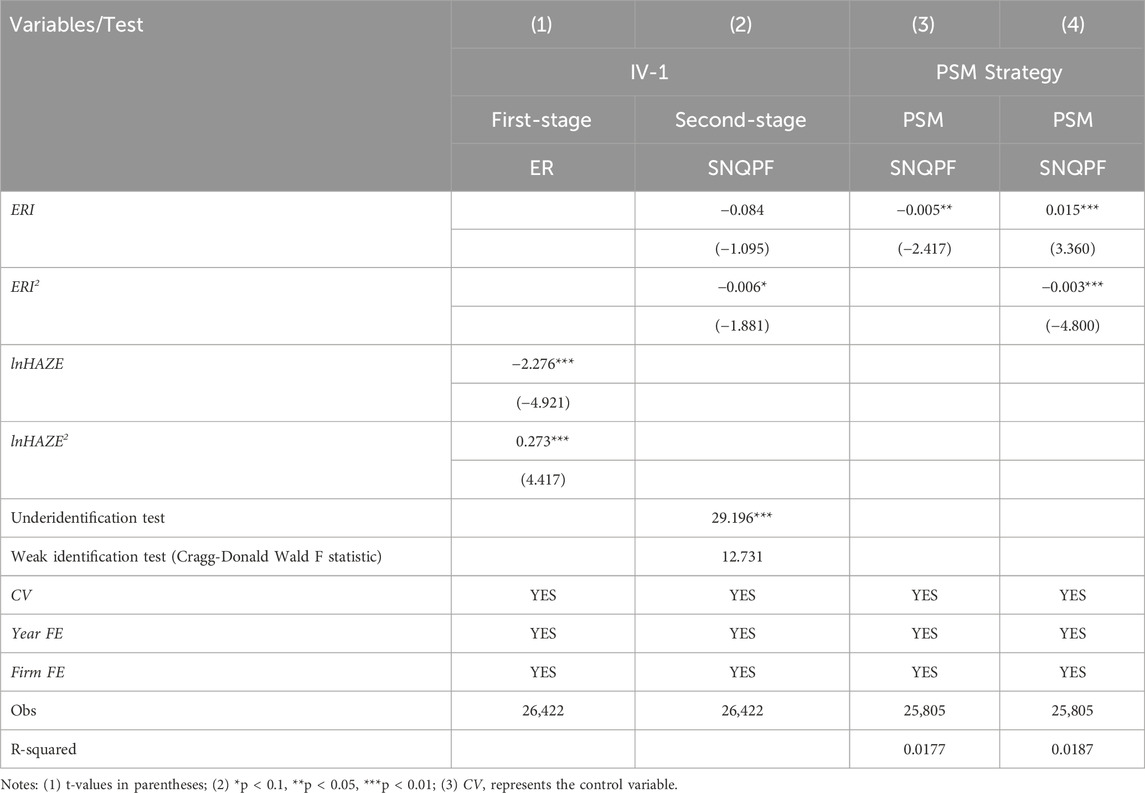
Table 7. Endogeneity test results.
Second, to mitigate selection bias and the influence of confounding factors, this study divided provinces into those with strict ER and those with loose ER based on the average level of ER. Propensity score matching (PSM) is then applied to the sample, and regressions are performed based on the matched data to eliminate the influence of sample selection bias. As illustrated in Figure 3, the distribution of the matched sample is more converges more than that of the unmatched sample. Columns (3) and (4) of Table 7 indicate that the regression analysis using the matched sample data still supports the inverted U-shaped relationship between ERI and SNQPF. Overall, the results from these three methods for addressing potential endogeneity issues consistently indicate an inverted U-shaped relationship between ERI and SNQPF.
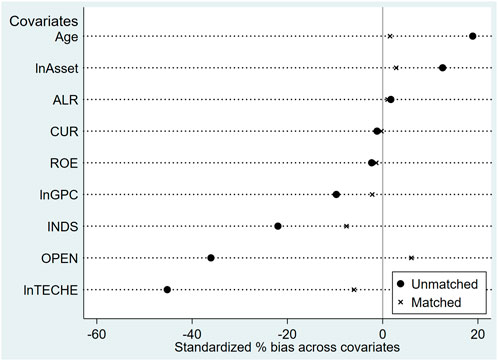
Figure 3. PSM balance test.
5.2 Mechanism test
5.2.1 The mediating effect of compliance cost effect
To examine whether compliance cost and innovation compensation effects mediate the relationship between ER and NQPF development speed, we conduct a mediating effects test using COST and RD as mediators. Unlike the test method for linear mediation effects, the complexities arising from the relationship between the mediating, explanatory, and explained variables necessitate different approaches for testing nonlinear mediation effects. Following Luo and Jiang (2014), three types of nonlinear mediation are considered. First, a nonlinear relationship exists between the explanatory and mediating variables, whereas a linear relationship prevails between the mediating and explained variable, which is termed the “earlier-stage nonlinear mediation effect.” Second, the relationship between the explanatory and mediating variables is linear; however, that between the mediating and explained variables is nonlinear. This is described as “later-stage nonlinear mediation effect.” Third, both relationships—between the explanatory and mediating variable and between the mediating and explained variables—are nonlinear, creating the “two-stage nonlinear mediation effect.” The regression analyses are conducted to verify the relationships between the mediating, explanatory, and explained variables in this study.
To test the instantaneous indirect effect, this study employs the SPSS Medcurve program developed by Hayes and Preacher (2010) to conduct a Bootstrap test (1,000 times). The advantage of the SPSS Medcurve program lies in its ability to effectively test non-linear mediating effects. By identifying the heterogeneous changes in the mediating path under different intensity ranges of the independent variable (such as mean ±1 standard deviation), it reveals the complex dynamic relationships between variables. At the same time, this method intuitively displays the marginal trend of the mediating effect as the level of the independent variable adjusts, providing a quantitative basis for policy threshold identification and differentiated interventions.
The results in Table 8 reveal a nonlinear inverted U-shaped relationship between ERI and the mediating variable lnCost and a nonlinear inverted U-shaped relationship between lnCost and SNQPF. This verifies that the mediator lnCost falls into the third scenario, indicating the “two-stage nonlinear mediation effect.” Then, we tested its mediating effect using the Medcurve program, with the results shown in Table 9.
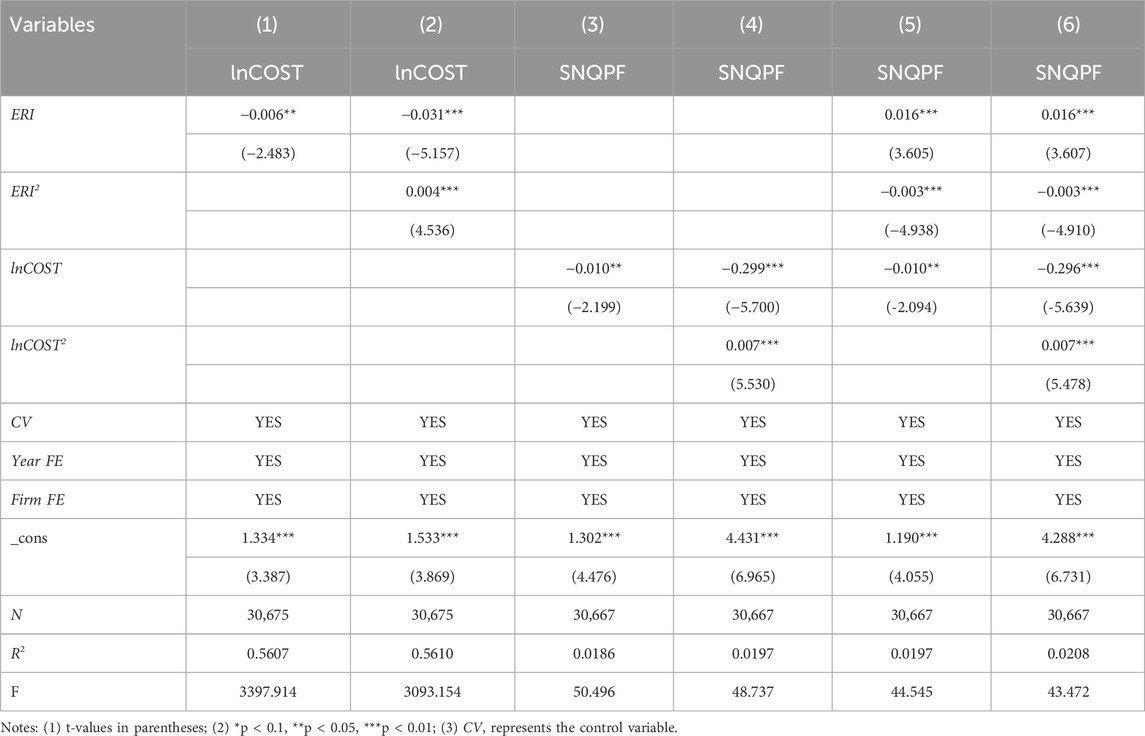
Table 8. Mediation effect Test—lnCost.

Table 9. Bias Corrected Bootstrap Confidence Interval for lnCOST.
The results show that when the explanatory variable ERI is at a low level (ERI = 0.1945) and a medium level (1.6512), the 95% confidence interval does not include zero, indicating that the mediating effect of ERI on SNQPF through lnCOST is significant. However, when ERI is too high, the confidence interval includes zero, indicating that the mediating effect of lnCOST is not significant. The mediating effect values of lnCOST are (−0.0005, −0.0003, −0.0001), indicating that lnCOST exerts a negative mediating effect between ERI and SNQPF. Notably, the operating cost primarily captures firms’ short-term compliance costs, including expenditures on pollution control equipment procurement, environmental retrofitting of production lines, and adoption of end-of-pipe treatment technologies, etc. When ERI is low to moderate, firms must increase short-term spending to meet compliance requirements. These costs directly crowd out resources that could otherwise be allocated to technology R&D, or management optimization, thereby slowing SNQPF.
The insignificance of the mediating effect under high ERI levels primarily stems from the following mechanisms: (1) Firms chronically exposed to stringent regulation may gradually absorb compliance pressures through technological absorption (e.g., optimizing operational efficiency of end-of-pipe equipment) or managerial improvements (e.g., supply chain integration to reduce pollution control costs), thereby mitigating the marginal inhibitory effect of costs on productivity; (2) High-intensity regulation is often accompanied by government support policies (e.g., subsidies for environmental equipment purchases, special funds for pollution control), which partially offset compliance costs. Due to the multiple possible reasons mentioned above (including those not mentioned), the overall effect is not significant.
Given that using operating costs (lnCOST) to measure corporate cost increases induced by ER may be overly broad and that it primarily captures short-term compliance costs, which may directly suppress the development speed of NQPF. To test the robustness of the compliance cost mediation effect, we adopt environmental investment (ENINV) as a proxy for long-term compliance costs. We aggregate expenditures directly related to environmental protection (passive compliance expenditures) from the detailed items under the “construction in progress” category in listed firms’ annual reports, including desulfurization projects, denitrification projects, wastewater treatment, exhaust gas treatment, dust removal, and energy conservation projects, to derive annual environmental investment increments.
The “construction in progress” account typically records fixed asset purchases and constructions that enterprises undertake to meet production or regulatory requirements, rather than R&D expenditures. Facilities such as desulfurization towers and wastewater treatment plants constitute compliance-oriented infrastructure tied to production processes, not carriers of technological innovation. Consequently, these investments represent passive choices to avoid fines or production shutdowns rather than proactive innovation. Moreover, these projects predominantly employ end-of-pipe technologies (e.g., limestone-gypsum desulfurization, activated sludge wastewater treatment), which are mature and aim at meeting standards, lacking significant innovation premiums. Thus, employing ENINV as a proxy for compliance effects is theoretically justified. To control for firm size heterogeneity, environmental investment is standardized by dividing by the firm’s total assets at year-end. Additionally, standardized environmental investment is multiplied by 100 to enhance the interpretability of regression coefficients in subsequent analyses.
The regression analysis results (see Supplementary Appendix Table A.5) indicate that ENINV exhibits significant nonlinear relationships with both ERI and SNQPF. The mediation effect test results (Supplementary Appendix Table A.6) align with those in Table 9. When ERI is low to moderate, the confidence intervals exclude zero, confirming statistically significant mediating effects. However, under high ERI levels, the confidence intervals include zero, rendering the mediating effects insignificant. Unlike the negative mediating effects observed for operating costs (lnCOST), ENINV demonstrates positive mediating effects (except under high ERI levels), suggesting distinct pathways through which ERI influences SNQPF.
When ERI is low to moderate, firms not only incur short-term compliance costs but also increase environmentally related investments as part of long-term strategic development. Although such investments represent passive compliance expenditures, their capitalization attributes (e.g., desulfurization towers, wastewater treatment plants) contribute to production continuity (avoiding shutdowns and penalties) and operational stability (meeting long-term regulatory requirements), thereby exerting a weak yet statistically significant positive effect on productivity. In contrast, under high ERI levels, excessive investments in end-of-pipe treatment facilities lead to capital misallocation (resource waste) and technological lock-in (reliance on low-efficiency technologies), undermining the potential productivity gains from compliance expenditures.
5.2.2 The mediating effect of innovation compensation effect
The same methodology as described above is used to examine the mediating effect of lnRD. The results in Table 10 show that ERI has a significant negative effect on lnRD, whereas the quadratic term of ERI exhibits no significant effect on lnRD, suggesting a linear relationship between the explanatory and mediating variables. Furthermore, the mediator lnRD demonstrates a nonlinear relationship with the explained variable SNQPF. Therefore, this study confirms that the mediator lnRD falls into the second category, indicating the presence of “later-stage nonlinear mediation effect”. Subsequently, we tested its mediating effect using the Medcurve program, with the results presented in Table 11. The results in Table 11 reveal that the mediating effect of lnRD remains consistently −0.0003 across low, moderate, and high ERI, with confidence intervals excluding zero in all cases. This indicates that ERI significantly hinders SNQPF by suppressing R&D investment—a finding that contradicts the traditional “Porter Hypothesis” and underscores the complexity of the regulation-innovation nexus in the Chinese context.
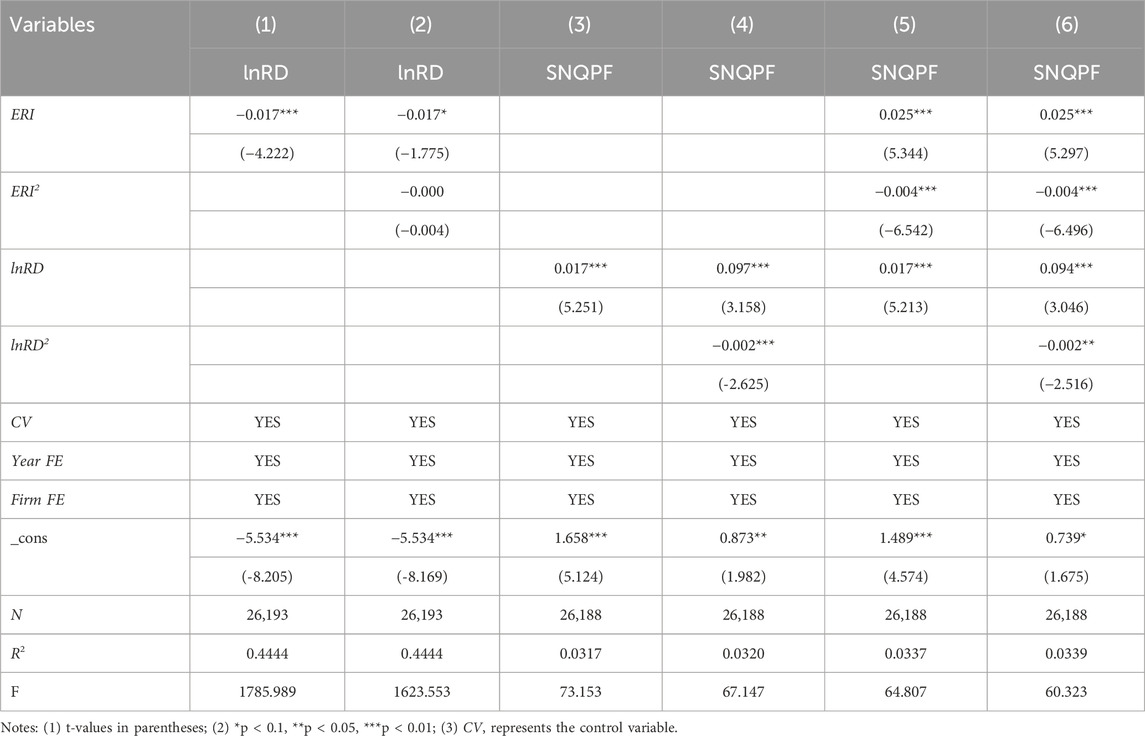
Table 10. Mediation effect Test—lnRD.
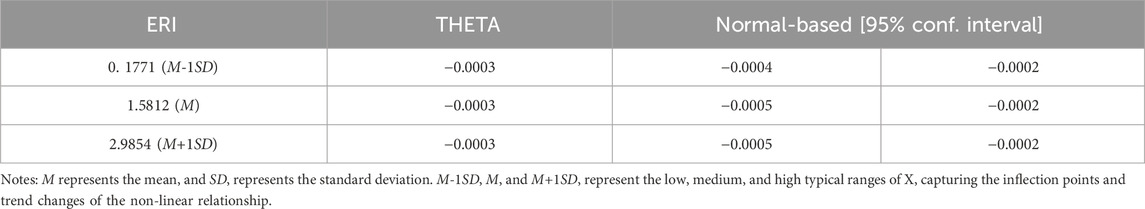
Table 11. Bias corrected bootstrap confidence interval for lnRD.
The negative mediating effect of ERI on SNQPF via R&D investment can be attributed to intertwined mechanisms. First, resource crowding-out effects dominate. ER compels firms to prioritize resource allocation toward pollution control, diverting budgets from breakthrough R&D initiatives. Concurrently, compliance-driven R&D activities (e.g., pollution treatment process improvements) exhibit low technological spillovers, failing to translate into productivity gains and resulting in diminishing marginal returns. Second, R&D direction deviates from core innovation. Firms tend to invest in mature end-of-pipe technologies (e.g., activated carbon adsorption, wet desulfurization) to achieve rapid compliance, rather than pursuing clean production processes or digital upgrades, leading to end-of-pipe technology lock-in. The improper combination of policy instruments and implementation biases further distort innovation trajectories, stifling structural productivity improvements. Finally, temporal dynamics exacerbate contradictions. While R&D investments may yield delayed positive effects on productivity (e.g., over 3–5 years), the current results capture short-term resource diversion during the initial phase of regulatory intensification; long-term technological sedimentation requires validation via dynamic models.
This divergence from the Porter Hypothesis highlights the theory’s contextual limitations. Chinese firms—particularly small and medium-sized enterprises—face resource constraints and rely on single-policy instruments (e.g., command-and-control regulations), which impede their ability to convert regulatory pressures into innovation momentum. Meanwhile, the absence of a mature innovation ecosystem (e.g., green finance, intellectual property protection)—common in developed markets—further weakens the innovation-compensation potential of ER in China.
Given that R&D investment focuses on the input perspective, we next reanalyze the mediating effect of innovation compensation from the output perspective. We employ green patent applications (lnGPAT) as a substitute indicator for R&D investment (lnRD), as it directly reflects enterprises’ substantive innovation achievements in environmental technologies, thereby better circumventing the “black box” issue of input-output efficiency. Moreover, green patents precisely capture clean technology upgrading behaviors compelled by ER, avoiding estimation biases caused by mixed technical domains in traditional patent metrics, which aligns more closely with the theoretical logic of the innovation compensation hypothesis.
The regression analysis results show that ERI has a significant negative impact on lnGPAT (linearly), and lnGPAT has a significant negative impact on SNQPF (linearly). This pattern differs from the three scenarios of nonlinear mediating effects previously discussed. Despite linear relationships in both stages, the ultimate impact of ERI on SNQPF manifests nonlinear characteristics, suggesting that green patent applications do not constitute the core pathway through which ERI influences SNQPF. Their transmission role may be overshadowed or counterbalanced by alternative mechanisms (e.g., compliance costs, management efficiency). The nonlinear ERI-SNQPF relationship might operate through unobserved mediating variables such as organizational management reforms. Consequently, we infer that the mediating effect remains statistically insignificant. This conclusion is corroborated by Medcurve mediation test results: confidence intervals for lnGPAT encompass zero across low-, medium-, and high-intensity ER scenarios, confirming the absence of significant mediation.
This outcome may stem from the “pseudo-innovation” attributes of green patents and the failure of their transformation mechanisms. The lnGPAT indicator exhibits inherent limitations: First, quantity-quality structural decoupling emerges as enterprises strategically file low-tech defensive patents (e.g., end-of-pipe process modifications) to meet compliance requirements. While such technologies enable rapid regulatory compliance, they lack substantive breakthroughs and commercial viability, potentially suppressing production efficiency through increased equipment maintenance costs. Second, systemic delays plague innovation conversion. Green patents typically require 2–5 years from application to industrial deployment, while current policies emphasize application over transformation. Institutional frictions including underdeveloped technology transaction platforms and inefficient patent pledge financing exacerbate patent dormancy, making short-term productivity contributions statistically undetectable. This dual dilemma of “quality deficiency - transformation stagnation” undermines green patents’ capacity to serve as effective carriers for NQPF development, consequently weakening the explanatory power of their mediating pathway.
The significant divergence in mediating effects between innovation input (R&D expenditure) and output (green patents applications) underscores the intricate contradictions between ER and innovation compensation mechanisms, as well as structural deficiencies within China’s technological innovation ecosystem. At the theoretical level, this phenomenon reflects a fractured innovation value chain and the contextual failure of the Porter Hypothesis in China’s institutional setting.
The consistently negative mediating effect of R&D investment (lnRD) reveals a resource lock-in effect at the upstream of the innovation chain. ERI forces firms to reallocate limited resources from breakthrough R&D to compliance-driven retrofitting, directly impairing core innovation capabilities. Concurrently, the insignificant mediating effect of green patents (lnGPAT) exposes an efficiency black hole at the downstream—even when R&D inputs translate into patent outputs, their low technological-economic value and commercialization barriers prevent meaningful productivity gains. The traditional Porter Hypothesis asserts that ER can offset compliance costs through the “innovation compensation effect,” yet this mechanism demonstrates dual failures in the Chinese context. At the input end, the observed linear negative correlation between regulatory intensity and R&D investment substantiates the predominance of the “compliance cost hypothesis,” revealing enterprises’ strategic inadequacy in transforming regulatory pressures into innovation-driven initiatives. Concurrently, the output end manifests systemic inefficiencies: even when green patents emerge as regulatory responses, their inherent low-quality characteristics and institutional conversion barriers nullify potential compensation effects. This dual failure perpetuates an “innovation input trap,” characterized by a self-reinforcing cycle of diminishing R&D investments and stagnating productivity gains, wherein reduced innovation inputs and inefficient technological outputs mutually exacerbate each other, ultimately undermining the theoretical premise of innovation-driven sustainability transition.
These findings highlight structural flaws in China’s innovation governance: policy overemphasis on quantitative patent metrics neglects quality cultivation and market linkages, while command-and-control environmental tools crowd out endogenous innovation incentives. Resolving this requires reengineering the innovation value chain through quality-driven patent regimes, market-oriented green financing, and adaptive regulatory frameworks that balance compliance pressures with innovation spillovers.
5.3 Heterogeneity test
Heterogeneity tests are conducted to further explore the heterogeneous effects of ER on the NQPF development speed, focusing on how factors such as industry characteristics, geographical environment, and ownership structure influence this relationship.
5.3.1 Industry heterogeneity analysis
We conducted heterogeneity tests using two different industry classification methods. First, we divided the industries into heavily polluting industries and non-heavily polluting industries. The results in Table 12 indicate that ERI does not significantly affect SNQPF in heavily polluting manufacturing industries. This may be primarily attributable to three factors. First, high environmental governance costs lead to insufficient innovation incentives. Second, technological barriers significantly limit firms’ ability to improve NQPF through technological innovation in the short term. Third, large firms may leverage their market advantages to pass on environmental governance costs, thereby mitigating the direct impact on the NQPF development speed. Conversely, non-heavily polluting manufacturing industries exhibit an inverted U-shaped growth path under ER. In the initial stage, the compliance costs associated with ER are manageable and can be offset, or even exceeded, by the benefits of simulated innovation and optimized resource allocation, thus fostering NQPF development. However, as ER intensity gradually increases, the associated compliance costs become excessive, crowding out resources for innovation and thus slowing down the pace of NQPF development. When regulatory intensity reaches a certain threshold, the excessive burden of compliance costs begins to inhibit the firms’ innovation validity, thereby negatively affecting the NQPF development speed.
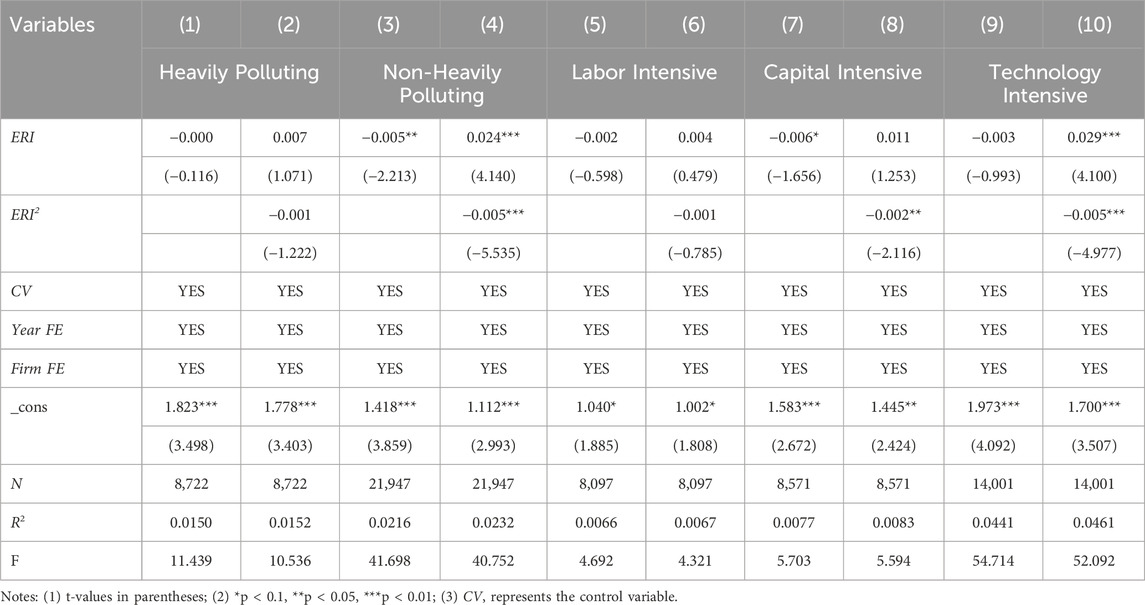
Table 12. Industry heterogeneity test.
For labor-intensive industries, the primary and quadratic terms of ERI demonstrate no significant impact on SNQPF. This result likely stems from the inherent characteristics of labor-intensive industries, which rely heavily on manual labor and exhibit low technological complexity. First, constrained by limited capital reserves and profit margins, these firms prioritize short-term survival over long-term innovation. Environmental compliance costs may further compress their operational flexibility, leaving minimal resources for substantive productivity-enhancing upgrades. Second, labor-intensive firms often adopt passive compliance strategies—such as rudimentary end-of-pipe treatments or temporary production halts—to meet regulatory requirements. These tactics fail to generate meaningful technological spillovers or efficiency gains, rendering ER ineffective in driving NQPF development.
For capital-intensive industries, a significant negative linear effect of ERI on SNQPF emerges in the baseline model, while the quadratic model reveals a significant negative coefficient for the squared term. The calculated vertex (ERI = 2.75) lies within the observed ERI range [0.048, 7.653], confirming an inverted U-shaped relationship. This nonlinearity reflects the dual pressures faced by capital-intensive firms. Initially, moderate ER incentivizes firms to optimize existing capital stock (e.g., retrofitting production lines or adopting energy-efficient equipment), temporarily boosting productivity. However, as ER intensity surpasses the threshold, diminishing marginal returns set in: escalating compliance costs (e.g., pollution control investments and equipment maintenance) crowd out funds for innovation, while rigid capital structures hinder rapid technological adaptation. Consequently, the initial productivity gains are offset by long-term financial burdens, leading to net productivity suppression.
For technology-intensive industries, both the linear term of ERI and its quadratic term significantly affect SNQPF, supporting an inverted U-shaped relationship. This pattern aligns with the innovation compensation hypothesis. At low-to-moderate ER levels, technology-intensive firms leverage their R&D capabilities to convert regulatory pressures into innovation opportunities—developing green patents, clean production processes, and high-value-added products. These innovations enhance resource efficiency and market competitiveness, accelerating NQPF growth. However, beyond a critical ER threshold, the cumulative costs of compliance (e.g., R&D risks, regulatory uncertainty, and certification delays) outweigh innovation benefits. Additionally, excessive ER may divert managerial attention and R&D resources toward compliance rather than breakthrough innovations, resulting in diminishing productivity returns. The inverted U-shaped trajectory thus reflects the interplay between ER-driven innovation incentives and escalating cost constraints in technology-intensive sectors.
5.3.2 Regional heterogeneity analysis
The results in Table 13 indicate that ERI has a significant negative impact on SNQPF in regions with strict ER. Conversely, in regions with lax ER, they demonstrate a significant inverted U-shaped relationship. The divergent outcomes arise from the interplay between regulatory stringency and firms’ adaptive capacities. In strict ER regions, persistently high compliance costs (e.g., pollution control investments, operational disruptions) dominate firm behavior, crowding out resources for innovation and efficiency upgrades, leading to linear productivity suppression. Conversely, in lax ER regions, moderate regulatory pressures initially incentivize low-cost compliance adjustments (e.g., energy-saving retrofits) that marginally boost productivity. However, as ER intensity surpasses firms’ absorptive capacity (e.g., limited technical expertise, financial constraints), incremental compliance costs outweigh productivity gains, resulting in an inverted U-shaped trajectory. This dichotomy underscores how regulatory thresholds interact with regional institutional readiness to shape heterogeneous productivity responses.
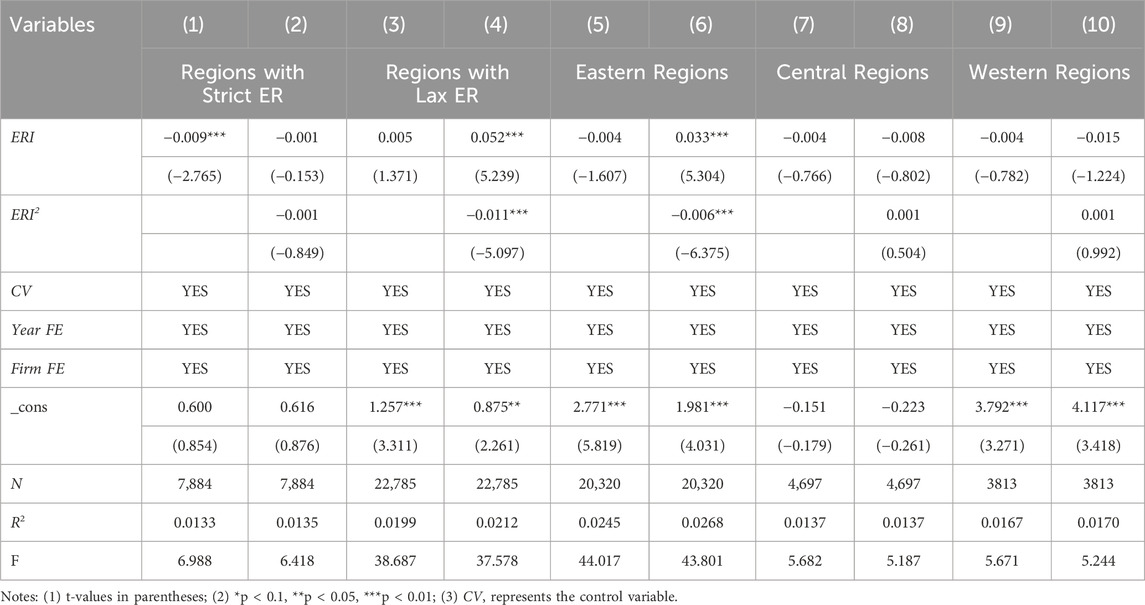
Table 13. Regional heterogeneity test.
From the perspective of regional differences, the results show that ERI has an inverted U-shaped impact on SNQPF in the eastern region, whereas no significant impact is observed in the central and western regions. The divergent regional impacts stem from disparities in economic structure, innovation ecosystems, and regulatory enforcement capacities. The eastern region, characterized by advanced industrialization and robust innovation infrastructures (e.g., mature green finance systems, efficient technology markets), enables firms to initially leverage ER for productivity-enhancing upgrades (e.g., clean technology adoption). However, beyond a critical ER threshold, escalating compliance costs and rigid resource reallocation (e.g., diverting R&D funds to end-of-pipe retrofits) outweigh innovation benefits, triggering productivity declines. In contrast, the central and western regions, constrained by weaker technological absorption capacities, underdeveloped institutional support (e.g., fragmented patent commercialization platforms), and reliance on traditional industries, lack the adaptive flexibility to convert regulatory pressures into innovation-driven productivity gains. Consequently, ER either imposes linear cost burdens without compensatory innovation or fails to induce behavioral changes due to lax enforcement, rendering its net effect statistically insignificant.
5.3.3 Firm ownership heterogeneity analysis
This study conducts heterogeneity analyses on firm ownership by dividing firms into two groups: stated-owned enterprises (SOEs) and non-state-owned enterprises (non-SOEs) and foreign -invested enterprises (FIEs) and non-foreign-invested enterprises (non-FIEs). The results in Table 14 show that SOEs and non-SOEs exhibit similar patterns, with ERI having an inverted U-shaped effect on SNQPF. This stems primarily from both types of firms facing similar policy environments, technological challenges, and changes in the cost structures of the domestic market. In contrast, FIEs exhibit a distinctly different pattern under ER, experiencing a significant negative effect. This may be because FIEs face more complex multinational operating environments, including differences in environmental standards across countries, barriers to technology transfer, and cultural differences. Furthermore, FIEs’ investments in governance costs and technological innovation may be insufficient owing to their unfamiliarity with or weaker adaptability to local environmental policies, which directly inhibits NQPF development speed. Non-FIEs can adapt and respond to domestic environmental policies more quickly because of their deeper integration into the domestic market. The NQPF development speed of these firms shows an inverted U-shaped trend, with initial growth followed by a decline. These findings suggest that non-FIEs have advantages over FIEs in terms of technological innovation capabilities, cost controls and market responsiveness. They can achieve continuous improvements in NQPF under ER, although they also face the challenges of rising costs and technological bottlenecks in later stages.
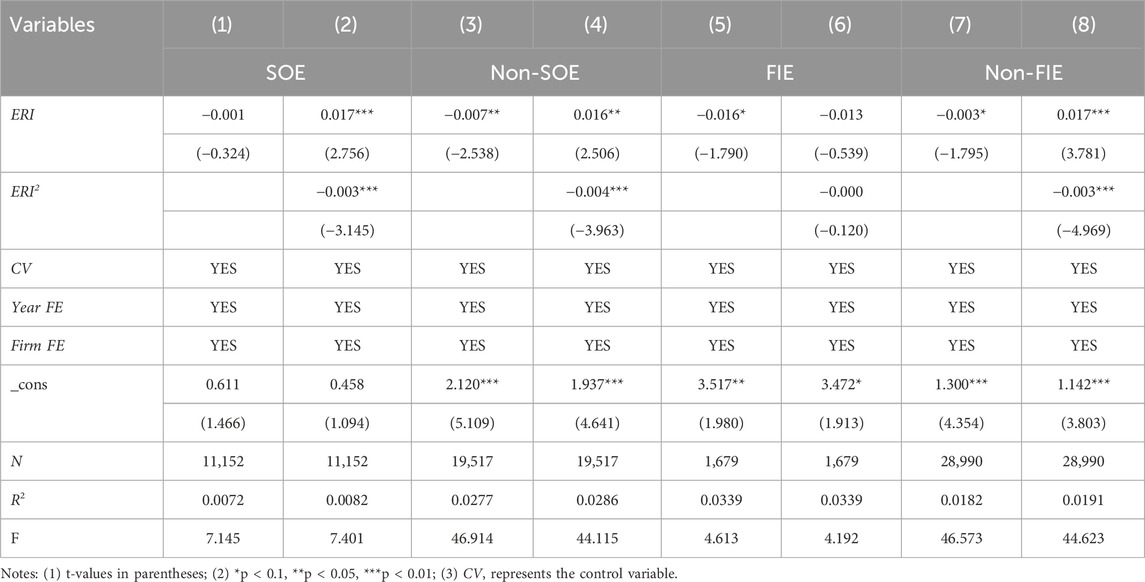
Table 14. Ownership heterogeneity test.
6 Discussion
The empirical findings of this inverted U-shaped relationship between ER and the development speed of NQPF provide a nuanced reconciliation of the conflicting perspectives in prior literature. While earlier studies predominantly debated whether ER linearly promotes productivity through innovation offsets (Porter Linde, 1995) or linearly suppresses it via compliance costs (Christainsen and Haveman, 1981), this study identifies a threshold-dependent duality that aligns with—yet critically extends—the nonlinear frameworks proposed for developing economies (Rubashkina et al., 2015; Aghion et al., 2016). The inflection point (ERI ≈2.69) underscores a pivotal transition: moderate ER incentivizes firms to reallocate resources toward incremental innovations (e.g., energy-efficient retrofits), but excessive stringency triggers diminishing marginal returns as compliance costs eclipse innovation benefits. This nonlinearity diverges from the linear “win-win” outcomes observed in OECD contexts (Albrizio et al., 2014), highlighting how institutional voids in green technology markets and fragmented policy enforcement in China amplify firms’ vulnerability to regulatory overreach. Unlike the Porter Hypothesis, which assumes mature innovation ecosystems, the inverted U-shaped pattern here reflects the precarious balance between regulatory pressure and firms’ adaptive capacity in transitional economies.
The mechanism tests further clarify this divergence. While the compliance cost effect exhibits a significant inverted U-shaped mediating role, innovation investment fails to mediate the ER-NQPF relationship, challenging the core premise of the Porter Hypothesis. This inconsistency suggests that ER-induced R&D in China predominantly funds compliance-driven, low-spillover activities (e.g., end-of-pipe technologies) rather than transformative innovations. Such findings resonate with Benatti et al. (2024), who noted that heavy polluters prioritize survival over innovation under stringent regulations, but contrast sharply with studies in advanced economies where innovation compensates for compliance costs (De Santis et al., 2021). The absence of innovation compensation underscores structural inefficiencies in China’s innovation value chain—such as weak intellectual property protection and underdeveloped green financing—that stifle the translation of R&D inputs into productivity gains. This misalignment between regulatory intent and innovation outcomes reveals a critical gap in applying the Porter Hypothesis to institutional contexts lacking robust market-driven incentives.
Heterogeneity analyses deepen the contextual understanding of ER’s dual effects. The null impact of ER on NQPF in heavily polluting industries aligns with Shen et al. (2019), who attributed such inertia to technological lock-in and high retrofitting costs. However, the inverted U-shaped effect in non-heavy polluters—a novel contribution—signals that moderately regulated industries can leverage ER to catalyze productivity-enhancing reforms, provided they possess sufficient technical and financial flexibility. Regionally, the significant nonlinear relationship in eastern China, contrasted with null effects in central/western regions, mirrors Yang et al. (2023) but emphasizes the role of FDI-driven technology spillovers and advanced institutional readiness in overcoming compliance cost thresholds. Similarly, the underperformance of foreign-invested enterprises (FIEs) under ER echoes Qiu et al. (2021), yet uniquely attributes their struggles to regulatory misalignment with global operational norms and limited access to localized innovation networks—a “liability of foreignness” exacerbated by China’s evolving policy landscape.
These findings collectively challenge the universality of linear ER-productivity frameworks and underscore the centrality of institutional and technological contexts in shaping nonlinear outcomes. While prior cross-country studies (e.g., Kozluk and Zipperer, 2014) emphasized policy design heterogeneity, this study reveals how subnational institutional disparities and firm-level resource asymmetries mediate ER’s efficacy. The inverted U-shaped curve thus serves not merely as a statistical pattern but as a diagnostic tool for policymakers to identify intensity thresholds and tailor interventions to regional and sectoral capacities. Future research could extend this framework by integrating dynamic measures of institutional evolution (e.g., green finance reforms) and firm-level adaptive strategies to unravel the temporal dimensions of ER’s dual effects.
In sum, this study recontextualizes the ER-productivity debate within the realities of developing economies, where institutional imperfections and technological lags transform theoretical linearity into pragmatic nonlinearity. By bridging macro-level regulatory dynamics with micro-level behavioral responses, it offers a roadmap for designing adaptive policies that balance environmental and productivity goals in institutionally fragmented settings.
7 Conclusion and implications
This study examined the nonlinear relationship between ER and the development speed of NQPF using a comprehensive sample of Chinese A-share listed firms from 2012 to 2022. The empirical analysis demonstrates a robust inverted U-shaped relationship between ER and the development speed of NQPF, as evidenced by baseline regressions revealing a critical threshold at ERI ≈2.69, where moderate regulatory pressure initially enhances productivity through innovation incentives but excessive stringency suppresses growth due to escalating compliance costs. Mechanism tests further identify compliance costs as a nonlinear mediator, exhibiting an inverted U-shaped effect that dominates in low-to-moderate ER regimes. While innovation investment exhibits divergent pathways: R&D expenditures demonstrate a persistent negative mediating effect, indicating that ER suppresses NQPF development speed by crowding out resources for transformative innovation, while green patent applications fail to mediate the relationship due to their limited technological spillovers and commercialization barriers. Heterogeneity analyses highlight stark disparities across industries, regions, and ownership structures: ER exerts no significant impact on NQPF development speed in heavily polluting industries but follows an inverted U-shaped trajectory in non-heavy polluters; eastern China exhibits a pronounced nonlinear pattern aligned with institutional readiness, while central/western regions show muted effects; and foreign-invested enterprises face linear productivity declines under ER, contrasting with the inverted U-shaped responses of domestic firms, underscoring the interplay between regulatory adaptability and localized innovation ecosystems.
The study’s theoretical significance lies in its deconstruction of the “innovation compensation” narrative. Contrary to the Porter Hypothesis, which presupposes mature markets capable of converting regulatory pressures into productivity-enhancing innovations, our mediation analyses expose a “compliance-driven innovation trap” prevalent in China’s transitional context. Firms prioritize low-spillover, short-term environmental technologies to meet regulatory requirements, diverting resources from systemic process innovations that drive long-term NQPF growth. This divergence highlights the inadequacy of linear innovation models in explaining the ER-productivity nexus in emerging economies, where institutional voids in green financing, intellectual property protection, and technology markets distort innovation pathways. Such insights necessitate a paradigm shift in environmental economics—one that integrates institutional readiness and firm-level adaptive capacities as core determinants of policy outcomes.
Practically, the findings advocate for a recalibration of China’s environmental governance framework. Policymakers must abandon one-size-fits-all approaches in favor of spatially and sectorally differentiated strategies. In eastern regions with robust innovation infrastructures, ER intensity should be strategically aligned near the identified inflection point to maximize productivity incentives. Conversely, central and western regions require preemptive investments in green technology hubs and data-sharing platforms to build institutional resilience before escalating regulatory demands. For heavy-polluting industries, where ER shows negligible impact due to technological lock-ins, hybrid policies combining phased emission targets with R&D subsidies could disrupt path dependency. Foreign-invested enterprises, disproportionately hindered by regulatory compliance, would benefit from tailored support mechanisms—such as cross-border green technology partnerships—to mitigate “liabilities of foreignness” and align their operations with China’s sustainability goals.
The study’s implications extend beyond national borders, offering a blueprint for emerging economies navigating the sustainability-productivity dilemma. It demonstrates that environmental governance cannot be divorced from institutional context; effective policies must synchronize regulatory ambition with localized technological capacities and market maturity. For global climate agreements, these insights underscore the necessity of flexible, adaptive frameworks that account for heterogenous national conditions rather than imposing uniform standards.
This study acknowledges certain limitations, which offer promising avenues for future research. First, the NQPF metric, though pioneering, warrants refinement to incorporate digital transformation and circular economy indicators, reflecting evolving productivity paradigms. Currently, the measurement of NQPF is still in the initial exploratory stages, and several scholars have proposed various measurement methods based on different theoretical backgrounds. Therefore, although the NQPF measurement method used in this study draws on prior research, its rationality and comprehensiveness require further validation. Future research could explore alternative measurement frameworks for NQPF, perhaps incorporating more dynamic indicators. Furthermore, research should focus on developing a more universally accepted and validated NQPF measurement system that can be applied across different sectors and context.
Second, the mediating variables adopted in this study (i.e., compliance costs and innovation investment) are commonly used in traditional research on the relationship between ER and productivity. However, different transmission mechanisms may underlie the relationship between ER and NQPF. Future research should investigate alternative or more nuanced mediating factors, such as technological learning, green supply chain integration, and resource allocation efficiency, to understand how ER affects NQPF. Furthermore, future study on the dynamic effects of ER on NQPF over time is also warranted, perhaps using quasi-experimental designs to reveal the complex pathways involved.
Third, the current analysis primarily relies on aggregated regulatory indices and macro-level environmental indicators, which, despite offering a comprehensive overview, inherently lack the granularity required to discern the nuanced impacts of individual regulatory instruments. Future studies could advance the field by employing more sophisticated methodologies such as policy text mining techniques, which involve the systematic extraction and analysis of policy documents to identify specific regulatory features, or by leveraging firm-level subsidy disclosures that detail the nature and extent of government support received by individual companies. These approaches would enable researchers to disentangle the distinct roles of various regulatory tools—ranging from emissions standards and tax incentives to green procurement policies—and evaluate their differential effectiveness in promoting environmental sustainability. Such granular analyses not only enhance our understanding of how specific regulatory mechanisms operate but also offer actionable insights for policymakers aiming to design more targeted and efficient environmental policies. By addressing these limitations, future research can contribute to a more refined and evidence-based policy-making process, ultimately fostering greater environmental stewardship across industries and regions.
Data availability statement
The raw data supporting the conclusions of this article will be made available by the authors, without undue reservation.
Author contributions
QC: Conceptualization, Methodology, Writing – original draft. HS: Data curation, Formal Analysis, Writing – original draft. WG: Conceptualization, Supervision, Writing – review and editing. JL: Validation, Writing – review and editing.
Funding
The author(s) declare that financial support was received for the research and/or publication of this article. This work was supported by the Program for Scientific Research Start-Up Funds of Guangdong Ocean University [grant No.60302082102]; 2024 Zhanjiang City Philosophy and Social Science Planning Project [grant No. ZJ24YB24]; and the 2024 Guangdong Province General Colleges and Universities Youth Innovation Talent Program [grant No. 2024WQNCX097]. This work was also supported by Guangdong Provincial Key Research Base for Humanities and Social Sciences in Higher Education Institutions: Marine Economy and Management Research Center, Guangdong Ocean University; Characteristic Key Discipline of Applied Economics, Guangdong Ocean University.
Conflict of interest
The authors declare that the research was conducted in the absence of any commercial or financial relationships that could be construed as a potential conflict of interest.
Generative AI statement
The author(s) declare that Generative AI was used in the creation of this manuscript. Language Editing: To enhance readability and grammatical accuracy, AI-assisted tools were employed for proofreading and sentence restructuring. Partial Analysis: AI was utilized to assist in preliminary data organization and visualization, though all final interpretations and conclusions were rigorously reviewed and validated by the authors. The authors confirm that all AI-generated content was critically evaluated for accuracy, relevance, and adherence to academic integrity. The intellectual contributions, analytical rigor, and final content remain solely the responsibility of the authors.
Publisher’s note
All claims expressed in this article are solely those of the authors and do not necessarily represent those of their affiliated organizations, or those of the publisher, the editors and the reviewers. Any product that may be evaluated in this article, or claim that may be made by its manufacturer, is not guaranteed or endorsed by the publisher.
Supplementary material
The Supplementary Material for this article can be found online at: https://www.frontiersin.org/articles/10.3389/fenvs.2025.1582399/full#supplementary-material
References
Aghion, P., Dechezleprêtre, A., Hemous, D., Martin, R., and Van Reenen, J. (2016). Carbon taxes, path dependency, and directed technical change: Evidence from the auto industry. J. Polit. Econ. 124 (1), 1–51. doi:10.1086/684581
Alarussi, A. S., and Alhaderi, S. M. (2018). Factors affecting profitability in Malaysia. J. Econ. Stud. 45 (3), 442–458. doi:10.1108/JES-05-2017-0124
Albrecht, J. (1998). Environmental policy and the inward investment position of US “dirty” industries. Interecon 33 (4), 186–194. doi:10.1007/BF02929512
Albrizio, S., Koźluk, T., and Zipperer, V. (2014). Empirical evidence on the effects of environmental policy stringency on productivity growth OECD Economics Department Working Papers. 1179. doi:10.1787/5jxrjnb36b40-en
Albrizio, S., Kozluk, T., and Zipperer, V. (2017). Environmental policies and productivity growth: evidence across industries and firms. J. Environ. Econ. Manag. 81, 209–226. doi:10.1016/j.jeem.2016.06.002
Almond, D., Chen, Y., Greenstone, M., and Li, H. (2009). Winter heating or clean air? Unintended impacts of China’s Huai river policy. Am. Econ. Rev. 99 (2), 184–190. doi:10.1257/aer.99.2.184
Alpay, E., Kerkvliet, J., and Buccola, S. (2002). Productivity growth and environmental regulation in Mexican and US food manufacturing. Am. J. Agric. Econ. 84 (4), 887–901. doi:10.1111/1467-8276.00041
Benatti, N., Groiss, M., Kelly, P., and Lopez-Garcia, P. (2024). Environmental regulation and productivity growth in the euro area: testing the porter hypothesis. J. Environ. Econ. Manag. 126, 102995. doi:10.1016/j.jeem.2024.102995
Berman, E., and Bui, L. T. (2001). Environmental regulation and productivity: evidence from oil refineries. Rev. Econ. Stat. 83 (3), 498–510. doi:10.1162/00346530152480144
Brunel, C., and Levinson, A. (2013). “Measuring environmental regulatory stringency,” in OECD trade and environment working papers. Paris: OECD Publishing. doi:10.1787/5k41t69f6f6d-en
Cai, X., Lu, Y., Wu, M., and Yu, L. (2016). Does environmental regulation drive away inbound foreign direct investment? Evidence from a quasi-natural experiment in China. J. Dev. Econ. 123, 73–85. doi:10.1016/j.jdeveco.2016.08.003
Chen, Z., Kahn, M. E., Liu, Y., and Wang, Z. (2018). The consequences of spatially differentiated water pollution regulation in China. J. Environ. Econ. Manag. 88, 468–485. doi:10.1016/j.jeem.2018.01.010
Christainsen, G. B., and Haveman, R. H. (1981). The contribution of environmental regulations to the slowdown in productivity growth. J. Environ. Econ. Manag. 8 (4), 381–390. doi:10.1016/0095-0696(81)90048-6
Cobb, C. W., and Douglas, P. H. (1928). A theory of production. Am. Econ. Rev. 18 (1), 139–165. Available online at: https://www.jstor.org/stable/1811556
Cole, M. A., and Elliott, R. J. (2003). Do environmental regulations influence trade patterns? Testing old and new trade theories. World. Econ. 26 (8), 1163–1186. doi:10.1111/1467-9701.00567
CPPCC News (2024). Study and implement Xi jinping thought on socialism with Chinese characteristics for a new era | build a new type of workforce, promote the development of new quality productive forces. Available online at: http://www.cppcc.gov.cn/zxww/2024/03/25/ARTI1711336620975622.shtml (Accessed December 20, 2024).
D'Angelo, A., Majocchi, A., Zucchella, A., and Buck, T. (2013). Geographical pathways for SME internationalization: insights from an Italian sample. Int. Mark. Rev. 30 (2), 80–105. doi:10.1108/02651331311314538
De Santis, R., Esposito, P., and Lasinio, C. J. (2021). Environmental regulation and productivity growth: main policy challenges. Int. Econ. 165, 264–277. doi:10.1016/j.inteco.2021.01.002
Domar, E. D. (1946). Capital expansion, rate of growth, and employment. Econ. J. Econ. Soc. 14, 137–147. doi:10.2307/1905364
Feng, G., McLaren, K. R., Yang, O., Zhang, X., and Zhao, X. (2021). The impact of environmental policy stringency on industrial productivity growth: a semi-parametric study of OECD countries. Energy. Econ. 100, 105320. doi:10.1016/j.eneco.2021.105320
Friedman, J., Gerlowski, D. A., and Silberman, J. (1992). What attracts foreign multinational corporations? Evidence from branch plant location in the United States. J. Reg. Sci. 32 (4), 403–418. doi:10.1111/j.1467-9787.1992.tb00197.x
Greenstone, M., List, J. A., and Syverson, C. (2012). The effects of environmental regulation on the competitiveness of US manufacturing (No. w18392). Cambridge, MA: National Bureau of Economic Research. doi:10.3386/w18392
Haveman, R. H., and Christainsen, G. B. (1981). Environmental regulations and productivity growth. Nat. Resour. J. 21 (3), 489–509. Available online at: https://digitalrepository.unm.edu/nrj/vol21/iss3/5
Hayes, A. F., and Preacher, K. J. (2010). Quantifying and testing indirect effects in simple mediation models when the constituent paths are nonlinear. Multivar. Behav. Res. 45 (4), 627–660. doi:10.1080/00273171.2010.498290
Hille, E., and Möbius, P. (2019). Environmental policy, innovation, and productivity growth: controlling the effects of regulation and endogeneity. Environ. Resour. Econ. 73, 1315–1355. doi:10.1007/s10640-018-0300-6
Jiang, C., Chen, Q., and Su, H. (2025). Impact of environmental regulation on foreign direct investment of Chinese manufacturing firms: based on the dual perspectives of home and host countries. J. Clean. Prod. 490, 144600. doi:10.1016/j.jclepro.2024.144600
Kathuria, V. (2018). Does environmental governance matter for foreign direct investment? Testing the pollution haven hypothesis for Indian States. Asian. Dev. Rev. 35 (1), 81–107. doi:10.1162/adev_a_00106
Keynes, J. M. (1937). The general theory of employment. Q. J. Econ. 51 (2), 209–223. doi:10.2307/1882087
Kozluk, T., and Zipperer, V. (2014). Environmental policies and productivity growth-a critical review of empirical findings. OECD J. Econ. Stud. (1), 155. doi:10.1787/eco_studies-2014-5jz2drqml75j
Levinson, A. (1996). Environmental regulations and manufacturers’ location choices: evidence from the Census of Manufactures. J. Public. Econ. 62 (1-2), 5–29. doi:10.1016/0047-2727(96)01572-1
List, J. A., Millimet, D. L., Fredriksson, P. G., and McHone, W. W. (2003). Effects of environmental regulations on manufacturing plant births: evidence from a propensity score matching estimator. Rev. Econ. Stat. 85 (4), 944–952. doi:10.1162/003465303772815844
Liu, M., Tan, R., and Zhang, B. (2021). The costs of “blue sky”: environmental regulation, technology upgrading, and labor demand in China. J. Dev. Econ. 150, 102610. doi:10.1016/j.jdeveco.2020.102610
Liu, W., Zhao, Z., Wen, Z., and Cheng, S. (2022). Environmental regulation and OFDI: evidence from Chinese listed firms. Econ. Anal. Policy 75, 191–208. doi:10.1016/j.eap.2022.04.013
Lucas Jr, R. E. (1988). On the mechanics of economic development. J. Monet. Econ. 22 (1), 3–42. doi:10.1016/0304-3932(88)90168-7
Luo, S., and Jiang, Y. (2014). Management survey research methodology. Chongqing: Chongqing University Press.
Porter, M. E., and Linde, C. v. d. (1995). Toward a new conception of the environment-competitiveness relationship. J. Econ. Perspect. 9 (4), 97–118. doi:10.1257/jep.9.4.97
Qiu, S., Wang, Z., and Geng, S. (2021). How do environmental regulation and foreign investment behavior affect green productivity growth in the industrial sector? An empirical test based on Chinese provincial panel data. J. Environ. Manag. 287, 112282. doi:10.1016/j.jenvman.2021.112282
Rathnayaka Mudiyanselage, M. M., Epuran, G., and Tescaşiu, B. (2021). Causal links between trade openness and foreign direct investment in Romania. Manag 14 (3), 90. doi:10.3390/jrfm14030090
Ricardo, D. (2009). On the principles of political economy and taxation. Kessinger Publishing, 1821.
Robinson, J. A., and Acemoglu, D. (2012). Why nations fail: the origins of power, prosperity and poverty. London: Profile, 45–47.
Romer, P. M. (1986). Increasing returns and long-run growth. J. Polit. Econ. 94 (5), 1002–1037. doi:10.1086/261420
Rubashkina, Y., Galeotti, M., and Verdolini, E. (2015). Environmental regulation and competitiveness: empirical evidence on the Porter Hypothesis from European manufacturing sectors. Energy. Policy. 83, 288–300. doi:10.1016/j.enpol.2015.02.014
Say, J. B. (1836). A treatise on political economy: or the production, distribution, and consumption of wealth. Philadelphia, PA: Grigg and Elliot.
Shen, N., Liao, H., Deng, R., and Wang, Q. (2019). Different types of environmental regulations and the heterogeneous influence on the environmental total factor productivity: empirical analysis of China’s industry. J. Clean. Prod. 211, 171–184. doi:10.1016/j.jclepro.2018.11.170
Simonsohn, U. (2018). Two lines: a valid alternative to the invalid testing of U-shaped relationships with quadratic regressions. Adv. Method. Pract. Psychol. Sci. 1 (4), 538–555. doi:10.1177/2515245918805755
Smith, A., Strahan, W., and Cadell, T. (1776). An inquiry into the nature and causes of the wealth of nations: volume One. London.
Solow, R. M. (1956). A contribution to the theory of economic growth. Q. J. Econ. 70 (1), 65–94. doi:10.2307/1884513
Solow, R. M. (1957). Technical change and the aggregate production function. Rev. Econ. Stat. 39 (3), 312–320. doi:10.2307/1926047
Song, J., Zhang, J., and Pan, Y. (2024). Research on the impact of ESG development on corporate new quality productive froces: empirical evidence from Chinese A-share listed firms. Contemp. Econ. Manag. 46 (06), 1–11. Available online at: https://link.cnki.net/urlid/13.1356.F.20240313.1657.002
Teece, D. J., Pisano, G., and Shuen, A. (1997). Dynamic capabilities and strategic management. Strateg. Manag. J. 18 (7), 509–533. doi:10.1002/(sici)1097-0266(199708)18:7<509::aid-smj882>3.0.co;2-z
Wang, H., and Kang, C. (2024). Digital economy and the green transformation of manufacturing industry: evidence from Chinese cities. Front. Environ. Sci. 12, 1324117. doi:10.3389/fenvs.2024.1324117
Wang, P., Wu, W., Zhu, B., and Wei, Y. (2013). Examining the impact factors of energy-related CO2 emissions using the STIRPAT model in Guangdong Province, China. Appl. Energy. 106, 65–71. doi:10.1016/j.apenergy.2013.01.036
Wang, X., Wu, H., and Li, L. (2022). Risks and firms' decision making on outward foreign direct investment: an empirical analysis of China's state-owned enterprises. World. Econ. 30 (6), 163–182. doi:10.1111/cwe.12450
Wang, Y., Sun, X., and Guo, X. (2019). Environmental regulation and green productivity growth: empirical evidence on the Porter Hypothesis from OECD industrial sectors. Energy. Policy. 132, 611–619. doi:10.1016/j.enpol.2019.06.016
Xie, F., Jiang, N., and Kuang, X. (2024). Towards an accurate understanding of ‘new quality productive forces. Econ. Polit. Stud. 13, 1–15. doi:10.1080/20954816.2024.2386503
Xie, Q. (2017). Firm age, marketization, and entry mode choices of emerging economy firms: evidence from listed firms in China. J. World. Bus. 52 (3), 372–385. doi:10.1016/j.jwb.2017.01.001
Xing, Y., and Kolstad, C. D. (2002). Do lax environmental regulations attract foreign investment? Environ. Resour. Econ. 21 (1), 1–22. doi:10.1023/a:1014537013353
Xinhua News Agency (2024). Xi stresses development of new productive forces. High-quality Dev. Available online at: http://en.cppcc.gov.cn/2024-02/02/c_960500.htm (Accessed December 20, 2024).
Yang, G., Ding, Z., Wang, H., and Zou, L. (2023). Can environmental regulation improve firm total factor productivity? The mediating effects of credit resource allocation. Environ. Dev. Sustain. 25 (7), 6799–6827. doi:10.1007/s10668-022-02336-0
Yu, H., Liao, L., Qu, S., Fang, D., Luo, L., and Xiong, G. (2021). Environmental regulation and corporate tax avoidance: a quasi-natural experiments study based on China’s new environmental protection law. J. Environ. Manag. 296, 113160. doi:10.1016/j.jenvman.2021.113160
Zhang, C., Liu, H., Bressers, H. T. A., and Buchanan, K. S. (2011). Productivity growth and environmental regulations-accounting for undesirable outputs: analysis of China’s thirty provincial regions using the Malmquist–Luenberger index. Ecol. Econ. 70 (12), 2369–2379. doi:10.1016/j.ecolecon.2011.07.019
Keywords: environmental regulation, new quality productive forces, development speed, Chinese listed firms, inverted U-shaped relationship
Citation: Chen Q, Su H, Gao W and Lv J (2025) Does environmental regulation drive or hinder the development of new quality productive forces? evidence from Chinese listed firms. Front. Environ. Sci. 13:1582399. doi: 10.3389/fenvs.2025.1582399
Received: 24 February 2025; Accepted: 29 April 2025;
Published: 16 May 2025.
Edited by:
Otilia Manta, Romanian Academy, RomaniaReviewed by:
Zhihua Wang, Shanxi Datong University, ChinaMaria Giovanna Confetto, University of Salerno, Italy
Jinyu Chen, Capital University of Economics and Business, China
Copyright © 2025 Chen, Su, Gao and Lv. This is an open-access article distributed under the terms of the Creative Commons Attribution License (CC BY). The use, distribution or reproduction in other forums is permitted, provided the original author(s) and the copyright owner(s) are credited and that the original publication in this journal is cited, in accordance with accepted academic practice. No use, distribution or reproduction is permitted which does not comply with these terms.
*Correspondence: Huaqiang Su, c2NzODk5MDE3QDE2My5jb20=