 Linus Hartz
 Lisa Grabinski
 Samir Salameh
- Lab for Particle Technology, Dep. Chemical Engineering, FH Münster University of Applied Science, Münster, Germany
Microplastics have become prominent environmental pollutants in both marine and freshwater systems, which raises ecological and health concerns. This study provides a comprehensive meta-analysis of microplastic concentration data from over 60 studies across Europe, investigating factors influencing microplastic distribution. The investigated influences include sampling latitude, proximity to wastewater treatment plants, population density in the sampling area, sampling mesh size, distance to coastlines, seasonal variations, and wind speeds. The results indicate that microplastic concentrations correlate with mesh size in marine but not freshwater environments, suggesting the predominant microplastic type in fresh waters to be primary microplastics. Although it is generally accepted, that waste water treatment plants contribute to microplastic pollution, this study identifies other more significant factors, such as surface runoff and atmospheric deposition. Population density shows a modest influence, while the distance of sampling site from coastlines is, contrary to findings from other publications, not significantly related to microplastic concentration levels. Seasonal and wind speed effects are complex, with varied impacts across sampling locations and used correction factors have to be critically reevaluated. This analysis underscores the need for standardized methodologies in microplastic research, and it recommends specific sampling practices to enhance data comparability across studies, which contributes to a more accurate assessment of microplastic pollution in aquatic environments.
1 Introduction
Microplastics (MP) is an umbrella term generally used to describe small plastic particles which have become a globally prominent environmental contaminant over the past few decades (PlasticsEurope, 2011; Thompson et al., 2004; Scherer et al., 2020). Although still no universally accepted definition exists, the term is commonly used to describe particles smaller than 5 mm in size (Galloway, 2015; European Comission, 2024; Bundesamt, 2020; Arthur et al., 2009). MP are often classified into primary and secondary MP. Primary MP are intentionally produced for applications like cosmetics, in cleaning agents, and as industrial abrasives (Bexeitova et al., 2024a). Secondary microplastics are formed by the degradation of larger plastic items, such as plastic bags, bottles, and fishing nets. The degradation of these items can be caused by a variety of factors, including UV radiation, mechanical abrasion, and biological activity (Devereux et al., 2022; Rodrigues et al., 2018; Sekudewicz et al., 2021; Fischer et al., 2016; Napper and Thompson, 2016).
Increasing evidence has shown a widespread distribution of MP in aquatic environments, including fresh water systems, raising concerns about ecological and human health implications (Pilechi et al., 2022; Ziajahromi et al., 2017; Napper and Thompson, 2016; Bexeitova et al., 2024a). For example, MP can act as a vector for the transport of invasive species (Sighicelli et al., 2018), and can also provide a surface for the adsorption of toxic chemicals (Fath, 2019; Lechner and Ramler, 2015), which can then be transferred to marine organisms and thus enter the food chain (Rowley et al., 2020; Galloway, 2015; Ziajahromi et al., 2017; Devereux et al., 2022). Despite growing awareness and research efforts, understanding the extent of MP impact remains an open question (Lambert and Wagner, 2018; Koelmans et al., 2019; Shim et al., 2017; Frias and Nash, 2019).
One major challenge in the field of MP pollution, is the inconsistency in quantification and qualification methods (Koelmans et al., 2019; Primpke et al., 2017; Mani and Burkardt-Holm, 2020; Sekudewicz et al., 2021; Lambert and Wagner, 2018; Obermaier and Pistocci, 2022; Bexeitova et al., 2024b) as well as sampling methods (Dris et al., 2018; Morgado et al., 2022; Schrank et al., 2022; Primpke et al., 2017), which makes it difficult to compare findings across studies. This variability leads to a lack of standardization in the field (Winkler et al., 2022; Hildebrandt et al., 2021; Wal et al., 2015; Schrank et al., 2022; Campanale et al., 2020; Cera et al., 2020; Hashmi, 2022; Constant et al., 2020).
Previous studies differ in their conclusions about the primary sources and the main influencing factors of MP pollution, with some pointing to wastewater treatment plants (WWTP) as a major contributor (Schmidt et al., 2018b; Funck et al., 2021; Sekudewicz et al., 2021), while others suggest that population density (Rodrigues et al., 2019; Correa-Araneda et al., 2022) has larger impact. Weather conditions (Schmidt et al., 2018b; Sighicelli et al., 2018), seasonal variations (Wal et al., 2015; Rodrigues et al., 2018; Rodrigues et al., 2019) or hydrological events (Hurley et al., 2018) and atmospheric fallout (Constant et al., 2020; Hashmi, 2022) are also often mentioned as significant factors which should be regarded during sampling campaigns and evaluation.
With this, the central hypothesis driving the meta-analysis is that MP concentrations in European aquatic environments are primarily driven by anthropogenic pressures, particularly population density and proximity to WWTPs and are additionally impacted by methodological parameters such as mesh size and seasonal timing of the sampling campaigns.
This paper aims to provide a comprehensive overview of the current state of research on MP pollution in both marine and freshwater environments, not only providing an overview over different studies and findings but also trying to find and underline prior findings and use the collected data to understand the influencing factors of MP abundance. By comparing findings from various studies and conducting a meta-analysis, we seek to offer a more nuanced understanding of MP pollution. By analyzing the findings off different papers and comparing related data as well as working out correlations within the found data, this study tries to critically review findings made on small scale sampling campaigns and tries to gain deeper insight into data across multiple studies. Additionally, this paper will review the most common sampling methods used in MP research, offering recommendations for best practices to enhance the comparability of future studies and increase the standardization in this field of research.
2 Materials and methods
2.1 Data collection and preparation
The data was extracted manually from several publications. For the literature research the publication databases google scholar, Scopus and Semantic Scholar where used. The publications were found by keyword search containing the keywords microplastic, microplastics, pollution, concentration, abundance, river, freshwater, European, Europe in different combinations. Additionally, literature was found by first creating a list of European rivers and then searching for publications containing the keywords microplastic, microplastics, pollution, concentration, abundance in combination with the name of the river. The found publications were screened by title, abstract, and full text and excluded from the meta-analysis when exclusion criteria where met (see Exclusion criteria for the collected literature). Publications were included if they contained data on microplastic concentrations in European rivers. A predefined set of columns in an Excel table was filled as much as possible with the given data (See Supplementary Material). For this, the publications were screened for the relevant information and the concentration data was taken either directly as given in the text, from tables or read of figures.
A similar approach was used to find publications on European marine waters. The keywords used here included microplastic, microplastics, pollution, ocean, marine, sea, coast in different combinations and also combined with European, Europe, Atlantic, Mediterranean, Baltic Sea, Black Sea, North Sea. The data collection was done by two independent researchers separately for freshwater and oceanic MP.
Pre-processing of the extracted data then involved estimating sampling coordinates based on provided maps and descriptions where missing, averaging sampling speed, depth and time where only a range was given and determining distances to relevant landmarks, such as waste water treatment plants and coast. Also, the population density at the respective sampling point was determined. Furthermore, concentrations were converted to items/m3 or items/km2 were necessary and possible. This was done by using the given net aperture, submersion depth and the sampled area of surface water, the boat speed and sampling duration, where possible and reported.
2.2 Exclusion criteria for the collected literature
The literature research was bounded by certain criteria which will be discussed briefly in the following. These criteria were set to keep a reasonable scope and enable comparison of the considered studies. As, in this work, surface waters are compared to each other only studies sampling up to depths of 1.5 m were considered. Hence, all studies and all data regarding deep-water sampling, airborne microplastics, sediments or ingestion of microplastics by animals are not included in the meta-analyses. However they are sometimes discussed as they also provided insight into the interplay of different influences and only together with the surface water samples yield a comprehensive overview. With this, the studies included in the meta analysis all either aim to quantify the microplastic pollution or some influence on MP abundance in surface waters. Regarding sampling methods, focus is set on volume reduced methods, since these are most frequently used, as will be shown in Chapter Sampling methods. Additionally, continuous and bulk sampling are assessed for comparison and to determine the influence of the sampling method on the sampling results. Furthermore, the geographical catchment area for freshwater, precisely river samples, is limited to continental Europe to enable comparison of anthropogenic influences, since population, climate, culture, wealth and legislation are assumed to be sufficiently similar to allow comparison but might differ substantially between different continents and might impact the production amount, usage and disposal of plastics and thus render the publications findings incomparable. Thus, limiting the analysis to European inland waters reduces confounding variables associated with global disparities (Chen et al., 2024; Gao et al., 2023b; European Environment Agency, 2024). Similarly, for marine samples the Mediterranean Sea, Black Sea, Baltic, Sea and North Atlantic Ocean are considered with limiting values for latitude and longitude (min: 21.94 °N, −33.57 °N, max: 71.53 °E, 42.0 °E). This geographical limitation has been established to ensure comparability of sampling locations. Where available, only raw data (without correction factors and any pre-processing) were extracted. Only studies published since 2015 were included in this meta-analysis to ensure methodological consistency and relevance to the current state of the field. As highlighted by Yildirim et al. (2024), the research landscape on microplastics in freshwater ecosystems has undergone exponential growth in recent years, with the majority of high-impact publications appearing after 2015. Additionally after 2015 a shift toward more standardization regarding methodology, better reporting practices and alignment with global policy developments, can be seen (Löder and Gerdts, 2015; Masura et al., 2015; Bexeitova et al., 2024a). Figure 1 gives the PRISMA flow diagram [created with (Haddaway et al., 2022)], showing identification, screening and exclusion of literature and Table 1 the corresponding exclusion criteria.
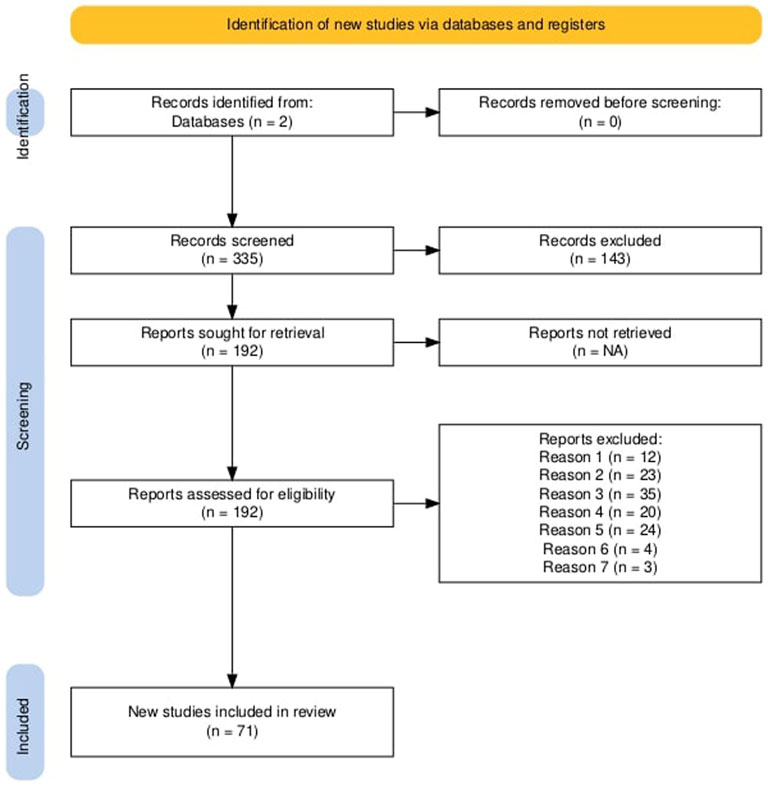
Figure 1. PRISMA flowchart. Overview of the retrieved, considered and excluded literature combined for freshwater and oceanic MP, created with (Haddaway et al., 2022). As recommended by PISMA (Page et al., 2021).
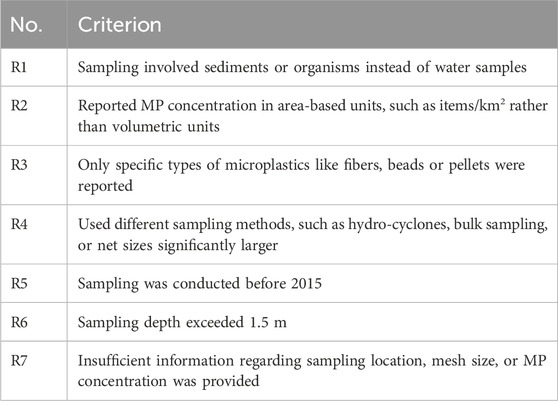
Table 1. Exclusion criteria mentioned in Figure 1.
2.3 Sampling methods
Common methods for sampling MP in (sub-)surface waters can be divided into volume reduced sampling, bulk sampling and continuous sampling (Liu et al., 2020; Skalska et al., 2020; Hidalgo-Ruz et al., 2012; Karlsson et al., 2020; Roscher et al., 2021; Tamminga et al., 2018), where volume reduced sampling is the most frequently used method (Pasquier et al., 2022), more precisely, the manta trawling method is used in the majority of studies (Razeghi et al., 2021; Pasquier et al., 2022). Generally, for volume reduced sampling neuston-, manta-, plankton- and bongo nets or trawls are attached behind a research vessel and towed through the water. Two plankton nets mounted next to each other are called a bongo net and allow simultaneous sampling with two different mesh sizes (Flanders Marine Institute, 2023). Historically, manta nets evolved from neuston nets where the main difference is the sampling depth. For manta nets, common sampling depths are in the range of 15 cm–25 cm where for neuston nets around 50 cm is common. In order to avoid impairment of collection, the trawl needs to be towed outside of the wake zone of the boat. A typical manta net sampling device consists of a frame part and a collecting net, which terminates in a collector, as shown in Figure 2 (Pasquier et al., 2022).
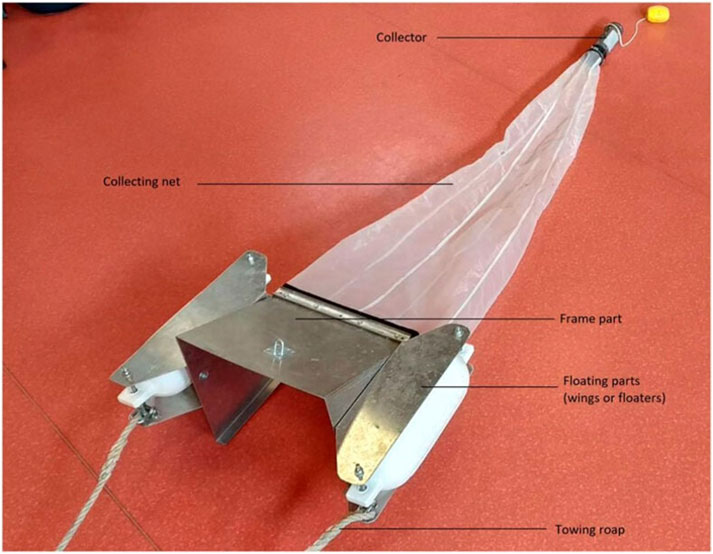
Figure 2. Manta net sampling device. Manta net, consisting of a collector, collecting net, frame part, floating parts and towing rope (taken from Pasquier et al., 2022).
Most commonly used mesh sizes are between 300 μm and 350 µm (Pasquier et al., 2022), respectively 333 µm (Cutroneo et al., 2020), as in agreement with studies reviewed in this work (more details to commonly used mesh sizes will be discussed in ChaptersMesh size and Recommendations). The prevalence of this mesh size is attributable to the fact that manta nets evolved from plankton collectors (Pasquier et al., 2022) and 333 µm shows to be a good compromise between clogging problems and meaningfulness of measured concentrations, which, in fact seems to be an arbitrary choice. However, the choice of mesh size introduces a bias towards either larger or smaller particles which can affect the results of a study significantly. Especially derived features such as the plastic type or the particle form are dependent on the size of the captured particles and thus dependent on the mesh size. As evaluated in Chapter Mesh size the mesh size impacts the measured MP concentration significantly, which is due to the particle size cut-off point and the slip-through of fibers, determined by the respective mesh size. This may lead to underestimation of MP concentrations especially in case of a high fiber load in the particle distribution (Pasquier et al., 2022; Skalska et al., 2020).
Another important design variable is the sampling velocity. Different sampling velocities should be used depending on the pore size of the net. For example, a nylon net with a pore size as small as 100 µm is clogged easily and should therefore be used only at low velocities and/or over short periods of time. Manta trawls, on the other hand, can be used at higher velocities and over longer periods of time to sample larger volumes of water (Prata et al., 2019). In order to avoid clogging and enable comparison (Pasquier et al., 2022) recommend three replicates of each 10 min to 20 min.
The determination of sampled water volume should be performed by means of a flow meter for most precise results (Pasquier et al., 2022; Skalska et al., 2020; Prata et al., 2019) but in practice often the volume is calculated based on the submerged mouth opening of the net the traveled distance, which may lead to errors up to 48% (Pasquier et al., 2022) and continuous underestimation of MP abundances (Pedrotti et al., 2022).
The less common method of in-situ or continuous sampling by using a pump is more appropriate for smaller particle sizes and reduces clogging. Filters with successively smaller pore sizes in a filter tube enable collection of multiple size fractions at once (Uurasjärvi et al., 2020), while also allowing the sampling of a large volume of seawater even in greater depth of up to 100 m (Cutroneo et al., 2020). Due to the greater expense, this method is less common than volume reduced sampling (Wakkaf et al., 2020; Roscher et al., 2021; Karlsson et al., 2020; Faruk Çullu et al., 2021).
Bulk sampling on the other hand, is the collection of water into a bulk container (Vega-Moreno et al., 2021; Tamminga et al., 2018; Reinold et al., 2021; Bagaev et al., 2018), without reducing the volume of the sample during the sampling process (Hidalgo-Ruz et al., 2012). The bulk containers are lowered manually from the research vessel down to the required sampling depth (Cutroneo et al., 2020). This leads to the advantage of no lost size fractions but for reliable and comparable results large volumes of water (around 100 L) need to be sampled, which mostly is not the case, resulting in insufficient sample sizes (Skalska et al., 2020).
Both of the latter methods allow sampling in restricted areas, which is an advantage over the volume-reduced sampling with a trawls (Cutroneo et al., 2020).
2.4 Statistical tests
For correlation testing, the Pearson Correlation Coefficient (PCC) is used. The PCC is a measure of the linear correlation between two variables. It ranges from −1 to 1, where 1 indicates a total positive linear correlation, 0 indicates no linear correlation, and −1 indicates a total negative linear correlation. The PCC is calculated with Equation 1:
where
For comparison of the distributions of multiple groups, the Kruskal–Wallis test was used. The Kruskal–Wallis test is a non-parametric method for testing whether there are statistically significant differences between the medians of three or more independent groups. Unlike the ANOVA, the Kruskal–Wallis test does not assume a normal distribution of the data, making it suitable for ordinal data or non-normally distributed continuous data. The test statistic is calculated as follows (Equation 2):
where
where
As post hoc test, to find which of the compared samples differs from the others, a Mann-Whitney U test can be performed on the paired samples. Other than for the standard t-test, the means of the samples do not have to follow a normal distribution. The Mann-Whitney U test tests if, for randomly selected values
Both the Kruskal–Wallis and the Mann-Whitney U test do not assume normally distributed samples. This makes them suitable for the comparison of means for the synthesized MP concentrations as these are not normally distributed which will be discussed later.
3 Results and discussion
3.1 Description of the dataset
Two independent literature researches were conducted, one focusing on oceanic MP and the other one focusing on fresh water MP. A total of 71 publications with 1,560 data points matching the criteria described in Chapter Exclusion criteria for the collected literature were found. 40 of these publications are dealing with oceanic MP (1,183 data points) and 20 with freshwater MP (377 data points). For freshwater only studies with MP concentrations given in items/m3 were considered, whereas for oceanic samples also items/km2 were collected and are therefore shown below as well, but will not be further evaluated. This is due to the more frequent use of volumetric concentrations compared to area-based concentration and to enable quantitative comparison between studies. Furthermore, all sampling devices used, always sample volumes of water as they are submerged. This means volumetric concentrations are the more adequate way of measuring the concentration. Nets which are submerged deeper or fully, lead to higher sampling volumes and therefore most likely to a larger concentration found as effectively more water is sampled. This factor is not accounted for when reporting concentrations in items/km2.
Figure 3 shows dot plots of the analyzed dataset as concentration of MP items versus publication for (a) oceanic waters and (b) fresh waters given in items/m3, and (c) oceanic waters with values given in items/km2.
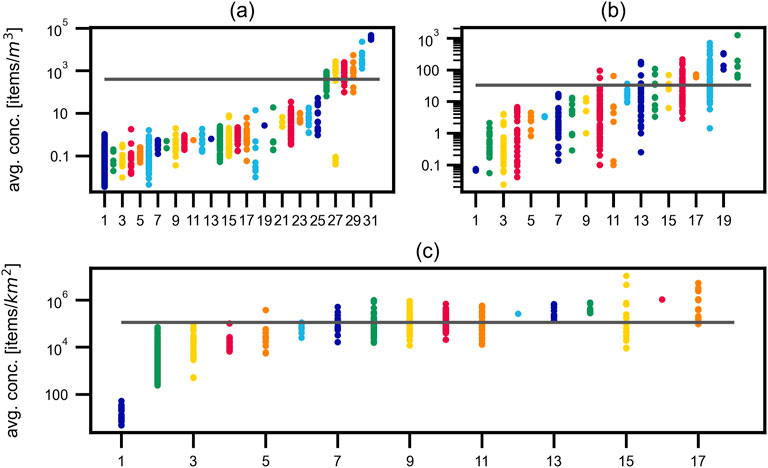
Figure 3. Extracted data from publications. Measured concentrations for each considered publication and the average for each figure (gray) in (a) marine waters and (b) in fresh waters in items/m3 and (c) in marine waters with concentrations given in items/km2. Range of concentrations and average value differ for each of the three presented graphs by multiple orders of magnitude. Indices, references and author names are given in Table 3.
The publications are ordered by increasing mean concentration and the respective overall average for the reported concentrations in the respective Figures is presented as gray line. Found concentrations range over six (Figures 3b, c), respectively seven (Figure 3a) orders of magnitude and the mean volumetric concentration in oceans is one order of magnitude higher than in freshwaters. This finding could have several explanations and will be discussed in more detail in Chapter Mesh size.
The geographic distribution of sampling locations is presented in Figure 4 with (a) all considered data with concentration in items/m3 and (b) oceanic sampling points with concentrations in items/km2.
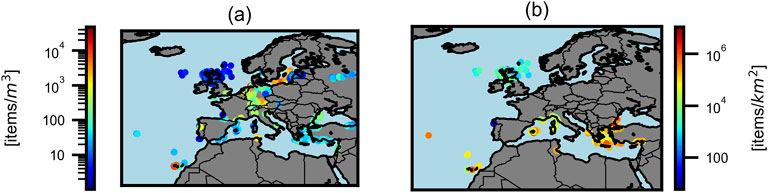
Figure 4. Sampling locations. Sampling locations with color-coded scale (a) for all data in items/m3, (b) only for oceanic data in items/km2. The presented data does not show any clear correlation regarding increasing concentrations further south.
There seems to be a tendency for higher concentrations in southern regions but the correlation is non-significant with a PCC of 0.1 on the logarithmic concentration over latitude.
As stated before, only volumetric concentrations will be evaluated in this work and therefore all following chapters and figures only consider the studies shown in Figures 3a, b.
3.2 Effects and correlations
The following sections will explore various factors influencing the concentration of microplastics in aquatic systems, based on the collected data. Specifically, the impact of mesh size used in sampling, anthropogenic activities—such as proximity to WWTP, population density, and distance to the nearest coastline—as well as seasonal variations, will be examined. Other factors, such as vertical distribution influenced by agglomeration, plastic type, or salinity (Mendrik et al., 2023; Gao et al., 2023a; Parać et al., 2022; Uurasjärvi et al., 2021), and large-scale variables like currents, gyres, and eddies (Brach et al., 2018; Frias et al., 2020; Eerkes-Medrano et al., 2015), or the effect of atmospheric fallout on the MP concentration, will not be addressed in this review due to their complex interactions. However, these factors may also substantially impact MP distribution.
3.2.1 Mesh size
Several studies in marine waters found a correlation between mesh size used for sampling and measured concentration. For example, Lindeque et al. (2020) found 2.5-fold and 10-fold greater MP concentrations with 100 µm compared to 333 and 500 µm mesh sizes. Even more remarkable is the finding of a 100-fold greater concentration measured with 100 µm nylon net compared to 333 µm manta net by Vermaire et al. (2017) or a 10,000-fold difference of maximum concentrations for small (10 µm) and large (300 µm) MP sampled by Roscher et al. (2021). Several studies pointed out rising concentrations towards lower size fractions (Adamopoulou et al., 2021; Aigars et al., 2021; Gündoğdu and Çevik, 2017; Gündoğdu, 2017; Güven et al., 2017; Hansen et al., 2023; La Kanhai et al., 2017; Kazour et al., 2019) and therefore, the importance of similar sampling methods to obtain comparable results (Tamminga et al., 2018). It is important to mention that this trend, even though reported in some of the considered literature on freshwater samples (Kataoka et al., 2023; Dris et al., 2015; Lorenz et al., 2020), could not be confirmed in the here conducted meta-analysis. For example, Adamopoulou et al. (2021) who took samples in the open sea as well as in the inner Saronikos Gulf, did not observe rising concentrations towards lower size fractions for the latter sampling location. On the other hand, Dris et al. (2018) find that using a 80 µm net instead of a 330 µm mesh size the probability of sampling fibres increases by 250%, which is backed up by Norén (2007), who find an increase of sampled fibers by three orders of magnitude.
In order to evaluate the influence of sampling mesh size on measured concentrations and therefore enable comparison between studies, the ocean and freshwater datasets were split into six size fractions (0–25 μm, 25–100 μm, 100–200 μm, 200–300 μm, 300–400 μm, 400–600 µm). The resulting violin plots, with average concentrations in items/m3 on a logarithmic scale against mesh size in µm are shown in Figure 5 for freshwater (right violin side, green) and oceans (left violin side, blue), respectively.
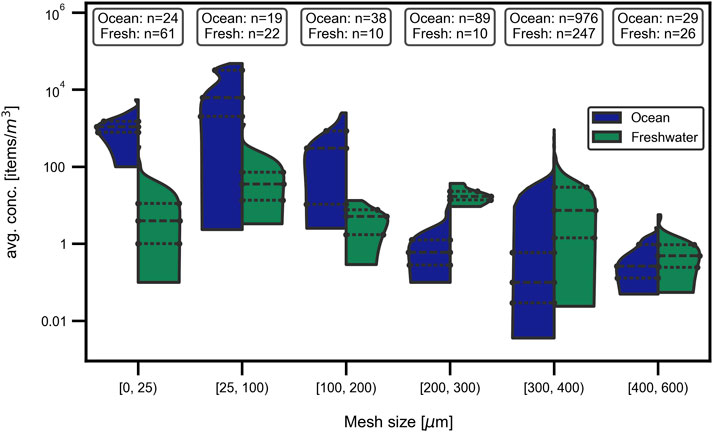
Figure 5. Mesh size vs. found MP concentration. Influence of mesh size. On the MP concentration in (right violin side, green) fresh water and (left violin side, blue) marine samples. A decreasing tendency is observable for oceanic systems, whereas no clear tendency is visible for freshwaters.
Regarding freshwaters, no tendency is visible with concentrations ranging over up to six orders of magnitude (for size class 300 μm–400 µm). The smallest median concentration is observed for the largest size fraction (400 μm–600 µm) whereas the highest median concentration is observed for size fraction 25 μm–100 µm. The medians of the remaining four size fractions only differ by one order of magnitude. Contrary, the median concentrations for oceans differ over several orders of magnitude for all size fractions. A decreasing tendency of concentration with increasing mesh size is visible for all size fractions except for the largest one (400 μm–600 µm), which is in the same order of magnitude as size fraction 200 μm–300 µm and the smallest class (0 μm–25 µm), which is in the same order of magnitude as 25 μm–100 µm.
Direct comparison of both of the above described figures shows higher maximum measured concentrations in oceans and a tendency to more outliers, which is attributable to the higher absolute number of data points (blue), especially in size fraction 300 μm–400 µm.
The decreasing tendency observed in Figure 5 aligns with expectations and is probably attributable to several abiotic (caused by light, temperature, water, air and mechanical forces) and biotic (caused by organisms such as bacteria, fungi and insects) degradation mechanisms acting on the (mostly secondary) MP particles and crushing them in even smaller particles (Zhang et al., 2021; Prata et al., 2019). This effect is enhanced by longer residence times in oceans compared to rivers and thus leading to higher fragmentation in oceans (Parać et al., 2022). Therefore, an increasing number of small size fraction particles is to be expected in oceanic samples. For fibers in particular, smaller mesh sizes are necessary for adequate sampling (Prata et al., 2019), hence it should be noted that they often slip through the mesh or are collected, although they might be larger than the respective used mesh size, depending on their spatial orientation (Gewert et al., 2017). The observed increase in the average concentration of microplastics in the largest size fraction, coupled with a decrease in the smallest size fraction, might be attributable to the limited number of data points available for these specific size ranges. This tendency once again highlights the need for a more standardized and comprehensive sampling methodology to ensure accurate and representative assessments of microplastic pollution across all size ranges.
In the context of freshwater systems, where no discernible trend in microplastic concentrations depending on mesh size is observed, it is hypothesized that a higher proportion of primary microplastics may be present. This is likely due to shorter residence times of water within freshwater bodies before eventually flowing into oceans. As a result, degradation processes that would break down larger plastic particles into smaller secondary MP are less likely to occur within the limited time frame. Consequently, instead of observing an increase in the concentration of smaller secondary MP particles, we see a relatively constant measured average concentration of MP over all size fractions. This consistency is attributed to the predominance of larger primary MP that retain their size during their transit through the freshwater system. Therefore, the particle sizes remain constant during residency in the river, leading to a stable average concentration of MP in these environments.
Histograms of the respective measured concentrations in oceans and freshwaters are shown in Figure 6 with the relative frequency versus average concentration in items/m3 on a logarithmic scale. For Figure 6 the data was binned into 15 different size ranges, all equal in span width, according to the mesh sizes used in sampling. The data was then normalized such that the area under the graph equals 1. That means the number of observations in one mesh size bin is divided by the total number of observations for all bins, which gives the relative frequency.
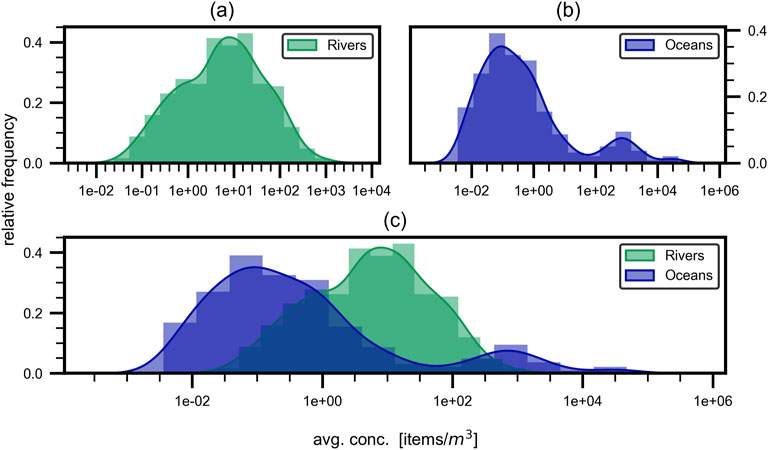
Figure 6. Frequency of sampled concentrations. Relative frequency of sampled concentrations for (a) freshwaters, (b) oceans and (c) both. A bimodal distribution for marine waters and a mono-modal distribution for freshwaters is observable, with the latter peak sitting in the trough of the marine distributions peaks.
For the oceanic samples (Figure 6b) a bimodal distribution is present with peaks at approximately 0.1 items/m3 and 1,000 items/m3 and a minimum in between them with less than 100 items/m3. A difference of 30% between the relative frequencies for the two peaks is observed. In terms of freshwater (Figure 6a) a mono-modal distribution is obtained with a peak at around 10 items/m3 with a relative frequency of approximately 40%. When combining the two distributions in one figure (Figure 6c) it is notable that the peak of the freshwater distribution is located at the trough of the oceanic distribution.
Furthermore, it is to be mentioned, that none of the presented distributions align with a normal-, log-normal or any other common distribution. This observation could indicate several underlying issues. One possibility is that the current dataset is not extensive enough, suggesting that more data points need to be sampled to achieve a more accurate and representative distribution. Another factor to consider is the influence of the sampling net’s mesh size. The mesh sizes most commonly used in microplastic sampling range from 300 µm to 400 μm, which may create significant gaps in the data. This is not merely about the number of sampling points, but rather the intervals between the mesh sizes, leading to large gaps between data points. Such gaps could result in a distorted representation of the true distribution of microplastic particles. Additionally the non-standardized sampling leads to multiple distributions layered over one another and therefore again increases the difficulty of fitting common distributions. As seen in Figure 6b concentrations between 0.01 items/m3 to 1 items/m3 are the most frequent ones, which aligns with the observation in Figure 5, where they appear as mean values for three different size fractions and are especially frequent in the most common size class (300 μm–400 µm). This underlines the importance of the mesh size used for sampling and once again shows that larger mesh sizes result in smaller measured concentrations.
It may be hypothesized that an influencing factor on the staggered peaks in the combined distribution is due to agglomeration and degradation of MP in oceanic environments. In the ocean, smaller particles tend to aggregate, leading to more frequently measured lower concentrations. This agglomeration of small particles could explain the rightward shift of the peak in the oceanic distribution compared to freshwater systems, where primarily primary MP are present. These primary MP in freshwater do not significantly agglomerate or degrade, maintaining a more stable size distribution (Munari et al., 2021; Fischer et al., 2016; Campanale et al., 2020). Additionally, the degradation of MP in oceanic environments might contribute to the observed leftward shift of one peak compared to freshwater systems. In freshwater, as previously mentioned, no significant degradation occurs due to the shorter residence time before these particles flow into the ocean. At the same time, larger particles (sometimes referred to as macro- or mesoplastics) from other sources, such as fishing nets and marine debris, could also be present in the oceanic environment (Reinold et al., 2021; Pedrotti et al., 2022; Gündoğdu and Çevik, 2017; Ruiz-Orejón et al., 2019). This combination of factors might result in the shown peak distribution and explain the left and right shift of the mono-modal particle size distribution found in rivers to the bi-modal size distribution found in oceans.
3.2.2 Distance to WWTP outlets
In literature, the dependency of MP concentration on the distance to the nearest WWTP is discussed and not consensus. While it is generally agreed that WWTPs, especially municipal ones, serve as sources of microplastics (fibers, fragments, and beads), some studies indicate a significant correlation (Dris et al., 2015; Napper and Thompson, 2016; Mughini-Gras et al., 2021; Ziajahromi et al., 2017; Habib et al., 1998), whereas others point out that different other effects, such as weather phenomena (Primpke et al., 2017; Stanton et al., 2020), outweigh the proximity to WWTP outlets. Additional publications report higher concentrations upstream of WWTP outlets, with values ranging from 354 items/m3 to 69 items/m3 at the nearest downstream sampling station (Schrank et al., 2022). Schmidt et al. even report three different findings in the same river at three different outlets: one showing a significant increase, one showing only a tendencial increase and the third one showing no significant difference in concentration between upstream and downstream of the outlet (Schmidt et al., 2018a). Utilizing the data collected in this study, along with spatial information about WWTP outlets, a more comprehensive analysis can be conducted, including a variety of sampling methods, weather influences and river sizes.
To find the distance of a sampling station to the nearest WWTP outlet, a python script was developed. For the oceanic sampling stations, the distance to the nearest WWTP outlet was determined using the geopy library (Esmukov, 2024) and the geodesic distance calculation method. For the river sampling stations, additionally the angle between the river flow direction and the direction to the nearest WWTP outlet was calculated and only the WWTP outlets upstream the sampling station were considered as no back mixing in rivers is a common assumption (Urgert, 2015; Wal et al., 2015). Only distances under 30 km to the nearest WWTP outlet were considered in the analysis to minimize the influence of other MP sources. Figure 7 illustrates the impact on MP concentration in water samples for both oceanic and freshwater sampling stations.
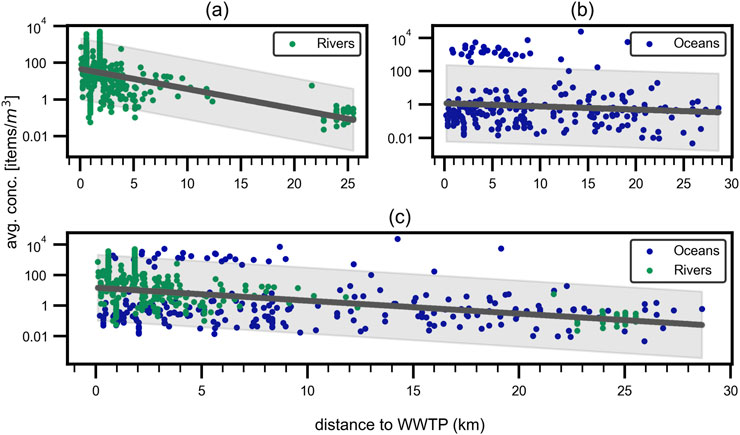
Figure 7. Distance to WWTP outlets. Influence of distance to the next WWTP on the average microplastic concentration for (a) rivers, (b) oceans and (c) combined. Non-significant correlations with PCCs of (a)
As illustrated in Figure 7, the concentration of microplastics in the water samples decreases with increasing distance from the nearest WWTP outlet. However the correlation is not significant, with a PCC of
The low correlation strength for oceanic sampling points is expected, as factors such as currents and tides have a much stronger influence on MP concentration than the distance to the nearest WWTP outlet, especially for sampling points further offshore where this distance approaches that to the nearest coastline. On the other hand, the finding of low to non-significance of the distance to the nearest WWTP outlet on MP concentration in river sampling stations contrasts with the findings of other publications as mentioned above.
Even though waste water treatment plants, of course, are a great source of MP influx into the water systems (Murphy et al., 2016; Mason et al., 2016) and may act as point sources for fibers (Ziajahromi et al., 2017; Lares et al., 2018), the influence of other sources like surface runoff (Campanale et al., 2020), atmospheric deposition (Dris et al., 2015) and industrial waste water (Horton et al., 2017) is not to be underestimated (Nizzetto et al., 2016; Liu et al., 2019; Baldwin et al., 2016; Mani and Burkardt-Holm, 2020; Schmidt et al., 2018a; Obermaier and Pistocci, 2022). Especially challenging in this regard is, for example, the filter efficiency of WWTPs regarding microplastic particles as WWTPs are expected to filter MP with varying efficiency. Also, the input into the WWTPs can differ strongly depending on the population density and industrial or agricultural usage of the area in proximity to the WWTP. The findings underline the complexity of the MP pollution problem and the need for further research and more standardized data and methods to better understand the sources and sinks of MP in the environment. The meta-analysis also shows that the correlation between higher MP concentrations in proximity to WWTP outlets shows only low significance and points to other factors outweighing and covering up the effect of MP rich WWTP effluent entering rivers and oceans.
3.2.3 Population density
The influence of population density on MP concentration in the water samples was analyzed using population density data from Copernicus (Joint Research Centre Data Catalogue, 2024) and the MP concentration in the water samples. The sourced data from copernicus gives the amount of inhabitants in an rectangular cell pattern over the desired region. All inhabitants in the cells inside a certain radius around the sampling sites were summed up to obtain the population density for that circular area. Plotting the concentration versus the population density in a certain radius results in Figure 8.
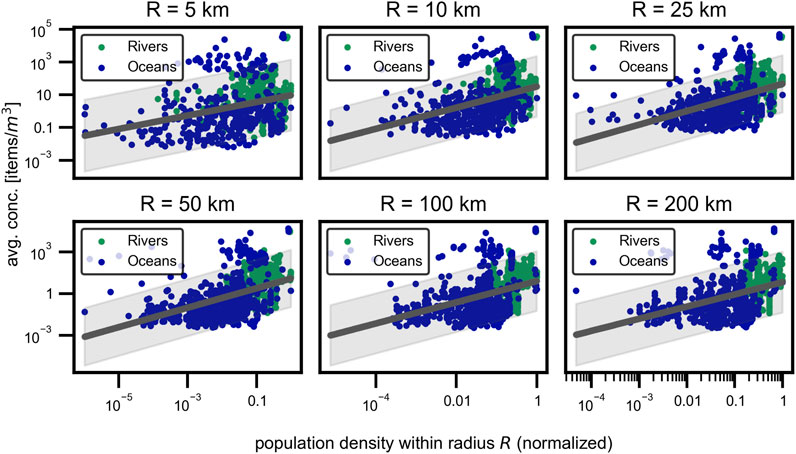
Figure 8. Population density. Influence of the population density on the MP concentration in water samples for multiple radii
Because defining a meaningful radius around the sampling station is difficult and may vary for oceanic and fresh water sampling stations, the analysis was done for multiple radii. The results show a moderate increase in the MP concentration with increasing population density. However, the correlation is only significant
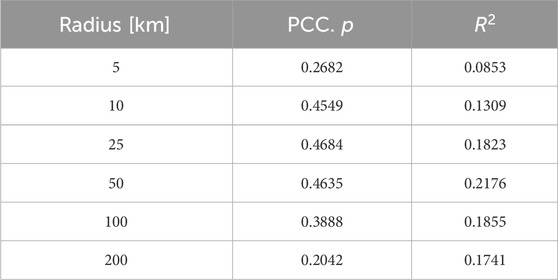
Table 2. Correlation of population density and MP concentration for different radii.
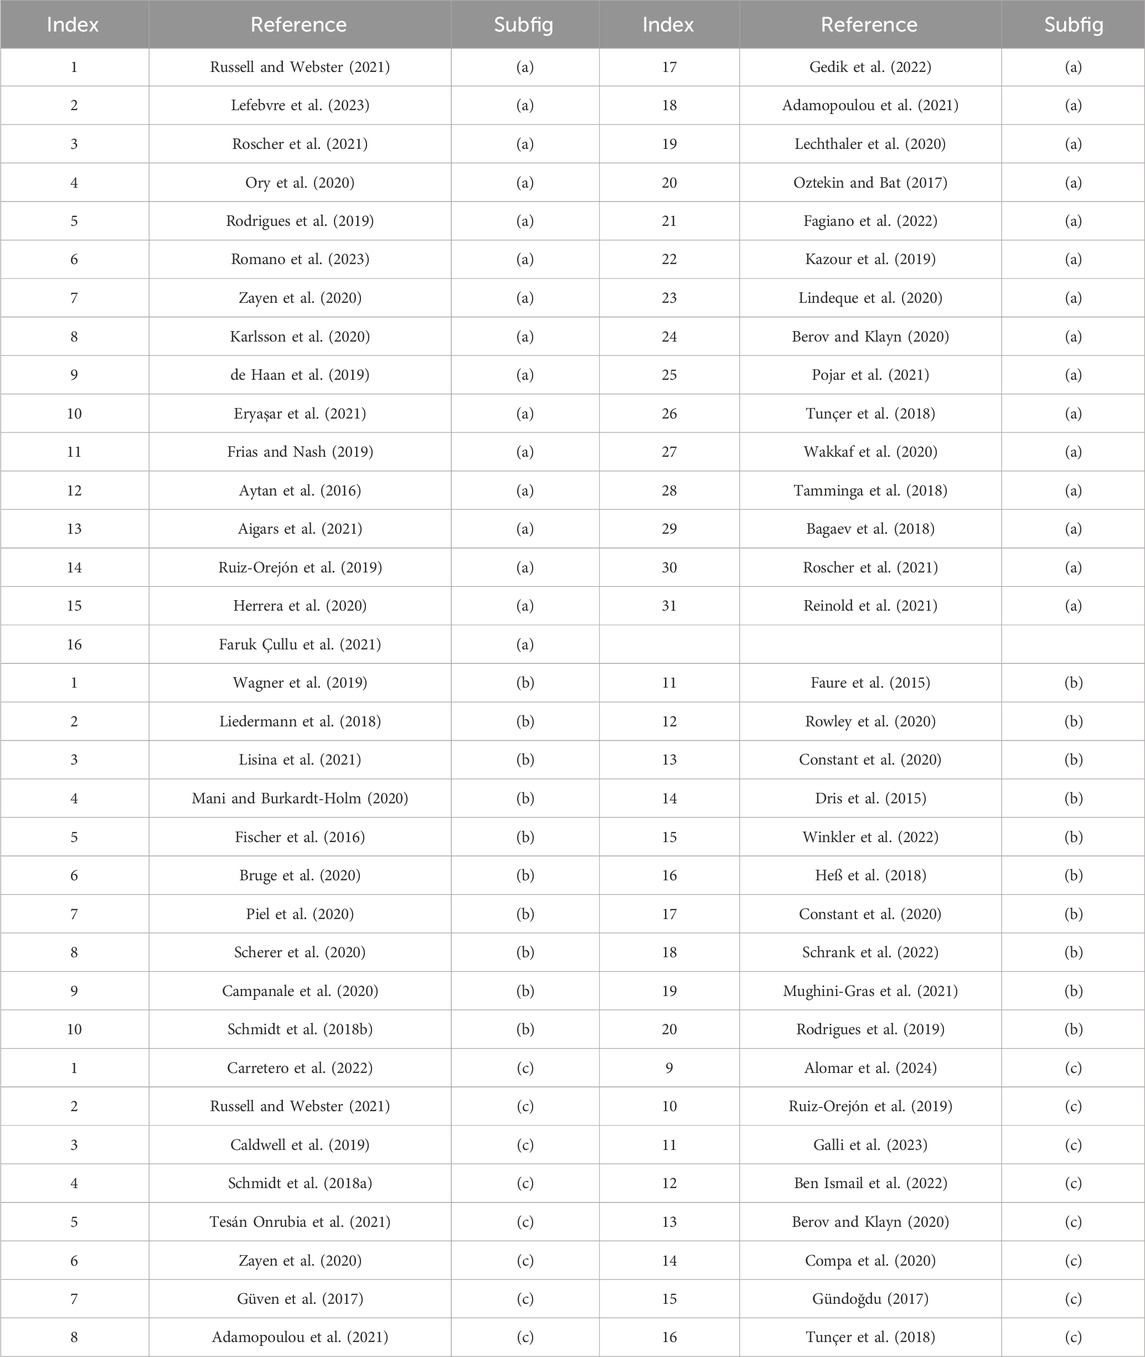
Table 3. Publications used in Figure 3.
Since the population density could only be calculated for the sampling stations with sufficient data within the specified radius, sampling points near the edge of the population data were not considered for larger radii. This exclusion may result in fewer extremes and, consequently, better fits in the analysis. As shown, population density in an area does seem to have an influence on the microplastic concentration, even though the correlation is relatively weak. This may be due to the fact that population density is not directly correlated with all anthropogenic activities. For example, industrial areas can exist without any population density (Gao et al., 2023a; Klein et al., 2015) and also tourism activities are not represented in this metric, which becomes particularly relevant in tourism hot spots (Sighicelli et al., 2018; Asenova et al., 2021; Fischer et al., 2016). Generally, the population density–especially for fresh water sampling–shows a significant correlation and has a much larger impact compared to the other factors investigated in this study (Mani and Burkardt-Holm, 2020; Correa-Araneda et al., 2022; Kataoka et al., 2019).
3.2.4 Distance to next coastline
In addition to the previously mentioned factors, the distance to the next coastline was analyzed for the oceanic sampling points. Similar to the findings for the WWTP outlets, the distance to the next coastline was found to also not have a significant influence on the MP concentration in the water samples. Figure 9 shows the influence of the distance to the next coastline on the MP concentration in the water samples for all samples (a) as well as for only the samples taken with a net size of 300 μm–350 µm (b). With a PCC of
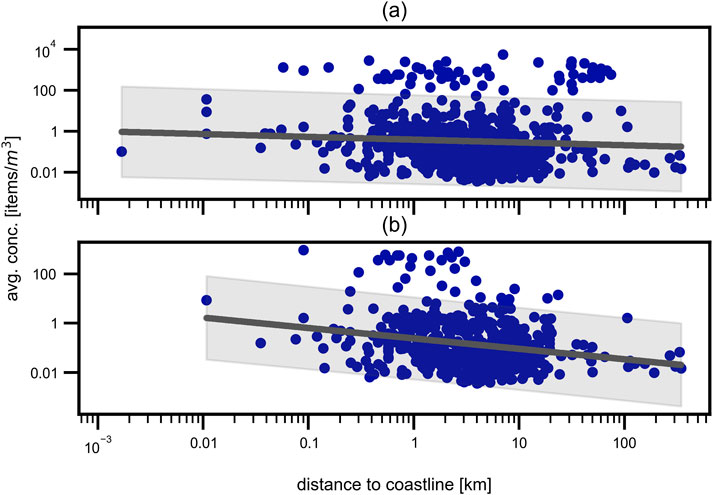
Figure 9. Distance to next coastline. Influence of distance to next coastline on the average microplastic concentration for (a) all oceanic sampling points and (b) only marine samples taken with a mesh size of 300 μm–350 µm. Only a small, non-significant tendency is visible.
In literature, often a correlation between MP concentration and distance to coast is assumed, but the results are differing heavily, ranging from no correlation (Aytan et al., 2016; Eryaşar et al., 2021; Fagiano et al., 2022; Kermenidou et al., 2023; Wakkaf et al., 2020; Zeri et al., 2018) over the expected negative correlation (Compa et al., 2020; Alomar et al., 2024; Galli et al., 2023) up to a positive correlation (Hansen et al., 2023; Lechthaler et al., 2020). Pakhomova et al. (2022) found a negative correlation for abundance of fibers with distance to coast, but no correlation for fragments. Fagiano et al. (2022) stated location to be more important for MP abundances than distance to coastlines, whereas Adamopoulou et al. (2021) highlighted the importance of ocean currents. These ambivalent results are reflected by the results obtained in this review.
3.2.5 Wind speed and seasonal influence
In literature, wind speed is assumed to have a strong impact on measured concentrations in surface waters due to wind induced mixing (Kukulka et al., 2012; Reisser et al., 2015). Especially, Kukulka et al. (2012) found a strong effect of wind mixing on the vertical MP distribution and therefore introduced a correction factor to calculate the actual MP concentration for wind speeds
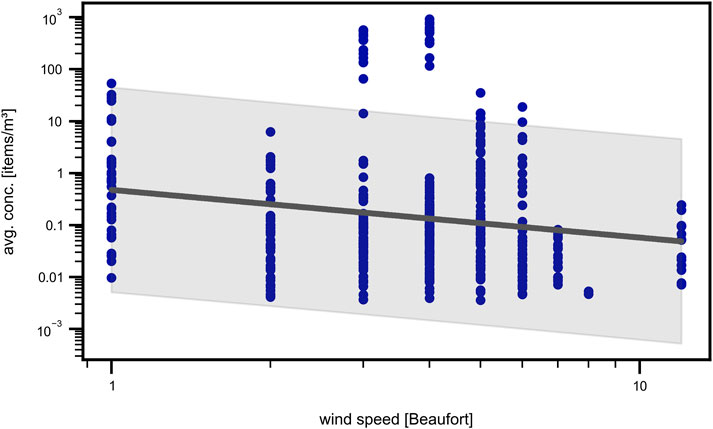
Figure 10. Wind speed. Scatter plot of volumetric concentration versus wind speed in Beaufort on a double logarithmic scale with linear regression (gray). A decreasing tendency is observed.
The weak correlation observed in our data suggests that the influence of wind speed on MP concentration may not be as straightforward or significant as previously reported. While earlier studies have emphasized the role of wind-induced mixing, our results indicate that this effect may be overestimated, or that other factors, not accounted for in those studies, could be influencing MP distribution. This raises important questions about the generalizability of the correction factor across different environments and conditions, emphasizing the need for further research to reassess its applicability.
Often assumed is also a dependence of measured concentration on season in which the sampling took place, but the opinions on which seasons show high or low concentrations differ (Rodrigues et al., 2019; Faruk Çullu et al., 2021; Adamopoulou et al., 2021; Aytan et al., 2016; Ben Ismail et al., 2022; Oztekin and Bat, 2017; Ruiz-Orejón et al., 2019; Tesán Onrubia et al., 2021). Exemplary, Faruk Çullu et al. (2021) found the highest MP concentration in autumn and identified seasonal differences in the occurrence of the MP species (fragments dominate in autumn and winter, fibers in spring and summer), similar to Adamopoulou et al. (2021) and Aytan et al. (2016) who found the highest concentration in autumn. They emphasized the correlation with rain events during the same day or 10 days in advance of sampling. Contrary, Ben Ismail et al. (2022) found the lowest concentration during autumn and highest concentration in spring. Similarly, Oztekin and Bat (2017) found highest MP abundances in spring and lowest values in winter. Ruiz-Orejón et al. (2019) and Tesán Onrubia et al. (2021) found the summer season to show the highest MP concentrations. Carretero et al. (2022) did not find significant differences between the MP abundances for different months, which aligns with findings of other studies (Reinold et al., 2021; Schmidt et al., 2018b). Generally, seasons represent combinations of several environmental factors, such as precipitation, temperature or wind speed, which should best be evaluated separately. Due to different climate zones in the reviewed studies (sub polar, temperate, subtropical) these environmental factors may differ heavily and increase the complexity of the evaluation. Furthermore, other factors which influence the MP concentration, such as tourism activity (Compa et al., 2020; Alomar et al., 2024; Galli et al., 2023; Ruiz-Orejón et al., 2019) or ocean currents (Adamopoulou et al., 2021; Tunçer et al., 2018; Ben Ismail et al., 2022; Pakhomova et al., 2022; Tunçer et al., 2018), might as well depend on seasons.
Although this meta-analysis includes only studies from European aquatic environments, substantial differences in rainfall regimes and touristic pressures can still be expected across sampling locations. To better resolve regional patterns in seasonal MP concentrations, sampling sites were grouped by latitude into three zones: (1) Mediterranean (35 deg N to 45 deg N), (2) Central Europe (45 deg N to 55 deg N), (3) Northern Europe (55deg N to 75deg N). A boxplot for the different seasons, comparing the three different regions is shown in Figure 11. In both Northern and Central Europe, the highest concentrations of MPs were observed in spring, followed by summer, autumn, and winter. In contrast, Mediterranean regions exhibited peak MP concentrations in summer, followed by spring, autumn, and winter. Pairwise comparison shows statistically significant seasonal variation in both Mediterranean and Northern regions, whereas in central Europe, concentrations in summer and autumn did not differ significantly. The observed seasonal patterns in microplastic concentrations appear to reflect distinct combinations of anthropogenic and climatic drivers. In Mediterranean Europe, significantly elevated MP levels are likely linked to intense seasonal tourism, increased recreational activity and limited hydrological flushing due to dry conditions. In Northern Europe peak concentrations in spring are potentially caused by snow-melt and rainfall, mobilizing accumulated plastic debris into aquatic systems. The similar tendency observed in Central Europe, combined with the lack of significance between summer and autumn, suggests a more uniform year-round input of MP, likely from continuous urban, agricultural, or industrial sources and less pronounced climatic seasonality.
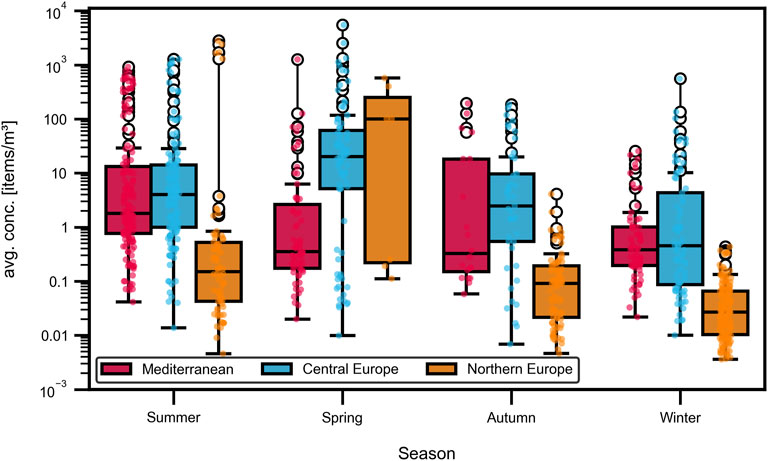
Figure 11. Seasonal influence. Boxplot of volumetric season vs. concentrations for the geographic subdivisions, on a logarithmic scale. Autumn and Winter show smaller median values than summer and spring.
These results underscore the complex interplay of multiple environmental and anthropogenic factors, indicating that MP abundance cannot be linked solely to the season. However, the influence of season remains significant and should not be underestimated.
4 Conclusion
This meta-analysis explores the factors influencing MP concentrations in aquatic environments, focusing on sampling location in terms of latitude, mesh size, proximity to WWTP outlets, population density, distance to coastlines, and the effects of seasonal variations and wind speed.
A summary of the results regarding influences on the microplastic pollution of water systems is given in Figure 12. The analysis reveals that mesh size significantly impacts MP concentration measurements, especially in marine environments where smaller mesh sizes tend to capture higher concentrations of MP. In contrast, freshwater systems show no consistent trend, likely due to the presence of primary MP with shorter residence times. These findings highlight the need for standardized sampling methods to improve comparability across studies. Future research should also expand the geographical scope to include non-European regions and further investigate other environmental factors influencing MP pollution. The recommendations provided are crucial for enhancing the consistency and reliability of future studies, contributing to a more cohesive understanding of microplastic pollution in aquatic environments. The relationship between MP concentrations and proximity to WWTPs is complex, with no significant correlation found in this study. This suggests that while WWTPs are known sources of MP, other factors such as surface runoff, atmospheric deposition, and industrial discharges also play significant roles in MP pollution. Population density shows a weak but notable correlation with MP concentrations, particularly in freshwater systems. This correlation peaks at certain radii around sampling points, indicating that local population density may influence MP pollution more than broader regional population levels. Seasonal variations are also important factors influencing MP concentrations. MP levels tend to be higher during certain seasons, likely due to increased rainfall and runoff, which mobilize MP from land-based sources as well as increased touristic pressures. Wind speed did not show statistical significant impact on the distribution of MP, opposing previously published studies. Lastly, the study finds no significant correlation between MP concentrations and distance to coastlines in marine environments. This challenges the assumption that proximity to the coast has a large impact on the found MP concentrations in oceanic waters.
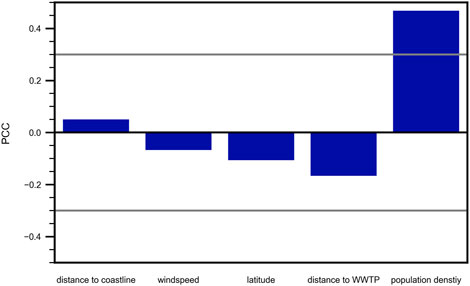
Figure 12. Summary of correlations. Examined correlations with their respective PCC ordered by increasing significance, with only the population density being significant
The findings of this study corroborate the observations by Koelmans et al. (2019), who reported significant variability in microplastic concentrations across freshwater systems, attributing this to differences in sampling methodologies and regional characteristics. By focusing in European rivers, this meta analysis reduces such variability, providing a more consistent dataset for analysis Furthermore, the influence of seasonal variations observed in this study align with the findings of Hurley et al. (2018), who documented the impact of flooding events on microplastic mobilization in river sediments.
A clear limitation of this meta analysis is the sample processing variability. Similar to the amount of different sampling approaches, different post processing approaches of the samples exist (Koelmans et al., 2019; Primpke et al., 2017; Mani and Burkardt-Holm, 2020; Sekudewicz et al., 2021; Lambert and Wagner, 2018; Obermaier and Pistocci, 2022; Bexeitova et al., 2024b). Since different analysis methods yield different characteristics, often the post processing is determined by the aim of the study. Additionally, for example, in manual counting and classifying under a microscope, bias can be introduced methodologically. Since this meta analysis does not account for the different analysis methods, the impact on this studies results can not be quantified. No recommendations therefore will be made in the following regarding sample processing and analysis after the sampling campaign.
5 Recommendations
Based on the present meta-data study, we provide the following recommendations for future MP sampling to enhance the comparability of studies. These recommendations are based on already existing recommendations (Kovač Viršek et al., 2016; Gago et al., 2018; Kershaw et al., 2019; Pasquier et al., 2022; Bexeitova et al., 2024b), as well as on the most frequently used parameters for volume-reduced sampling among the reviewed studies. Analyzing the previous sampling campaign ensures that future studies are comparable to the largest amount of already published data. The frequency distribution of previously used sampling methods is shown in Figure 13.
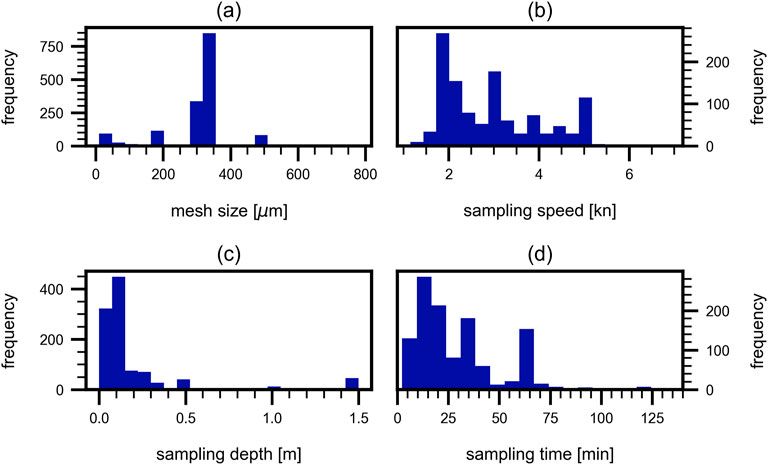
Figure 13. Frequency of different sampling methods. Frequency of four different parameters during sampling: (a) mesh size, (b) sampling speed, (c) sampling depth and (d) sampling time. For (a, c) clear peaks at 300 μm–350 µm mesh size and around 0.1 m are observable, whereas (b, d) show wider distributions.
Although continuous sampling is ideal when executed correctly, this study recommends volume-reduced sampling as sampling method due to its ease of implementation, cost-effectiveness, and frequent usage in current research. The use of a flow meter is strongly recommended to accurately measure the volume of water filtered during sampling, ensuring precise quantification of MP concentrations (Pasquier et al., 2022). Furthermore, Pasquier et al. (2022) emphasized the lack of replicate sampling in their reviewed studies and suggest to perform three replicates of 10 min–20 min each to minimize the risk of clogging and to enhance reproducibility.
Figure 13a indicates a clear preference for mesh sizes ranging from 300 μm to 350 µm. Despite the known limitation that this range underestimates the total MP amount, it allows for the comparison of different locations and is therefore recommended. The most common sampling depth is around 0.1 m, typically with maximum half of the net submerged (Figure 13b). To enable optimal comparison, the same net dimensions should ideally be used consistently. Among the reviewed studies in this work, the most commonly used net dimensions were 0.4 by 0.7 m. Sampling speed shows a wide distribution among the considered studies (Figure 13c) and should be kept low to prevent fast clogging and water flowing around the sampling device. Speeds of less than 3 kn are advisable to maintain sample integrity and avoid net obstruction. While sampling times vary widely (Figure 13d), often extending beyond 60 min, this practice should be avoided. Instead, as previously mentioned, a maximum sampling duration of 10 min–20 min is recommended to balance thoroughness and practicality.
By adhering to these recommendations, future MP studies can achieve greater consistency and comparability, facilitating a more comprehensive understanding of MP pollution across different aquatic environments. A broad study adhering to the recommended sampling method, and sampling waters especially in locations where common assumptions see influences, such as proximity to WWTPs, coastlines or higher population density as well as the influence of particle degradation in rivers and oceans would lead to a more comprehensive understanding of effects and correlations and can lead to the identification of key sources of microplastics which in turn can help to reduce the overall microplastic pollution in rivers and oceans and decrease the associated health and environmental risks.
Data availability statement
The original contributions presented in the study are included in the article/Supplementary Material, further inquiries can be directed to the corresponding author.
Author contributions
LH: Conceptualization, Data curation, Investigation, Methodology, Software, Validation, Visualization, Writing – original draft, Writing – review and editing. LG: Conceptualization, Data curation, Formal Analysis, Investigation, Methodology, Software, Validation, Visualization, Writing – original draft, Writing – review and editing. SS: Conceptualization, Project administration, Supervision, Validation, Writing – review and editing.
Funding
The author(s) declare that no financial support was received for the research and/or publication of this article.
Conflict of interest
The authors declare that the research was conducted in the absence of any commercial or financial relationships that could be construed as a potential conflict of interest.
Generative AI statement
The authors declare that Gen AI was used in the creation of this manuscript. ChatGPT was used to assist in the development of some code for data analysis. No AI tools were used in the conceptualization, interpretation of results, or writing of the manuscript.
Publisher’s note
All claims expressed in this article are solely those of the authors and do not necessarily represent those of their affiliated organizations, or those of the publisher, the editors and the reviewers. Any product that may be evaluated in this article, or claim that may be made by its manufacturer, is not guaranteed or endorsed by the publisher.
Supplementary material
The Supplementary Material for this article can be found online at: https://www.frontiersin.org/articles/10.3389/fenvs.2025.1600570/full#supplementary-material
References
Adamopoulou, A., Zeri, C., Garaventa, F., Gambardella, C., Ioakeimidis, C., and Pitta, E. (2021). Distribution patterns of floating microplastics in open and coastal waters of the eastern mediterranean sea (ionian, aegean, and levantine seas). Front. Mar. Sci. 8. doi:10.3389/fmars.2021.699000
Aigars, J., Barone, M., Suhareva, N., Putna-Nimane, I., and Dimante-Deimantovica, I. (2021). Occurrence and spatial distribution of microplastics in the surface waters of the baltic sea and the gulf of riga. Mar. Pollut. Bull. 172, 112860. doi:10.1016/j.marpolbul.2021.112860
Alomar, C., Rios-Fuster, B., Cefalì, M. E., Fagiano, V., and Deudero, S. (2024). Monitoring microplastics in coastal waters of a biosphere reserve: a case study in menorca (Spain). Environ. Sci. Pollut. Res. Int. 31, 882–894. doi:10.1007/s11356-023-31061-y
Arthur, C., Baker, J. E., and Bamford, H. A. (2009). Proceedings of the international research workshop on the occurrence, effects, and fate of microplastic marine debris, september 9-11, 2008, university of Washington tacoma, tacoma, wa, USA
Asenova, M., Bannick, C. G., Bednarz, M., Kerndorff, A., Obermaier, N., Ricking, M., et al. (2021). Occurrence of microplastics in the daubne river – a first screening. Jt. Daubne Surv. 4 (JDS4). doi:10.60810/openumwelt-131
Aytan, U., Valente, A., Senturk, Y., Usta, R., Esensoy Sahin, F. B., Mazlum, R. E., et al. (2016). First evaluation of neustonic microplastics in black sea waters. Mar. Environ. Res. 119, 22–30. doi:10.1016/j.marenvres.2016.05.009
Bagaev, A., Khatmullina, L., and Chubarenko, I. (2018). Anthropogenic microlitter in the baltic sea water column. Mar. Pollut. Bull. 129, 918–923. doi:10.1016/j.marpolbul.2017.10.049
Baldwin, A. K., Corsi, S. R., and Mason, S. A. (2016). Plastic debris in 29 great lakes tributaries: relations to watershed attributes and hydrology. Environ. Sci. and Technol. 50, 10377–10385. doi:10.1021/acs.est.6b02917
Ben Ismail, S., Costa, E., Jaziri, H., Morgana, S., Boukthir, M., Ben Ismail, M. A., et al. (2022). Evolution of the distribution and dynamic of microplastic in water and biota: a study case from the gulf of gabes (southern mediterranean sea). Front. Mar. Sci. 9. doi:10.3389/fmars.2022.786026
Berov, D., and Klayn, S. (2020). Microplastics and floating litter pollution in Bulgarian black sea coastal waters. Mar. Pollut. Bull. 156, 111225. doi:10.1016/j.marpolbul.2020.111225
Bexeitova, K., Baimenov, A., Varol, E., Kudaibergenov, K., Zhantikeyev, U., Sailaukhanuly, Y., et al. (2024a). Microplastics in freshwater systems: a review of classification, sources, and environmental impacts. Chem. Eng. J. Adv. 20, 100649. doi:10.1016/j.ceja.2024.100649
Bexeitova, K., Zhantikeyev, U., Yeszhan, Y., Sapargali, I., Kudaibergenov, K., Toshtay, K., et al. (2024b). Evaluating microplastic detection techniques in human-impacted water systems: a mini-review. ES Energy and Environ. 25, 1233. doi:10.30919/esee1233
Brach, L., Deixonne, P., Bernard, M.-F., Durand, E., Desjean, M.-C., Perez, E., et al. (2018). Anticyclonic eddies increase accumulation of microplastic in the north atlantic subtropical gyre. Mar. Pollut. Bull. 126, 191–196. doi:10.1016/j.marpolbul.2017.10.077
Bruge, A., Dhamelincourt, A., Lanceleur, L., Monperrus, M., Gspero, J., and Tassin, B. (2020). A first estimation of uncertainties related to microplastic sampling in rivers. Sci. Total Environ. 718, 137319. doi:10.1016/j.scitotenv.2020.137319
Caldwell, J., Petri-Fink, A., Rothen-Rutishauser, B., and Lehner, R. (2019). Assessing meso- and microplastic pollution in the ligurian and tyrrhenian seas. Mar. Pollut. Bull. 149, 110572. doi:10.1016/j.marpolbul.2019.110572
Campanale, C., Stock, F., Massarelli, C., Kochleus, C., Bagnuolo, G., Reifferscheid, G., et al. (2020). Microplastics and their possible sources: the example of ofanto river in southeast Italy. Environ. Pollut. 258, 113284. doi:10.1016/j.envpol.2019.113284
Carretero, O., Gago, J., Filgueiras, A. V., and Viñas, L. (2022). The seasonal cycle of micro and meso-plastics in surface waters in a coastal environment (Ría de Vigo, NW Spain). Sci. total Environ. 803, 150021. doi:10.1016/j.scitotenv.2021.150021
Cera, A., Cesarini, G., and Scalici, M. (2020). Microplastics in freshwater: what is the news from the world? Diversity 12, 276. doi:10.3390/d12070276
Chen, C., Pagsuyoin, S. A., van Emmerik, T. H., Xu, Y.-y., He, Y.-q., Guo, Z.-f., et al. (2024). Significant regional disparities in riverine microplastics. J. Hazard. Mater. 472, 134571. doi:10.1016/j.jhazmat.2024.134571
Compa, M., Alomar, C., Mourre, B., March, D., Tintoré, J., and Deudero, S. (2020). Nearshore spatio-temporal sea surface trawls of plastic debris in the balearic islands. Mar. Environ. Res. 158, 104945. doi:10.1016/j.marenvres.2020.104945
Constant, M., Ludwig, W., Kerhervé, P., Sola, J., Charrière, B., Sanchez-Vidal, A., et al. (2020). Microplastic fluxes in a large and a small mediterranean river catchments: the têt and the rhône, northwestern mediterranean sea. Sci. Total Environ. 716, 136984. doi:10.1016/j.scitotenv.2020.136984
Correa-Araneda, F., Perez, J., Tonin, A., M. Esse, C., Boyero, L., Diaz, M., et al. (2022). Microplastic concentration, distribution and dynamics along one of the largest mediterranean-climate rivers: a whole watershed approach. Environ. Res. 209, 112808. doi:10.1016/j.envres.2022.112808
Cutroneo, L., Reboa, A., Besio, G., Borgogno, F., Canesi, L., Canuto, S., et al. (2020). Microplastics in seawater: sampling strategies, laboratory methodologies, and identification techniques applied to port environment. Environ. Sci. Pollut. Res. Int. 27, 8938–8952. doi:10.1007/s11356-020-07783-8
de Haan, W. P., Sanchez-Vidal, A., and Canals, M. (2019). Floating microplastics and aggregate formation in the western mediterranean sea. Mar. Pollut. Bull. 140, 523–535. doi:10.1016/j.marpolbul.2019.01.053
Devereux, R., Westhead, E. K., Jayaratne, R., and Newport, D. (2022). Microplastic abundance in the thames river during the new year period. Mar. Pollut. Bull. 177, 113534. doi:10.1016/j.marpolbul.2022.113534
Dris, R., Gasperi, J., Rocher, V., Saad, M., Renault, N., and Tassin, B. (2015). Microplastic contamination in an urban area: a case study in greater paris. Environ. Chem. 12, 592–599. doi:10.1071/EN14167
Dris, R., Gasperi, J., Rocher, V., and Tassin, B. (2018). Synthetic and non-synthetic anthropogenic fibers in a river under the impact of paris megacity: sampling methodological aspects and flux estimations. Sci. Total Environ. 618, 157–164. doi:10.1016/j.scitotenv.2017.11.009
Eerkes-Medrano, D., Thompson, R. C., and Aldridge, D. C. (2015). Microplastics in freshwater systems: a review of the emerging threats, identification of knowledge gaps and prioritisation of research needs. Water Res. 75, 63–82. doi:10.1016/j.watres.2015.02.012
Eryaşar, A. R., Gedik, K., Şahin, A., Öztürk, R. Ç., and Yılmaz, F. (2021). Characteristics and temporal trends of microplastics in the coastal area in the southern black sea over the past decade. Mar. Pollut. Bull. 173, 112993. doi:10.1016/j.marpolbul.2021.112993
European Environment Agency (2024). The role of plastics in Europe’s circular economy — eea.europa.eu. Available online at: https://www.eea.europa.eu/publications/the-role-of-plastics-in-europe (Accessed May 07, 2025).
Fagiano, V., Alomar, C., Compa, M., Soto-Navarro, J., Jordá, G., and Deudero, S. (2022). Neustonic microplastics and zooplankton in coastal waters of cabrera marine protected area (western mediterranean sea). Sci. total Environ. 804, 150120. doi:10.1016/j.scitotenv.2021.150120
Faruk Çullu, A., Sönmez, V. Z., and Sivri, N. (2021). Microplastic contamination in surface waters of the Küçükçekmece Lagoon, Marmara Sea (Turkey): sources and areal distribution. Environ. Pollut. (Barking, Essex 1987) 268, 115801. doi:10.1016/j.envpol.2020.115801
Faure, F., Demars, C., Wieser, O., Kunz, M., and de Alencastro, L. F. (2015). Plastic pollution in Swiss surface waters: nature and concentrations, interaction with pollutants. Environ. Chem. 12, 582. doi:10.1071/EN14218
Fischer, E. K., Paglialonga, L., Czech, E., and Tamminga, M. (2016). Microplastic pollution in lakes and lake shoreline sediments – a case study on Lake Bolsena and Lake Chiusi (central Italy). Environ. Pollut. 213, 648–657. doi:10.1016/j.envpol.2016.03.012
Freedman, D., Pisani, R., and Purves, R. (2007). Statistics (international student edition). 4th edn. New York: WW Norton and Company.
Frias, J. P., and Nash, R. (2019). Microplastics: finding a consensus on the definition. Mar. Pollut. Bull. 138, 145–147. doi:10.1016/j.marpolbul.2018.11.022
Frias, J. P. G. L., Lyashevska, O., Joyce, H., Pagter, E., and Nash, R. (2020). Floating microplastics in a coastal embayment: a multifaceted issue. Mar. Pollut. Bull. 158, 111361. doi:10.1016/j.marpolbul.2020.111361
Funck, M., Al-Azzawi, M. S., Yildirim, A., Knoop, O., Schmidt, T. C., Drewes, J. E., et al. (2021). Release of microplastic particles to the aquatic environment via wastewater treatment plants: the impact of sand filters as tertiary treatment. Chem. Eng. J. 426, 130933. doi:10.1016/j.cej.2021.130933
Gago, J., Filgueiras, A. V., and Pedrotti, M. L. (2018). Standardised protocol for monitoring microplastics in seawater: wp4 sampling methodologies for microplastics in the marine environment: standardisation, suitability and intercomparison
Galli, M., Baini, M., Panti, C., Giani, D., Caliani, I., Campani, T., et al. (2023). Oceanographic and anthropogenic variables driving marine litter distribution in mediterranean protected areas: extensive field data supported by forecasting modelling. Sci. total Environ. 903, 166266. doi:10.1016/j.scitotenv.2023.166266
Galloway, T. S. (2015). “Micro-and nano-plastics and human health,”. Springer, 343–366. chap. 13. doi:10.1007/978-3-319-16510-3_13
Gao, H., Qi, Z., Yu, X., An, Y., Liu, Z., Yang, M., et al. (2023a). Effect of salinity and temperature on the dispersion of spilled oil in the presence of microplastics. J. Mar. Sci. Eng. 11, 791. doi:10.3390/jmse11040791
Gao, S., Orlowski, N., Bopf, F. K., and Breuer, L. (2023b). A review on microplastics in major european rivers. Wires Water 11. doi:10.1002/wat2.1713
Gedik, K., Eryaşar, A. R., Öztürk, R. Ç., Mutlu, E., Karaoğlu, K., Şahin, A., et al. (2022). The broad-scale microplastic distribution in surface water and sediments along northeastern mediterranean shoreline. Sci. total Environ. 843, 157038. doi:10.1016/j.scitotenv.2022.157038
Gewert, B., Ogonowski, M., Barth, A., and MacLeod, M. (2017). Abundance and composition of near surface microplastics and plastic debris in the stockholm archipelago, baltic sea. Mar. Pollut. Bull. 120, 292–302. doi:10.1016/j.marpolbul.2017.04.062
Gündoğdu, S. (2017). High level of micro-plastic pollution in the iskenderun bay ne levantine coast of Turkey. Ege J. Fish. Aquatic Sci. 34, 401–408. doi:10.12714/egejfas.2017.34.4.06
Gündoğdu, S., and Çevik, C. (2017). Micro- and mesoplastics in northeast levantine coast of Turkey: the preliminary results from surface samples. Mar. Pollut. Bull. 118, 341–347. doi:10.1016/j.marpolbul.2017.03.002
Güven, O., Gökdağ, K., Jovanović, B., and Kıdeyş, A. E. (2017). Microplastic litter composition of the Turkish territorial waters of the mediterranean sea, and its occurrence in the gastrointestinal tract of fish. Environ. Pollut. (Barking, Essex 1987) 223, 286–294. doi:10.1016/j.envpol.2017.01.025
Habib, D., Locke, D. C., and Cannone, L. J. (1998). Synthetic fibers as indicators of municipal sewage sludge, sludge products, and sewage treatment plant effluents. Water, Air, Soil Pollut. 103, 1–8. doi:10.1023/A:1004908110793
Haddaway, N. R., Page, M. J., Pritchard, C. C., and McGuinness, L. A. (2022). Prisma2020: an r package and shiny app for producing prisma 2020-compliant flow diagrams, with interactivity for optimised digital transparency and open synthesis. Campbell Syst. Rev. 18, e1230. doi:10.1002/cl2.1230
Hansen, J., Hildebrandt, L., Zimmermann, T., El Gareb, F., Fischer, E. K., and Pröfrock, D. (2023). Quantification and characterization of microplastics in surface water samples from the northeast atlantic ocean using laser direct infrared imaging. Mar. Pollut. Bull. 190, 114880. doi:10.1016/j.marpolbul.2023.114880
Hashmi, M. Z. (2022). Microplastic pollution: environmental occurrence and treatment technologies. Springer Nature.
Herrera, A., Raymond, E., Martínez, I., Álvarez, S., Canning-Clode, J., Gestoso, I., et al. (2020). First evaluation of neustonic microplastics in the macaronesian region, ne atlantic. Mar. Pollut. Bull. 153, 110999. doi:10.1016/j.marpolbul.2020.110999
Heß, M., Diehl, P., Mayer, J., Rahm, H., Reifenhäuser, W., Stark, J., et al. (2018). Mikroplastik in Binnengewässern Süd-und Westdeutschlands Bundesländerübergreifende Untersuchungen in Baden-Württemberg, Bayern, Hessen, Nordrhein-Westfalen und Rheinland-Pfalz. Rep. Landesanst. für Umw. Württemb. (LUBW).
Hidalgo-Ruz, V., Gutow, L., Thompson, R. C., and Thiel, M. (2012). Microplastics in the marine environment: a review of the methods used for identification and quantification. Environ. Sci. and Technol. 46, 3060–3075. doi:10.1021/es2031505
Hildebrandt, L., Zimmermann, T., Primpke, S., Fischer, D., Gerdts, G., and Pröfrock, D. (2021). Comparison and uncertainty evaluation of two centrifugal separators for microplastic sampling. J. Hazard. Mater. 414, 125482. doi:10.1016/j.jhazmat.2021.125482
Horton, A. A., Walton, A., Spurgeon, D. J., Lahive, E., and Svendsen, C. (2017). Microplastics in freshwater and terrestrial environments: evaluating the current understanding to identify the knowledge gaps and future research priorities. Sci. total Environ. 586, 127–141. doi:10.1016/j.scitotenv.2017.01.190
Hurley, R., Woodward, J., and Rothwell, J. J. (2018). Microplastic contamination of river beds significantly reduced by catchment-wide flooding. Nat. Geosci. 11, 251–257. doi:10.1038/s41561-018-0080-1
Joint Research Centre Data Catalogue (2024). Global human settlement layer. Available online at: https://ghsl.jrc.ec.europa.eu.
Karlsson, T. M., Kärrman, A., Rotander, A., and Hassellöv, M. (2020). Comparison between manta trawl and in situ pump filtration methods, and guidance for visual identification of microplastics in surface waters. Environ. Sci. Pollut. Res. Int. 27, 5559–5571. doi:10.1007/s11356-019-07274-5
Kataoka, T., Nihei, Y., Kudou, K., and Hinata, H. (2019). Assessment of the sources and inflow processes of microplastics in the river environments of Japan. Environ. Pollut. 244, 958–965. doi:10.1016/j.envpol.2018.10.111
Kataoka, T., Tanaka, M., Mukotaka, A., and Nihei, Y. (2023). Experimental uncertainty assessment of meso- and microplastic concentrations in rivers based on net sampling. Sci. Total Environ. 870, 161942. doi:10.1016/j.scitotenv.2023.161942
Kazour, M., Jemaa, S., Issa, C., Khalaf, G., and Amara, R. (2019). Microplastics pollution along the lebanese coast (eastern mediterranean basin): occurrence in surface water, sediments and biota samples. Sci. total Environ. 696, 133933. doi:10.1016/j.scitotenv.2019.133933
Kermenidou, M., Frydas, I. S., Moschoula, E., Kousis, D., Christofilos, D., Karakitsios, S., et al. (2023). Quantification and characterization of microplastics in the thermaic gulf, in the north aegean sea. Sci. total Environ. 892, 164299. doi:10.1016/j.scitotenv.2023.164299
Kershaw, P., Turra, A., and Galgani, F. (2019). Guidelines for the monitoring and assesmant of plastic litter in the ocean
Klein, S., Worch, E., and Knepper, T. (2015). Microplastics in the rhine-main area in Germany: occurrence, spatial distribution and sorption of organic contaminants. Environ. Sci. and Technol. 49, 2–3. doi:10.1021/acs.est.5b00492
Koelmans, A. A., Nor, N. H. M., Hermsen, E., Kooi, M., Mintenig, S. M., and De France, J. (2019). Microplastics in freshwaters and drinking water: critical review and assessment of data quality. Water Res. 155, 410–422. doi:10.1016/j.watres.2019.02.054
Kovač Viršek, M., Palatinus, A., Koren, Š., Peterlin, M., Horvat, P., and Kržan, A. (2016). Protocol for microplastics sampling on the sea surface and sample analysis. J. Vis. Exp. JoVE, 55161. doi:10.3791/55161
Kruskal, W. H., and Wallis, W. A. (1952). Use of ranks in one-criterion variance analysis. J. Am. Stat. Assoc. 47, 583–621. doi:10.2307/2280779
Kukulka, T., Proskurowski, G., Morét-Ferguson, S., Meyer, D. W., and Law, K. L. (2012). The effect of wind mixing on the vertical distribution of buoyant plastic debris. Geophys. Res. Lett. 39. doi:10.1029/2012GL051116
La Kanhai, D. K., Officer, R., Lyashevska, O., Thompson, R. C., and O’Connor, I. (2017). Microplastic abundance, distribution and composition along a latitudinal gradient in the atlantic ocean. Mar. Pollut. Bull. 115, 307–314. doi:10.1016/j.marpolbul.2016.12.025
Lambert, S., and Wagner, M. (2018). Microplastics are contaminants of emerging concern in freshwater environments: an overview. Springer International Publishing.
Lares, M., Ncibi, M. C., Sillanpää, M., and Sillanpää, M. (2018). Occurrence, identification and removal of microplastic particles and fibers in conventional activated sludge process and advanced mbr technology. Water Res. 133, 236–246. doi:10.1016/j.watres.2018.01.049
Lechner, A., and Ramler, D. (2015). The discharge of certain amounts of industrial microplastic from a production plant into the river danube is permitted by the austrian legislation. Environ. Pollut. 200, 159–160. doi:10.1016/j.envpol.2015.02.019
Lechthaler, S., Schwarzbauer, J., Reicherter, K., Stauch, G., and Schüttrumpf, H. (2020). Regional study of microplastics in surface waters and deep sea sediments south of the algarve coast. Regional Stud. Mar. Sci. 40, 101488. doi:10.1016/j.rsma.2020.101488
Lefebvre, C., Le Bihanic, F., Jalón-Rojas, I., Dusacre, E., Chassaigne, L., Bichon, J., et al. (2023). Spatial distribution of anthropogenic particles and microplastics in a meso-tidal lagoon (arcachon bay, France): a multi-compartment approach. Sci. Total Environ. 898, 165460. doi:10.1016/j.scitotenv.2023.165460
Liedermann, M., Gmeiner, P., Pessenlehner, S., Haimann, M., Hohenblum, P., and Habersack, H. (2018). A methodology for measuring microplastic transport in large or medium rivers. water 10, 414. doi:10.3390/w10040414
Lindeque, P. K., Cole, M., Coppock, R. L., Lewis, C. N., Miller, R. Z., Watts, A. J., et al. (2020). Are we underestimating microplastic abundance in the marine environment? a comparison of microplastic capture with nets of different mesh-size. Environ. Pollut. (Barking, Essex 1987) 265, 114721. doi:10.1016/j.envpol.2020.114721
Lisina, A. A., Platonov, M. M., Lomakov, O. I., Saznov, A. A., Shishova, T. V., Berkovich, A. K., et al. (2021). Microplastic abundance in volga river: results of A pilot study in summer 2020. Geogr. Environ. Sustain. 14, 82–93. doi:10.24057/2071-9388-2021-041
Liu, F., Olesen, K. B., Borregaard, A. R., and Vollertsen, J. (2019). Microplastics in urban and highway stormwater retention ponds. Sci. Total Environ. 671, 992–1000. doi:10.1016/j.scitotenv.2019.03.416
Liu, K., Courtene-Jones, W., Wang, X., Song, Z., Wei, N., and Li, D. (2020). Elucidating the vertical transport of microplastics in the water column: a review of sampling methodologies and distributions. Water Res. 186, 116403. doi:10.1016/j.watres.2020.116403
Löder, M. G., and Gerdts, G. (2015). Methodology used for the detection and identification of microplastics—a critical appraisal. Mar. Anthropog. litter, 201–227. doi:10.1007/978-3-319-16510-3_8
Lorenz, C., Dolven, J., Vaerøy, N., Stephansen, D., Olsen, S., and Vollertsen, J. (2020). Microplastic pollution in three rivers in south eastern Norway
Mani, T., and Burkardt-Holm, P. (2020). Seasonal microplastics variation in nival and pluvial stretches of the Rhine River – from the Swiss catchment towards the North Sea. Sci. Total Environ. 707, 135579. doi:10.1016/j.scitotenv.2019.135579
Mann, H. B., and Whitney, D. R. (1947). On a test of whether one of two random variables is stochastically larger than the other. Ann. Math. Statistics 18, 50–60. doi:10.1214/aoms/1177730491
Mason, S. A., Garneau, D., Sutton, R., Chu, Y., Ehmann, K., Barnes, J., et al. (2016). Microplastic pollution is widely detected in us municipal wastewater treatment plant effluent. Environ. Pollut. 218, 1045–1054. doi:10.1016/j.envpol.2016.08.056
Masura, J., Baker, J., Foster, G., and Arthur, C. (2015). Laboratory methods for the analysis of microplastics in the marine environment: recommendations for quantifying synthetic particles in waters and sediments. oceanbestpractices.
Mendrik, F., Fernández, R., Hackney, C. R., Waller, C., and Parsons, D. R. (2023). Non-buoyant microplastic settling velocity varies with biofilm growth and ambient water salinity. Commun. Earth and Environ. 4, 30. doi:10.1038/s43247-023-00690-z
Morgado, V., Gomes, L., da Silva, R. J. B., and Palma, C. (2022). Microplastics contamination in sediments from Portuguese inland waters: physical-chemical characterisation and distribution. Sci. Total Environ. 832, 155053. doi:10.1016/j.scitotenv.2022.155053
Mughini-Gras, L., van der Plaats, R. Q., van der Wielen, P. W., Bauerlein, P. S., and de Roda Husman, A. M. (2021). Riverine microplastic and microbial community compositions: a field study in The Netherlands. Water Res. 192, 116852. doi:10.1016/j.watres.2021.116852
Munari, C., Scoponi, M., Sfriso, A. A., Sfriso, A., Aiello, J., Casoni, E., et al. (2021). Temporal variation of floatable plastic particles in the largest Italian river, the po. Mar. Pollut. Bull. 171, 112805. doi:10.1016/j.marpolbul.2021.112805
Murphy, F., Ewins, C., Carbonnier, F., and Quinn, B. (2016). Wastewater treatment works (wwtw) as a source of microplastics in the aquatic environment. Environ. Sci. and Technol. 50, 5800–5808. doi:10.1021/acs.est.5b05416
Napper, I. E., and Thompson, R. C. (2016). Release of synthetic microplastic plastic fibres from domestic washing machines: effects of fabric type and washing conditions. Mar. Pollut. Bull. 112, 39–45. doi:10.1016/j.marpolbul.2016.09.025
Nizzetto, L., Futter, M., and Langaas, S. (2016). Are agricultural soils dumps for microplastics of urban origin? Environ. Sci. and Technol. 50, 10777–10779. doi:10.1021/acs.est.6b04140
Norén, F. (2007). Small plastic particles in coastal Swedish waters. Kimo Swed. 11, 1–11. doi:10.4236/jwarp.2020.121001
Obermaier, N., and Pistocci, A. (2022). A prliminary european-scale assessment of microplastics in urban wastewater. Front. Ebvironmental Sci. doi:10.3389/fenvs.2022.912323
Ory, N. C., Lehmann, A., Javidpour, J., Stöhr, R., Walls, G. L., and Clemmesen, C. (2020). Factors influencing the spatial and temporal distribution of microplastics at the sea surface - a year-long monitoring case study from the urban kiel fjord, southwest baltic sea. Sci. total Environ. 736, 139493. doi:10.1016/j.scitotenv.2020.139493
Oztekin, A., and Bat, L. (2017). Oztekin 2017. Turkish J. Fish. Aquatic Sci. 17. doi:10.4194/1303-2712-v17_6_37
Page, M. J., McKenzie, J. E., Bossuyt, P. M., Boutron, I., Hoffmann, T. C., Mulrow, C. D., et al. (2021). The prisma 2020 statement: an updated guideline for reporting systematic reviews. BMJ 372, n71. doi:10.1136/bmj.n71
Pakhomova, S., Berezina, A., Lusher, A. L., Zhdanov, I., Silvestrova, K., Zavialov, P., et al. (2022). Microplastic variability in subsurface water from the arctic to Antarctica. Environ. Pollut. (Barking, Essex 1987) 298, 118808. doi:10.1016/j.envpol.2022.118808
Parać, M., Cuculić, V., Cukrov, N., Geček, S., Lovrić, M., and Cukrov, N. (2022). Microplastic distribution through the salinity gradient in a stratified estuary. Water 14, 3255. doi:10.3390/w14203255
Pasquier, G., Doyen, P., Kazour, M., Dehaut, A., Diop, M., Duflos, G., et al. (2022). Manta net: the golden method for sampling surface water microplastics in aquatic environments. Front. Environ. Sci. 10. doi:10.3389/fenvs.2022.811112
Pedrotti, M. L., Lombard, F., Baudena, A., Galgani, F., Elineau, A., Petit, S., et al. (2022). An integrative assessment of the plastic debris load in the mediterranean sea. Sci. total Environ. 838, 155958. doi:10.1016/j.scitotenv.2022.155958
Piel, S., Atwood, E. C., Bochow, M., Imhof, H. K., franke, J., Siegert, F., et al. (2020). Can water constituents be used as proxy to map microplastic dispersal within transitional and coastal waters? Front. Environ. Sci. doi:10.3389/fenvs.2020.00092
Pilechi, A., Mohammadian, A., and Murphy, E. (2022). A numerical framework for modeling fate and transport of microplastics in inland and coastal waters. Mar. Pollut. Bull. 184, 114119. doi:10.1016/j.marpolbul.2022.114119
PlasticsEurope (2011). Plastics - the facts 2011. Available online at: https://plasticseurope.org/wp-content/uploads/2021/10/2011-Plastics-the-facts.pdf.
Pojar, I., Kochleus, C., Dierkes, G., Ehlers, S. M., Reifferscheid, G., and Stock, F. (2021). Quantitative and qualitative evaluation of plastic particles in surface waters of the western black sea. Environ. Pollut. (Barking, Essex 1987) 268, 115724. doi:10.1016/j.envpol.2020.115724
Poulain, M., Mercier, M. J., Brach, L., Martignac, M., Routaboul, C., Perez, E., et al. (2019). Small microplastics as a main contributor to plastic mass balance in the north atlantic subtropical gyre. Environ. Sci. and Technol. 53, 1157–1164. doi:10.1021/acs.est.8b05458
Prata, J. C., da Costa, J. P., Duarte, A. C., and Rocha-Santos, T. (2019). Methods for sampling and detection of microplastics in water and sediment: a critical review. TrAC Trends Anal. Chem. 110, 150–159. doi:10.1016/j.trac.2018.10.029
Primpke, S., Imhof, H., Piehl, S., Lorenz, C., Löder, M., Laforsch, C., et al. (2017). Mikroplastik in der umwelt. Chemie unserer Zeit 51, 402–412. doi:10.1002/ciuz.201700821
Razeghi, N., Hamidian, A. H., Wu, C., Zhang, Y., and Yang, M. (2021). Microplastic sampling techniques in freshwaters and sediments: a review. Environ. Chem. Lett. 19, 4225–4252. doi:10.1007/s10311-021-01227-6
Reinold, S., Herrera, A., Stile, N., Saliu, F., Hernández-González, C., Martinez, I., et al. (2021). An annual study on plastic accumulation in surface water and sediment cores from the coastline of tenerife (canary island, Spain). Mar. Pollut. Bull. 173, 113072. doi:10.1016/j.marpolbul.2021.113072
Reisser, J., Slat, B., Noble, K., Du Plessis, K., Epp, M., Proietti, M., et al. (2015). The vertical distribution of buoyant plastics at sea: an observational study in the north atlantic gyre. Biogeosciences 12, 1249–1256. doi:10.5194/bg-12-1249-2015
Rodrigues, M., Abrantes, N., Gonçalves, F., Nogueira, H., Marques, J., and Gonçalves, A. (2018). Spatial and temporal distribution of microplastics in water and sediments of a freshwater system (antuã river, Portugal). Sci. Total Environ. 633, 1549–1559. doi:10.1016/j.scitotenv.2018.03.233
Rodrigues, S. M., Almeida, C. M. R., Silva, D., Cunha, J., Antunes, C., Freitas, V., et al. (2019). Microplastic contamination in an urban estuary: abundance and distribution of microplastics and fish larvae in the douro estuary. Sci. total Environ. 659, 1071–1081. doi:10.1016/j.scitotenv.2018.12.273
Romano, E., Bergamin, L., Di Bella, L., Baini, M., Berto, D., D’Ambrosi, A., et al. (2023). First record of microplastic in the environmental matrices of a mediterranean marine cave (bue marino, sardinia, Italy). Mar. Pollut. Bull. 186, 114452. doi:10.1016/j.marpolbul.2022.114452
Roscher, L., Fehres, A., Reisel, L., Halbach, M., Scholz-Böttcher, B., Gerriets, M., et al. (2021). Microplastic pollution in the weser estuary and the German north sea. Environ. Pollut. (Barking, Essex 1987) 288, 117681. doi:10.1016/j.envpol.2021.117681
Rowley, k. H., Cucknell, A.-C., Smith, B. D., Clarc, P. F., and Morrit, D. (2020). London’s river of plastic: high levels of microplastics in the thames water column. Sci. Total Environ. 740, 140018. doi:10.1016/j.scitotenv.2020.140018
Ruiz-Orejón, L. F., Mourre, B., Sardá, R., Tintoré, J., and Ramis-Pujol, J. (2019). Quarterly variability of floating plastic debris in the marine protected area of the menorca channel (Spain). Environ. Pollut. (Barking, Essex 1987) 252, 1742–1754. doi:10.1016/j.envpol.2019.06.063
Russell, M., and Webster, L. (2021). Microplastics in sea surface waters around scotland. Mar. Pollut. Bull. 166, 112210. doi:10.1016/j.marpolbul.2021.112210
Scherer, C., Weber, A., Stock, F., Vurusic, S., Egerci, H., Kochleus, C., et al. (2020). Comparative assessment of microplastics in water and sediment of a large european river. Sci. Total Environ. 738, 139866. doi:10.1016/j.scitotenv.2020.139866
Schmidt, L. K., Bochow, M., Imhof, H. K., and Oswald, S. E. (2018a). Multi-temporal surveys for microplastic particles enabled by a novel and fast application of swir imaging spectroscopy–study of an urban watercourse traversing the city of berlin, Germany. Environ. Pollut. 239, 579–589. doi:10.1016/j.envpol.2018.03.097
Schmidt, N., Thibault, D., Galgani, F., Paluselli, A., and Sempéré, R. (2018b). Occurrence of microplastics in surface waters of the gulf of lion (nw mediterranean sea). Prog. Oceanogr. 163, 214–220. doi:10.1016/j.pocean.2017.11.010
Schrank, I., Löder, M. G., Imhof, H. K., Moses, S. R., Heß, M., Schwaiger, J., et al. (2022). Riverine microplastic contamination in southwest Germany: a large scale survey. Front. Earth Sci. 10. doi:10.3389/feart.2022.794250
Sekudewicz, I., Dabrowska, A. M., and Syczewski, M. D. (2021). Microplastic pollution in surface water and sediments in the urban section of the vistula river (Poland). Sci. Total Environ. 762, 143111. doi:10.1016/j.scitotenv.2020.143111
Shim, W. J., Hong, S. H., and Eo, S. E. (2017). Identification methods in microplastic analysis: a review. Anal. methods 9, 1384–1391. doi:10.1039/c6ay02558g
Sighicelli, M., Pietrelli, L., Lecce, F., Iannilli, V., Falconieri, M., Coscia, L., et al. (2018). Microplastic pollution in the surface waters of Italian Subalpine Lakes. Environ. Pollut. 236, 645–651. doi:10.1016/j.envpol.2018.02.008
Skalska, K., Ockelford, A., Ebdon, J. E., and Cundy, A. B. (2020). Riverine microplastics: behaviour, spatio-temporal variability, and recommendations for standardised sampling and monitoring. J. Water Process Eng. 38, 101600. doi:10.1016/j.jwpe.2020.101600
Stanton, T., Johnson, M., Nathanail, P., MacNaughtan, W., and Gomes, R. L. (2020). Freshwater microplastic concentrations vary through both space and time. Environ. Pollut. 263, 114481. doi:10.1016/j.envpol.2020.114481
Tamminga, M., Hengstmann, E., and Fischer, E. K. (2018). Microplastic analysis in the south funen archipelago, baltic sea, implementing manta trawling and bulk sampling. Mar. Pollut. Bull. 128, 601–608. doi:10.1016/j.marpolbul.2018.01.066
Tesán Onrubia, J. A., Djaoudi, K., Borgogno, F., Canuto, S., Angeletti, B., Besio, G., et al. (2021). Quantification of microplastics in north-western mediterranean harbors: seasonality and biofilm-related metallic contaminants. J. Mar. Sci. Eng. 9, 337. doi:10.3390/jmse9030337
Thompson, R. C., Olson, Y., Mitchell, R. P., Davis, A., Rowland, S. J., John, A. W. G., et al. (2004). Lost at sea: where is all the plastic? Science 304, 838. doi:10.1126/science.1094559
Tunçer, S., Artüz, O. B., Demirkol, M., and Artüz, M. L. (2018). First report of occurrence, distribution, and composition of microplastics in surface waters of the sea of marmara, Turkey. Mar. Pollut. Bull. 135, 283–289. doi:10.1016/j.marpolbul.2018.06.054
Urgert (2015). Microplastics in the rivers meuse and rhine. Open University of the Netherlands, Heerlen. Thesis.
Uurasjärvi, E., Hartikainen, S., Setälä, O., Lehtiniemi, M., and Koistinen, A. (2020). Microplastic concentrations, size distribution, and polymer types in the surface waters of a northern european lake. Water Environ. Res. a Res. Publ. Water Environ. Fed. 92, 149–156. doi:10.1002/wer.1229
Uurasjärvi, E., Pääkkönen, M., Setälä, O., Koistinen, A., and Lehtiniemi, M. (2021). Microplastics accumulate to thin layers in the stratified baltic sea. Environ. Pollut. (Barking, Essex 1987) 268, 115700. doi:10.1016/j.envpol.2020.115700
Vega-Moreno, D., Abaroa-Pérez, B., Rein-Loring, P. D., Presas-Navarro, C., Fraile-Nuez, E., and Machín, F. (2021). Distribution and transport of microplastics in the upper 1150 m of the water column at the eastern north atlantic subtropical gyre, canary islands, Spain. Sci. total Environ. 788, 147802. doi:10.1016/j.scitotenv.2021.147802
Vermaire, J. C., Pomeroy, C., Herczegh, S. M., Haggart, O., and Murphy, M. (2017). Microplastic abundance and distribution in the open water and sediment of the ottawa river, Canada, and its tributaries. FACETS 2, 301–314. doi:10.1139/facets-2016-0070
Virtanen, P., Gommers, R., Oliphant, T. E., Haberland, M., Reddy, T., Cournapeau, D., et al. (2020). SciPy 1.0: fundamental algorithms for scientific computing in Python. Nat. Methods 17, 261–272. doi:10.1038/s41592-019-0686-2
Wagner, S., Klöckner, P., Stier, B., Römer, M., Seiwert, B., Reemtsma, T., et al. (2019). Relationship between discharge and river plastic concentrations in a rural and an urban catchment. Environ. Sci. and Technol. 53, 10082–10091. doi:10.1021/acs.est.9b03048
Wakkaf, T., El Zrelli, R., Kedzierski, M., Balti, R., Shaiek, M., Mansour, L., et al. (2020). Characterization of microplastics in the surface waters of an urban lagoon (bizerte lagoon, southern mediterranean sea): composition, density, distribution, and influence of environmental factors. Mar. Pollut. Bull. 160, 111625. doi:10.1016/j.marpolbul.2020.111625
Wal, M. v. d., Meulen, M. v. d., Tweehuijsen, G., Peterlin, M., Palatinus, A., Virsek, M. K., et al. (2015). Identification and assessment of riverine input of (marine) litter. European Comission.
Winkler, A., Antonioli, D., Masseroni, A., Chiarcos, R., Laus, M., and Tremolada, P. (2022). Following the fate of microplastic in four abiotic and biotic matrices along the ticino river (north Italy). Sci. Total Environ. 823, 153638. doi:10.1016/j.scitotenv.2022.153638
Yildirim, G., Anindita, M., Pan, X., Rahman, S., Alim, M. A., Shaik, R., et al. (2024). Bibliometric insights into microplastic pollution in freshwater ecosystems. Water 16, 3237. doi:10.3390/w16223237
Zayen, A., Sayadi, S., Chevalier, C., Boukthir, M., Ben Ismail, S., and Tedetti, M. (2020). Microplastics in surface waters of the gulf of gabes, southern mediterranean sea: distribution, composition and influence of hydrodynamics. Estuar. Coast. Shelf Sci. 242, 106832. doi:10.1016/j.ecss.2020.106832
Zeri, C., Adamopoulou, A., Bojanić Varezić, D., Fortibuoni, T., Kovač Viršek, M., Kržan, A., et al. (2018). Floating plastics in adriatic waters (mediterranean sea): from the macro-to the micro-scale. Mar. Pollut. Bull. 136, 341–350. doi:10.1016/j.marpolbul.2018.09.016
Zhang, K., Hamidian, A. H., Tubić, A., Zhang, Y., Fang, J. K. H., Wu, C., et al. (2021). Understanding plastic degradation and microplastic formation in the environment: a review. Environ. Pollut. (Barking, Essex 1987) 274, 116554. doi:10.1016/j.envpol.2021.116554
Keywords: microplastics, meta-analysis, sampling methodology, aquatic environments, pollution, anthropogenic factors
Citation: Hartz L, Grabinski L and Salameh S (2025) Microplastic pollution in aquatic environments: a meta-analysis of influencing factors and methodological recommendations. Front. Environ. Sci. 13:1600570. doi: 10.3389/fenvs.2025.1600570
Received: 26 March 2025; Accepted: 16 May 2025;
Published: 27 May 2025.
Edited by:
Yalçın Tepe, Giresun University, TürkiyeReviewed by:
Seitkhan Azat, Satbayev University, KazakhstanGokhan Yildirim, Western Sydney University, Australia
Said Ali Akbar, Syiah Kuala University, Indonesia
Copyright © 2025 Hartz, Grabinski and Salameh. This is an open-access article distributed under the terms of the Creative Commons Attribution License (CC BY). The use, distribution or reproduction in other forums is permitted, provided the original author(s) and the copyright owner(s) are credited and that the original publication in this journal is cited, in accordance with accepted academic practice. No use, distribution or reproduction is permitted which does not comply with these terms.
*Correspondence: Linus Hartz, aGFydHoubGludXNAZmgtbXVlbnN0ZXIuZGU=
†These authors have contributed equally to this work